

Abstract
GABAergic neurons of the thalamic reticular nucleus (nRt) provide thalamocortical relay neurons with feedback inhibition that influences sensory processing and thalamocortical rhythm generation. Mutual interactions between reticular neurons coordinate oscillatory activities developed within the network during normal sleep and in absence epilepsy, but the chemical versus electrical nature of these connections and their functional influence remain controversial. Here, we investigated the incidence and spatial extent of intra-nRt connectivity in vitro in horizontal and coronal thalamic slices from rat. Laser scanning photostimulation activated presynaptic nRt cells during patch-clamp recordings of postsynaptic neurons. Photolysis of caged glutamate evoked GABAergic IPSCs and/or depolarizing events (spikelets, mediated via electrical coupling) in a large proportion of neurons, thus indicating connectivity with presynaptic cell(s). Synaptic inputs were organized along the major axis of the nucleus in the same orientation as, but commonly exceeding the extent of, dendritic arborization of the postsynaptic neuron. In the anteroposterior (horizontal) plane, chemical connectivity had higher incidence (60% of recorded neurons vs 40% in vertical plane) and longer spatial extent, whereas in the dorsoventral (vertical) plane, electrical coupling dominated (47% incidence vs 37% in horizontal plane) and was more widely distributed. These data demonstrate that both electrical and chemical synapses are prominent within nRt and suggest different roles for the two types of connections. We thus propose that, along the vertical plane, electrical connectivity will promote coordinated rhythmic activity of sleep and/or thalamocortical epilepsy, whereas along the horizontal plane, chemical connectivity will oppose widespread thalamocortical synchronization and modulate sensory throughput.
Keywords: thalamus, synaptic transmission, caged compound, electrophysiology, oscillations, neural networks
Introduction
Located between thalamus and cortex, the inhibitory thalamic reticular nucleus (nRt) plays key roles mediating selective attention (Montero, 2000; McAlonan et al., 2006), shaping sensory fields (Lee et al., 1994; Desilets-Roy et al., 2002; Hartings et al., 2003a), and generating neuronal rhythmic activities within the thalamocortical network (McCormick and Bal, 1997; Steriade et al., 1997). Relevant to these functions, nRt features (Pinault, 2004) include intrinsic membrane properties of the neurons [slow T-channel-mediated burst firing (Huguenard and Prince, 1992)], topographically organized reciprocal synaptic interconnections with excitatory thalamocortical cells (Jones, 1975), and mutual interactions between nRt cells mediated by chemical and/or electrical synapses (Landisman et al., 2002; Shu and McCormick, 2002; Long et al., 2004).
nRt is a thin shell nucleus surrounding the dorsal thalamus whose neurons are exclusively GABAergic (Houser et al., 1980; Spreafico et al., 1991; Guillery and Harting, 2003). Both thalamocortical and corticothalamic axons emit excitatory collaterals within nRt, and nRt cells send powerful reciprocal inhibitory projections to dorsal thalamic relay nuclei (Ohara, 1988; Pinault and Deschenes, 1998b). In addition, nRt cell axons give rise to sparse intranuclear collaterals generally not extending beyond the dendritic arborization of the cell (Scheibel and Scheibel, 1966; Yen et al., 1985; De Biasi et al., 1988; Uhlrich et al., 1991; Cox et al., 1996; Sanchez-Vives et al., 1997), suggesting the existence of chemical axodendritic and/or axosomatic synapses between reticular cells. Physiological investigations confirmed functional inhibitory GABAergic input onto nRt cells (Ahlsen and Lindstrom, 1982; Ulrich and Huguenard, 1995), at least some of which arises from within nRt (Sanchez-Vives et al., 1997; Shu and McCormick, 2002; Zhang and Jones, 2004; Lam and Sherman, 2005). Dendrodendritic contacts have also been proposed to mediate inhibitory synaptic interactions (Deschenes et al., 1985; Yen et al., 1985; De Biasi et al., 1986; Williamson et al., 1994; Pinault et al., 1997). In addition, reticular neurons are interconnected by electrical synapses through a mechanism dependent on connexin-36 (Landisman et al., 2002; Long et al., 2004), widely expressed in nRt (Liu and Jones, 2003).
Mutual inhibitory GABAergic synapses in nRt constrain synchronization in the thalamic circuit (Huntsman et al., 1999) and are proposed to prevent the switch from partially synchronous thalamocortical oscillations during normal sleep to hypersynchrony associated with absence epilepsy (Huguenard, 1999; McCormick and Contreras, 2001). In contrast, electrical coupling is expected to increase local synchrony within the nucleus (Landisman et al., 2002; Long et al., 2004). Although structural and indirect functional evidence for chemical and electrical coupling between reticular neurons exists, the incidence and extent of these synaptic contacts remain controversial (Wang and Rinzel, 1993; Pinault et al., 1995; Huntsman et al., 1999; Landisman et al., 2002; Shu and McCormick, 2002).
Here, we investigated functional connectivity between reticular neurons using a laser scanning photostimulation (LSPS). We demonstrate both chemical and electrical synapses between nRt neurons, each favored in different planes of the nucleus. The connectivity patterns suggest distinct roles for intra-nRt circuitry in sensory processing and thalamocortical oscillations through desynchronizing chemical inhibition or synchronizing electrotonic coupling.
Materials and Methods
In vitro slice preparation.
All experiments were performed according to protocols approved by the Stanford Institutional Animal Care and Use Committee. Sprague Dawley rats [postnatal day 12 (P12) to P15] were anesthetized with pentobarbital (50 mg/kg) and decapitated, and the brains were rapidly removed and immersed in an ice-cold (4°C) slicing solution containing the following (in mm): 234 sucrose, 2.5 KCl, 1.25 NaH2PO4, 10 MgSO4, 0.5 CaCl2, 26 NaHCO3, and 11 glucose (equilibrated with 95% O2 and 5% CO2), pH 7.4. Horizontal or coronal thalamic slices (300 μm) containing the thalamic ventrobasal complex (VB) and reticular nucleus were cut with a Lancer Series 1000 vibratome (Vibratome, St. Louis, MO). The slices were incubated, initially at 32°C for 1 h and then at room temperature, in artificial CSF (ACSF) containing the following (in mm): 126 NaCl, 2.5 KCl, 1.25 NaH2PO4, 2 MgCl2, 2 CaCl2, 26 NaHCO3, and 10 glucose (equilibrated with 95% O2 and 5% CO2), pH 7.4.
P12–P15 thalamic slices support network activities proposed to be relevant for sleep spindle oscillations (Huguenard and Prince, 1994; Jacobsen et al., 2001; Sohal and Huguenard, 2003) and for hypersynchronous epileptiform responses relevant to thalamocortical epilepsy (Huguenard and Prince, 1994; Cox et al., 1997; Jacobsen et al., 2001; Sohal and Huguenard, 2003). Although the rodent thalamocortical circuit has only partially matured by 2 weeks of age, the major functional connections are already established (Warren and Jones, 1997), and modulation of inhibitory connections by benzodiazepine is intact (Browne et al., 2001). Furthermore, at this developmental stage, inhibitory synaptic responses between nRt cells are functionally mature (Huntsman and Huguenard, 2000), and thalamic epileptiform oscillations are suppressed by specific augmentation of intra-nRt inhibitory connections via benzodiazepines in mice with mutant GABAA receptors (Sohal et al., 2003). Potential developmental changes in intra-nRt connectivity will be the subject of another study.
Electrophysiology.
Slices were transferred to a recording chamber superfused with ACSF. Recordings were obtained from thalamic reticular neurons visually identified using differential contrast optics with a Zeiss (Oberkochen, Germany) Axioskop microscope and an infrared video camera. Furthermore, the identity of each neuron was confirmed physiologically through depolarizing voltage-clamp steps to −40 mV, which triggered well clamped transient inward calcium (T-type) currents with inactivation time constants >50 ms (Huguenard and Prince, 1992). Moreover, in many cases, cells were filled with biocytin and processed for subsequent morphological identification and analysis.
Experiments were performed in the whole-cell configuration using the patch-clamp technique. Electrodes were pulled from borosilicate glass capillaries and had a tip resistance of 2–3 MΩ when filled with the internal solution. During voltage-clamp recordings, the intracellular solution contained the following (in mm): 125 Cs-gluconate, 1 CaCl2, 10 HEPES, 10 EGTA, 4 Mg-ATP, 0.3 Na-GTP, and 5 QX314 [N-(2,6-dimethylphenylcarbamoylmethyl)triethylammonium bromide], pH 7.3 adjusted with CsOH (290 mOsm). During current-clamp experiments and their corresponding voltage-clamp recordings, the pipette solution contained the following (in mm): 130 K-gluconate, 1 CaCl2, 10 HEPES, 10 EGTA, 4 Mg-ATP, and 0.3 Na-GTP, pH 7.3 adjusted with KOH (290 mOsm). In all cases, the estimated ECl was more negative than −90 mV based on the Nernst equation. A liquid junction potential (LJP) of ∼17 mV was estimated based on the LJP calculator in Clampex (Molecular Devices, Sunnyvale, CA). Recordings were performed with holding potentials set slightly negative to the reversal potential for glutamatergic receptors (approximately +17 mV, after LJP) in the range of 0 to +10 mV to simultaneously detect and distinguish activation of GABAA (outward currents) from glutamate (inward currents) receptors. When indicated, SR95531 [6-imino-3-(4-methoxyphenyl)-1(6H)-pyridazinebutanoic acid hydrobromide], (gabazine, 10 μm; Tocris Cookson, Ellisville, MO) was added to the bath perfusion to block GABAA receptors.
Signals were amplified with an Axopatch 200A amplifier (Molecular Devices), sampled, and low-pass filtered at 10 and 2 kHz (unless otherwise noted), respectively, during voltage-clamp recordings and at 20 and 10 kHz, respectively, during current-clamp recordings. A Digidata 1320 digitizer (Molecular Devices) and pClamp9 (Molecular Devices) were used for data acquisition and analysis. The access resistance was constantly monitored, and only cells with an access resistance <25 MΩ and without significant changes (<25%) during the entire recording were considered for additional data analysis. In addition, adequacy of voltage clamp was demonstrated by T-current steady-state inactivation protocols in which peak latencies remained constant after voltage-clamp steps to −40 mV from a range of hyperpolarizing conditioning potential that evoked currents with peak amplitudes ranging from 20 to 500 pA.
Photostimulation and mapping.
A laser scanning photostimulation setup was built according to the principles from Tsai et al. (2002) (see also Shepherd and Svoboda, 2005; Jin et al., 2006). Briefly, a pulsed UV laser (355 nm wavelength; frequency-tripled Nd:YVO4; 100 kHz pulse rate; DPSS Lasers, San Jose, CA) was directed into the epifluorescence port of the microscope through a set of mirrors and lenses, onto a dichroic mirror, and into the back aperture of a 5× objective (Fluar 5×/0.25; Zeiss). The position of the laser beam was controlled with mirror galvanometers (model 6210; Cambridge Technology, Cambridge, MA), and scanning and data acquisition were controlled by locally written software. At the beginning of the experiment, 4-methoxy-7-nitroindolinyl-caged l-glutamate (Tocris Cookson) was added to recirculating ACSF to a final concentration of 30 μm, together with 25 μm d-AP-5 (Tocris Cookson) to block NMDA receptors and reduce slow glutamatergic depolarization and polysynaptic activation. Mapping was performed with a 5× objective lens. Laser output (power 50–100 mW) was electronically and mechanically shuttered to give 200–400 μs flashes (consisting of 20–40 pulses) that triggered the subsequent focal photolysis of caged glutamate. Photostimulation (flash) was delivered to different locations (spots) within nRt on a two-dimensional grid with 20–50 (normally 25) μm spacing between adjacent rows and columns. When possible, the grid dimensions were set to be sufficiently large to obtain completely inclusive maps, i.e., those that included a complete and continuous nonresponsive surround. When necessary, partial maps were performed separately and combined into a composite map for data analysis. The mapping was performed in a pseudorandom pattern that minimized the spatial proximity of consecutive uncaging sites. The interval between flashes was 3 s. To obtain a complete map, typically >400 spots were stimulated in each of three consecutive trials, thus requiring 1 h or more of stable recording per neuron. Long-term stability was improved by maintaining the slice in the recording chamber at room temperature (24 ± 1°C) compared with physiological temperatures (34–37°C), and thus we performed these experiments in the former condition.
nRt is arc shaped in both horizontal and coronal sections. Thus, although the slices were always positioned with the same orientation in the recording chamber, the dimensions and inclination of the nucleus varied. Therefore, we adjusted the pattern of stimulation to the morphology of the nucleus in each individual slice and then rotated the derived maps after recording as necessary to obtain population data (see below, Representation and spatial extent of the maps).
Immunohistochemistry and morphological reconstruction.
During some electrophysiological experiments, nRt cells were filled with 0.3% biocytin (Sigma, St. Louis, MO) included in the internal solution. At the end of the recordings, whole slices (300 μm) were then fixed and processed with the standard avidin–biotin peroxidase method (Horikawa and Armstrong, 1988; Tseng et al., 1991) or immunofluorescent staining. In addition, in some cases, sections were costained for parvalbumin (polyclonal antibody; gift from K. Baimbridge, University of British Columbia, Vancouver, Canada) and neuron-specific nuclear protein (NeuN) (monoclonal antibody; Chemicon, Temecula, CA) immunoreactivity. Labeled neurons were examined under light or confocal microscopy under a 20× objective to verify their morphology and location, and the images were subsequently used to reconstruct the dendritic arborization (Neurolucida; MicroBrightField, Williston, VT).
Electrophysiological data analysis.
Three types of responses were evoked by glutamate uncaging: direct activation, IPSCs, and spikelets. These were easily distinguishable from each other based on their amplitudes and kinetics. Directly activated responses were inward currents with slow rising (∼5 ms) and decaying (100–200 ms) phases. Synaptic currents were outward events with rapid onset (<2 ms) and slow decay (50–200 ms). Spikelets were inward currents, presumed manifestations of action potentials (APs) in one or more neurons that were electrically coupled to the recorded neuron. The term “spikelets” has been used in previous current-clamp studies of electrical coupling between nRt cells (Landisman et al., 2002; Long et al., 2004). We use the same term here to refer to equivalent events recorded in voltage-clamp mode. Spikelets were very brief (∼1 ms duration) V-shaped inward currents and normally quite small (<20 pA). Direct activation of the recorded neuron was quantified by determining the “peak amplitude” measured within 10 ms of the uncaging stimulus, a time in which direct responses were uncontaminated by triggered postsynaptic currents (cf. Jin et al., 2006). IPSCs and spikelets were detected with Wdetecta, a postsynaptic current detection program (http://huguenardlab.stanford.edu/apps/wdetecta). Once the detection parameters (primarily differentiation window and amplitude threshold) were adjusted and tested, the program automatically and accurately detected and analyzed synaptic events. Separate runs of the program, each with distinct detection parameters, were used to sequentially detect and quantify first IPSCs and then spikelets, within the same 200 ms “triggered window” after glutamate uncaging, in each individual recording trace. The following parameters were used for quantification: (1) “cumulative amplitude” of IPSCs, corresponding to the sum of the peak amplitudes of all individual events detected (2) “total number” of spikelets. Before mapping, the frequency of spontaneous events was routinely determined with a mean value of 0.92 ± 0.09 (n = 64). Based on that, we calculated a probability of 0.184 that a spontaneous event occurred during a 200 ms time window. Typically, 1–15 IPSCs were evoked during the triggered period; thus, little contamination of the synaptic map by spontaneous events is expected, and any such contamination was further minimized by averaging multiple maps whenever possible.
Representation and spatial extent of the maps.
Each parameter (IPSCs, spikelets, and direct activation) derived from the data analysis was related to x–y coordinates corresponding to the distance between the position of the recorded cell and the site of glutamate uncaging. In general, a 25 μm grid spacing was used. To combine and compare these and other maps in which slightly different spacing was used, two-dimensional mapping data were rebinned at 25 μm. The resulting maps were then displayed on a pseudocolor scale, which provided information about the orientation and the extent of direct activation and synaptic connectivity for individual neurons. When the photostimulation pattern was repeated, individual trials as well as the average were color coded, but only the mean value was considered for statistical analysis. Comparison of individual trial maps was used to test the consistency of the evoked responses.
Some analyses (e.g., map extent) were performed only for those cells with complete mapping. For additional statistical analysis on this population of cells, data were normalized to the maximal response and the orientation of the maps rotated so that the major axis was oriented vertically (90°). The major axis angle was calculated from the direct response map as follows: (1) the center of mass was calculated for each map row, (2) center of mass values were then used to calculate a linear least-squares regression line, in which each point was weighted by the cumulative row response, and (3) the major axis angle was then determined from the slope of the weighted least-squares regression line. All three maps (direct activation, IPSCs, and spikelets) were rotated by the amount required to bring the direct response maps to vertical. The extents of the corresponding maps along the major and minor (normal to the major axis) axes were then calculated. Normalized data from individual columns and rows were averaged, and the mean ± SEM values were plotted as a function of the x or y distance, respectively. We then measured the 80% widths (the linear extent from which responses >20% of the maximal were obtained) of these Gaussian x and y profiles and used them as quantitative values of the width (x-axis) and length (y-axis) of individual maps.
As a visual tool to compare spatial extent of direct activation and synaptic connectivity, colored maps were overlaid with contour lines delimiting either the “minimum direct activation” area, in which glutamatergic depolarization produced action potentials in the presynaptic cell, or 20% or larger of the maximal synaptic response (80% footprint) for IPSCs and spikelets. Control experiments (n = 6) allowed us to estimate that the threshold stimulus required to induce spiking in nRt cells (in current clamp) corresponded to ∼175 pA glutamatergic current at −70 mV (as measured in voltage clamp). Moreover, the voltage dependence of glutamate receptor activation indicated that the direct glutamatergic response was linear (n = 21; data not shown), thus allowing a calculation of equivalent minimum direct activation currents at a variety of membrane potentials. Therefore, −175 pA at −70 mV corresponded to −42 pA at 0 mV and −14 pA currents at +10 mV, and the minimum direct activation contours were drawn at these levels.
Statistical analysis.
Results are presented as mean ± SEM. Independent Student’s t test was used to compare data obtained in horizontal versus coronal slices. χ2 test of independence is used to compare data expressed in percentage of cell population. Differences were considered significant when p < 0.05.
Results
Before studying intra-nRt connectivity at high resolution using laser scanning photostimulation, we initially used local perfusion of glutamate receptor agonists to perform coarse mapping and determine a region of interest for subsequent studies. For these experiments, individual postsynaptic neurons were recorded in voltage clamp, whereas presynaptic cells within 100 μm cross-sectional zones of nRt were activated in a linear pattern by focal NMDA application (supplemental Fig. 1, available at www.jneurosci.org as supplemental material). As in ferret nRt (Shu and McCormick, 2002) and related perigeniculate nucleus (PGN) (Sanchez-Vives et al., 1997), glutamatergic activation of presynaptic nRt cells triggered GABAergic IPSCs in recorded postsynaptic neurons (supplemental Fig. 1B,C, available at www.jneurosci.org as supplemental material). The spatial profile of inhibitory synaptic connectivity extended for several 100 μm in both anteroposterior (horizontal slices) and dorsoventral (coronal slices) planes. Connectivity half-widths were 390 ± 42 μm in horizontal slices (in 13 of 24 nRt cells displaying triggered IPSCs) and 228 ± 32 μm in coronal slices (n = 13 of 28 cells) (supplemental Fig. 2D, available at www.jneurosci.org as supplemental material). In addition to triggering GABAergic IPSCs, glutamate receptor activation also evoked transient responses having the appearance of miniature inverted spikes. These spikelets occurred in clusters (supplemental Figs. 1C, 2B2,C, available at www.jneurosci.org as supplemental material), consistent with repetitive action potential generation in one or more electrically connected presynaptic cells. Additional characterization of the spikelets will be described below. Half-widths for electrotonic (spikelet) synaptic maps were 362 ± 30 μm in horizontal slices (in 9 of 24 nRt cells displaying triggered spikelets) and 275 ± 31 μm in coronal slices (n = 13 of 28 cells) (supplemental Fig. 2D, available at www.jneurosci.org as supplemental material). We found little evidence for connectivity beyond 400 μm from the recorded cells. Based on these initial data, we investigated at high resolution the connectivity of individual nRt cells within this region via LSPS.
Spatial resolution and properties of photostimulation
The laser scanning photostimulation approach to synaptic mapping requires that uncaged glutamate produces AP firing in presynaptic cell(s). The ability of a cell to fire APs depends on several parameters, including the spatiotemporal properties of the laser (intensity, beam diameter, and exposure duration), the resultant glutamate profile (peak concentration, rise time, and decay), as well as intrinsic properties of the neurons. Therefore, it is critical to first determine the spatial distribution of sites from which uncaged glutamate elicits APs in a given neuron. This excitation profile defines the effective resolution for mapping the location(s) of the presynaptic neurons that contribute to the postsynaptic responses in the recorded neuron (Shepherd et al., 2003; Bureau et al., 2004; Shepherd and Svoboda, 2005). Thus, we recorded from nRt cells in current-clamp mode while performing LSPS (Fig. 1, top panels). In some cases, the same LSPS pattern was repeated during voltage-clamp recordings of the same cell to provide a comparison of the direct response required to induce APs. Typically only one to four spots (mean of 2.7 ± 0.4 spots; n = 7) on each LSPS grid (25 μm spacing) induced spiking in an unclamped resting nRt neuron. AP firing in nRt cells typically consisted of a burst of 5–20 spikes (mean of 14.4 ± 1.1 spikes; n = 19 spots on n = 7 cells), as expected from expression of T-type calcium channels in these cells and their relatively negative resting potential at rest in vitro (Huguenard and Prince, 1992, 1994).
Figure 1.
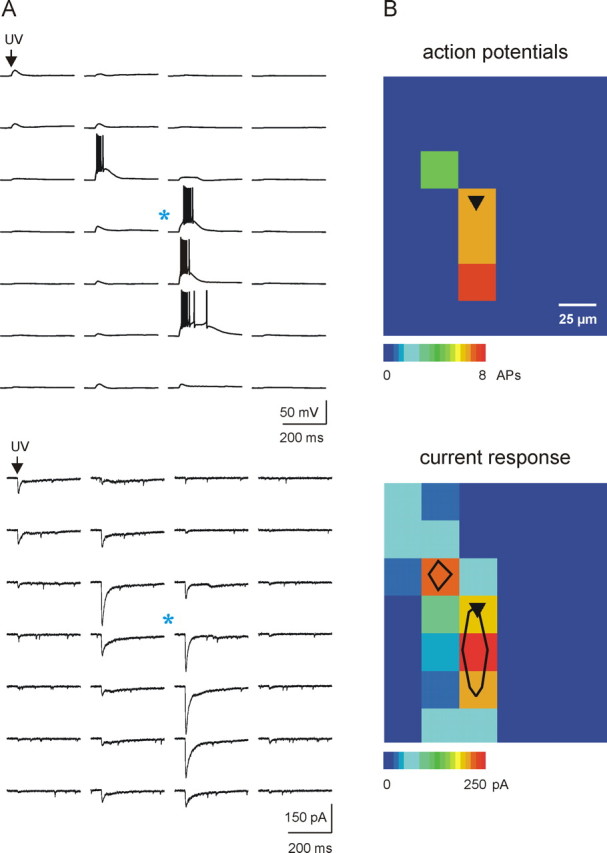
Mapping resolution of laser scanning photostimulation in nRt. A, Current-clamp (top) and voltage-clamp (bottom) recordings demonstrating the spatial distribution of direct glutamatergic activation of the same postsynaptic cell (soma location indicated by blue asterisk). Action potentials were elicited from only four spots on the map, and they occurred with latencies up to 200 ms from the onset of uncaging stimulus. When the same cell was voltage clamped at −70 mV, the same pattern of stimulation induced detectable depolarizing currents over a much larger spatial extent (bottom). B, Pseudocolor map (scale at bottom) representing the number of action potentials (top, current clamp) and the peak amplitude of the direct glutamatergic current response (bottom, voltage clamp), respectively. Comparison of current-clamp and voltage-clamp maps indicated that only those stimuli that triggered direct responses >175 pA were capable of triggering action potentials from the same cell at resting membrane potential. The black contours on the voltage-clamp pseudocolor map (bottom) are overlays indicating this region of minimum direct activation (>175 pA; see Materials and Methods), which defines the approximate mapping resolution of our experiments, typically 50 μm.
Although direct inward current responses could be obtained in a large ellipsoid region (∼250 × 100 μm) surrounding each nRt somata, the largest currents from which spikes could be elicited (minimum direct activation zone; see Materials and Methods) were typically obtained in a restricted region within 50 μm of the soma (Fig. 1, bottom panels). The inward current responses obtained in voltage clamp were attributable to direct activation of postsynaptic glutamate receptors, because they were unaffected by antagonists of GABAA receptors (gabazine, 10 μm; n = 10) (see Fig. 3) (supplemental Fig. 2B1, available at www.jneurosci.org as supplemental material) or sodium channels (tetrodotoxin, 1 μm; n = 5) (supplemental Fig. 2A1, available at www.jneurosci.org as supplemental material). Thus, the direct responses reflect the extent of the recorded neuron that contains glutamate receptors, which primarily overlaps with the somatodendritic extent of the neuron as confirmed by morphological reconstructions of biocytin-filled neurons (see Fig. 5).
Figure 3.

Mapping of GABAergic synaptic connectivity in a horizontal slice. A, Representative maps of direct activation and inhibitory synaptic connectivity of an nRt cell recorded at 0 mV (left panels, somatic location indicated by black triangle). Color scale represents the peak amplitude of glutamatergic depolarization or cumulative peak amplitude of IPSCs detected within the triggered time window, during a single trial of the photostimulation pattern. Note that the extent of synaptic connectivity is longer (in the vertical axis) than the direct activation (left panels). IPSCs are completely abolished by the GABAA receptor antagonist (gabazine, 10 μm), whereas direct activation is essentially unaffected (right panels). B, Corresponding responses of the same grid as in A, each shown during a period between −25 and +200 ms of the uncaging stimulus. Spots indicated by red numerals 1–6 are expanded and shown on the right in control (black) and in the presence of gabazine (gray). Inward currents result from the direct activation of postsynaptic glutamate receptors, and outward currents reflect IPSCs. At some uncaging sites, direct activation and IPSCs could both be triggered but with different latencies (e.g., 1 and 5), whereas only IPSCs were evoked at other locations (2–4). Far from the soma (6, soma indicated by blue asterisk), both responses were absent.
Figure 5.

Correlation between mapping and morphology. A, Image of a biocytin-filled nRt cell processed with DAB in a fixed horizontal slice (left) and the corresponding live image during recording (holding potential at +10 mV), overlaid with the photostimulation pattern and the reconstituted morphology of the cell (right). IPSCs and spikelets were both evoked in this cell. Maps illustrating the average of three trials are represented on the bottom row and merged with the recovered and traced cell. Although the three maps have different spatial profiles, they share the same general orientation along the major axis of the nucleus. The somatodendritic region of the cell overlaps almost completely with the extent of direct activation, whereas IPSC and spikelet map extents are longer and shorter, respectively. St, Striatum. B, Left, Confocal image of a biocytin-filled nRt cell conjugated with fluorescein (green) in a coronal slice. Neuronal cell bodies are visualized by immunofluorescent labeling of NeuN (blue), whereas the specific identification of nRt cells is confirmed by immunoreactivity for parvalbumin (red, which combined with the blue NeuN staining yields pink). Right image and color maps, Same as in A, but with maps representing a single trial in which only spikelets, but not IPSCs, were triggered throughout the mediolateral extent of nRt. The internal capsule (IC; dark region in bottom left corner of top panels), which contains only axonal fibers and not neuronal cell bodies (no NeuN staining), was completely silent in these maps (dark blue in color maps), demonstrating that the uncaging stimuli only evoke responses when somatodendritic regions of nRt cells are activated. As in horizontal slices, the major axis angles of both direct and electrical coupling maps have the same orientation along the long axis of nRt.
Consistency of the photostimulation was routinely validated by recording responses evoked on a given spot by repeated glutamate uncaging delivered at 10 s intervals. Both current-clamp and voltage-clamp responses were stable. These data also demonstrate that the direct photostimulation evoked action potentials in a maximal time window of 200 ms (Fig. 1A).
nRt cells received synaptic inputs mediated via chemical and electrical connections
Three types of currents were evoked in voltage-clamped nRt cells in response to glutamate uncaging (Fig. 2). The first type of current was activated with a short latency and peaked within 5 ms after photostimulation. This current was inward at negative potential and reversed at approximately +15 mV (Fig. 2A, inset), close to the theoretical reversal potential for glutamate receptors (see Materials and Methods), suggesting a direct activation of postsynaptic glutamate receptors on the recorded cell. The second type of response were multiple outward currents (Fig. 2A, *), each with rapid onset and slow decay that were activated at variable latencies (10–200 ms) from the uncaging stimulus. This is the same range of action potential latencies observed in unclamped nRt cells (Fig. 1A). These events had very negative reversal potential (more than −90 mV), as expected for Cl−-mediated events under our conditions, and were completely antagonized by gabazine, a GABAA receptor blocker (Figs. 2C, 3) supplemental Fig. 2B, available at www.jneurosci.org as supplemental material). We therefore identified these secondary responses as IPSCs mediated via GABA release from active presynaptic cells. A third form of response induced by glutamate uncaging was spikelets. Spikelets, as indicated previously, were small V-shaped inward currents activated at variable latencies from the stimulus and occurred in clusters. Spikelets were distinct from direct inward currents induced by uncaged glutamate because their amplitudes did not vary or invert as a function of membrane potential (Fig. 2A,B) (supplemental Fig. 2C, available at www.jneurosci.org as supplemental material) and were not affected by gabazine (Fig. 2C) (supplemental Fig. 2B2, available at www.jneurosci.org as supplemental material). These properties together with the persistence of spikelets during blockade of postsynaptic Na+ channel-dependent electrogenesis by the quaternary amine lidocaine derivative QX314 in the patch pipette indicated that these brief depolarizing synaptic events were attributable to glutamate-triggered action potentials in presynaptic cells. Such presynaptic action potentials would then evoke transient inward currents reflecting current flow through presumed gap-junction-mediated electrotonic synapses between the presynaptic and postsynaptic cells. Accordingly, using the local perfusion system, we showed that evoked IPSCs (n = 2) and spikelets (n = 2) were abolished in the presence of TTX, indicating that both were dependent on (presynaptic) action potentials. Spontaneous miniature IPSCs were unaffected (n = 7) (supplemental Figs. 1C, 2C, available at www.jneurosci.org as supplemental material). Moreover, carbenoxolone, a blocker of gap junction, specifically abolished the spikelets, leaving IPSCs unaffected (n = 4) (supplemental Fig. 1C, inset, available at www.jneurosci.org as supplemental material).
Figure 2.

Characterization of the three types of response evoked by photostimulation. A, Recordings of the three response types evoked by photostimulation on the same site, illustrating an example in which postsynaptic nRt neurons received both chemical and electrical synapses from presynaptic neurons. Direct activation of postsynaptic glutamatergic receptors (red arrows) is reflected by a short-latency, slow current that peaked ∼5 ms after glutamate uncaging (UV laser flash indicated by black arrow). Response at 0 mV (bottom trace) is inward, whereas that at +18 mV is outward, with a reversal potential near +15 mV. At +18 mV, the composite outward current includes the direct glutamate response (red arrow) and individual outward IPSCs (indicated by red asterisks) evoked at variable (∼25–120 ms) latencies from the uncaging stimulus (UV). In contrast to the direct responses, IPSCs remain outward at both +18 and 0 mV. Small, brief V-shaped inward currents (indicated by red bars) are spikelets, reflecting action potential firing in one or more electrically coupled presynaptic cells. Triggered IPSCs (red asterisks) occur consistently within a 200 ms window (+18 vs 0 mV traces), whereas spontaneous events (blue asterisks) occur at random times outside this window. Inset depicts early triggered responses at higher time resolution and illustrates detection of each individual spikelet and IPSC as well as the direct responses (initial portion indicated by shaded gray regions). B, Spikelets are inward currents whose amplitudes are independent of holding potential. Depolarization of an nRt cell reduces (−10 mV) and abolishes (+14 mV) the direct glutamate response, whereas the spikelets remain fixed in amplitude. Note that spike number and latency changed as a function of holding potential, likely reflecting a small electrotonic depolarization of the presynaptic cell. C, IPSCs but not spikelets are abolished by 10 μm gabazine, the GABAA receptor blocker (bottom).
Unexpectedly, the pattern of evoked spikelets was influenced by changes in postsynaptic membrane potential (Fig. 2). This effect appeared to be attributable to tonic polarization of presynaptic neurons through gap junctions. Electrotonic connectivity within nRt has been demonstrated via paired whole-cell recordings in mouse and rat nRt (Landisman et al., 2002; Long et al., 2004). These authors demonstrated that electrotonic coupling is bidirectional, with coupling ratios between nRt cells ranging from 0.05 to 0.35. Thus, in voltage clamp, depolarization of the recorded postsynaptic cell will result in secondary depolarization of up to one-third of the magnitude in presynaptic cells. In separate experiments (n = 6; data not shown), we determined the relationship between resting potential and action potentials evoked by glutamate uncaging on the soma of the recorded cell and found it to be nonlinear, in which membrane hyperpolarization could increase and depolarization could decrease the number of spikes through effects on T-type calcium channel-dependent burst responses (Huguenard and Prince, 1994; Cox et al., 1997). Accordingly, in nRt cells with evoked spikelets, depolarization of the postsynaptic cell resulted in spikelet responses that were delayed and less intense. In the example shown in Figure 2B, at a holding potential of 0 mV, glutamate uncaging evokes a short-latency cluster of 12 spikelets with a high-frequency (up to 200 Hz) accelerando–decellerando firing pattern characteristic of rat nRt cell burst firing (Hartings et al., 2003a). Depolarization of this postsynaptic neuron by 14 mV resulted in a delayed firing response, with fewer (10) spikelets occurring over an extended period of time. The most likely interpretation of this result is that an electrically connected presynaptic neuron was depolarized via gap junctions through increased current from the postsynaptic neuron, which resulted in partial T-channel inactivation and a less robust (fewer, delayed spikes and lower intraburst frequencies) Ca2+-dependent burst response. Similar effects of postsynaptic membrane potential change on spikelet firing patterns were seen in 23 of 27 neurons tested.
Mapping of the synaptic connectivity within nRt
We mapped the direct activation and synaptic connectivity of a total of 70 cells in horizontal [n = 43 (example in Fig. 3)] or coronal [n = 27 (example in Fig. 4)] thalamic slices from P12–P15 rats. The pattern of stimulation was designed as described in Materials and Methods, and the traces recorded on each spot were analyzed during the triggered time window (200 ms after glutamate uncaging) to detect evoked responses. To minimize the influence of spontaneous activity on the resultant synaptic maps, repeated maps were recorded and averaged. In general, the direct responses were highly reproducible from trial to trial, whereas those dependent on activation of presynaptic neurons were more variable. Moreover, the probability that spontaneous IPSCs occurred during a 200 ms time window was low [∼0.2 events (see Materials and Methods and traces in Fig. 3B)]. Finally, although glutamate uncaging could also activate the trisynaptic nRt → VB → nRt → nRt loop, any events evoked within this pathway were unlikely to occur at room temperature within the 200 ms trigger period (Bal et al., 1995).
Figure 4.
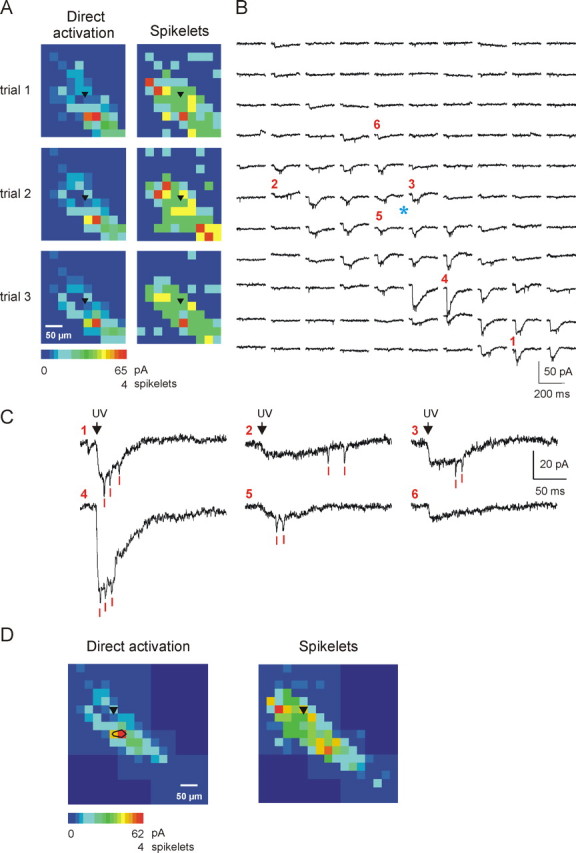
Mapping of electrical coupling in a coronal section. A, Representative example showing three successive trials of the same photostimulation pattern that triggered direct activation and electrotonic synaptic responses in an nRt cell recorded at 0 mV (location of soma indicated by black triangle). Responses are shown on a pseudocolor scale as in previous figures. Note that direct, and to a lesser extent spikelet, maps are quite reproducible between trials. B, Responses recorded in trial 3. The blue asterisk identifies the location of the recorded cell, and the red numbers indicate spots with traces shown at a larger scale in C. Direct activation of glutamate receptors results in rapid onset and slowly decaying (total duration ∼100 ms) inward currents, as well as small, brief depolarizing spikelet events (red bars). The two types of responses were commonly evoked together (1, 3, 4) but also alone (6) or spikelets emerging on the top of a small and slowly rising inward current (2, 5, possibly reflecting electrotonic coupling of direct glutamate response in presynaptic neurons). Note the variable latency of spikelets compared with the relatively fixed latency of the direct responses. D, Composite map for the same cell, obtained by combination of several different individual maps. Note that each map (direct and spikelet) is complete, as judged by a continuous surround (dark blue on the color scale) from which no response could be obtained. Maps reflect the average responses of three consecutive trials. Deep blue represents unmapped regions. Black contour on the left map represents region of minimum direct activation (see Materials and Methods). Note that the extent of electrical coupling is both longer and wider than that of direct activation. In this example, signals were low-pass filtered at 1 kHz.
Mapping derived from horizontal and coronal slices were initially combined and analyzed together. Direct activation was consistently evoked in every recorded cell, whereas IPSCs and spikelets were triggered only in a subset of cells connected with presynaptic nRt neurons. Within the overall population of nRt cells, 75.7% (53 of 70 cells) received synaptic inputs from other nRt cell(s) via either chemical or electrical connections, whereas the remaining 24.3% (17 of 70 cells) failed to show any synaptic connectivity. Among those 53 connected cells, IPSCs and spikelets were evoked in 36 cells (67.9%) and 29 cells (54.7%), respectively, sometimes in combination. Twenty-four cells (45.3%) were connected exclusively via chemical synapses, whereas 17 cells (32.1%) were exclusively electrically coupled, and 12 cells (22.6%) received both chemical and electrical inputs.
As an indication of the spatial influence of the connectivity, the intensity of each type of evoked response (direct activation, IPSCs, and spikelets) was represented on pseudocolor maps. For individual cells, synaptic input maps were systematically compared with those of direct activation. From this analysis, it was quite common that the spatial extent of synaptic inputs would exceed that of direct activation of the recorded cell (see Figs. 3A, 4A,D, 5A,B, 8A). Moreover, both direct and synaptic maps tended to be aligned along a transverse axis of the nucleus (Fig. 5A,B) and mostly restricted to the same mediolateral portion of nRt containing the soma. nRt is topographically organized along the mediolateral axis with three divisions (lateral, central, and medial tiers), each interconnected with a specific thalamic relay nucleus (Crabtree, 1996). This suggests that intra-nRt connections primarily mediate communication within functionally related tiers of nRt.
Figure 8.

Spatial influence of chemical and electrical connectivity. A, Representative example of statistical analysis performed to quantify the spatial extent of connectivity. The original maps for this cell were combined into a composite map, normalized to the maximal response, and rotated by −11° to align the major axis angle to vertical. The black contour line delimits the area of minimum direct activation, and the white contour line on the IPSCs map represents the 80% footprint of synaptic responses (see Materials and Methods). Deep blue represents unmapped regions. Data from individual rows and columns were then averaged, the mean ± SEM values were plotted as a function of distance, and the 80% width (x distance, blue double-headed arrow) and 80% length (y distance, red double-headed arrow) were used to quantify the extent of individual maps. B, Statistical analysis (mean ± SEM) for minimal direct activation (min dir) along the major and minor axis angles of nRt cells. No differences were observed between neurons in horizontal versus coronal slices, although in horizontal slices there was a slight trend toward a longer region of activation. C, Statistical analysis of synaptic connectivity in horizontal versus coronal slices. Electrical coupling extends farther along the minor axis (i.e., is wider) in coronal compared with horizontal slices, whereas chemical connectivity extends farther along the major axis (is longer) in horizontal slices. *p < 0.05 by t test.
In some experiments, mapping was performed in the presence and absence of gabazine to block GABAA receptors. For those cells with only evoked IPSCs (n = 3), gabazine completely abolished the synaptic response, leaving the direct response intact (Fig. 3). In contrast, for those cells with only electrical coupling (n = 2), spikelets persisted in the presence of gabazine. When glutamate uncaging produced both IPSCs and spikelets, gabazine blocked IPSCs but did not affect spikelets (n = 2) (Fig. 2C). These results were also confirmed in experiments with local perfusion system (n = 4) (main panels and insets of supplemental Figs. 2B1,B2, available at www.jneurosci.org as supplemental material).
Results from paired recording experiments have shown that the strength of electrical coupling of nearby nRt cell pairs (<35 μm separation) is inversely related to the distance between the two soma (Landisman et al., 2002; Long et al., 2004). In our experiments, spikelets could be evoked at much larger distances than this (e.g., >200 μm in Fig. 4). Thus, we tested whether or not at this scale the size of the spikelets was a function of the distance between the presynaptic and postsynaptic neurons. However, in 14 of 17 cells analyzed, we found no relationship between distance and spikelet amplitude. Spikelets tended to be of uniform amplitude across the entire region of uncaging. In only a minority of cases (3 of 17 cells), evoked spikelets were of larger amplitude when the photostimulation was applied near the cell body of the recorded neurons (data not shown). These results suggest that any fall off in electrotonic coupling strength occurs at distances smaller than the resolution of our mapping technique.
Correlation between synaptic connectivity and morphology of the postsynaptic cell
In some cases, biocytin was included in the recording pipette so that the dendritic arborization of the cell could be subsequently reconstructed, and the direct activation and synaptic connectivity maps were compared with the morphology of the cell (Fig. 5). In both horizontal (n = 9) and coronal (n = 12) slices, direct activation of the recorded cell occurred exactly along the soma and dendritic arborization of the recorded cell. Regarding the synaptic inputs maps, the connectivity was also orientated along the transverse axis of the nucleus, aligned with the morphology of the postsynaptic neuron. However, the spatial extent of the synaptic map was not necessarily the same as the dendritic extent. Synaptic inputs were commonly evoked by stimuli delivered both within and outside regions of the somatodendritic membrane of the postsynaptic cell. Occasionally, synaptic connections were organized along a single pole of the dendritic arborization (Fig. 5A). Synaptic maps that include both perisomatic and distal regions suggest that connectivity is both local and distant within nRt.
We observed a diversity in the morphology of nRt cells, suggesting the presence of three types of neurons each with distinct dendritic arborization (Fig. 6A): (1) one type had two primary polar dendrites extending for a long distance from the cell body and ramifying in secondary distal branches; (2) a second type had two to four primary dendrites emerging directly from the two poles of the soma, ramifying at short distance to emit proximal and distal branches; and (3) the last type had multiple primary and secondary dendrites radiating in all directions. Others studies have previously identified morphological diversity within nRt that is consistent with our observations. Therefore, we refer to the three morphological types as “f,” “F,” and “R” type neurons, as described previously (Spreafico et al., 1991). We did not observe the previously described differences in soma size. The three morphological types were expressed in different proportions, with F-neurons being the most prominent (71%) of the cells reconstructed in our study (n = 21). In horizontal slices (n = 9), both F-neurons (56%) and f-neurons (44%) were present at approximately the same proportion, whereas R-neuron were not observed. In contrast, in coronal slices (n = 12), the F-type was most prominent (83%) and no f-neurons were detected (Fig. 6B). There was no significant difference in total dendritic extent (distance between distal tips) between cells in horizontal (340 ± 29 μm; n = 9) versus coronal (359 ± 32 μm; n = 12) slices (Fig. 6C).
Figure 6.

Morphological diversity within nRt. A, Somatodendritic reconstruction of biocytin-filled neurons labeled with DAB, illustrating the three morphological types observed in nRt, related to the f (small fusiform), F (large fusiform), and R (round) neurons characterized previously by Spreafico et al. (1991). Except for the R-type, which showed a multipolar arborization, dendrites were oriented mainly along the major axis of nRt. B, Proportions of each cell type. The F-type appears to be the most prominent, frequently appearing in both coronal and horizontal sections, whereas f-neurons were observed exclusively in horizontal sections. The two R-neurons we recovered were only obtained in coronal slices. C, Dendritic extent defined as the distance between the two extremes along the major axis of the dendritic arborization. No significant difference was observed between horizontal and coronal slices. D, Relationship between morphology and synaptic connectivity. F-neurons received both chemical and electrical contacts in approximately equivalent proportion, although chemical are more prominent than electrical synapses in f-neurons. For the two R-neurons recorded, no synaptic responses of either type were evoked.
We then addressed the question whether or not there was a correlation between the type of dendritic arborization and synaptic inputs received by the cell (Fig. 6D). Glutamate uncaging evoked IPSCs in all (4 of 4) f-cells but spikelets in only 2 of 4, whereas IPSCs and spikelets were elicited in 7 of 15 (47%) and 4 of 15 (27%) F-cells, respectively. No synaptic responses were triggered in the two R-cells observed.
Incidence and extent of chemical and electrical connectivity in horizontal versus coronal slices
To determine whether chemical and electrical connectivity were preferentially organized in a specific plane of the nucleus, we first compared the proportion of cells receiving synaptic inputs via chemical or electrical contacts in horizontal (n = 43 cells) and coronal (n = 27 cells) sections (Fig. 7). The percentage of cells with IPSCs (chemical synaptic contacts) was significantly higher in horizontal sections (p < 0.01) (Table 1 includes incidence information from local perfusion experiments, which show a similar trend; *p < 0.05, **p < 0.01 by χ2 test). In contrast, the proportion of cells with spikelets (connected via electrical synapses) was slightly higher in coronal slices (Table 1), but this difference was not statistically significant. However, coronal slices contained a significantly larger proportion of cells connected exclusively via electrical synapses (spikelets only) than horizontal slices (16% in horizontal vs 37% in coronal; p < 0.05).
Figure 7.

Incidence of chemical and electrical synapses. Proportion of cells (1) receiving chemical synaptic contacts (either with or without electrical coupling; IPSCs), (2) connected via electrical synapses (with or without chemical synapses; spikelets), and (3) coupled exclusively electrically (spikelets only), in horizontal versus coronal slices. Note that GABAergic connectivity is more developed in horizontal section, whereas pure electrical coupling is more prominent in coronal slices. *p < 0.05, **p < 0.01 by χ2 test.
Table 1.
Incidence of electrical versus chemical connectivity
| LSPS |
Local perfusion |
Total |
||||
|---|---|---|---|---|---|---|
| Orientation | IPSC | Spikelets | IPSC | Spikelets | IPSC | Spikelets |
| Horizontal | 63%** (27 of 43) | 37% (16 of 43) | 54% (13 of 24) | 38% (9 of 24) | 60%* (40 of 67) | 37% (25 of 67) |
| Coronal | 33% (9 of 27) | 48% (13 of 27) | 46% (13 of 28) | 46% (13 of 28) | 40% (22 of 55) | 47% (26 of 55) |
Subsequently, we measured the spatial influence of the connectivity as described in Materials and Methods. For each individual cell, the extent of the three types of map was quantified using the 80% length (along the major axis) and 80% width (normal to the major axis). The extent of electrical coupling was significantly wider in coronal (80% width, 120 ± 9 μm in coronal, n = 4 vs 87 ± 4 μm in horizontal, n = 3; p < 0.05) (Fig. 8C), whereas chemical connectivity was nearly twice as long in horizontal compared with coronal sections (80% length, 355 ± 46 μm in horizontal, n = 5 vs 188 ± 46 μm in coronal, n = 4; p < 0.05) (Fig. 8C). We also estimated the dimensions of the region of minimum direct activation, i.e., that zone from which uncaged glutamate would trigger action potentials in the recorded neuron. No differences were observed in these dimensions between horizontal and coronal slices (Fig. 8B), but the length in each case (65 ± 25 μm in horizontal, n = 5; 37 ± 10 μm in coronal, n = 5) tended to be larger than the width (24 ± 5 μm in both horizontal and coronal), consistent with the orientation of the neurons along the transverse plane of the nucleus.
Discussion
Using LSPS, we demonstrated both chemical and electrical synaptic connections between inhibitory nRt cells. The incidence of GABAergic connectivity was higher and its extent longer in the anteroposterior plane of the nucleus, whereas in the dorsoventral axis, electrical coupling had more impact and was more widely distributed (Fig. 8, Table 1). The major orientation of both types of connectivity and that of the dendritic arborization were parallel to the long axis of the nucleus, but the extent of synaptic inputs could be quite distinct from the somatodendritic region of the postsynaptic cell. We confirmed the existence of three previously identified cell types in nRt based on their dendritic arborization (Spreafico et al., 1991) (but see Ohara and Havton, 1996), which were present in different proportion in horizontal and coronal sections. Here, we focused on lateral nRt containing primarily somatosensory sectors and did not address in detail whether connectivity or cell type varied across different sectors of nRt (Spreafico et al., 1991) or whether R-type neurons might be primarily presynaptic (Fig. 6D). Our data do suggest that f-neurons tend to receive primarily chemical connections, whereas both response types were evoked in similar proportion in F-neurons.
Dual involvement of chemical and electrical synapses
Mutual interactions between GABAergic nRt cells have been assumed based on electrophysiological and anatomical studies, but their structural basis, spatial organization, and functional influence have remained controversial, and chemical and electrical synapses have never been reported together. Initial evidence for inhibitory GABAergic connections arose from studies using electrical stimulation (Ahlsen and Lindstrom, 1982; Ulrich and Huguenard, 1995; Huntsman et al., 1999; Zhang and Jones, 2004), which might activate fibers of passage and thus inhibitory projections arising from outside thalamus in addition to nRt cells (Jourdain et al., 1989; Pare et al., 1990; Asanuma, 1994). In ferret, glutamate activation of nRt (or PGN) neurons confirmed intranuclear inhibitory interactions, but information about either electronic synapses or the extent of chemical connectivity was not reported (Sanchez-Vives et al., 1997; Shu and McCormick, 2002). In contrast, Connors and collaborators identified electrical synapses but found no evidence of chemical connectivity in rodent nRt (Landisman et al., 2002; Long et al., 2004). These previous opposing results suggesting either exclusive chemical or electrical intra-nRt connectivity contrast with our results demonstrating both types of connections. Factors contributing to these discrepancies likely include differences in recording and/or stimulation methods, developmental and species differences, and perhaps, most intriguingly, the orientation specific connectivity demonstrated here.
Within any given nRt cell, the two connections types had only partially overlapping regions of connectivity. For example, note primarily spikelet responses at spot 1 compared with mainly GABAergic responses at spot 3 in supplemental Figure 1C (available at www.jneurosci.org as supplemental material), IPSCs versus spikelet maps in Figure 5A, and differently timed spikelets vs IPSCs in Figure 2A (inset). This suggests that each postsynaptic cell is connected to distinct populations of presynaptic cells via GABAergic versus electrical synapses. In addition, although both spikelet and IPSC maps were centered on perisomatic regions (Figs. 3–5), coincident electrical/chemical responses [i.e., those with a spikelet followed at fixed latency by an IPSC (Galarreta and Hestrin, 1999; Gibson et al., 1999)] were rarely observed in our study. This result suggests that one type of connection tends to dominate each pair and is consistent with the results of dual intracellular recordings from nearby pairs of nRt cells, in which connectivity was found to be almost exclusively electrical (Landisman et al., 2002; Long et al., 2004). According to this view, chemical connectivity would be nonlocal, or at least sparse on a local scale. The resolution of our mapping is on the order of 25–50 μm (Fig. 1) and might be incapable of resolving a highly localized perisomatic region devoid of chemical connections.
Given the discrepancy between the localized excitation profile (Fig. 1) and extensive regions of connectivity (Figs. 3–5, 8), multiple local and distal presynaptic cells must connect to each postsynaptic cell. We estimated network convergence as the ratio between the mean rectangular area of synaptic connectivity and that of the direct AP activation for each type of synaptic input. Accordingly, electrical connectivity arises from ∼13 presynaptic cells in the anteroposterior (horizontal) axis versus 32 in the dorsoventral (coronal) axis, whereas 20 presynaptic cells contact a postsynaptic cell by chemical synapses versus 17 along the same respective planes. These values, likely underestimates of the actual numbers because of the compromised connectivity in brain slices and/or subthreshold glutamate activation of some cells, confirm the higher incidence of electrical coupling along the dorsoventral axis. The proportion of nRt cells interconnected by electrical synapses (31%) reported by Landisman et al. (2002) is similar to our results (37–48%).
Function of electrical synapses
We identified spikelets as postsynaptic events mediated by electrical coupling based on criteria described in Results, which rule out the possibility that they result from EPSCs, IPSCs, or electrogenesis in the recorded neuron. Thus, spikelets arise via generation of action potentials in neighboring cells that are transmitted to the postsynaptic cell via gap junctions. Electrical synapses play a critical role in the coordination of neuronal rhythms throughout the thalamocortical network (Galarreta and Hestrin, 1999; Gibson et al., 1999; Cruikshank et al., 2005). Electrical coupling in nRt can synchronize single action potentials and spindle-like oscillations among nearby nRt cells (Landisman et al., 2002; Long et al., 2004). Because of their low-pass filter characteristics, gap junctions in nRt are particularly effective at transmitting slow Ca2+-dependent burst responses compared with single spikes (Landisman et al., 2002). Thus, electrical synapses would promote synchronization of the burst firing that occurs in nRt during spindle oscillations (von Krosigk et al., 1993; Cox et al., 1997). Based on our findings, gap junction-mediated synchronizing will occur predominantly along the vertical (dorsoventral) plane of the nucleus. Electrical coupling would then coordinate the activity among a group of neurons mediating sensory information related to whiskers located in the same topographical row (Shosaku et al., 1984). In neocortical basket cells, dendritic gap junctions decrease as a function of distance from the soma, along with connexin36 expression (Fukuda and Kosaka, 2003; Fukuda et al., 2006), and electrical coupling strength between neurons falls with distance in neocortex and cerebellum (Amitai et al., 2002; Devor and Yarom, 2002). Thus, perisomatic junctions likely mediate the bulk of detectable intercellular signaling. Given the extensive overlap of dendrites within nRt, connectivity similar to that seen in neocortical interneurons would mediate localized electrical connectivity mainly through dendrodendritic synapses.
Function of chemical synapses
In PGN, glutamate application induced barrages of GABAergic IPSPs at frequencies corresponding to those occurring during intrinsic burst discharges, suggesting the presence of powerful chemical connections between these cells (Sanchez-Vives et al., 1997; Shu and McCormick, 2002). We showed here that such chemical connections are preferentially organized in the anteroposterior plane of the nucleus, suggesting that, in contrast to electrical coupling, mutual inhibitory interactions would preferentially modulate whisker sensation within columns, not rows (Shosaku et al., 1984). Intra-nRt inhibition is proposed to mediate an open loop lateral inhibition in somatosensory thalamus (Pinault et al., 1997; Pinault and Deschenes, 1998a) and short-term sensory plasticity during repetitive whisker movements (Hartings et al., 2003b). The extensive chemical connectivity in the anteroposterior plane demonstrated here likely underlies these functions. Our mapping results do not provide direct information regarding the anatomical basis (axodendritic vs dendrodendritic) of intranuclear inhibition. Topographic and sensory modality-specific organization exist in nRt both longitudinally (sectors), as well as within the mediolateral extent of the nucleus (tiers) (Jones, 1975; Shosaku et al., 1984; Crabtree, 1996; Crabtree et al., 1998; Lam and Sherman, 2005). For example, neurons located in the central tier of somatosensory nRt project to the ventral posterior nuclei, whereas medial tier neurons connect to the posterior complex (Crabtree, 1996). Thus, our results showing that synaptic connectivity is restricted to neurons located in the same nRt tier suggest that nRt cell interactions occur primarily between cells projecting to the same relay nucleus. However, because we sometimes observed spikelets evoked across an extensive mediolateral region of nRt (Figs. 5B, 8C), electrical connectivity may promote interactions across tiers as well. The relative roles of electrical vs chemical nRt connectivity in attentional processes (Crick, 1984; McAlonan et al., 2006) remain to be determined.
At the network level, the roles of chemical intra-nRt connectivity remains controversial, with some reports describing a synchronizing role in sleep spindle generation (Deschenes et al., 1985; Wang and Rinzel, 1993) and with recent studies emphasizing mainly a desynchronizing effect relevant to seizure regulation (von Krosigk et al., 1993; Huguenard and Prince, 1994; Huntsman et al., 1999; Sohal and Huguenard, 2003). As described in Introduction, axon collaterals are sparse and limited within the nucleus, suggesting only a modest functional role. However, our above mentioned estimates of chemical synaptic convergence indicate that, even with sparse intranuclear collateralization of individual axons, functionally powerful inhibition could be recruited through concurrent activation of multiple presynaptic neurons, leading to destabilization of network synchrony and prevention of thalamocortical seizures.
Footnotes
This work was supported by the National Institute of Neurological Disorders and Stroke Grant NS34774. We are indebted to Gordon M. G. Shepherd and Karel Svoboda for their extensive consultations in setting up our LSPS system, which uses many of the same design principles and components as those developed at Cold Spring Harbor Laboratory (Cold Spring Harbor, NY). We also thank Fran Shen and Isabel Parada for expert histological assistance, Carl Pisaturo for electronic and mechanical design, and Mark Beenhakker and Trent Anderson for useful comments on this manuscript.
References
- Ahlsen G, Lindstrom S (1982). Mutual inhibition between perigeniculate neurones. Brain Res 236:482–486. [DOI] [PubMed] [Google Scholar]
- Amitai Y, Gibson JR, Beierlein M, Patrick SL, Ho AM, Connors BW, Golomb D (2002). The spatial dimensions of electrically coupled networks of interneurons in the neocortex. J Neurosci 22:4142–4152. [DOI] [PMC free article] [PubMed] [Google Scholar]
- Asanuma C (1994). GABAergic and pallidal terminals in the thalamic reticular nucleus of squirrel monkeys. Exp Brain Res 101:439–451. [DOI] [PubMed] [Google Scholar]
- Bal T, von Krosigk M, McCormick DA (1995). Role of the ferret perigeniculate nucleus in the generation of synchronized oscillations in vitro. J Physiol (Lond) 483:665–685. [DOI] [PMC free article] [PubMed] [Google Scholar]
- Browne SH, Kang J, Akk G, Chiang LW, Schulman H, Huguenard JR, Prince DA (2001). Kinetic and pharmacological properties of GABAA receptors in single thalamic neurons and GABAA subunit expression. J Neurophysiol 86:2312–2322. [DOI] [PubMed] [Google Scholar]
- Bureau I, Shepherd GM, Svoboda K (2004). Precise development of functional and anatomical columns in the neocortex. Neuron 42:789–801. [DOI] [PubMed] [Google Scholar]
- Cox CL, Huguenard JR, Prince DA (1996). Heterogeneous axonal arborizations of rat thalamic reticular neurons in the ventrobasal nucleus. J Comp Neurol 366:416–430. [DOI] [PubMed] [Google Scholar]
- Cox CL, Huguenard JR, Prince DA (1997). Peptidergic modulation of intrathalamic circuit activity in vitro: actions of cholecystokinin. J Neurosci 17:70–82. [DOI] [PMC free article] [PubMed] [Google Scholar]
- Crabtree JW (1996). Organization in the somatosensory sector of the cat’s thalamic reticular nucleus. J Comp Neurol 366:207–222. [DOI] [PubMed] [Google Scholar]
- Crabtree JW, Collingridge GL, Isaac JT (1998). A new intrathalamic pathway linking modality-related nuclei in the dorsal thalamus. Nat Neurosci 1:389–394. [DOI] [PubMed] [Google Scholar]
- Crick F (1984). Function of the thalamic reticular complex: the searchlight hypothesis. Proc Natl Acad Sci USA 81:4586–4590. [DOI] [PMC free article] [PubMed] [Google Scholar]
- Cruikshank SJ, Landisman CE, Mancilla JG, Connors BW (2005). Connexon connexions in the thalamocortical system. Prog Brain Res 149:41–57. [DOI] [PubMed] [Google Scholar]
- De Biasi S, Frassoni C, Spreafico R (1986). GABA immunoreactivity in the thalamic reticular nucleus of the rat. A light and electron microscopical study. Brain Res 399:143–147. [DOI] [PubMed] [Google Scholar]
- De Biasi S, Frassoni C, Spreafico R (1988). The intrinsic organization of the ventroposterolateral nucleus and related reticular thalamic nucleus of the rat: a double-labeling ultrastructural investigation with gamma-aminobutyric acid immunogold staining and lectin-conjugated horseradish peroxidase. Somatosens Res 5:187–203. [DOI] [PubMed] [Google Scholar]
- Deschenes M, Madariaga-Domich A, Steriade M (1985). Dendrodendritic synapses in the cat reticularis thalami nucleus: a structural basis for thalamic spindle synchronization. Brain Res 334:165–168. [DOI] [PubMed] [Google Scholar]
- Desilets-Roy B, Varga C, Lavallee P, Deschenes M (2002). Substrate for cross-talk inhibition between thalamic barreloids. J Neurosci 22:RC218(1–4). [DOI] [PMC free article] [PubMed] [Google Scholar]
- Devor A, Yarom Y (2002). Electrotonic coupling in the inferior olivary nucleus revealed by simultaneous double patch recordings. J Neurophysiol 87:3048–3058. [DOI] [PubMed] [Google Scholar]
- Fukuda T, Kosaka T (2003). Ultrastructural study of gap junctions between dendrites of parvalbumin-containing GABAergic neurons in various neocortical areas of the adult rat. Neuroscience 120:5–20. [DOI] [PubMed] [Google Scholar]
- Fukuda T, Kosaka T, Singer W, Galuske RA (2006). Gap junctions among dendrites of cortical GABAergic neurons establish a dense and widespread intercolumnar network. J Neurosci 26:3434–3443. [DOI] [PMC free article] [PubMed] [Google Scholar]
- Galarreta M, Hestrin S (1999). A network of fast-spiking cells in the neocortex connected by electrical synapses. Nature 402:72–75. [DOI] [PubMed] [Google Scholar]
- Gibson JR, Beierlein M, Connors BW (1999). Two networks of electrically coupled inhibitory neurons in neocortex. Nature 402:75–79. [DOI] [PubMed] [Google Scholar]
- Guillery RW, Harting JK (2003). Structure and connections of the thalamic reticular nucleus: advancing views over half a century. J Comp Neurol 463:360–371. [DOI] [PubMed] [Google Scholar]
- Hartings JA, Temereanca S, Simons DJ (2003a). State-dependent processing of sensory stimuli by thalamic reticular neurons. J Neurosci 23:5264–5271. [DOI] [PMC free article] [PubMed] [Google Scholar]
- Hartings JA, Temereanca S, Simons DJ (2003b). Processing of periodic whisker deflections by neurons in the ventroposterior medial and thalamic reticular nuclei. J Neurophysiol 90:3087–3094. [DOI] [PubMed] [Google Scholar]
- Horikawa K, Armstrong WE (1988). A versatile means of intracellular labeling: injection of biocytin and its detection with avidin conjugates. J Neurosci Methods 25:1–11. [DOI] [PubMed] [Google Scholar]
- Houser CR, Vaughn JE, Barber RP, Roberts E (1980). GABA neurons are the major cell type of the nucleus reticularis thalami. Brain Res 200:341–354. [DOI] [PubMed] [Google Scholar]
- Huguenard JR (1999). Neuronal circuitry of thalamocortical epilepsy and mechanisms of antiabsence drug action. Adv Neurol 79:991–999. [PubMed] [Google Scholar]
- Huguenard JR, Prince DA (1992). A novel T-type current underlies prolonged Ca2+-dependent burst firing in GABAergic neurons of rat thalamic reticular nucleus. J Neurosci 12:3804–3817. [DOI] [PMC free article] [PubMed] [Google Scholar]
- Huguenard JR, Prince DA (1994). Intrathalamic rhythmicity studied in vitro: nominal T-current modulation causes robust antioscillatory effects. J Neurosci 14:5485–5502. [DOI] [PMC free article] [PubMed] [Google Scholar]
- Huntsman MM, Huguenard JR (2000). Nucleus-specific differences in GABAA-receptor-mediated inhibition are enhanced during thalamic development. J Neurophysiol 83:350–358. [DOI] [PubMed] [Google Scholar]
- Huntsman MM, Porcello DM, Homanics GE, DeLorey TM, Huguenard JR (1999). Reciprocal inhibitory connections and network synchrony in the mammalian thalamus. Science 283:541–543. [DOI] [PubMed] [Google Scholar]
- Jacobsen RB, Ulrich D, Huguenard JR (2001). GABAB and NMDA receptors contribute to spindle-like oscillations in rat thalamus in vitro. J Neurophysiol 86:1365–1375. [DOI] [PubMed] [Google Scholar]
- Jin X, Prince DA, Huguenard JR (2006). Enhanced excitatory synaptic connectivity in layer V pyramidal neurons of chronically injured epileptogenic neocortex in rats. J Neurosci 26:4891–4900. [DOI] [PMC free article] [PubMed] [Google Scholar]
- Jones EG (1975). Some aspects of the organization of the thalamic reticular complex. J Comp Neurol 162:285–308. [DOI] [PubMed] [Google Scholar]
- Jourdain A, Semba K, Fibiger HC (1989). Basal forebrain and mesopontine tegmental projections to the reticular thalamic nucleus: an axonal collateralization and immunohistochemical study in the rat. Brain Res 505:55–65. [DOI] [PubMed] [Google Scholar]
- Lam YW, Sherman SM (2005). Mapping by laser photostimulation of connections between the thalamic reticular and ventral posterior lateral nuclei in the rat. J Neurophysiol 94:2472–2483. [DOI] [PubMed] [Google Scholar]
- Landisman CE, Long MA, Beierlein M, Deans MR, Paul DL, Connors BW (2002). Electrical synapses in the thalamic reticular nucleus. J Neurosci 22:1002–1009. [DOI] [PMC free article] [PubMed] [Google Scholar]
- Lee SM, Friedberg MH, Ebner FF (1994). The role of GABA-mediated inhibition in the rat ventral posterior medial thalamus. I. Assessment of receptive field changes following thalamic reticular nucleus lesions. J Neurophysiol 71:1702–1715. [DOI] [PubMed] [Google Scholar]
- Liu XB, Jones EG (2003). Fine structural localization of connexin-36 immunoreactivity in mouse cerebral cortex and thalamus. J Comp Neurol 466:457–467. [DOI] [PubMed] [Google Scholar]
- Long MA, Landisman CE, Connors BW (2004). Small clusters of electrically coupled neurons generate synchronous rhythms in the thalamic reticular nucleus. J Neurosci 24:341–349. [DOI] [PMC free article] [PubMed] [Google Scholar]
- McAlonan K, Cavanaugh J, Wurtz RH (2006). Attentional modulation of thalamic reticular neurons. J Neurosci 26:4444–4450. [DOI] [PMC free article] [PubMed] [Google Scholar]
- McCormick DA, Bal T (1997). Sleep and arousal: thalamocortical mechanisms. Annu Rev Neurosci 20:185–215. [DOI] [PubMed] [Google Scholar]
- McCormick DA, Contreras D (2001). On the cellular and network bases of epileptic seizures. Annu Rev Physiol 63:815–846. [DOI] [PubMed] [Google Scholar]
- Montero VM (2000). Attentional activation of the visual thalamic reticular nucleus depends on “top-down” inputs from the primary visual cortex via corticogeniculate pathways. Brain Res 864:95–104. [DOI] [PubMed] [Google Scholar]
- Ohara PT (1988). Synaptic organization of the thalamic reticular nucleus. J Electron Microsc Tech 10:283–292. [DOI] [PubMed] [Google Scholar]
- Ohara PT, Havton LA (1996). Dendritic arbors of neurons from different regions of the rat thalamic reticular nucleus share a similar orientation. Brain Res 731:236–240. [DOI] [PubMed] [Google Scholar]
- Pare D, Hazrati LN, Parent A, Steriade M (1990). Substantia nigra pars reticulata projects to the reticular thalamic nucleus of the cat: a morphological and electrophysiological study. Brain Res 535:139–146. [DOI] [PubMed] [Google Scholar]
- Pinault D (2004). The thalamic reticular nucleus: structure, function and concept. Brain Res Brain Res Rev 46:1–31. [DOI] [PubMed] [Google Scholar]
- Pinault D, Deschenes M (1998a). Anatomical evidence for a mechanism of lateral inhibition in the rat thalamus. Eur J Neurosci 10:3462–3469. [DOI] [PubMed] [Google Scholar]
- Pinault D, Deschenes M (1998b). Projection and innervation patterns of individual thalamic reticular axons in the thalamus of the adult rat: a three-dimensional, graphic, and morphometric analysis. J Comp Neurol 391:180–203. [DOI] [PubMed] [Google Scholar]
- Pinault D, Bourassa J, Deschenes M (1995). The axonal arborization of single thalamic reticular neurons in the somatosensory thalamus of the rat. Eur J Neurosci 7:31–40. [DOI] [PubMed] [Google Scholar]
- Pinault D, Smith Y, Deschenes M (1997). Dendrodendritic and axoaxonic synapses in the thalamic reticular nucleus of the adult rat. J Neurosci 17:3215–3233. [DOI] [PMC free article] [PubMed] [Google Scholar]
- Sanchez-Vives MV, Bal T, McCormick DA (1997). Inhibitory interactions between perigeniculate GABAergic neurons. J Neurosci 17:8894–8908. [DOI] [PMC free article] [PubMed] [Google Scholar]
- Scheibel ME, Scheibel AB (1966). The organization of the nucleus reticularis thalami: a Golgi study. Brain Res 1:43–62. [DOI] [PubMed] [Google Scholar]
- Shepherd GM, Svoboda K (2005). Laminar and columnar organization of ascending excitatory projections to layer 2/3 pyramidal neurons in rat barrel cortex. J Neurosci 25:5670–5679. [DOI] [PMC free article] [PubMed] [Google Scholar]
- Shepherd GM, Pologruto TA, Svoboda K (2003). Circuit analysis of experience-dependent plasticity in the developing rat barrel cortex. Neuron 38:277–289. [DOI] [PubMed] [Google Scholar]
- Shosaku A, Kayama Y, Sumitomo I (1984). Somatotopic organization in the rat thalamic reticular nucleus. Brain Res 311:57–63. [DOI] [PubMed] [Google Scholar]
- Shu Y, McCormick DA (2002). Inhibitory interactions between ferret thalamic reticular neurons. J Neurophysiol 87:2571–2576. [DOI] [PubMed] [Google Scholar]
- Sohal VS, Huguenard JR (2003). Inhibitory interconnections control burst pattern and emergent network synchrony in reticular thalamus. J Neurosci 23:8978–8988. [DOI] [PMC free article] [PubMed] [Google Scholar]
- Sohal VS, Keist R, Rudolph U, Huguenard JR (2003). Dynamic GABAA receptor subtype-specific modulation of the synchrony and duration of thalamic oscillations. J Neurosci 23:3649–3657. [DOI] [PMC free article] [PubMed] [Google Scholar]
- Spreafico R, Battaglia G, Frassoni C (1991). The reticular thalamic nucleus (RTN) of the rat: cytoarchitectural, Golgi, immunocytochemical, and horseradish peroxidase study. J Comp Neurol 304:478–490. [DOI] [PubMed] [Google Scholar]
- Steriade M, Jones EG, McCormick DA (1997). In: Thalamus Amsterdam: Elsevier.
- Tsai P, Nishimura N, Yoder EJ, White A, Dolnick E, Kleinfeld D (2002). Principles, design and construction of a two photon scanning microscope for in vitro and in vivo studies. In: Methods for in vivo optical imaging (Frostig R, ed.) pp. 113–171. Boca Raton, FL: CRC.
- Tseng GF, Parada I, Prince DA (1991). Double-labelling with rhodamine beads and biocytin: a technique for studying corticospinal and other projection neurons in vitro. J Neurosci Methods 37:121–131. [DOI] [PubMed] [Google Scholar]
- Uhlrich DJ, Cucchiaro JB, Humphrey AL, Sherman SM (1991). Morphology and axonal projection patterns of individual neurons in the cat perigeniculate nucleus. J Neurophysiol 65:1528–1541. [DOI] [PubMed] [Google Scholar]
- Ulrich D, Huguenard JR (1995). Purinergic inhibition of GABA and glutamate release in the thalamus: implications for thalamic network activity. Neuron 15:909–918. [DOI] [PubMed] [Google Scholar]
- von Krosigk M, Bal T, McCormick DA (1993). Cellular mechanisms of a synchronized oscillation in the thalamus. Science 261:361–364. [DOI] [PubMed] [Google Scholar]
- Wang XJ, Rinzel J (1993). Spindle rhythmicity in the reticularis thalami nucleus: synchronization among mutually inhibitory neurons. Neuroscience 53:899–904. [DOI] [PubMed] [Google Scholar]
- Warren RA, Jones EG (1997). Maturation of neuronal form and function in a mouse thalamo-cortical circuit. J Neurosci 17:277–295. [DOI] [PMC free article] [PubMed] [Google Scholar]
- Williamson AM, Ohara PT, Ralston DD, Milroy AM, Ralston HJ 3rd (1994). Analysis of gamma-aminobutyric acidergic synaptic contacts in the thalamic reticular nucleus of the monkey. J Comp Neurol 349:182–192. [DOI] [PubMed] [Google Scholar]
- Yen CT, Conley M, Hendry SH, Jones EG (1985). The morphology of physiologically identified GABAergic neurons in the somatic sensory part of the thalamic reticular nucleus in the cat. J Neurosci 5:2254–2268. [DOI] [PMC free article] [PubMed] [Google Scholar]
- Zhang L, Jones EG (2004). Corticothalamic inhibition in the thalamic reticular nucleus. J Neurophysiol 91:759–766. [DOI] [PubMed] [Google Scholar]