

Abstract
Iron is essential for a variety of cellular functions, but its levels and bioavailability must be tightly regulated because of its toxic redox activity. A number of transporters, binding proteins, reductases, and ferroxidases help maintain iron homeostasis to prevent cell damage. The multi-copper ferroxidase ceruloplasmin (Cp) converts toxic ferrous iron to its nontoxic ferric form and is required for iron efflux from cells. Absence of this enzyme in humans leads to iron accumulation and neurodegeneration in the CNS. Here we report on the changes that occur in the cerebellum of Cp null (Cp−/−) mice with aging. We show that iron accumulation, which is reflected in increased ferritin expression, occurs mainly in astrocytes by 24 months in Cp−/− mice and is accompanied by a significant loss of these cells. In contrast, Purkinje neurons and the large neurons in the deep nuclei of Cp−/− mice do not accumulate iron but express high levels of the iron importer divalent metal transporter 1, suggesting that these cells may be iron deprived. This is also accompanied by a significant reduction in the number of Purkinje neurons. These data suggest that astrocytes play a central role in the acquisition of iron from the circulation and that two different mechanisms underlie the loss of astrocytes and neurons in Cp−/− mice. These findings provide a better understanding of the degenerative changes seen in humans with aceruloplasminemia and have implications for normal aging and neurodegenerative diseases in which iron accumulation occurs.
Keywords: aging, cerebellum, blood–brain, neuropathology, neuron death, astrocytes
Introduction
Iron is an essential metal that is involved in many metabolic processes. Iron serves as a cofactor for various heme and non-heme proteins, including the cytochromes of the mitochondrial oxidative chain for ATP generation, enzymes for DNA repair, and neurotransmitter synthesis (Rouault and Tong, 2005). Although these functions depend on the redox active nature of iron, free radicals can also be produced if iron is in excess or inappropriately shielded (Aisen et al., 2001). A number of transporters, binding proteins, oxidases, and reductases exist that tightly regulate iron homeostasis (Hentze et al., 2004). Lack or dysregulation of the expression of these molecules can lead to iron overload or iron deficiency. Interestingly, alterations of iron levels in non-CNS tissue, as happens in hemachromatosis, do not generally affect CNS iron levels (Pietrangelo, 2004), suggesting that the CNS is shielded by the blood–brain barrier (BBB). Nevertheless, changes in the expression of these iron homeostasis proteins in the CNS can lead to CNS pathology (Ponka, 2004).
Ceruloplasmin (Cp) is a ferroxidase that safely converts toxic ferrous (Fe2+) iron to its nontoxic ferric (Fe3+) form (Williams et al., 1974; Calabrese et al., 1989). A secreted form of Cp is expressed mainly by the liver, and a glycosylphosphatidylinositol (GPI)-anchored form is expressed in the CNS by astrocytes (Patel et al., 2000). Null mutations of the Cp gene in humans (aceruloplasminemia) result in iron accumulation in various organs including the liver and CNS (Harris et al., 1995; Morita et al., 1995; Yoshida et al., 1995). Iron accumulation and neurodegeneration in this condition occurs between 45 and 55 years of age (Okamoto et al., 1996; Takahashi et al., 1996; Gitlin, 1998). Mice deficient in Cp (Cp−/−) also show iron accumulation in the liver and other organs (Harris et al., 1999; Patel et al., 2002). In a previous report, we provided a preliminary biochemical characterization of iron accumulation in various regions of the CNS in Cp−/− mice with age (Patel et al., 2002). Iron accumulation has also been reported in the retina of mice lacking both Cp and the Cp homolog hephaestin (Hahn et al., 2004). We have also shown in in vitro studies that Cp is required for iron efflux from astrocytes and that GPI–Cp is bound to the efflux transporter ferroportin1 (FPN1) (Jeong and David, 2003).
It is not known whether the absence of Cp alters the expression of other molecules involved in iron homeostasis. In addition, because GPI–Cp is expressed only in astrocytes, it is of interest to know whether iron deposition occurs in astrocytes as well as neurons and whether both cell types undergo degeneration. Studies of the mechanisms controlling iron homeostasis in the CNS will have implications for neurological disorders such as Alzheimer's and Parkinson's disease in which iron accumulation occurs (Zecca et al., 2004), in addition to providing insights into iron accumulation in the CNS through aging. We now present data on the age-related accumulation of iron, expression of iron homeostasis proteins, and selective death of neurons and astrocytes in the cerebellum of Cp−/− and wild-type mice.
Materials and Methods
Animals.
Cp+/+ and Cp−/− mice at 6, 12, 18, and 24 months of age were used. Cp−/− mice on a C57BL/6 background were generated in our laboratory as described previously (Patel et al., 2002). All procedures used were approved by the McGill University Animal Care committee.
Iron histochemistry.
Cp+/+ and Cp−/− mice were perfused with 0.1 m phosphate buffer, followed by 4% paraformaldehyde in 0.1 m phosphate buffer, pH 7.2. Modified Perl's histochemistry was preformed on 14-μm-thick cryostat sections of the cerebellum to detect iron accumulation as described previously (Smith et al., 1997). Briefly, sections were incubated with 4% potassium ferrocyanide and 4% HCl, followed by a series of incubations with diaminobenzidine and hydrogen peroxide and counterstained with 0.02% methyl green (all from Sigma-Aldrich, Oakville, Ontario, Canada).
Flame atomic absorption spectrometry.
Iron concentration in the cerebellum of 12- and 24-month-old Cp−/− and Cp+/+ mice was measured by flame atomic absorption spectrometry (fAAS). Tissue samples were prepared according to a previously described protocol (Santos et al., 2000). Briefly, the whole cerebellum from individual animals was weighed wet and then dried for 20 h at 106°C, and the dry weight was measured. Dried samples were ashed at 500°C for 17 h and solubilized in 6N HCl. Extracted samples were diluted with demineralized water to an HCl concentration of 1.2N. The iron level in each sample was measured by fAAS using an AAnalyst 400 (PerkinElmer, Wellesley, MA). Duplicate readings were obtained for each sample. Data are shown as the mean ± SD of the iron concentration in micrograms per gram dry tissue weight (n = 3).
Quantitative real-time reverse transcription-PCR.
Total RNA was purified from the cerebella of Cp+/+ and Cp−/− mice at different ages using the RNeasy Lipid Tissue kit (Qiagen, Mississauga, Ontario, Canada), and quantitative real-time reverse transcription (QRT)-PCR was performed using the Brilliant Probe-based QRT-PCR Reagents and MX4000 (Stratagene, La Jolla, CA), both following the protocols of the manufacturer. Gene-specific primers and Taqman probes were generated using PrimerQuest (Integrated DNA Technology, Coralville, IA) (Table 1). QRT-PCR for peptidylprolyl isomerase A (PPIA) was performed for use as an internal control (Feroze-Merzoug et al., 2002). For data analysis, the sample cycle threshold values were normalized to that of PPIA and expressed as fold increase. Results are shown as the mean relative ratio (fold increase) of mRNA ± SD of the mean from three separate experiments (n = 3) compared with the wild-type value at the same age. Two-sample Student's t test was used to determine statistical significance.
Table 1.
Gene-specific primers used in the study
| Gene | Forward primer | Reverse primer | Probe |
|---|---|---|---|
| DMT1 | TGAATCGGGCCAATAAGCAGG A | TCAGCAAAGACGGACACGACAA | TCCTGCATCGCGCTCTTTGTTTCCTT |
| DMT1 (+IRE) | ACAGCCCAGGAGACCTTAAGAACA | ACCTTTGAACAAGCTCACCTCCGA | TAAGCCCTTTCGGGCCAAGTGCCTGTTA |
| DMT1 (−IRE) | TAGGCTGTGCTCAAACCTACAGCA | TACATGACAGCCAGGCATGGTAGA | ACCTAAGCTCCTGAGTGCTGGGCCA |
| FPN1 | AGAGCTGACCTGGCACCTTA | GGCCCAAGTCAGTGAAGGTA | AGGCAGAAAGCGGCCACA |
| TfR1 | TGGCTCTCACACTCTCTCAGCTTT | AGGGCATTTGCGACTCCCTGAATA | AAACCCTCTTCAGAAACCAGTTGGCCCT |
| Cp | TGCTCTGAACCCGAGAAAGT | CTGGGAGGCTTCCAAATGTA | CCAGGAAAGCAACAGGATGT |
| Hp | GCTGAGGGTCCTAAGGAATGGATA | GCCCACAGTACTTTGAGAAACAGG | CATGTGACTGTACCTGTGTTTCACCAGT |
| Ferr H | TAAAGAACTGGGTGACCACGTGAC | AAGTCAGCTTAGCTCTCATCACCG | ATCTCTTTGACAAGCACACCCTGGGA |
| Ferr L | TGGCCATGGAGAAGAACCTGAATC | GGCTTTCCAGGAAGTCACAGAGAT | TCTTGGATCTGCATGCCCTGGGTTCT |
| PPIA | AGCATACAGGTCCTGGCATC | TTCACCTTCCCAAAGACCAC | AAGACTGAATGGCTGGATGG |
+IRE, With IRE; −IRE, without IRE; Hp, hephaestin; Ferr H, ferritin H; Ferr L, ferritin L.
Gel retardation assay.
A gel retardation assay was performed to assess the interaction between iron regulatory proteins (IRPs) and iron response elements (IREs) following an established technique (Kim and Ponka, 1999). Briefly, 20 μg of total protein extract of whole cerebellum from 24-month-old Cp−/− or Cp+/+ mice was mixed with 32P-labeled ferritin IRE RNA probe (obtained from Dr. K. Pantopoulos, McGill University, Montreal, Quebec, Canada), which was in vitro transcribed from a linearized plasmid template using T7 RNA polymerase. The samples were incubated for 10 min at room temperature with heparin (5 mg/ml) to prevent nonspecific binding. Unbound probe was degraded by 10 min incubation with RNase T1. The formation of RNA–protein complexes was then detected by gel electrophoresis using 6% nondenaturing polyacrylamide gels. The gels were scanned with a STORM860 (phosphoimager) and analyzed with ImageQuant for densitometry (GE Healthcare, Uppsala, Sweden). Tissue homogenates of the cerebellum from three Cp−/− and three Cp+/+ mice were tested.
Western blotting.
Cerebella from mice at different ages were dissected out, and total protein was extracted as described previously (Jeong and David, 2003). Proteins were separated by SDS-PAGE, transferred to polyvinylidene fluoride membrane (Millipore, Billerica, MA), and incubated with rabbit anti-FPN1 (1:4000; Alpha Diagnostics, San Antonio, TX), rabbit anti-divalent metal transporter1 (DMT1) (1:4000; Alpha Diagnostics) (recognizes both forms of DMT1), rabbit anti-transferrin receptor 1 (TfR1) (1:500; Zymed, Burlington, Ontario, Canada), rabbit anti-ferritin (1:500; DakoCytomation, Carpinteria, CA), or mouse anti-glial fibrillary acidic protein (GFAP) (1:100; Sigma-Aldrich). Blots were washed and incubated with peroxidase-conjugated IgG (1:200,000; Jackson ImmunoResearch, West Grove, PA) and detected with enhanced chemiluminescence (PerkinElmer). Equal loading of proteins was assessed using rabbit anti-actin antibodies (1:200; Sigma-Aldrich).
Immunofluorescence and immunohistochemistry.
Cp+/+ and Cp−/− mice were perfused with 0.1 m phosphate buffer, followed by 4% paraformaldehyde in 0.1 m phosphate buffer, pH 7.2, and 14 μm cryostat sections were obtained. Double-immunofluorescence labeling of tissue sections was performed as described previously (Kalyvas and David, 2004). Briefly, the tissue sections were incubated with PBS containing 2% normal goat serum and 1% ovalbumin to block nonspecific binding of antibodies. This was followed by an overnight incubation with rabbit anti-DMT1 polyclonal antibody (1:400; Alpha Diagnostics) or a rabbit anti-ferritin antibody (1:100; DakoCytomation). After washing, the tissue sections were incubated with either monoclonal anti-GFAP (for astrocytes, 1:100; Sigma-Aldrich) or SMI32 (an anti-neurofilament antibody for neurons, 1:500; Sternberger Monoclonals, Berkeley, CA). In other experiments, sections were incubated with rabbit anti-GFAP (1:100; DakoCytomation) and monoclonal anti-S100β (1:250; Sigma-Aldrich) for quantifying astrocytes. The binding of polyclonal rabbit antibodies was visualized with fluorescein-conjugated goat anti-rabbit IgG (1:200; Jackson ImmunoResearch) and mouse monoclonal antibodies with rhodamine-conjugated goat anti-mouse IgG (1:200; Jackson ImmunoResearch). Sections were also labeled with 100 ng/ml 4′-6-diamidino-2-phenylindole (DAPI) (Vector Laboratories, Burlingame, CA) and viewed with a Zeiss (Toronto, Ontario, Canada) Axioskop 2 plus microscope. Immunohistochemistry using Vectastain ABC kit (Vector Laboratories) was used to detect expression of TfR1 because of its low abundance in the CNS. A standard technique was used as described previously (Ousman and David, 2000). TfR1 was detected in the tissue samples using a monoclonal anti-TfR1 antibody (1:200; Zymed) and a goat anti-mouse biotinylated secondary antibody (1:400; Jackson ImmunoResearch). Binding of the primary antibody was revealed by using diaminobenzidine as the chromogen. Tissue sections were counterstained with 0.1% cresyl violet.
Quantification.
Cell counts were done using BioQuant Nova Prime (BioQuant Image Analysis, Nashville, TN). The mean number of astrocytes per 104 per square micrometers of white matter and the mean number of Purkinje cells in a 500 μm linear distance in the Purkinje cell layer were estimated from 24 tissue sections per animal (n = 3), each section being at least 100 μm apart. Results are presented as the mean ± SD number of cells. The statistical significance was determined by a two-sample Student's t test and two-way ANOVA.
Results
Increased iron accumulation in the cerebellum of Cp null mice
We first assessed iron accumulation in the cerebellum of Cp−/− and Cp+/+ mice at 6, 12, and 24 months of age using enhanced Perl's histochemistry. At 6 months, there is no visible iron accumulation detected in either Cp−/− or Cp+/+ mice (data not shown). At 12 months, increased iron accumulation is detected in cells adjacent to the lining of the fourth ventricle in Cp−/− but not in wild-type mice (Fig. 1A,B). By 24 months of age, a large number of cells show iron accumulation in the cerebellar cortex (Fig. 1C) and deep nuclei (Fig. 1E) in Cp−/− mice. In contrast, wild-type mice show weaker Perl's staining for iron in a few cells in the cerebellar cortex (Fig. 1D) and deep nuclei (Fig. 1F), indicating that a low level of iron accumulation occurs in the CNS with aging. The increased iron accumulation in 12- and 24-month-old Cp−/− mice was further confirmed and quantified by flame atomic absorption spectrometry. This analysis shows a twofold increase in iron levels in the cerebellum of 12-month-old Cp−/− mice compared with wild-type mice and a much greater increase in iron of ∼4.5-fold in Cp−/− mice at 24 months of age compared with age-matched wild-type controls (Fig. 1G). The iron-loaded cells seen with Perl's staining in the cerebellar cortical white matter are glia. Iron staining is also detected occasionally in some small round cells (Figs. 1C, arrows, 2A) and also in elongated cells (Fig. 2A) in the granule cell layer, which, based on their morphology, are likely to be granule neurons and Bergmann glia, respectively. Iron accumulation is not seen in Purkinje cells in either the Cp null or wild-type mice (Fig. 2A,B). However, there appear to be a substantial loss of Purkinje neurons in Cp null mice compared with wild-type mice at this age (Fig. 2A,B). The deep nuclei of Cp−/− mice at 24 months contain cells intensely labeled for iron (Figs. 1E, 2C), which, based on their size and morphology, are likely to be mainly glia (Fig. 2C) and possibly also small neurons. However, the large neurons, which can be identified with the methyl green staining, did not show signs of iron accumulation (Fig. 2C). In contrast to the findings in Cp−/− mice, only a few small cells weakly stained for iron are seen in the deep nuclei of Cp+/+ mice (Fig. 2D). The absence of Cp therefore causes a marked accumulation of iron in the gray matter and white matter of the cerebellum with aging.
Figure 1.
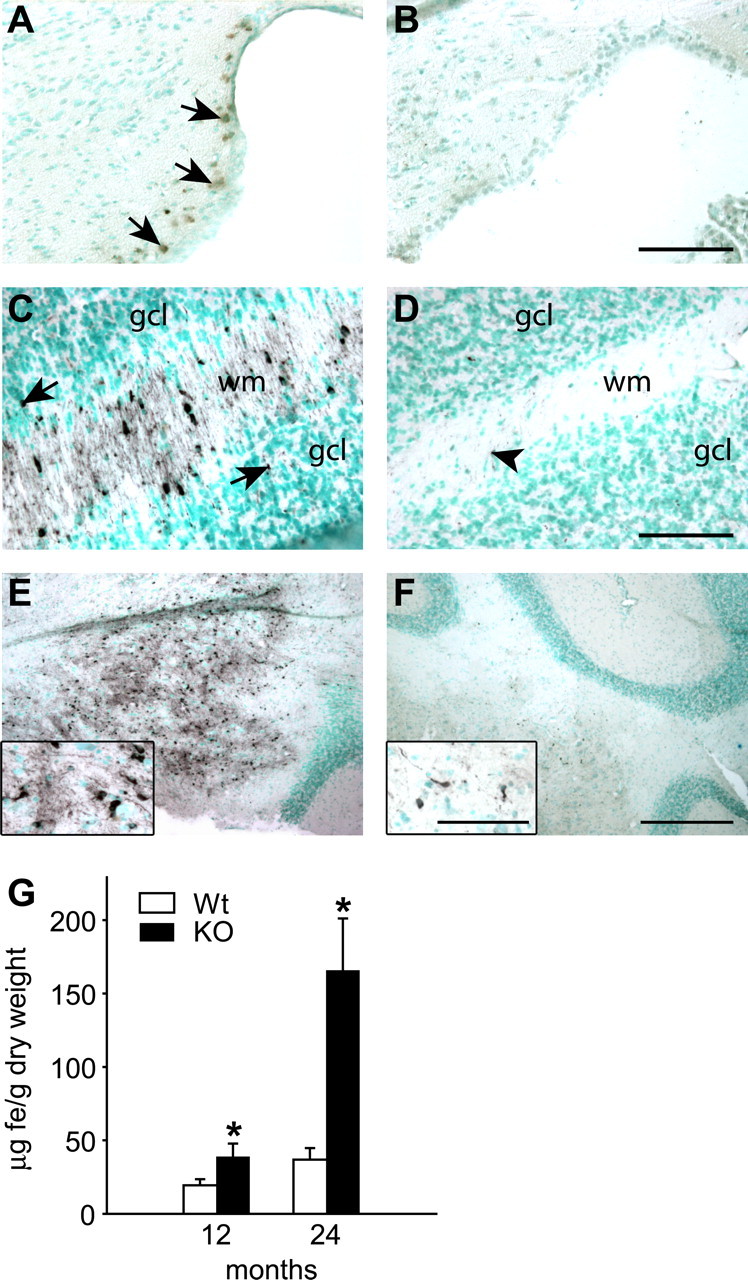
Iron accumulation in the cerebellum of Cp−/− and Cp+/+ mice with age detected by enhanced Perl's histochemistry. Tissue sections are counterstained with methyl green. A, B, Twelve-month-old cerebellum. C–F, Twenty-four-month-old cerebellum. A, The region adjacent to the lining of the fourth ventricle shows the first evidence of iron accumulation (arrows) seen as brown staining in Cp−/− mouse at 12 months of age. B, No iron accumulation is detected in a wild-type mouse at this age. C, The white matter (wm) of the cerebellar cortex of a Cp−/− mouse shows marked accumulation of iron in the glial cells. Some iron-positive cells (arrows) are also seen in the granular cell layer (gcl). D, A few iron-positive cells (arrowhead) are seen in the cortical white matter (wm) and granule cell layer (gcl) in a wild-type mouse. E, Low-magnification micrograph of the deep nuclei of a Cp−/− mouse shows severe iron accumulation. F, A small number of iron-positive cells are seen in the deep nuclei of a wild-type mouse. Insets show higher magnification of some of the iron-containing cells. Scale bars: A–D, 100 μm; E, F, 400 μm; insets, 50 μm. G, Changes in iron concentration in cerebellum of Cp−/− knock-out (KO) and Cp+/+ wild-type (Wt) mice obtained by fAAS analysis. Data are presented as average ± SD. *p < 0.05; n = 3.
Figure 2.

Iron accumulation in the cerebellar gray matter of Cp−/− and Cp+/+ mice at 24 months of age. A, B, Cortical gray matter. C, D, Deep nuclei. Purkinje neurons (arrowheads) in the cerebellar cortex of a Cp−/− mouse (A) and wild-type mouse (B) do not show any evidence of iron accumulation. However, small iron-positive cells (arrows) that are likely to be either glia or granule neurons are also seen in the granule cell layer in the Cp−/− cerebellum (A). Note the loss of Purkinje neurons (arrowheads) in the Cp−/− mouse (A) compared with the wild-type mouse (B). C, A high-magnification micrograph of the deep nucleus of a Cp−/− mouse shows that iron accumulates in small cells (arrows) located adjacent to the large neurons that are detectable with the methyl green counterstain. The large neurons do not show evidence of iron accumulation. D, Micrograph of a deep nucleus of a wild-type mouse shows less iron accumulation than that seen in Cp null mice. Note that the few iron-positive cells (arrows) in the wild-type mouse are also small in size. Scale bar, 50 μm.
Changes in expression of iron homeostasis proteins
We next assessed the changes in expression of eight iron transporters and binding proteins in Cp−/− and Cp+/+ mice with aging. Changes in mRNA expression in the cerebellum were assessed by quantitative real-time RT-PCR at 6, 12, 18, and 24 months of age and compared with wild-type levels at these ages. At 6 months of age, there is no difference between Cp null and wild-type mice in the mRNA levels of any of the iron binding proteins and transporters examined (Fig. 3A). By 12 months, when the first indication of iron overload is detected, there is a small but significant increase in ferritin L chain and a decrease in TfR1 mRNA (Fig. 3A). Changes in these mRNAs are particularly interesting because ferritin and transferrin receptor1 mRNAs contain IREs in the 5′ and 3′ untranslated regions, respectively. IREs are hairpin loop structures that interact with two types of iron regulatory proteins (IRP1 and IRP2) in iron-replete conditions. In the presence of excess iron, the failure of IRPs to bind to the IREs results in increased stability and translation of ferritin mRNA and breakdown of transferrin receptor mRNA. Therefore, changes in ferritin mRNA is a more sensitive indicator of iron accumulation than Perl's histochemistry because no obvious staining for iron was seen at 12 months, except along the lining of the fourth ventricle. By 18 months of age, there is even an additional increase in the mRNA expression of DMT1 and ferritin L chain. Because DMT1 isoforms with and without IRE are known to be expressed in neural cells (Roth et al., 2000), we used two sets of PCR primers to assess the expression of these two types of DMT1 transcripts. Quantitative real-time RT-PCR analysis revealed that the increase is in the mRNA coding for DMT1 without IRE (Fig. 3A). In addition, there is also a significant increase in mRNA expression of ferritin H chain. By 24 months, the mRNA levels of both ferritin H and L chains show a fourfold increase, which reflects the fold change in iron detected by fAAS, whereas TfR1 mRNA shows a 60% reduction (Fig. 3A). There is also a 2.5-fold increase in mRNA for DMT1 and DMT1 without IRE at 24 months (Fig. 3A).
Figure 3.
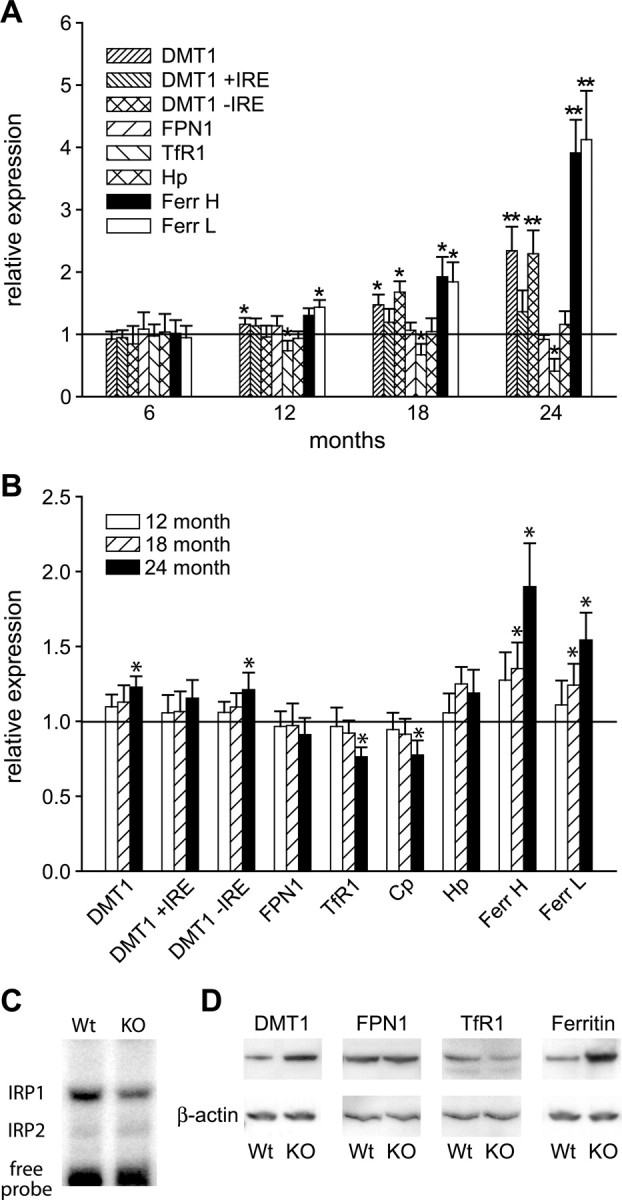
Changes in mRNA and protein expression of molecules involved in iron homeostasis. A, Graph showing changes in mRNA expression in Cp−/− mice with age detected by quantitative real-time RT-PCR. The data show fold increase over wild-type levels (horizontal line at 1). The earliest change in mRNA expression is detected at 12 months when there is a small but significant increase in the expression of DMT1 and ferritin L (Ferr L) and a decrease in TfR1. By 18 months, there is an additional increase in the expression of DMT1 and ferritin L chain compared with 12 months. In addition, there is a significant increase in expression of DMT1 without IRE (−IRE) and ferritin H chain. By 24 months, the changes in expression are much more pronounced. DMT1 and DMT1 without IRE are increased more than twofold, ferritin L and H chains increase over fourfold, and TfR1 mRNA levels are reduced more than at 12 and 18 months. Values shown are mean ± SD normalized to the wild-type mice at each time points; n = 3 for both Cp−/− and Cp+/+ mice. *p < 0.05, **p < 0.03, Student's t test. B, Graph showing changes in mRNA expression in wild-type mice at 12, 18, and 24 months of age compared with their levels at 6 months (horizontal line at 1). Significant increases are first detected in ferritin L and H chains at 18 months. By 24 months, increases are detected in DMT1, DMT1 without IRE, and ferritin L and H, as well as small but significant decreases in expression of TfR1 and Cp. Values shown are mean ± SD normalized to the wild-type mice at 6 months old; n = 3 for each time point. *p < 0.05, Student's t test. C, Gel retardation assay shows a marked decrease in IRP1 in the Cp−/− mice cerebellum. D, Western blot of 24-month-old cerebellum shows increase in protein expression for DMT1 and ferritin, decrease in TfR1, and no change in the expression of FPN1 in Cp−/− knock-out (KO) mice compared with wild-type controls (Wt). β-Actin was used as a loading control. Hp, Hephaestin.
Because the IRP–IRE system plays an important role in regulating the mRNA levels of key proteins involved in binding and transport of iron, we used a gel retardation assay using a 32P-labeled ferritin IRE RNA probe to assess the levels of activated IRPs in tissue homogenates of 24-month-old Cp−/− and Cp+/+ mice. Densitometric analysis shows an ∼40% decrease in IRP1 activity in Cp−/− mice compared with the wild-type age-matched controls (Fig. 3C), thus providing additional confirmation of iron accumulation in the CNS. In contrast to IRP1, IRP2 activity was barely detectable in these samples. The mRNA levels of hephaestin, a ceruloplasmin homolog, as well as FPN1 do not show significant changes with age in Cp null mice compared with wild-type controls (Fig. 3A).
We also assessed whether there are any changes in mRNA expression in wild-type mice with age. To do this, we plotted the fold increase or decrease in mRNA levels in 12-, 18-, and 24-month-old Cp+/+ mice compared with the levels at 6 months of age (Fig. 3B). No changes are detected at 12 months. At 18 months, there is small but significant increase in both ferritin chains. At 24 months, there is an increase of 1.9-fold in the mRNA for ferritin H, 1.5-fold for ferritin L, and 1.2-fold for DMT1 (without IRE form) and a small but significant decrease in TfR1 mRNA relative to the values at 6 months (Fig. 3B). Interestingly, there is also a small but significant decrease in ceruloplasmin mRNA in 24-month-old wild-type mice (Fig. 3B). The data presented in Figure 3A therefore indicate changes in mRNA expression in Cp null mice that are over and above the normal increases seen with aging in wild-type mice. Western blot analysis shows that there is a corresponding increase at the protein level of DMT1 and ferritin, a reduction in TfR1, but no change in FPN1 protein in the cerebellum of 24-month-old Cp−/− mice compared with wild-type controls (Fig. 3D).
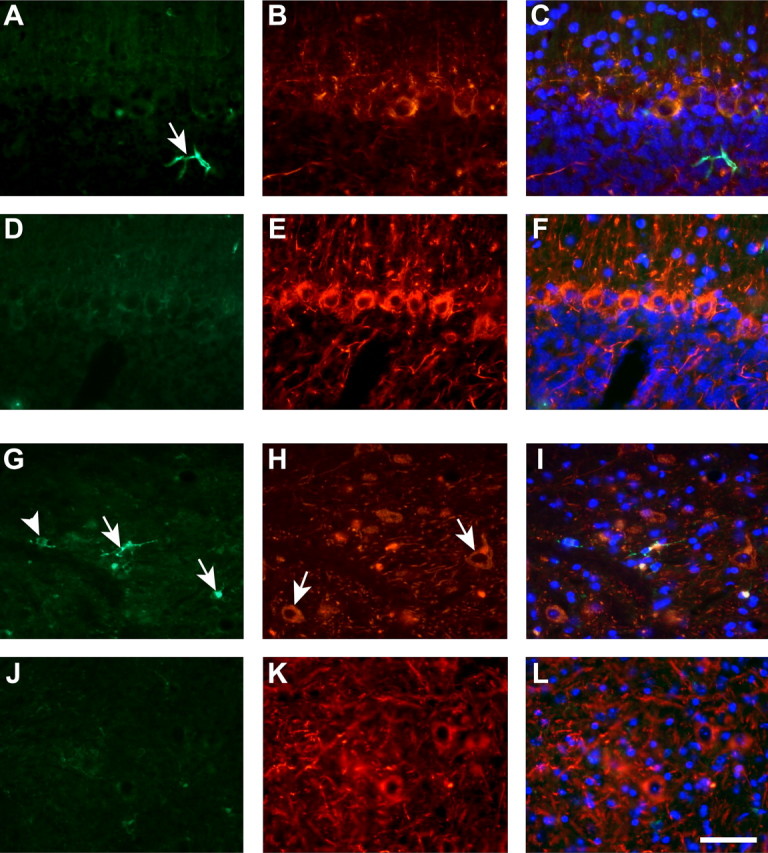
Given the accumulation of iron, the increase in the expression of the iron importer DMT1 was unexpected. We therefore assessed which cell types express increased levels of DMT1 in 24-month-old Cp−/− mice by double-immunofluorescence labeling for DMT1 combined with cell-type-specific antibodies against neurons (monoclonal antibody SMI32) and astrocytes (anti-GFAP). DMT1 immunoreactivity is markedly increased in Purkinje neurons in the cortex (Fig. 4A–C) and in the large neurons of the deep nuclei (Fig. 5A–C) compared with wild-type controls (Figs. 4D–F, 5D–F). Conversely, astrocytes do not show any increase in DMT1 expression in Cp−/− mice (data not shown). Unlike previous reports (Moos, 1996), we were unable to detect expression of TfR1, the other iron uptake mechanism, in Purkinje neurons in our mice. Interestingly, although expression of TfR1 is not increased in Purkinje cells in 24-month-old Cp−/− mice, it appears to be elevated in endothelial cells compared with age-matched controls (Fig. 4G,H). This suggests that the endothelial cells of the blood–brain barrier increase iron uptake in the presence of iron accumulation in neural cells in the CNS. These data also suggest that DMT1 may play an important role in iron trafficking in Purkinje neurons at this age in Cp null mice. DMT1 on the cell surface may play a role in iron influx into cells, and DMT1 on the endosomal membrane has been shown to be required for the transport of iron from the endosome into the cytosol. Therefore, the increase in DMT1 expression in Purkinje neurons and the large neurons in the deep nuclei, both of which do not show evidence of iron accumulation, suggests that these cells in Cp−/− mice may be deprived of iron and are trying to increase iron uptake by upregulating DMT1.
Figure 4.

Immunostaining for DMT1 and TfR1 in Purkinje cells of 24-month-old mice. A, F, Double-immunofluorescence labeling for DMT1 and SMI32. In Cp−/− mice, DMT1 immunoreactivity is markedly increased in Purkinje neurons (A, arrows), which are double labeled with the anti-neurofilament antibody SMI32 (B). Tissue sections of similar areas from control, wild-type mice show weak DMT1 immunoreactivity (D). C and F show merged images of DMT1, SMI32, and DAPI staining. G and H show that there is no increase in expression of TfR1 in Purkinje neurons in Cp−/− (G, arrows), which is not detectable in these cells in wild-type controls (H, arrows). Scale bar, 50 μm.
Figure 5.

Double-immunofluorescence labeling for DMT1 and neurofilament (SMI32) of cerebellar deep nuclei of 24-month-old mice. In Cp−/− mice, DMT1 immunoreactivity is markedly increased (A, arrows) in large neurons, which are double labeled with SMI32 (B). Tissue sections of similar areas from control mice show weak DMT1 immunoreactivity (D). C and F show merged images of DMT1, SMI32, and DAPI staining. Scale bar, 50 μm.
Because iron levels directly regulate ferritin synthesis in cells (Hentze et al., 1987), an increase in ferritin immunoreactivity can be used to indirectly assess increases in iron levels in particular cell populations. We therefore performed immunofluorescence staining for ferritin combined with cell type-specific markers. In the cerebellar cortex, Purkinje neurons did not show ferritin immunostaining in either Cp null or wild-type mice, suggesting that these neurons do not accumulate iron (Fig. 6A–C, D–F), which is consistent with the absence of Perl's staining of these neurons. However, there is evidence of ferritin immunoreactivity in glial cells in the cerebellar cortex (Fig. 6A) and occasionally some granule neurons. In the deep nuclei, astrocytes are the most abundant ferritin-positive (ferritin+) cell type, but some small neurons are also ferritin+ (Fig. 6G–I). In contrast, the large neurons in the deep nuclei do not show evidence of ferritin immunoreactivity (Fig. 6G–I). GFAP+ astrocytes in the white matter of Cp−/− mice show strong ferritin immunoreactivity (Fig. 7A–C, inset) and are therefore likely to be the cell type that is labeled for iron by Perl's staining. There is also a significant reduction in GFAP immunoreactivity in the Cp−/− mice compared with wild-type mice at 24 months of age (Fig. 7B,E). The reduction in GFAP in Cp−/− mice was further confirmed by Western blot analysis (Fig. 7G).
Figure 6.
Double-immunofluorescence labeling of cerebellar gray matter at 24 months of age with anti-ferritin and anti-neurofilament (SMI32) antibodies. A–F, Cerebellar cortex including Purkinje cell layer. G–L, Cerebellar deep nuclei. A, D, There is no ferritin labeling in Purkinje neurons in either Cp−/− (A) or Cp+/+ (D) mice. Purkinje neurons were detected with the neurofilament/SMI32 antibody (B, E). A ferritin-positive cell (arrow in A) is likely to be a glial cell because it is negative for neurofilament. In the deep nuclei of Cp−/− mice (G, H), the large neurons (arrows in H) also did not show evidence of ferritin immunolabeling. Ferritin immunoreactivity is, however, seen in some small neurons (arrows in G) and cells that were SMI32 negative (arrowhead in G), possibly glia. Anti-ferritin-labeled cells are not seen in the deep nuclei of wild-type mouse (J, K). C, F, I, and L are the merged images of corresponding ferritin, SMI32, and DAPI staining. Scale bar, 50 μm.
Figure 7.

Double-immunofluorescence labeling of cerebellar white matter at 24 months of age with anti-ferritin and anti-GFAP antibodies. A, B, Tissue section through the white matter of a Cp−/− mouse shows numerous ferritin-positive cells (A) that are double labeled with anti-GFAP (B), indicating that they are astrocytes. C shows merged images of ferritin, GFAP, and DAPI staining. The boxed area in C is shown at a higher magnification in the inset. D, An occasional ferritin-positive cell is seen in the white matter of wild-type mouse. B, E, Note that the extent and intensity of the GFAP labeling is markedly diminished in the Cp−/− mouse compared with the wild type. F shows merged images of ferritin, GFAP, and DAPI staining. Scale bars: F, 50 μm; inset in C, 20 μm. G, Western blot shows a reduction in GFAP in Cp−/− knock-out (KO) mouse compared with control wild-type (Wt) mouse at 24 months of age.
Glial and neuronal loss in Cp null mice
The reduction in GFAP immunoreactivity in Cp−/− mice may be attributable to either a reduction in the expression levels of this intermediate filament protein or a loss of astrocytes. We therefore quantified the number of astrocytes in the white matter at 24 months of age in tissue sections labeled with anti-GFAP. There is a marked reduction in the number of GFAP+ astrocytes in Cp−/− mice compared with wild-type mice as assessed by the number of GFAP+/DAPI+ cellular profiles (Fig. 8A,D). Quantification of the number of these GFAP+ cells revealed a 61% loss in Cp null mice compared with controls (Fig. 8G). To further ascertain whether this change represents a loss of astrocytes or simply a reduction in GFAP expression, we performed double-immunofluorescence labeling for GFAP and S100β, another astrocyte marker that labels astrocytic cell bodies. This analysis shows a 55% reduction in the number of S100β+/DAPI+ cells and a 57% reduction in the number of S100β+/GFAP+ double-labeled cells, with DAPI-stained nuclei (Fig. 8G). The reduction in GFAP and S100β immunoreactivity was also detected in other regions of the cerebellum, including the cortical gray matter and deep nuclei, but was not quantified. These data indicate that there is a marked loss of astrocytes in Cp−/− mice with age. We were unable to detect activated caspase 3 immunoreactivity in astrocytes, which may be attributable to the slow rate of cell death that occurs over a period of many months. The excessive amount of iron accumulation in astrocytes, however, is likely to lead to increased death of these cells in Cp null mice. It is also possible that the loss of astrocytes in 24-month-old Cp−/− mice may be further exacerbated by a reduction in cell proliferation and an inability for renewal of the astrocyte population attributable to a lack of iron, which is required for cell proliferation.
Figure 8.

Astrocyte loss in Cp−/− mice at 24 months. Tissue section though the cerebellar white matter of a Cp−/− mouse shows markedly reduced immunoreactivity for anti-GFAP (A) and S100β (B) compared with wild-type mouse (D, E). The reduction in GFAP and S100β immunoreactivity in the Cp−/− mouse is associated with a reduction in the number of cells as seen with the DAPI staining (C) compared with the wild-type mouse (F). The area above the dotted line in C and F is the white matter, and below the line is the granule cell layer. Scale bar, 50 μm. G, Quantification of the GFAP+, S100β+, and GFAP/S100β double-labeled cells all show marked loss of astrocytes in Cp−/− knock-out mice (KO) compared with wild-type mice (Wt) at 24 months of age. *p < 0.05.
The data presented above in Figures 2A, 4B, and 6B suggests that there is a loss of Purkinje neurons in 24-month-old mice. To rigorously assess this, we quantified the number of Purkinje cells in tissue sections immunostained for nonphosphorylated neurofilament subunits, which label neuronal cell bodies. These results show that there is a gradual loss of Purkinje neurons in Cp−/− mice between 12 and 24 months of age. At 12 months, there is a 30% loss of Purkinje neurons, which increases to a 48% loss at 24 month of age (Fig. 9). As with astrocytes, we were unable to detect activated caspase 3 immunoreactivity in Purkinje neurons. There is no difference in Purkinje cell number between wild-type and Cp null mice at 6 months of age (Fig. 9). In addition, there is no detectable loss of Purkinje cells in wild-type mice with age. The loss of Purkinje neurons in Cp−/− mice may underlie the loss of motor coordination on a rotarod test, which we reported previously (Patel et al., 2002).
Figure 9.

Loss of Purkinje neurons in Cp−/− mice. SMI32-stained Purkinje neurons were quantified at 6, 12, and 24 months of age in both strains of mice. The number of Purkinje neurons begins to decrease in Cp−/− knock-out mice (KO) at 12 months of age compared with wild-type mice (Wt) and is reduced further at 24 months of age. *p < 0.05, Student's t test.
Discussion
We studied the role of the ferroxidase ceruloplasmin in iron homeostasis in the CNS with aging. The cerebellum was selected for this study because it is one of the regions of the CNS that is affected in humans with aceruloplasminemia. In particular, we assessed the changes in iron accumulation, expression of various molecules involved in cellular iron homeostasis, as well as loss of neurons and glia in the cerebellum from 6 to 24 months of age. These data indicate that astrocytes play an important role in iron trafficking in the CNS and suggest that astroglial and neuronal death in Cp null mice may occur via different mechanisms.
Role of astrocytes in iron trafficking in the CNS
Iron that is required for cellular metabolism in the CNS is acquired from the circulation in which it is primarily in the form of transferrin-bound diferric iron (Moos and Morgan, 2000; Burdo and Connor, 2003). Entry of iron into the CNS first involves transferrin receptor-mediated uptake from the serum into capillary endothelial cells (Jefferies et al., 1984; Descamps et al., 1996), although some non-transferrin receptor-mediated uptake may also occur (Ueda et al., 1993; Burdo et al., 2003; Deane et al., 2004). Iron taken up into the endosomal compartment of endothelial cells via transferrin–TfR1 complexes is released from this receptor complex after acidification of the endosome and then effluxed into the cytosol via DMT1 that is present on the endosomal membrane (Fleming et al., 1998). How iron is released from endothelial cells is still not fully known. Endothelial cells express the efflux transporter FPN1 (Wu et al., 2004), but there is as yet no clear evidence that these cells also express Cp, which we have shown previously is required for FPN1-mediated iron efflux (Jeong and David, 2003). Furthermore, the fact that we do not see iron accumulation in endothelial cells in Cp−/− mice suggests that Cp is not required for iron efflux from these cells.
Unlike other tissues, almost 95% of the capillary surface in the CNS is surrounded by astrocytic processes called perivascular end feet (Kandel et al., 2000). These astrocytic processes contribute to the formation of tight junctions between endothelial cells, which comprise the BBB and thus limit the free flow of cells and macromolecules from the circulation into the CNS parenchyma (Saunders et al., 1999). Apart from astrocytes, other types of glial cells and neurons do not have direct access to the capillary surface. Furthermore, electron microscope analysis and recent studies on the localization of the aquaporin-4 water channel, which is exclusively localized to astrocytic processes, reveals that astrocytes extend a network of thin cytoplasmic processes around neuronal cell bodies and their processes and around axon–dendritic synaptic complexes, in addition to the perivascular end feet (Vitellaro-Zuccarello et al., 2005). Astrocytes occupy discrete nonoverlapping domains, with blood vessels lying along the boundaries of these domains (Nedergaard et al., 2003) whereas neurons lie within and between these domains. We have shown previously that astrocytes are capable of non-transferrin-bound iron uptake in vitro (Jeong and David, 2003), which may be mediated via the influx transporter DMT1 (Burdo et al., 1999; Williams et al., 2000; Jeong and David, 2003) or also possibly TfR1, although there is conflicting evidence for the latter (Roskams and Connor, 1992; Moos, 1996; Qian et al., 1999), and our own immunostaining does not show expression of TfR1 in these glia. In addition, astrocytes also express FPN1 (Burdo et al., 2001) and GPI–Cp (Patel et al., 2000, 2002; Jeong and David, 2003), which are required for iron efflux. Astrocytes, therefore, possess iron influx and efflux mechanisms. They are therefore ideally positioned around blood vessels to acquire iron from the circulation via endothelial cells and deliver it to neurons via the network of astrocytic processes surrounding neurons. Astrocytes can also take up iron released by cells in the CNS parenchyma and possess the mechanisms required to efflux iron and load it on to transferrin at the capillary surface, from which it can be cleared into the circulation or reutilized in the CNS.
Our current data show that there is a slow accumulation of iron in astrocytes especially over a period of 12–24 months of age in Cp−/− mice. A slow time course of the neuropathology is also seen in humans with aceruloplasminemia (Miyajima et al., 1987; Xu et al., 2004). Because GPI–Cp is essential for iron efflux from astrocytes, the slow accumulation of iron in Cp−/− mice and people with aceruloplasminemia suggest that there are either additional mechanisms in vivo that help clear iron from astrocytes, albeit not completely efficiently, or that the turnover of iron in the CNS is very slow. The eventual accumulation of iron in astrocytes is cytotoxic and leads to a 57% reduction in the number of astrocytes in the cerebellum of 24-month-old Cp−/− mice. Oligodendrocytes do not appear to be affected in Cp null mice, because myelination appears to be normal (data not shown).
Previous studies have reported that iron accumulates in the human CNS with normal aging (Hallgren and Sourander, 1958; Connor et al., 1995; Zecca et al., 2001). This accumulation of iron occurs in astrocytes and microglia in the cerebral cortex, cerebellum, hippocampus, basal ganglia, and amygdala in people between 60 and 90 years of age (Connor et al., 1990). This age-related iron accumulation may be caused by increased leakiness of the blood–brain barrier or a reduction in the ability of astrocytes to efflux iron or by other factors. Our present work shows that there is a low level of iron accumulation in the cerebellum of wild-type mice at 24 months. We also detected a corresponding increase in the mRNA expression of both ferritin H and L chains and reduction in TfR1 mRNA in the cerebellum of wild-type mice, which are sensitive indicators of iron overload in cells and tissues. Interestingly, we also detected a small but significant reduction in the expression of Cp in the cerebellum of 24-month-old wild-type mice compared with 6-month-old wild-type mice. These changes in iron accumulation and mRNA expression therefore appear to be a milder version of what is seen in Cp−/− mice and suggests that reduction in the expression of Cp in the CNS may contribute to the iron accumulation in normal aging.
Potential mechanisms underlying astrocyte and neuronal loss in Cp−/− mice
Surprisingly, Purkinje neurons, large neurons in the deep nuclei, and the majority of other neurons in 24-month-old Cp−/− mice did not show any evidence of iron accumulation. This finding is consistent with the possibility that these neurons receive iron mainly from astrocytes via astrocytic processes, which abut neuronal cell bodies. The inability of astrocytes to efflux iron in Cp−/− mice would then result in iron remaining within astrocytes and not being made available to neurons. The accumulation of iron in astrocytes of Cp−/− mice would thus be expected to result in neuronal iron deprivation. The increased expression of DMT1 in Purkinje neurons and neurons in the deep nuclei may therefore be an attempt by these iron-starved neurons to increase their ability to acquire iron, possibly from the CSF in which iron is found at very low levels, i.e., ∼38-fold less than serum (Mizuno et al., 2005).
Despite the absence of iron accumulation in Purkinje cells, there is a significant loss of these neurons in Cp−/− mice by 24 months of age, suggesting that this cell death is not attributable to iron-mediated free radicals generated within neurons. It is possible that free radicals generated in iron-loaded astrocytes may damage the neighboring neurons. However, the marked loss of astrocytes raises the possibility that the neuronal death may be secondary to loss of the metabolic support normally provided by astrocytes. Selective ablation of astrocytes after cortical stab wounds and spinal cord lesions have also been shown to increase neuronal death, suggesting a neuroprotective role for these glia (Bush et al., 1999; Faulkner et al., 2004). Astrocytes play an important role in maintaining the ionic and molecular homeostasis of the CNS microenvironment. Astrocytes maintain local levels of K+, Ca2+, iron, and other metals, maintain pH, and provide glucose and metabolic substrates to neurons (Nedergaard et al., 2003; Volterra and Meldolesi, 2005). Astrocytes also clear neurotransmitters, such as glutamate released from synapses, and other molecules, which can be toxic to cells (Nedergaard et al., 2003; Rao et al., 2005). Our results therefore suggest that different mechanisms may underlie the loss of astrocytes and neurons in Cp null mice. Astrocytes, which show clear evidence of iron accumulation, are likely to die from iron toxicity, whereas the loss of Purkinje neurons may be secondary to the loss of the metabolic support provided by astrocytes. More direct in vitro experiments would help to firmly establish whether the loss of metabolic or trace metal coupling between astrocytes and neurons underlie Purkinje cell death. These results, however, provide new insights into the possible mechanisms that may mediate the loss of neurons and astrocytes in Cp null mice. Similar mechanisms may also play a role in humans with aceruloplasminemia and may have wider implications for aging and other neurodegenerative diseases in which iron accumulation occurs.
Footnotes
This work was supported by a grant from the Canadian Institutes of Health Research (S.D.). S.Y.J. was a recipient of a studentship from The Research Institute of the McGill University Health Center. We thank Dr. K. Pantopoulos for IRE probe and Drs. M. Santos, S. F. Kim, and J. Wang for their advice on protocols. We also thank Margaret Attiwell and Ourania Tsatas for technical help.
References
- Aisen P, Enns C, Wessling-Resnick M. Chemistry and biology of eukaryotic iron metabolism. Int J Biochem Cell Biol. 2001;33:940–959. doi: 10.1016/s1357-2725(01)00063-2. [DOI] [PubMed] [Google Scholar]
- Burdo JR, Connor JR. Brain iron uptake and homeostatic mechanisms: an overview. Biometals. 2003;16:63–75. doi: 10.1023/a:1020718718550. [DOI] [PubMed] [Google Scholar]
- Burdo JR, Martin J, Menzies SL, Dolan KG, Romano MA, Fletcher RJ, Garrick MD, Garrick LM, Connor JR. Cellular distribution of iron in the brain of the Belgrade rat. Neuroscience. 1999;93:1189–1196. doi: 10.1016/s0306-4522(99)00207-9. [DOI] [PubMed] [Google Scholar]
- Burdo JR, Menzies SL, Simpson IA, Garrick LM, Garrick MD, Dolan KG, Haile DJ, Beard JL, Connor JR. Distribution of divalent metal transporter 1 and metal transport protein 1 in the normal and Belgrade rat. J Neurosci Res. 2001;66:1198–1207. doi: 10.1002/jnr.1256. [DOI] [PubMed] [Google Scholar]
- Burdo JR, Antonetti DA, Wolpert EB, Connor JR. Mechanisms and regulation of transferrin and iron transport in a model blood-brain barrier system. Neuroscience. 2003;121:883–890. doi: 10.1016/s0306-4522(03)00590-6. [DOI] [PubMed] [Google Scholar]
- Bush TG, Puvanachandra N, Horner CH, Polito A, Ostenfeld T, Svendsen CN, Mucke L, Johnson MH, Sofroniew MV. Leukocyte infiltration, neuronal degeneration, and neurite outgrowth after ablation of scar-forming, reactive astrocytes in adult transgenic mice. Neuron. 1999;23:297–308. doi: 10.1016/s0896-6273(00)80781-3. [DOI] [PubMed] [Google Scholar]
- Calabrese L, Carbonaro M, Musci G. Presence of coupled trinuclear copper cluster in mammalian ceruloplasmin is essential for efficient electron transfer to oxygen. J Biol Chem. 1989;264:6183–6187. [PubMed] [Google Scholar]
- Connor JR, Menzies SL, St Martin SM, Mufson EJ. Cellular distribution of transferrin, ferritin, and iron in normal and aged human brains. J Neurosci Res. 1990;27:595–611. doi: 10.1002/jnr.490270421. [DOI] [PubMed] [Google Scholar]
- Connor JR, Snyder BS, Arosio P, Loeffler DA, LeWitt P. A quantitative analysis of isoferritins in select regions of aged, parkinsonian, and Alzheimer's diseased brains. J Neurochem. 1995;65:717–724. doi: 10.1046/j.1471-4159.1995.65020717.x. [DOI] [PubMed] [Google Scholar]
- Deane R, Zheng W, Zlokovic BV. Brain capillary endothelium and choroid plexus epithelium regulate transport of transferrin-bound and free iron into the rat brain. J Neurochem. 2004;88:813–820. doi: 10.1046/j.1471-4159.2003.02221.x. [DOI] [PMC free article] [PubMed] [Google Scholar]
- Descamps L, Dehouck MP, Torpier G, Cecchelli R. Receptor-mediated transcytosis of transferrin through blood-brain barrier endothelial cells. Am J Physiol. 1996;270:H1149–H1158. doi: 10.1152/ajpheart.1996.270.4.H1149. [DOI] [PubMed] [Google Scholar]
- Faulkner JR, Herrmann JE, Woo MJ, Tansey KE, Doan NB, Sofroniew MV. Reactive astrocytes protect tissue and preserve function after spinal cord injury. J Neurosci. 2004;24:2143–2155. doi: 10.1523/JNEUROSCI.3547-03.2004. [DOI] [PMC free article] [PubMed] [Google Scholar]
- Feroze-Merzoug F, Berquin IM, Dey J, Chen YQ. Peptidylprolyl isomerase A (PPIA) as a preferred internal control over GAPDH and beta-actin in quantitative RNA analyses. Biotechniques. 2002;32:776–778. doi: 10.2144/02324st03. 780, 782. [DOI] [PubMed] [Google Scholar]
- Fleming MD, Romano MA, Su MA, Garrick LM, Garrick MD, Andrews NC. Nramp2 is mutated in the anemic Belgrade (b) rat: evidence of a role for Nramp2 in endosomal iron transport. Proc Natl Acad Sci USA. 1998;95:1148–1153. doi: 10.1073/pnas.95.3.1148. [DOI] [PMC free article] [PubMed] [Google Scholar]
- Gitlin JD. Aceruloplasminemia. Pediatr Res. 1998;44:271–276. doi: 10.1203/00006450-199809000-00001. [DOI] [PubMed] [Google Scholar]
- Hahn P, Qian Y, Dentchev T, Chen L, Beard J, Harris ZL, Dunaief JL. Disruption of ceruloplasmin and hephaestin in mice causes retinal iron overload and retinal degeneration with features of age-related macular degeneration. Proc Natl Acad Sci USA. 2004;101:13850–13855. doi: 10.1073/pnas.0405146101. [DOI] [PMC free article] [PubMed] [Google Scholar]
- Hallgren B, Sourander P. The effect of age on the non-haemin iron in the human brain. J Neurochem. 1958;3:41–51. doi: 10.1111/j.1471-4159.1958.tb12607.x. [DOI] [PubMed] [Google Scholar]
- Harris ZL, Takahashi Y, Miyajima H, Serizawa M, MacGillivray RT, Gitlin JD. Aceruloplasminemia: molecular characterization of this disorder of iron metabolism. Proc Natl Acad Sci USA. 1995;92:2539–2543. doi: 10.1073/pnas.92.7.2539. [DOI] [PMC free article] [PubMed] [Google Scholar]
- Harris ZL, Durley AP, Man TK, Gitlin JD. Targeted gene disruption reveals an essential role for ceruloplasmin in cellular iron efflux. Proc Natl Acad Sci USA. 1999;96:10812–10817. doi: 10.1073/pnas.96.19.10812. [DOI] [PMC free article] [PubMed] [Google Scholar]
- Hentze MW, Caughman SW, Rouault TA, Barriocanal JG, Dancis A, Harford JB, Klausner RD. Identification of the iron-responsive element for the translational regulation of human ferritin mRNA. Science. 1987;238:1570–1573. doi: 10.1126/science.3685996. [DOI] [PubMed] [Google Scholar]
- Hentze MW, Muckenthaler MU, Andrews NC. Balancing acts: molecular control of mammalian iron metabolism. Cell. 2004;117:285–297. doi: 10.1016/s0092-8674(04)00343-5. [DOI] [PubMed] [Google Scholar]
- Jefferies WA, Brandon MR, Hunt SV, Williams AF, Gatter KC, Mason DY. Transferrin receptor on endothelium of brain capillaries. Nature. 1984;312:162–163. doi: 10.1038/312162a0. [DOI] [PubMed] [Google Scholar]
- Jeong SY, David S. Glycosylphosphatidylinositol-anchored ceruloplasmin is required for iron efflux from cells in the central nervous system. J Biol Chem. 2003;278:27144–27148. doi: 10.1074/jbc.M301988200. [DOI] [PubMed] [Google Scholar]
- Kalyvas A, David S. Cytosolic phospholipase A2 plays a key role in the pathogenesis of multiple sclerosis-like disease. Neuron. 2004;41:323–335. doi: 10.1016/s0896-6273(04)00003-0. [DOI] [PubMed] [Google Scholar]
- Kandel E, Schwartz J, Jessell T. Ed 4. New York: McGraw-Hill; 2000. Principles of neural science. [Google Scholar]
- Kim S, Ponka P. Control of transferrin receptor expression via nitric oxide-mediated modulation of iron-regulatory protein 2. J Biol Chem. 1999;274:33035–33042. doi: 10.1074/jbc.274.46.33035. [DOI] [PubMed] [Google Scholar]
- Miyajima H, Nishimura Y, Mizoguchi K, Sakamoto M, Shimizu T, Honda N. Familial apoceruloplasmin deficiency associated with blepharospasm and retinal degeneration. Neurology. 1987;37:761–767. doi: 10.1212/wnl.37.5.761. [DOI] [PubMed] [Google Scholar]
- Mizuno S, Mihara T, Miyaoka T, Inagaki T, Horiguchi J. CSF iron, ferritin and transferrin levels in restless legs syndrome. J Sleep Res. 2005;14:43–47. doi: 10.1111/j.1365-2869.2004.00403.x. [DOI] [PubMed] [Google Scholar]
- Moos T. Immunohistochemical localization of intraneuronal transferrin receptor immunoreactivity in the adult mouse central nervous system. J Comp Neurol. 1996;375:675–692. doi: 10.1002/(SICI)1096-9861(19961125)375:4<675::AID-CNE8>3.0.CO;2-Z. [DOI] [PubMed] [Google Scholar]
- Moos T, Morgan EH. Transferrin and transferrin receptor function in brain barrier systems. Cell Mol Neurobiol. 2000;20:77–95. doi: 10.1023/A:1006948027674. [DOI] [PMC free article] [PubMed] [Google Scholar]
- Morita H, Ikeda S, Yamamoto K, Morita S, Yoshida K, Nomoto S, Kato M, Yanagisawa N. Hereditary ceruloplasmin deficiency with hemosiderosis: a clinicopathological study of a Japanese family. Ann Neurol. 1995;37:646–656. doi: 10.1002/ana.410370515. [DOI] [PubMed] [Google Scholar]
- Nedergaard M, Ransom B, Goldman SA. New roles for astrocytes: redefining the functional architecture of the brain. Trends Neurosci. 2003;26:523–530. doi: 10.1016/j.tins.2003.08.008. [DOI] [PubMed] [Google Scholar]
- Okamoto N, Wada S, Oga T, Kawabata Y, Baba Y, Habu D, Takeda Z, Wada Y. Hereditary ceruloplasmin deficiency with hemosiderosis. Hum Genet. 1996;97:755–758. doi: 10.1007/BF02346185. [DOI] [PubMed] [Google Scholar]
- Ousman SS, David S. Lysophosphatidylcholine induces rapid recruitment and activation of macrophages in the adult mouse spinal cord. Glia. 2000;30:92–104. [PubMed] [Google Scholar]
- Patel BN, Dunn RJ, David S. Alternative RNA splicing generates a glycosylphosphatidylinositol-anchored form of ceruloplasmin in mammalian brain. J Biol Chem. 2000;275:4305–4310. doi: 10.1074/jbc.275.6.4305. [DOI] [PubMed] [Google Scholar]
- Patel BN, Dunn RJ, Jeong SY, Zhu Q, Julien JP, David S. Ceruloplasmin regulates iron levels in the CNS and prevents free radical injury. J Neurosci. 2002;22:6578–6586. doi: 10.1523/JNEUROSCI.22-15-06578.2002. [DOI] [PMC free article] [PubMed] [Google Scholar]
- Pietrangelo A. Hereditary hemochromatosis—a new look at an old disease. N Engl J Med. 2004;350:2383–2397. doi: 10.1056/NEJMra031573. [DOI] [PubMed] [Google Scholar]
- Ponka P. Hereditary causes of disturbed iron homeostasis in the central nervous system. Ann NY Acad Sci. 2004;1012:267–281. doi: 10.1196/annals.1306.022. [DOI] [PubMed] [Google Scholar]
- Qian ZM, To Y, Tang PL, Feng YM. Transferrin receptors on the plasma membrane of cultured rat astrocytes. Exp Brain Res. 1999;129:473–476. doi: 10.1007/s002210050916. [DOI] [PubMed] [Google Scholar]
- Rao KV, Panickar KS, Jayakumar AR, Norenberg MD. Astrocytes protect neurons from ammonia toxicity. Neurochem Res. 2005;30:1311–1318. doi: 10.1007/s11064-005-8803-2. [DOI] [PubMed] [Google Scholar]
- Roskams AJ, Connor JR. Transferrin receptor expression in myelin deficient (md) rats. J Neurosci Res. 1992;31:421–427. doi: 10.1002/jnr.490310304. [DOI] [PubMed] [Google Scholar]
- Roth JA, Horbinski C, Feng L, Dolan KG, Higgins D, Garrick MD. Differential localization of divalent metal transporter 1 with and without iron response element in rat PC12 and sympathetic neuronal cells. J Neurosci. 2000;20:7595–7601. doi: 10.1523/JNEUROSCI.20-20-07595.2000. [DOI] [PMC free article] [PubMed] [Google Scholar]
- Rouault TA, Tong WH. Iron-sulphur cluster biogenesis and mitochondrial iron homeostasis. Nat Rev Mol Cell Biol. 2005;6:345–351. doi: 10.1038/nrm1620. [DOI] [PubMed] [Google Scholar]
- Santos MM, de Sousa M, Rademakers LH, Clevers H, Marx JJ, Schilham MW. Iron overload and heart fibrosis in mice deficient for both beta2-microglobulin and Rag1. Am J Pathol. 2000;157:1883–1892. doi: 10.1016/s0002-9440(10)64827-4. [DOI] [PMC free article] [PubMed] [Google Scholar]
- Saunders NR, Habgood MD, Dziegielewska KM. Barrier mechanisms in the brain. I. Adult brain. Clin Exp Pharmacol Physiol. 1999;26:11–19. doi: 10.1046/j.1440-1681.1999.02986.x. [DOI] [PubMed] [Google Scholar]
- Smith MA, Harris PL, Sayre LM, Perry G. Iron accumulation in Alzheimer disease is a source of redox-generated free radicals. Proc Natl Acad Sci USA. 1997;94:9866–9868. doi: 10.1073/pnas.94.18.9866. [DOI] [PMC free article] [PubMed] [Google Scholar]
- Takahashi Y, Miyajima H, Shirabe S, Nagataki S, Suenaga A, Gitlin JD. Characterization of a nonsense mutation in the ceruloplasmin gene resulting in diabetes and neurodegenerative disease. Hum Mol Genet. 1996;5:81–84. doi: 10.1093/hmg/5.1.81. [DOI] [PubMed] [Google Scholar]
- Ueda F, Raja KB, Simpson RJ, Trowbridge IS, Bradbury MW. Rate of 59Fe uptake into brain and cerebrospinal fluid and the influence thereon of antibodies against the transferrin receptor. J Neurochem. 1993;60:106–113. doi: 10.1111/j.1471-4159.1993.tb05828.x. [DOI] [PubMed] [Google Scholar]
- Vitellaro-Zuccarello L, Mazzetti S, Bosisio P, Monti C, De Biasi S. Distribution of Aquaporin 4 in rodent spinal cord: relationship with astrocyte markers and chondroitin sulfate proteoglycans. Glia. 2005;51:148–159. doi: 10.1002/glia.20196. [DOI] [PubMed] [Google Scholar]
- Volterra A, Meldolesi J. Astrocytes, from brain glue to communication elements: the revolution continues. Nat Rev Neurosci. 2005;6:626–640. doi: 10.1038/nrn1722. [DOI] [PubMed] [Google Scholar]
- Williams DM, Lee GR, Cartwright GE. Ferroxidase activity of rat ceruloplasmin. Am J Physiol. 1974;227:1094–1097. doi: 10.1152/ajplegacy.1974.227.5.1094. [DOI] [PubMed] [Google Scholar]
- Williams K, Wilson MA, Bressler J. Regulation and developmental expression of the divalent metal-ion transporter in the rat brain. Cell Mol Biol (Noisy-le-grand) 2000;46:563–571. [PubMed] [Google Scholar]
- Wu LJ, Leenders AG, Cooperman S, Meyron-Holtz E, Smith S, Land W, Tsai RY, Berger UV, Sheng ZH, Rouault TA. Expression of the iron transporter ferroportin in synaptic vesicles and the blood-brain barrier. Brain Res. 2004;1001:108–117. doi: 10.1016/j.brainres.2003.10.066. [DOI] [PubMed] [Google Scholar]
- Xu X, Pin S, Gathinji M, Fuchs R, Harris ZL. Aceruloplasminemia: an inherited neurodegenerative disease with impairment of iron homeostasis. Ann NY Acad Sci. 2004;1012:299–305. doi: 10.1196/annals.1306.024. [DOI] [PubMed] [Google Scholar]
- Yoshida K, Furihata K, Takeda S, Nakamura A, Yamamoto K, Morita H, Hiyamuta S, Ikeda S, Shimizu N, Yanagisawa N. A mutation in the ceruloplasmin gene is associated with systemic hemosiderosis in humans. Nat Genet. 1995;9:267–272. doi: 10.1038/ng0395-267. [DOI] [PubMed] [Google Scholar]
- Zecca L, Gallorini M, Schunemann V, Trautwein AX, Gerlach M, Riederer P, Vezzoni P, Tampellini D. Iron, neuromelanin and ferritin content in the substantia nigra of normal subjects at different ages: consequences for iron storage and neurodegenerative processes. J Neurochem. 2001;76:1766–1773. doi: 10.1046/j.1471-4159.2001.00186.x. [DOI] [PubMed] [Google Scholar]
- Zecca L, Youdim MB, Riederer P, Connor JR, Crichton RR. Iron, brain ageing and neurodegenerative disorders. Nat Rev Neurosci. 2004;5:863–873. doi: 10.1038/nrn1537. [DOI] [PubMed] [Google Scholar]