

Abstract
To successfully accomplish a behavioral goal such as reaching for an object, an animal must solve two related problems: to decide which object to reach and to plan the specific parameters of the movement. Traditionally, these two problems have been viewed as separate, and theories of decision making and motor planning have been developed primarily independently. However, neural data suggests that these processes involve the same brain regions and are performed in an integrated manner. Here, a computational model is described that addresses both the question of how different potential actions are specified and how the brain decides between them. In the model, multiple potential actions are simultaneously represented as continuous regions of activity within populations of cells in frontoparietal cortex. These representations engage in a competition for overt execution that is biased by modulatory influences from prefrontal cortex. The model neural populations exhibit activity patterns that correlate with both the spatial metrics of potential actions and their associated decision variables, in a manner similar to activities in parietal, prefrontal, and premotor cortex. The model therefore suggests an explanation for neural data that have been hard to account for in terms of serial theories that propose that decision making occurs before action planning. In addition to simulating the activity of individual neurons during decision tasks, the model also reproduces key aspects of the spatial and temporal statistics of human choices and makes a number of testable predictions.
Keywords: decision making, planning, cognition, cerebral cortex, computational model, neural coding
Introduction
Traditional psychological theories have viewed decision making as a higher cognitive process that is separate from the neural systems of perception and action (Tversky and Kahneman, 1981). Likewise, most models assume that action planning is separate from cognitive processes and begins only after a decision is made (Flash and Hogan, 1985; Kawato et al., 1990; Mel, 1991; Bhushan and Shadmehr, 1999). However, a growing body of neurophysiological data show decision-related activity in many of the same neural regions generally implicated in sensorimotor processing and action planning, such as premotor and parietal cortex (Platt and Glimcher, 1999; Gold and Shadlen, 2000; Hoshi et al., 2000; Roesch and Olson, 2004; Romo et al., 2004; Sugrue et al., 2004; Cisek and Kalaska, 2005). These observations have led to persistent debates regarding the functional role of some of these regions. For example, strong experimental results have placed the lateral intraparietal area (LIP) within the category of perception (Kusunoki et al., 2000), cognition (Platt and Glimcher, 1999), or action planning (Snyder et al., 1997), without a clear way to reconcile these findings.
A pragmatic perspective may shed some light on these issues. For example, for a primate to successfully accomplish a behavioral goal such as reaching for a piece of fruit, it must solve two related problems: to select which fruit to reach for and to specify the parameters of the reach, such as its direction and extent. Although each of these problems can be studied in isolation, the brain must ultimately solve them in an integrated manner. To decide, one must have a set of alternatives to decide between, and, in many real-world situations, those alternatives are concrete actions. If representations of several potential actions are generated simultaneously, then their predicted consequences can be estimated and used for selection. Thus, an integrated system that simultaneously specifies multiple potential actions and selects between them may implement the kind of decision making that is arguably fundamental for real-time behavior.
Below, a computational model is developed based on the proposal that action specification and selection take place through a single unified mechanism. In the model, a cell tuned to a specific value of some spatial parameter of movement is active in proportion to sensory and cognitive information favoring the selection of actions with that specific parameter value. A population of such cells implements a representation akin to a probability density function of potential action parameters (Erlhagen and Schöner, 2002; Sanger, 2003; Knill and Pouget, 2004). As the model illustrates, this mixed representation can be used to solve, in parallel, both the problem of specifying the spatial metrics of a potential action (an aspect of planning) and the problem of selecting between different potential actions (decision making). This explains why cell activity in premotor and parietal cortical regions correlates with both spatial and cognitive variables. Simulations show that model populations behave very much like cells recorded from the cerebral cortex of monkeys performing reach-decision tasks, and the behavior of the model as a whole exhibits the spatial and temporal trends of human decision-making behavior.
Materials and Methods
The model described below is a systems-level model aimed at explaining and predicting systems-level phenomena such as response patterns over large populations of neurons. It is not intended to simulate neural activity at a detailed level of physiological realism or to capture data on cortical layers, cell types, and the spiking behavior of individual cells. The mathematical equations used significantly simplify the operations that may actually take place in the nervous system. This is done to make it possible to simulate activity of populations of neurons in several regions of the cerebral cortex and to make predictions on how those populations of cells will behave in novel experimental situations.
The model was implemented as a set of equations describing the activity of several populations of neurons that correspond to specific regions of the cerebral cortex. Each population is organized as a layer of neurons that are tuned to spatial directions of potential actions. The activity in each population is intended to capture features of activity observed in the corresponding cortical region during neurophysiological experiments. The connections between layers are hardwired and organized to respect basic neuroanatomical connection patterns.
Figure 1a illustrates the circuit model and how its elements correspond to specific cortical regions. Each neural population was simulated as a set of 90 “mean-rate leaky-integrator” neurons that behave according to an equation of the following form (Grossberg, 1973):
 |
where X is the mean firing rate of a given neuron, dX/dt is the change in that rate over time, E is the excitatory input, I is the inhibitory input, α is a decay rate, β is the maximum activity of the neuron, γ is the excitatory gain, and Θ is Gaussian noise. In other words, this equation defines how the activity of a neuron changes over time as a function of four terms: passive decay (first term), excitation toward saturation (second term), inhibition (third term), and noise (fourth term). Ninety neurons were used in each layer to provide good directional resolution for specifying potential actions. Although the dynamics of all cells in all layers were similar, they exhibited different properties attributable to differences in their excitatory and inhibitory connections. Detailed equations describing cell behavior, connectivity, and analysis of parametric robustness are described in the supplemental data (available at www.jneurosci.org as supplemental material).
Figure 1.

Computational model. A, Network architecture. Each layer consists of neurons with different directional preferences, and different layers are connected with recurrent topographic projections. Neurons along the frontoparietal stream (PPC–PMd–M1) have high directional resolution but no color sensitivity. In contrast, neurons in the PFC combine color sensitivity and low directional resolution. B, Within each of the frontoparietal layers, cells with similar directional preferences excite each other, whereas cells with different preferences mutually inhibit each other. The plot shows how this influence varies as a function of the difference in preferred direction. The thickness of the line illustrates the magnitude of random variations. C, The influence of a PMd cell on its neighbor is plotted as a function of its activity.
Although the details of the mathematical equations are interesting, they are not the major goal of this modeling study. The major goal is to make explicit a set of hypotheses on how action planning and decision making take place in the cerebral cortex. There are four hypotheses of central interest.
Neural populations do not each encode only a unique value of the output parameters of a given movement. Instead, they encode entire ranges of potential values of movement parameters using a distributed activation code in which each individual cell is tuned to a specific value of a given movement parameter (e.g., direction), and its level of activity is related to the sensory and cognitive information favoring actions with that particular parameter value (Cisek, 2001; Erlhagen and Schöner, 2002; Sanger, 2003; Knill and Pouget, 2004).
Sensory information from the dorsal visual stream is transformed to specify the spatial parameters of several currently available potential actions in parallel. These potential actions are represented simultaneously in the activity of neurons in frontal and parietal cortical regions (Platt and Glimcher, 1997; Cisek and Kalaska, 2005).
Representations of potential actions compete against each other, at several points along the sensorimotor continuum, through mutual inhibition between cells with different parameter preferences. This is related to the biased competition mechanism used in theories of visual attention (Desimone, 1998; Boynton, 2005).
The competition is biased by a variety of influences from other regions, including the prefrontal cortex (PFC) (Miller, 2000; Tanji and Hoshi, 2001) and the basal ganglia (Redgrave et al., 1999), which accumulate information on a slower timescale.
The implementation of these four hypotheses is described below.
Hypothesis 1: representation of actions in neural populations.
In the model, neural populations do not represent a unique value of a movement parameter, such as a single direction in space, but can represent an entire distribution of potential movement parameters. This proposal is related to the attention model of Tipper et al. (2000), the “decision field” theory of Erlhagen and Schöner (2002), and the “Bayesian coding” hypothesis (Dayan and Abbott, 2001; Sanger, 2003; Knill and Pouget, 2004). It suggests that, given a population of cells, each with a preferred value of a particular movement parameter, one can interpret the activity across the population as something akin to a probability density function of potential values of that parameter (Fig. 2). For example, if some cell population encodes movements in a spherical coordinate system centered on the hand, then the activity of a cluster of cells with particular preferences for the values of azimuth and elevation would indicate the possibility of moving in that direction (Fig. 2b). In some cases (Fig. 2c, top), the population may encode a range of contiguous values defining a single action. In other cases (Fig. 2c, bottom), several distinct and mutually exclusive potential actions can be represented simultaneously as distinct peaks of activity in the population. The strength of the activity associated with a particular value of the parameter reflects the likelihood that the final action will have that value, and it is influenced by a variety of factors, including salience, expected reward, estimates of probability, etc. (see hypothesis 4). In the language of Bayesian coding (Dayan and Abbott, 2001; Sanger, 2003; Knill and Pouget, 2004), the population represents the conditional probability density function for different directions of movement. Therefore, activity in the population is correlated with many decision variables, as observed in frontal and parietal cortex (Kim and Shadlen, 1999; Platt and Glimcher, 1999; Gold and Shadlen, 2000; Hoshi et al., 2000; Shadlen and Newsome, 2001; Coe et al., 2002; Glimcher, 2003; Ratcliff et al., 2003; Dorris and Glimcher, 2004; Roesch and Olson, 2004; Romo et al., 2004; Sugrue et al., 2004; Janssen and Shadlen, 2005). However, it is not interpreted as an explicit encoding of any of those variables because it is never decoded to retrieve them. Thus, although the population behaves very much like a “salience map” (Kusunoki et al., 2000), it is not interpreted as a purely sensory representation (see Discussion).
Figure 2.

Distributed representation of multiple potential actions. A, The presence of two objects within reach (colored spheres) specifies a variety of potential directions for reaching actions (arrows). B, These potential actions can be simultaneously encoded within a population of neurons sensitive to specific parameters of movement (e.g., azimuth and elevation). This is shown as a map in which individual cells (circles) lie at points determined by their preference for particular values of those parameters. A given pattern of cell activities within the population defines contiguous regions of activity on this map, corresponding to particular reaching actions (colored regions). C, The activity across a population of cells can represent a single potential action (top) or it can specify several potential actions as separate peaks of activity (bottom). Narrow peaks define actions with high levels of precision, whereas broad peaks can be used to specify a parameter more vaguely. The magnitude of activity of a given peak indicates the likelihood that the final selected action will have the parameter values specified by that peak.
This concept of distributed representation is very general and can be used to represent the metrics of potential actions in a variety of coordinate systems. Different neural populations in different brain regions can encode movements in different coordinate systems with adaptive mappings converting information from one to another. Although this is an important future extension of the model, in the present treatment, the issue is not addressed. For simplicity, we will consider all model populations to represent targets and movements in terms of the direction from the hand to an object, coded in extrinsic coordinates. This is not meant as a hypothesis on the coordinate systems actually used by cortical brain regions; it is simply a way of leaving the issue unaddressed because it is orthogonal to the issues being addressed here.
Hypothesis 2: specification of multiple potential actions.
The model receives two kinds of external inputs: (1) visual information about objects in the environment; and (2) a Go signal. Visual information consists of a vector of binary values indicating the presence or absence of an object of a particular category at a particular location. Cells in the posterior parietal cortex (PPC) process visual information with high resolution (sensitive to 4° of direction) but are insensitive to category information. PPC cells also receive feedback excitation from the dorsal premotor cortex (PMd). Lateral interactions within PPC involve mutual excitation from neighboring cells with a similar preferred direction (PD) and inhibitory input from cells with different PDs (Fig. 1b). Because of this on–center–off–surround architecture, visual input is contrast enhanced (Grossberg, 1973), forming distinct broad peaks centered on the directions to given objects. PMd was simulated in a similar manner, receiving excitatory input from “upstream” PPC cells as well as feedback excitation from “downstream” regions, and included lateral interactions within PMd. These populations can therefore represent multiple potential actions (Fig. 2c), as a set of bell-shaped peaks in neural activity (constrained by the on–center–off–surround lateral interactions), although they cannot encode fully arbitrary probability density functions. Note that, although the physical presence of lateral interactions in frontal motor regions has not been established, it is suggested by some neural response phenomena (Georgopoulos et al., 1993; Cisek and Kalaska, 2005).
Importantly, the input to PMd from PPC is modulated by biasing signals from PFC, as described below. These features of the model architecture capture basic patterns of neuroanatomy, including the divergence of the visual system into dorsal and ventral streams (Milner and Goodale, 1995) and the reciprocal topographic connections between frontal and parietal cortex (Johnson et al., 1996; Rizzolatti and Luppino, 2001).
Because of reciprocal connections between PPC and PMd, both regions exhibit similar responses to visual inputs specifying potential targets for movement. These responses persist even after the targets disappear as a result of positive feedback between PPC and PMd. If multiple potential targets are presented, distinct peaks of activity will appear, first in PPC and then in PMd, representing the potential actions of moving to each of these targets. Because of lateral interactions within both PPC and PMd, these peaks of activity will compete against each other, but, in the absence of information favoring one over the other, their influence will be balanced.
Hypothesis 3: competition between potential actions.
The nature of the interaction among cells within individual layers of the model is critical to its behavior. Because neural activities are noisy, competition between distinct peaks of activity cannot follow a simple “winner-take-all” rule or random fluctuations would determine the winner each time, rendering informed decision making impossible. To prevent this, small differences in levels of activity should be ignored by the system. However, if activity associated with a given choice becomes sufficiently strong, it should be allowed to suppress its opponents and conclusively win the competition. In other words, there should be a threshold of activity above which a particular peak is selected as the final response choice. As described by Grossberg (1973), implementing such resistance to noise as well as a decision threshold within a competitive network can be done using a nonlinear function defining interactions between neighboring cells. The function used here is of the form shown in Figure 1c. When two or more peaks are present in the population and have low levels of activity, their influence on each other de-emphasizes differences between their activities. Thus, neither peak exerts inhibitory influence on the other strongly enough to overcome the positive feedback that sustains each peak. However, once one activity peak increases, it begins to exert stronger and stronger suppression on its opponents, thus winning the competition. The point at which a given peak becomes the winner is called a “quenching threshold” (Grossberg, 1973), and it effectively acts as a threshold for committing to a particular decision. Unlike classical models of decision thresholds and reaction time (RT) (Carpenter and Williams, 1995; Mazurek et al., 2003; Smith and Ratcliff, 2004), the quenching threshold is not a preset constant but an emergent threshold that depends on the number of choices, their relative and absolute strengths, and even the angular distance between them.
Hypothesis 4: biasing influences.
The competition between potential actions can be biased by modulatory input from a variety of sources. This could include attentional modulation in the visual system (Boynton, 2005), reward prediction signals from the basal ganglia and orbitofrontal cortex (Schultz, 2004), or inputs from the PFC that collect evidence in favor of a particular choice. The present model includes only one source of biasing, from the lateral PFC, which exhibits two basic features. First, it is sensitive to conjunctions of relevant sensory and cognitive information, as shown in a number of studies of PFC neurons (Rainer et al., 1998; White and Wise, 1999; Miller, 2000; Tanji and Hoshi, 2001). Second, PFC activity gradually accumulates at a rate proportional to the strength of evidence for a given choice (Kim and Shadlen, 1999).
The present model does not propose hypotheses on how PFC cells learn to detect relevant information or how their dynamics produce the gradual accumulation. These properties are simply wired into the model (supplemental data, available at www.jneurosci.org as supplemental material) by separating PFC cells into two populations sensitive to two categories of visual input (red or blue) and giving them very low spatial resolution (40° of angle) and slow dynamics relative to PMd and PPC. For a more detailed model of PFC working memory, see Compte et al. (2000), and, for a more realistic implementation of robust neural integration, see Goldman et al. (2003). Because the dynamics of model PFC cells are slow, their activity gradually grows whenever they are presented with inputs that match their spatial preference, their category preference, or both. Thus, they integrate over time the total evidence in favor of a particular choice of action. If the evidence is stronger for one action than for another, PFC cells will bias the competition within PMd until the quenching threshold is reached and a decision is made.
Thus, the model suggests that, although the decision is strongly influenced by “votes” arriving from PFC, it is actually made in premotor cortex, in agreement with recent evidence (Wallis and Miller, 2003; Romo et al., 2004). If the model were to include multiple sources of biasing influencing the same frontoparietal competition, those sources would not always all favor the same choice. In this case, the final decision would be determined by the strongest biasing influence arriving in frontoparietal regions at a given time.
The formation of a decision is not perforce expressed as an overt action. There is a separate source of input to the model: a Go signal (Cisek et al., 1998) that modulates the strength of the PMd projection into the primary motor cortex (M1). If the Go signal is nonzero, the pattern of activity in PMd flows into M1. However, lateral interactions within M1 are more strongly competitive than those in PMd (supplemental data, available at www.jneurosci.org as supplemental material), and multiple peaks of activity cannot survive in M1. Thus, activation of M1 forces the system to make a choice, regardless of the possible presence of multiple PMd peaks.
Results
Simulations of neurophysiological data
Simulations of neurophysiological data presented here focus on reach-decision tasks studied by Cisek and Kalaska (2005), although they are also relevant to a large number of other studies (Platt and Glimcher, 1997; Snyder et al., 1997; Basso and Wurtz, 1998; Schall and Bichot, 1998; Kim and Shadlen, 1999; Platt and Glimcher, 1999; Gold and Shadlen, 2000; Hoshi et al., 2000; Coe et al., 2002; Wallis and Miller, 2003; Roesch and Olson, 2004; Romo et al., 2004). In these experiments, monkeys were trained to use a handle to move a cursor from a central circle to one of eight peripheral targets. The correct target was indicated through a series of instructed-delay periods, in three task variations. In the two-target task (2-T task) (Fig. 3a), two possible target locations were presented during the spatial-cue (SC) period, and one of them was later indicated as the correct target by a nonspatial color cue (CC). In the one-target task (1-T task) (Fig. 3b), only a single spatial cue appeared, and thus the monkey knew right away the correct target. In the matching task (MS task) (see Fig. 5a), the color cue appeared first, and, thus when the spatial cues later appeared, the monkey knew immediately which one was correct.
Figure 3.
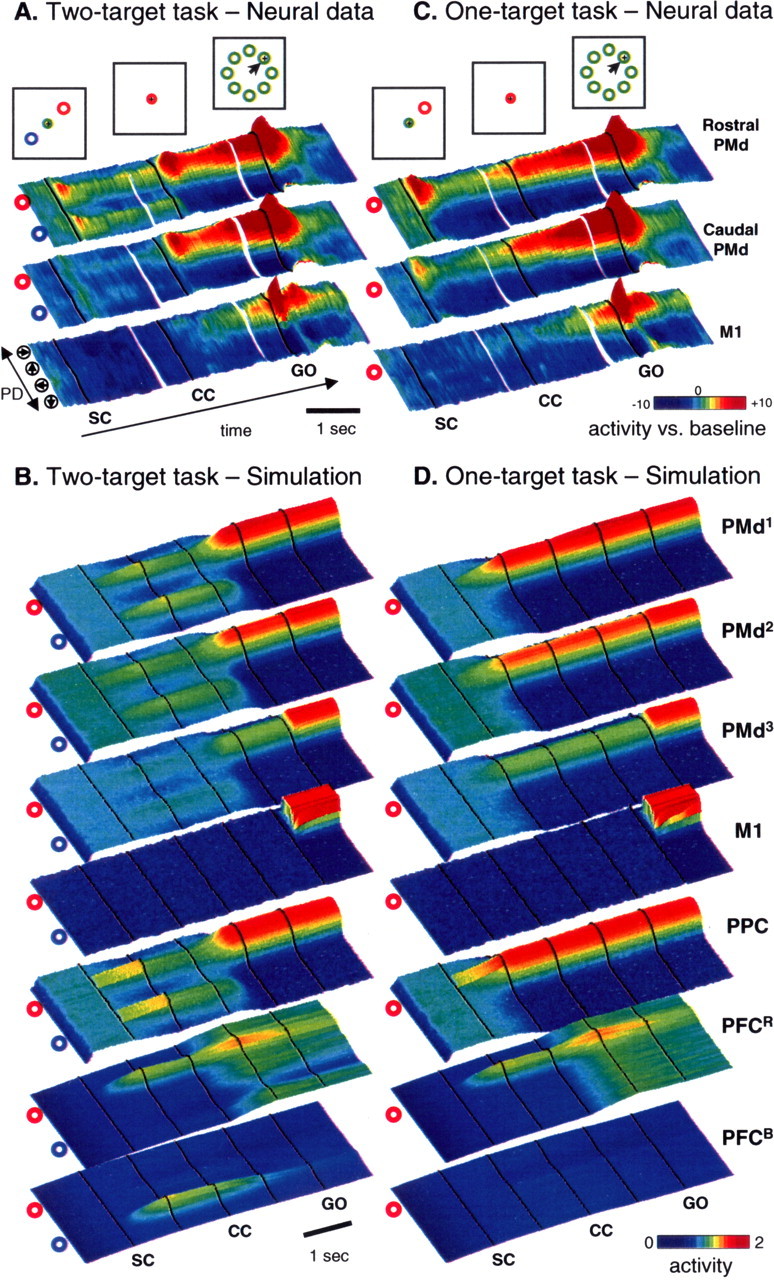
Comparison of model cell activity with neural activity in PMd and M1 during two reaching tasks. A, Neural population data from PMd and M1 of two monkeys performing the two-target task (Cisek and Kalaska, 2005). Examples of the stimuli viewed by the monkeys are shown at the top. In each three-dimensional color panel, average activity of cells with a given PD is plotted along the shorter side, and 10 ms slices of time are plotted along the long side. Color indicates change in firing from baseline (see scale). From left to right, panels are aligned on SC onset, CC onset, and Go signal. The top row shows activity from the rostral part of PMd, the middle row from caudal PMd, and the bottom row from M1. B, Simulation of the two-target task. As in the neural data, activity is represented in colored panels with time along the long axis and cells sorted by PD along the short axis. Activity in all seven model populations is shown. In the simulation, the two targets were presented (SC; 1st black line) at the two locations indicated to the left of each panel (activating visual units i = 21… 29, and i = 61… 69) and then disappeared (2nd black line). The CC (3rd black line) was simulated as uniform excitation to the red-preferring PFC population and then turned off (4th black line). Finally, the Go signal was given (5th black line). C, Neural population data during the one-target task, with the same format as in A. D, Simulation of the one-target task, with the same format as in B.
Figure 5.
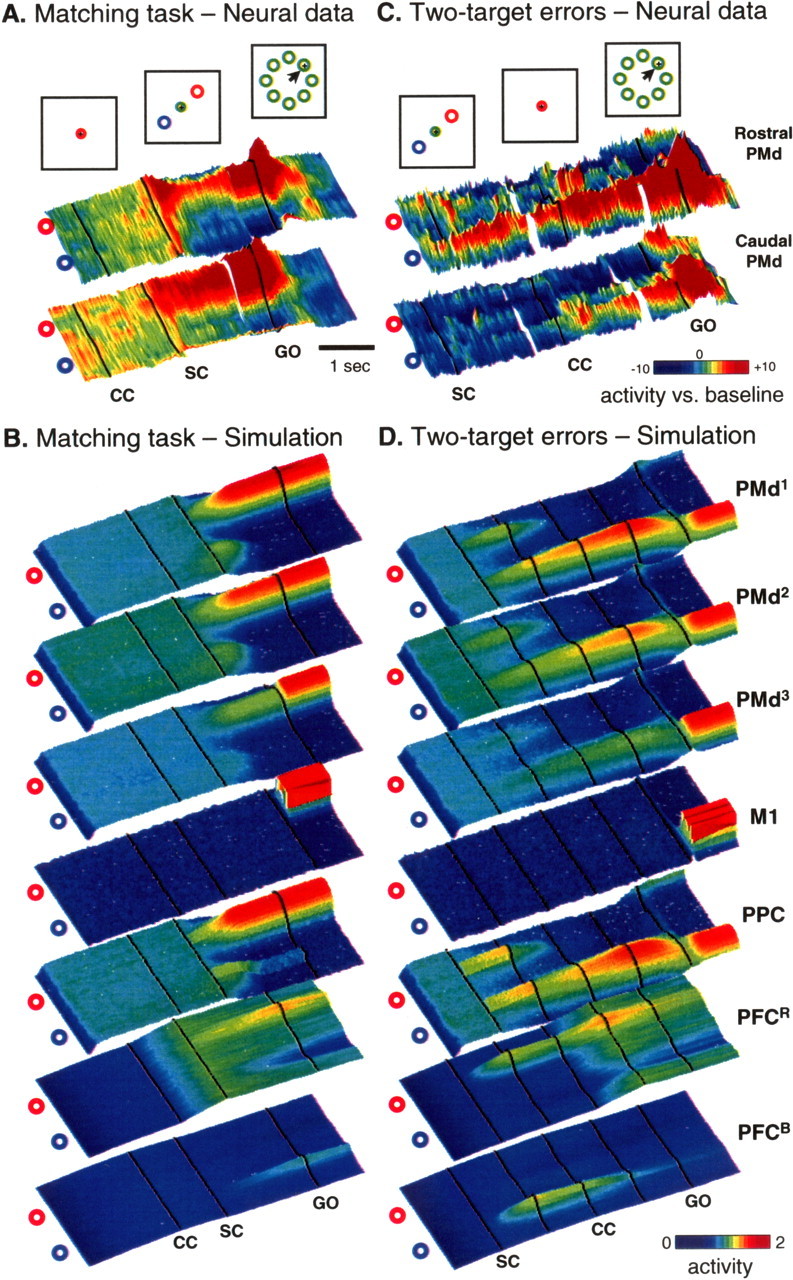
Simulation of the matching task and two-target task errors. A, Neural data from PMd of two monkeys performing the matching task (Cisek and Kalaska, 2005), with same format as in Figure 3A. B, Simulation of the matching task. In the simulation, a uniform excitation was given to the red-preferring PFC population (CC; 1st black line), followed by presentation of the two targets (SC; 2nd black line). C, Neural data from PMd during trials in which the monkeys made an error in the two-target task, ultimately moving to the wrong target. D, A simulation of the two-target task, with parameters and inputs identical to those in Figure 3B. In this run of the simulation, noise caused the model to make an error and select the wrong target.
Figure 3a shows neural population activity from PMd and M1 of two monkeys during the 2-T task (Cisek and Kalaska, 2005). During the SC period, two populations of PMd cells are active simultaneously and remain active even after the targets disappear. This bimodal pattern of activity is stronger in the rostral part of PMd than in the caudal part. After the CC, one of these becomes more active whereas the other is suppressed. The population that remains active predicts the monkey's upcoming choice in both correct and error trials. Similar results were seen in parietal area 5 during the 2-T task (Cisek et al., 2004). Cisek and Kalaska (2005) interpreted this as evidence that the brain performs sensorimotor processing to represent multiple potential actions simultaneously before selecting between them. Note that, because the CC lasted two seconds on average, the monkeys were not forced to prespecify multiple actions but could have simply stored the sensory information in memory and then have ample time to make a decision before converting the information to specify a single action. Nevertheless, both monkeys appeared to naturally use a strategy of simultaneous specification.
The model simulation exhibits many of the same phenomena. During the SC period of the 2-T task, model PMd and PPC populations simultaneously encode both potential targets (Fig. 3b). These activities are maintained after the visual input turns off because of the positive feedback between PPC and PMd (as verified by simulations in which the reciprocal connections are reduced in gain; data not shown). Thus, the model can maintain a “working memory” of the stimulus information. These two regions of activity compete against each other in both PPC and PMd through lateral inhibitory connections within each layer. The interlayer positive feedback and intralayer inhibition is balanced and resistant to the fluctuations caused by various sources of noise in the model. In the PFC, the SC input caused activity in two sets of cells, one corresponding to each stimulus category (red or blue). When the CC appeared, it was simulated by presenting all of the cells in PFC that prefer the selected category, regardless of their spatial preference, with additional excitation. In the simulation shown in Figure 3b, this causes all PFCR cells to gradually increase their activity, giving a competitive advantage to one of the regions of activity in PMd. Once this bias grows strong enough to cross the quenching threshold, the selected PMd region dramatically increases its activity, suppressing the competing region. In the model, this corresponds to the commitment to a decision. When the Go signal is turned on, the PMd activity is allowed to flow into M1, initiating the movement. This process is very abrupt in the model, unlike in the data that exhibited a gradual buildup of activity over time. It is possible that such buildup is related to the anticipation of the occurrence of the Go signal (Hanes and Schall, 1996; Janssen and Shadlen, 2005), which may bring the motor system closer to the threshold for initiating movement. The model does not presently attempt to simulate this buildup process, nor does it simulate movement-related activity.
In addition to capturing the major features of delay-period activity in PMd and PPC, the model also reproduces the rostrocaudal gradient of activity seen in PMd (Cisek and Kalaska, 2005) (Fig. 3a). Despite the fact that all of the PMd layers in the model were reciprocally connected, obeyed the same equations, and had the same parameters and intralayer interactions, their patterns of activity showed clear differences. The top PMd layer showed strong bimodal activity during the SC period of the 2-T task. This bimodal activity was progressively weaker in the downstream layers (Fig. 3b). Simulation of this rostrocaudal trend is the reason why three PMd layers were included in the model.
In the 1-T task, a single SC is presented and the CC provides no new information. Consequently, only a single population becomes active in PMd in both the data (Fig. 3c) and the model (Fig. 3d). There is no response to the presentation of the CC. The response of a PMd cell to the appearance of a cue in its PD was lower if another cue was presented elsewhere, and the SC tuning functions of cells were narrower in the 2-T than the 1-T task (Cisek and Kalaska, 2005). In the model, both of these phenomena are obtained (Fig. 4) and are reminiscent of observations that cell activity is lower under conditions of uncertainty (Basso and Wurtz, 1998; Cisek and Kalaska, 2005). The model does not currently attempt to simulate the transient overshoot in response to SC presentation in 2-T and 1-T tasks (Fig. 3a,c).
Figure 4.

Tuning functions during the spatial-cue period of the one-target (dotted line) and two-target (solid line) tasks, plotted as a polar plot that is aligned to the preferred direction of each cell. A, Average tuning function of cells in rostral PMd (Cisek and Kalaska, 2005). B, Tuning functions from the PMd1 model population.
Figure 5a shows neural activity during the MS task. Although there was an increase of activity during the CC in this task, the activity pattern did not become directionally tuned until the SC was presented. At this point, the PMd population exhibited a brief bimodal response to both targets, but, within 130 ms, this response became unimodal and tuned to the correct selected target (Cisek and Kalaska, 2005). In other words, despite the continuous presence of two stimuli that were identical to the stimuli during the SC period of the 2-T task, in the SC period of the MS task, the PMd response was primarily unimodal (compare Figs. 3a, 5a). The model exhibited similar patterns of activity (Fig. 5b). In particular, it also showed a brief response to the unselected target just after the SC, and this was later suppressed by the activity from the selected target that dominated the SC period.
It is interesting to consider how the model can make errors. There are many sources of noise in the model, and these can have a particularly strong influence during the SC period of the 2-T task, when two regions of activity are competing against each other. The quenching dynamics described above help the model to resist that noise, but they cannot eliminate it completely. In some cases, random fluctuations of activity can accumulate enough such that one of the PMd peaks crosses the quenching threshold before the CC, possibly causing the wrong target to be selected. Figure 5d shows an example of a simulation of the 2-T task (using the same parameters and inputs as that of Fig. 3b) in which noise happened to unbalance the competition such that the incorrect target was selected. It is interesting to note that, when neural data from 2-T error trials was analyzed, PMd activity also tended to exhibit a strong bias in favor of the incorrect target before the CC (Cisek and Kalaska, 2005) (Fig. 5c). This suggests that decision-making errors in the brain may sometimes be caused by a similar unfortuitous biasing of a competition between options. In the model, the bias is attributable entirely to noise, although in the brain, there are many other factors that can contribute to biases and errors.
Simulations of behavioral phenomena
In addition to reproducing many features of neural activity during reach-decision tasks, the model was used to simulate important psychophysical results on the spatial and temporal statistics of human motor decisions. For example, Ghez et al. (1997) presented human subjects with several choices of reach targets and asked them to begin moving at the end of a countdown of auditory cues. The correct target for the reach was indicated only a short time before that final Go signal, giving the subjects little time to respond to the cue and compelling them to prepare for movement, and possibly for several movements, in advance. When the interval between the choice cue and initiation of movement stimulus-response (SR) interval was <80 ms, an interesting phenomenon was seen: if the targets were >60° apart, subjects chose them randomly; if the targets were closer together, subjects initially moved between them. This suggests that human planning may use a continuous mode when targets are close and a discrete mode when targets are far apart (Ghez et al., 1997). These modes of operation can occur at the same time when there are several targets present, some close to each other and some far apart (Favilla, 1997). The model suggests how both of these modes of operation are emergent properties of a single underlying mechanism (as also proposed by Erlhagen and Schöner, 2002).
If targets are close together, then the peaks of activity they produce will coalesce into a single broad plateau because of positive feedback between cells with similar PDs (Fig. 6a). If the Go signal is given quickly, then activity will be allowed to grow in M1, producing a peak of activity that tends to be between the targets (Fig. 6a, left). If the incorrect target vanishes long before the Go signal is given, then this peak will have time to shift toward the correct target (Fig. 6a, right). If the targets are farther apart, then they will generate distinct competing peaks (Fig. 6b). In this case, if the Go signal is given before the correct peak can gain a substantial advantage in this competition, then activity will be allowed to grow in M1. The strong winner-take-all dynamics of M1, which influence PMd through reciprocal connections, will force the selection of whichever peak happened to fluctuate higher at the time. This will produce errors 50% of the time. Figure 6c shows the distribution of initial directions produced by human subjects performing an isometric version of the task. As shown in Figure 6d, when the model was simulated under similar conditions, the distributions of initial directions (indicated by the location of the initial peak of M1 activity) showed similar general trends.
Figure 6.
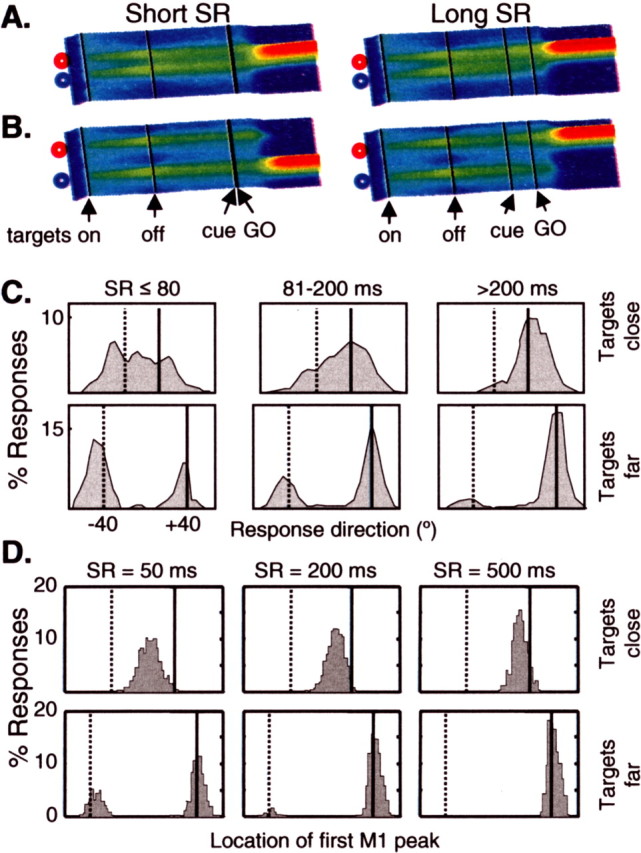
Spatial distribution of reaching choices. A, Simulated activity from PMd1 when two nearby targets appear (1st black line) and then vanish (2nd black line), and then the red target is flashed (cue; 3rd black line) shortly before the Go signal (4th black line). On the left is a trial in which the cue appears 20 ms before the Go signal, and on the right, a trial in which the cue is presented 300 ms before the Go signal. B, Same as A, except with targets farther apart. C, Distribution of initial reach directions of humans in an isometric variant of the timed-response task (Ghez et al., 1997) for two different target separations and three different SR intervals. Solid line, Correct direction; dotted line, wrong direction. D, Distribution of the location of the first peak in M1 during simulations of the timed-response task, also for two target separations, and three SR intervals.
Figure 7 shows simulations of two key findings regarding RTs during decision tasks. First, because the rate at which model PFC cells accumulate activity is dependent on the magnitude of the decision cue and on noise, the model reproduces a key result on the distributions of reaction times: weaker cues result in later and broader distributions than stronger cues (Fig. 7a). Although this is not a novel result, it shows that the model is compatible in an important way with a variety of accumulation-to-threshold models (Mazurek et al., 2003; Ratcliff et al., 2003; Reddi et al., 2003; Smith and Ratcliff, 2004) that have been used to explain data on RT distributions in saccadic decision tasks (see Discussion).
Figure 7.

Simulations of timing phenomena. A, Distributions of decision latencies produced by the model in the 2-T task with two different magnitudes (M) of the color cue. These latencies were calculated by finding the first time step, after the color cue, at which the PMd1 population crossed an activity threshold of 1.5. B, Reaction time (mean and SE) during four conditions (from left to right): when three cues are presented 80° apart (i.e., spanning 160°) 0.8 s before the target, when two cues are presented 160° apart, when two cues are presented 80° apart, and when no cues are presented until the target and GO signal are given.
Second, the present model also simulates a phenomenon that cannot be explained by models of decision making that use discrete units to represent the choices. It is well known that reaction times in choice tasks increase with the number of cues. These findings are compatible with many models of decision making (Shafir and Tversky, 1995; Roe et al., 2001; Usher and McClelland, 2001). However, Bock and Eversheim (2000) showed that it is not the number of cues that determines RTs but rather the spatial angle that they subtend. In other words, the RT is the same whether two or three targets span a given angle. However, if two targets are placed closer together, then the RT is shorter than if those two targets are far apart. Figure 7b shows the average RT from model simulations in four conditions: three cues spanning a large angle; two cues spanning that same large angle; two cues spanning a small angle; and no cues at all. This simulation qualitatively reproduces the result shown in Figure 3 of Bock and Eversheim (2000). The present model reproduces this result because reaction time is determined by the level of activity in a distributed population, and this is itself dependent not only on the number of targets but also on the angle subtended by the directions of the movements toward them.
Discussion
The model presented here illustrates how a distributed network can solve two conceptually distinct but functionally related problems: specifying metrically related response options and selecting between them. Traditionally, these have been viewed as separate problems, and models addressing them have been developed primarily in isolation. However, neural data does not support a rigid separation between planning and decision making (Platt and Glimcher, 1999; Gold and Shadlen, 2000; Hoshi et al., 2000; Romo et al., 2004; Cisek and Kalaska, 2005), suggesting instead that these functions are performed by a unified mechanism.
The mechanism used here involves a distributed neural representation within which movement options are defined and compete against each other. This representation does not explicitly encode any specific perceptual, cognitive, or motor variable but rather reflects a functionally motivated mixture of many such variables. It therefore suggests a way of interpreting neural data that is otherwise difficult to account for in terms of pure variables, such as the observation that LIP activity correlates with many sensory, motor, and cognitive variables (Snyder et al., 1997; Platt and Glimcher, 1999; Kusunoki et al., 2000). For example, during the MS task, PMd activity first briefly represents both potential actions and then quickly changes to simply reflect the planned action (Fig. 5a,b, just after the SC). Similar results are often reported in other brain regions (Thompson et al., 1996; Platt and Glimcher, 1997; Schall and Bichot, 1998; Fadiga et al., 2000). One might be tempted to describe the initial response as a sensory representation of targets and later activity as a representation of a plan. However, at least in the context of the model, both responses serve the same role of specifying and selecting potential actions, and forcing them into “sensory” or “motor” categories would be inappropriate. One may view much of cortical activity in terms of two temporal waves of processing spreading across the cerebral cortex: early activity sensitive to spatial information specifying potential actions, followed by modulation of this activity by factors such as attention and decision making. Neurophysiological studies suggest that the early wave engages cortical activity in 40–100 ms, whereas the modulation appears after another 50 ms (Thompson et al., 1996; Cisek and Kalaska, 2005).
Because the model addresses questions on both planning and decision making, it relates to a number of previous models of both processes. For instance, it shares features with a class of theories called “sequential sampling models,” which suggest that decision making involves the gradual accumulation of information about given choices until a threshold is reached (Roe et al., 2001; Usher and McClelland, 2001; Mazurek et al., 2003; Reddi et al., 2003; Smith and Ratcliff, 2004). The present model also makes use of a gradual integration process and therefore behaves very much like sequential sampling models (Fig. 7a). However, it differs from those models in two important ways. First, sequential sampling models usually posit a stage of processing at which activities accumulated in favor of the choices are compared to make the decision. For example, the Mazurek et al. (2003) model suggests that neurons in the middle temporal area represent current sensory evidence that is accumulated by neurons in LIP and the accumulated activity finally compared by some decision area. In contrast, in the present model, the decision is made through a transition to winner-take-all dynamics within the same population that represents the choices. In this sense, the present model is more like those of Wang (2002) and Machens et al. (2005), which propose that the decision-making process occurs between mutually competing cells and which also demonstrate the functional value of mixed representations.
Second, and more significantly, the present theory differs from other decision-making theories in that those models assume discrete populations of neurons assigned to each of the options among which decisions are made. The question of where those representations come from is not addressed. In contrast, the present model describes how distinct options can emerge within a distributed neural population on the basis of sensory input and then, once they are defined, to compete against each other for execution. It is because of this distributed representation that the model is able to reproduce the spatial distribution of choices reported by Ghez et al. (1997) and the reaction time phenomenon of Bock and Eckmiller (2000). The present model proposes that both the definition of the options and the selection between them is produced by the same mechanism: lateral interactions between cells encoding potential parameters of movement. In this sense, it is similar to the decision field theory of Erlhagen and Schöner (2002) and the attention model of Tipper et al. (2000). The model thus proposes a link between theories of decision making, such as the sequential sampling models, and theories of movement parameter planning in distributed populations.
Predictions
Because the model is phrased in terms of particular neural populations in the primate brain, it can be used to generate specific predictions regarding cell activity. Here, we focus on predictions that test some of the core ideas of the model.
The model suggests that, in many anatomically diverse cortical regions, cells tuned to particular spatial parameters will vary their activity in relation to almost any factor that influences decision making, whether or not those factors are formally optimal for decision making in the given context. These factors include formal “decision variables” such as probability and size of reward (i.e., “expected value”) as already documented in the oculomotor system (Platt and Glimcher, 1999; Glimcher, 2003), as well as with related variables such as local income (Sugrue et al., 2004), hazard rate (Janssen and Shadlen, 2005), and relative subjective desirability (Dorris and Glimcher, 2004). The model predicts similar effects in regions involved in many other kinds of movements.
Furthermore, the model predicts that, in all cases of frontoparietal activity modulated by decision variables, the effects of these factors should be predominantly relative. In other words, even if a decision variable (e.g., expected value) for a given option is held constant, the activity associated with that option will be modulated by decision variables related to other options. This is consistent with effects reported for PMd (Roesch and Olson, 2004) and predicts that similar effects will be seen elsewhere.
One particularly novel prediction is that the relative effects of decision variables should be influenced by the distance between the movement choices. This effect is related to the interaction function (Fig. 1b), which defines how cells with different parameter preferences influence each other in the population. In other words, even if all decision variables are kept constant, the activity associated with each potential action will vary if the distance between the actions changes.
Because it gives premotor regions an important role in decision making, the model suggests that reversible inactivation of these regions will result in poor performance in reach-decision tasks. This has already been demonstrated by Schieber (2000), who showed that, when monkeys were presented two food morsels, unilateral inactivation of premotor cortex biased their responses away from the contralateral side. The model predicts that more specific biases can be introduced by microstimulation in the premotor cortex, as has been shown in the oculomotor system (Carello and Krauzlis, 2004).
Finally, the model predicts that there is no rigid temporal sequence in which decisions emerge in cortex. Each population in the frontoparietal network is proposed to involve competitive interactions, and biasing influences can modulate that competition in different places. These biases need not always agree, and the final decision will be determined by a distributed consensus over a large cortical area. Because corticocortical connections are bidirectional, if a decision begins to emerge in one region, then it will propagate outward to other regions. Presently, the model only includes a single site of biasing (PMd biased by PFC input), but it is also possible to send biasing influences to PPC. If a bias were introduced in PPC, then the decision would first be resolved there and propagate forward to PMd. In other words, the model predicts that the temporal sequence in which the frontoparietal system converges to a consensus will be task dependent. For example, decisions based on sensory features such as stimulus salience may first appear in parietal cortex and then influence frontal activity, whereas decisions based on abstract rules may first be expressed in frontal regions (Wallis and Miller, 2003) and propagate back to PPC.
Conclusions
The model presented here suggests that interaction with the environment involves a continuous process of transforming spatial sensory information to specify and update the parameters of potential actions. This is analogous to the proposal that part of perception is the interpretation of sensory information in terms of actions made possible by the environment and the animal's place within it (Gibson, 1979; Fadiga et al., 2000). Multiple potential actions available at a given time are specified simultaneously along the sensorimotor continuum and constantly compete for additional processing and overt execution. Action selection in this broad sense encompasses phenomena such as spatial attention, contextual modulation, and decision making. In fact, this perspective suggests that the pragmatic sensorimotor concerns of action selection and action specification were the original context within which many of our advanced cognitive abilities evolved (Cisek, 2001; Cisek and Kalaska, 2001; Hommel et al., 2001).
Footnotes
This work was supported by New Emerging Teams Grant NET-54000 from the Canadian Institutes of Health Research. I thank Robert Ajemian, Trevor Drew, Andrea Green, John Kalaska, Sergiy Yakovenko, and four anonymous reviewers for helpful comments on this manuscript and the modeling work it describes.
References
- Basso MA, Wurtz RH. Modulation of neuronal activity in superior colliculus by changes in target probability. J Neurosci. 1998;18:7519–7534. doi: 10.1523/JNEUROSCI.18-18-07519.1998. [DOI] [PMC free article] [PubMed] [Google Scholar]
- Bhushan N, Shadmehr R. Computational nature of human adaptive control during learning of reaching movements in force fields. Biol Cybern. 1999;81:39–60. doi: 10.1007/s004220050543. [DOI] [PubMed] [Google Scholar]
- Bock O, Eversheim U. The mechanisms of movement preparation: a precuing study. Behav Brain Res. 2000;108:85–90. doi: 10.1016/s0166-4328(99)00134-5. [DOI] [PubMed] [Google Scholar]
- Boynton GM. Attention and visual perception. Curr Opin Neurobiol. 2005;15:465–469. doi: 10.1016/j.conb.2005.06.009. [DOI] [PubMed] [Google Scholar]
- Carello CD, Krauzlis RJ. Manipulating intent: evidence for a causal role of the superior colliculus in target selection. Neuron. 2004;43:575–583. doi: 10.1016/j.neuron.2004.07.026. [DOI] [PubMed] [Google Scholar]
- Carpenter RH, Williams ML. Neural computation of log likelihood in control of saccadic eye movements. Nature. 1995;377:59–62. doi: 10.1038/377059a0. [DOI] [PubMed] [Google Scholar]
- Cisek P. Embodiment is all in the head. Behav Brain Sci. 2001;24:36–38. [Google Scholar]
- Cisek P, Kalaska JF. Common codes for situated interaction. Behav Brain Sci. 2001;24:883–884. [Google Scholar]
- Cisek P, Kalaska JF. Neural correlates of reaching decisions in dorsal premotor cortex: specification of multiple direction choices and final selection of action. Neuron. 2005;45:801–814. doi: 10.1016/j.neuron.2005.01.027. [DOI] [PubMed] [Google Scholar]
- Cisek P, Grossberg S, Bullock D. A cortico-spinal model of reaching and proprioception under multiple task constraints. J Cogn Neurosci. 1998;10:425–444. doi: 10.1162/089892998562852. [DOI] [PubMed] [Google Scholar]
- Cisek P, Michaud N, Kalaska JF. Integration of motor planning and sensory feedback in area 5. Soc Neurosci Abstr. 2004;30:655.13. [Google Scholar]
- Compte A, Brunel N, Goldman-Rakic PS, Wang XJ. Synaptic mechanisms and network dynamics underlying spatial working memory in a cortical network model. Cereb Cortex. 2000;10:910–923. doi: 10.1093/cercor/10.9.910. [DOI] [PubMed] [Google Scholar]
- Coe B, Tomihara K, Matsuzawa M, Hikosaka O. Visual and anticipatory bias in three cortical eye fields of the monkey during an adaptive decision-making task. J Neurosci. 2002;22:5081–5090. doi: 10.1523/JNEUROSCI.22-12-05081.2002. [DOI] [PMC free article] [PubMed] [Google Scholar]
- Dayan P, Abbott LF. Theoretical neuroscience. Cambridge, MA: MIT; 2001. [Google Scholar]
- Desimone R. Visual attention mediated by biased competition in extrastriate visual cortex. Philos Trans R Soc Lond B Biol Sci. 1998;353:1245–1255. doi: 10.1098/rstb.1998.0280. [DOI] [PMC free article] [PubMed] [Google Scholar]
- Dorris MC, Glimcher PW. Activity in posterior parietal cortex is correlated with the relative subjective desirability of action. Neuron. 2004;44:365–378. doi: 10.1016/j.neuron.2004.09.009. [DOI] [PubMed] [Google Scholar]
- Erlhagen W, Schöner G. Dynamic field theory of movement preparation. Psychol Rev. 2002;109:545–572. doi: 10.1037/0033-295x.109.3.545. [DOI] [PubMed] [Google Scholar]
- Fadiga L, Fogassi L, Gallese V, Rizzolatti G. Visuomotor neurons: ambiguity of the discharge or “motor” perception? Int J Psychophysiol. 2000;35:165–177. doi: 10.1016/s0167-8760(99)00051-3. [DOI] [PubMed] [Google Scholar]
- Favilla M. Reaching movements: concurrency of continuous and discrete programming. NeuroReport. 1997;8:3973–3977. doi: 10.1097/00001756-199712220-00025. [DOI] [PubMed] [Google Scholar]
- Flash T, Hogan N. The coordination of arm movements: an experimentally confirmed mathematical model. J Neurosci. 1985;5:1688–1703. doi: 10.1523/JNEUROSCI.05-07-01688.1985. [DOI] [PMC free article] [PubMed] [Google Scholar]
- Georgopoulos AP, Taira M, Lukashin AV. Cognitive neurophysiology of the motor cortex. Science. 1993;260:47–52. doi: 10.1126/science.8465199. [DOI] [PubMed] [Google Scholar]
- Ghez C, Favilla M, Ghilardi MF, Gordon J, Bermejo R, Pullman S. Discrete and continuous planning of hand movements and isometric force trajectories. Exp Brain Res. 1997;115:217–233. doi: 10.1007/pl00005692. [DOI] [PubMed] [Google Scholar]
- Gibson JJ. The ecological approach to visual perception. Boston: Houghton Mifflin; 1979. [Google Scholar]
- Glimcher PW. The neurobiology of visual-saccadic decision making. Annu Rev Neurosci. 2003;26:133–179. doi: 10.1146/annurev.neuro.26.010302.081134. [DOI] [PubMed] [Google Scholar]
- Gold JI, Shadlen MN. Representation of a perceptual decision in developing oculomotor commands. Nature. 2000;404:390–394. doi: 10.1038/35006062. [DOI] [PubMed] [Google Scholar]
- Goldman MS, Levine JH, Major G, Tank DW, Seung HS. Robust persistent neural activity in a model integrator with multiple hysteretic dendrites per neuron. Cereb Cortex. 2003;13:1185–1195. doi: 10.1093/cercor/bhg095. [DOI] [PubMed] [Google Scholar]
- Grossberg S. Contour enhancement, short term memory, and constancies in reverberating neural networks. Studies Appl Math. 1973;52:213–257. [Google Scholar]
- Hanes DP, Schall JD. Neural control of voluntary movement initiation. Science. 1996;274:427–430. doi: 10.1126/science.274.5286.427. [DOI] [PubMed] [Google Scholar]
- Hommel B, Müsseler J, Aschersleben G, Prinz W. The theory of event coding (TEC): a framework for perception and action planning. Behav Brain Sci. 2001;24:849–937. doi: 10.1017/s0140525x01000103. [DOI] [PubMed] [Google Scholar]
- Hoshi E, Shima K, Tanji J. Neuronal activity in the primate prefrontal cortex in the process of motor selection based on two behavioral rules. J Neurophysiol. 2000;83:2355–2373. doi: 10.1152/jn.2000.83.4.2355. [DOI] [PubMed] [Google Scholar]
- Janssen P, Shadlen MN. A representation of the hazard rate of elapsed time in macaque area LIP. Nat Neurosci. 2005;8:234–241. doi: 10.1038/nn1386. [DOI] [PubMed] [Google Scholar]
- Johnson PB, Ferraina S, Bianchi L, Caminiti R. Cortical networks for visual reaching: physiological and anatomical organization of frontal and parietal arm regions. Cereb Cortex. 1996;6:102–119. doi: 10.1093/cercor/6.2.102. [DOI] [PubMed] [Google Scholar]
- Kawato M, Maeda Y, Uno Y, Suzuki R. Trajectory formation of arm movement by cascade neural network model based on minimum torque-change criterion. Biol Cybern. 1990;62:275–288. doi: 10.1007/BF00201442. [DOI] [PubMed] [Google Scholar]
- Kim J-N, Shadlen MN. Neural correlates of a decision in the dorsolateral prefrontal cortex of the macaque. Nat Neurosci. 1999;2:176–185. doi: 10.1038/5739. [DOI] [PubMed] [Google Scholar]
- Knill DC, Pouget A. The Bayesian brain: the role of uncertainty in neural coding and computation. Trends Neurosci. 2004;27:712–719. doi: 10.1016/j.tins.2004.10.007. [DOI] [PubMed] [Google Scholar]
- Kusunoki M, Gottlieb J, Goldberg ME. The lateral intraparietal area as a salience map: the representation of abrupt onset, stimulus motion, and task relevance. Vision Res. 2000;40:1459–1468. doi: 10.1016/s0042-6989(99)00212-6. [DOI] [PubMed] [Google Scholar]
- Machens CK, Romo R, Brody CD. Flexible control of mutual inhibition: a neural model of two-interval discrimination. Science. 2005;307:1121–1124. doi: 10.1126/science.1104171. [DOI] [PubMed] [Google Scholar]
- Mazurek ME, Roitman JD, Ditterich J, Shadlen MN. A role for neural integrators in perceptual decision making. Cereb Cortex. 2003;13:1257–1269. doi: 10.1093/cercor/bhg097. [DOI] [PubMed] [Google Scholar]
- Mel BW. A connectionist model may shed light on neural mechanisms for visually guided reaching. J Cogn Neurosci. 1991;3:273–292. doi: 10.1162/jocn.1991.3.3.273. [DOI] [PubMed] [Google Scholar]
- Miller EK. The prefrontal cortex and cognitive control. Nat Rev Neurosci. 2000;1:59–65. doi: 10.1038/35036228. [DOI] [PubMed] [Google Scholar]
- Milner AD, Goodale MA. The visual brain in action. Oxford: Oxford UP; 1995. [Google Scholar]
- Platt ML, Glimcher PW. Responses of intraparietal neurons to saccadic targets and visual distractors. J Neurophysiol. 1997;78:1574–1589. doi: 10.1152/jn.1997.78.3.1574. [DOI] [PubMed] [Google Scholar]
- Platt ML, Glimcher PW. Neural correlates of decision variables in parietal cortex. Nature. 1999;400:233–238. doi: 10.1038/22268. [DOI] [PubMed] [Google Scholar]
- Rainer G, Asaad WF, Miller EK. Selective representation of relevant information by neurons in the primate prefrontal cortex. Nature. 1998;363:577–579. doi: 10.1038/31235. [DOI] [PubMed] [Google Scholar]
- Ratcliff R, Cherian A, Segraves M. A comparison of macaque behavior and superior colliculus neuronal activity to predictions from models of two-choice decisions. J Neurophysiol. 2003;90:1392–1407. doi: 10.1152/jn.01049.2002. [DOI] [PubMed] [Google Scholar]
- Reddi BAJ, Asrress KN, Carpenter RHS. Accuracy, information, and response time in a saccadic decision task. J Neurophysiol. 2003;90:3538–3546. doi: 10.1152/jn.00689.2002. [DOI] [PubMed] [Google Scholar]
- Redgrave P, Prescott TJ, Gurney K. The basal ganglia: a vertebrate solution to the selection problem? Neuroscience. 1999;89:1009–1023. doi: 10.1016/s0306-4522(98)00319-4. [DOI] [PubMed] [Google Scholar]
- Rizzolatti G, Luppino G. The cortical motor system. Neuron. 2001;31:889–901. doi: 10.1016/s0896-6273(01)00423-8. [DOI] [PubMed] [Google Scholar]
- Roe RM, Busemeyer JR, Townsend JT. Multialternative decision field theory: a dynamic connectionist model of decision making. Psychol Rev. 2001;108:370–392. doi: 10.1037/0033-295x.108.2.370. [DOI] [PubMed] [Google Scholar]
- Roesch MR, Olson CR. Neuronal activity related to reward value and motivation in primate frontal cortex. Science. 2004;304:307–310. doi: 10.1126/science.1093223. [DOI] [PubMed] [Google Scholar]
- Romo R, Hernandez A, Zainos A. Neuronal correlates of a perceptual decision in ventral premotor cortex. Neuron. 2004;41:165–173. doi: 10.1016/s0896-6273(03)00817-1. [DOI] [PubMed] [Google Scholar]
- Sanger TD. Neural population codes. Curr Opin Neurobiol. 2003;13:238–249. doi: 10.1016/s0959-4388(03)00034-5. [DOI] [PubMed] [Google Scholar]
- Schall JD, Bichot NP. Neural correlates of visual and motor decision processes. Curr Opin Neurobiol. 1998;8:211–217. doi: 10.1016/s0959-4388(98)80142-6. [DOI] [PubMed] [Google Scholar]
- Schieber MH. Inactivation of the ventral premotor cortex biases the laterality of motoric choices. Exp Brain Res. 2000;130:497–507. doi: 10.1007/s002219900270. [DOI] [PubMed] [Google Scholar]
- Schultz W. Neural coding of basic reward terms of animal learning theory, game theory, microeconomics and behavioural ecology. Curr Opin Neurobiol. 2004;14:139–147. doi: 10.1016/j.conb.2004.03.017. [DOI] [PubMed] [Google Scholar]
- Shadlen MN, Newsome WT. Neural basis of a perceptual decision in the parietal cortex (area lip) of the rhesus monkey. J Neurophysiol. 2001;86:1916–1936. doi: 10.1152/jn.2001.86.4.1916. [DOI] [PubMed] [Google Scholar]
- Shafir E, Tversky A. Decision making. In: Smith EE, Osherson DN, editors. Thinking: an invitation to cognitive science. Cambridge, MA: MIT; 1995. pp. 77–100. [Google Scholar]
- Smith PL, Ratcliff R. Psychology and neurobiology of simple decisions. Trends Neurosci. 2004;27:161–168. doi: 10.1016/j.tins.2004.01.006. [DOI] [PubMed] [Google Scholar]
- Snyder LH, Batista AP, Andersen RA. Coding of intention in the posterior parietal cortex. Nature. 1997;386:167–170. doi: 10.1038/386167a0. [DOI] [PubMed] [Google Scholar]
- Sugrue LP, Corrado GS, Newsome WT. Matching behavior and the representation of value in the parietal cortex. Science. 2004;304:1782–1787. doi: 10.1126/science.1094765. [DOI] [PubMed] [Google Scholar]
- Tanji J, Hoshi E. Behavioral planning in the prefrontal cortex. Curr Opin Neurobiol. 2001;11:164–170. doi: 10.1016/s0959-4388(00)00192-6. [DOI] [PubMed] [Google Scholar]
- Thompson KG, Hanes DP, Bichot NP, Schall JD. Perceptual and motor processing stages identified in the activity of macaque frontal eye field neurons during visual search. J Neurophysiol. 1996;76:4040–4055. doi: 10.1152/jn.1996.76.6.4040. [DOI] [PubMed] [Google Scholar]
- Tipper SP, Howard LA, Houghton G. Behavioural consequences of selection from neural population codes. In: Monsell S, Driver J, editors. Control of cognitive processes: attention and performance XVIII. Cambridge, MA: MIT; 2000. [Google Scholar]
- Tversky A, Kahneman D. The framing of decisions and the psychology of choice. Science. 1981;211:453–458. doi: 10.1126/science.7455683. [DOI] [PubMed] [Google Scholar]
- Usher M, McClelland JL. The time course of perceptual choice: the leaky, competing accumulator model. Psychol Rev. 2001;108:550–592. doi: 10.1037/0033-295x.108.3.550. [DOI] [PubMed] [Google Scholar]
- Wallis JD, Miller EK. From rule to response: neuronal processes in the premotor and prefrontal cortex. J Neurophysiol. 2003;90:1790–1806. doi: 10.1152/jn.00086.2003. [DOI] [PubMed] [Google Scholar]
- Wang XJ. Probabilistic decision making by slow reverberation in cortical circuits. Neuron. 2002;36:955–968. doi: 10.1016/s0896-6273(02)01092-9. [DOI] [PubMed] [Google Scholar]
- White IM, Wise SP. Rule-dependent neuronal activity in the prefrontal cortex. Exp Brain Res. 1999;126:315–335. doi: 10.1007/s002210050740. [DOI] [PubMed] [Google Scholar]