

Abstract
The responses of extrastriate area V4 neurons to flashed visual stimuli were examined to determine whether the responses to stimulus sequences occurring at normal saccade and fixation timing intervals were degraded relative to longer timing intervals. Stimuli were flashed in receptive fields in the near periphery while monkeys maintained steady fixation. Short interstimulus intervals (ISIs) resulted in an overall habituation style response reduction. The transient component of responses to preferred stimuli was suppressed, often completely, when the ISI was reduced below 100 ms into the range of saccadic durations. The sustained response component weakened but remained intact. At short ISIs the trailing activity from the preceding stimulus blended with onset activity from the next stimulus, making it difficult to detect individual stimulus onset events within the spike train. Habituation or conditioning effects were correlated with the stimulus tuning sensitivity of the neuron but only loosely associated with the actual level of V4 activation elicited by preceding stimuli. The results suggest that sharply tuned neurons, because of their probabilistic inactivity, are particularly sensitive to temporal change, whereas the sustained components of broadly tuned neurons could provide a continuity of information flow across visual transients, such as saccades, that do not alter significantly the view by the neuron of the scene.
Keywords: macaque, extrastriate, receptive field, temporal coding, crowding, RSVP
Introduction
During normal visual behaviors the image portions of the visual scene falling within a visual receptive field change three to five times per second as saccadic eye movements change the line of sight. Most single unit neurophysiological studies of striate and extrastriate visual cortical areas have been devoted to examining the receptive field properties of neurons with receptive fields located in the near periphery, approximately from 2 to 15° in eccentricity. From a probabilistic standpoint these nonfoveal sites are rarely the subject of the observer's focused attention during normal looking behaviors, yet it is information extracted from those locations that often serves as the basis for appraising and guiding additional examination of the scene (Motter and Belky, 1998). In the past, spatial crowding, both in terms of background texture and competing objects, has gained recognition as an important component of neuronal coding in addition to the classic receptive field properties of the neuron (Allman et al., 1985; Knierim and van Essen, 1992; Zipser et al., 1996; Kapadia et al., 2000; Landman et al., 2003). Temporal crowding conditions, the timing and constitution of transient stimulus sequences within the receptive field, have received less notice, particularly in single unit studies.
A typical assumption is that, when stimuli appear in a receptive field as the result of a saccade, they produce a response similar to that produced when a stimulus is flashed on in the receptive field during steady fixation. For stimuli isolated against a blank background this seems to be the case in striate visual cortex (Richmond et al., 1999; Gawne and Martin, 2002; Gawne and Woods, 2003) and for foveated stimuli in inferior temporal cortex (DiCarlo and Maunsell, 2000). Under conditions of stimulus crowding or for a stimulus presented against a more natural scene background, activity associated with saccades is often less than that expected, based on receptive field testing during fixation (Livingstone et al., 1996; Gallant et al., 1997; Sheinberg and Logothetis, 2001). Although this result has been attributed to issues related to spatial crowding and attention (Mazer and Gallant, 2003), perceptual studies in humans have shown that simple temporal crowding disrupts what is considered normal perceptual performance (Shapiro, 2001; Rensink, 2002). The role of attention in the detection of targets embedded within sequences of objects has become a pivotal issue in theories of attention (Egeth and Yantis, 1997; Simons, 2000).
With the ultimate goal of disentangling the spatial, temporal, and attentional components of the neural activity associated with receptive field transitions at the time of saccades, the experiments reported here examine first the temporal issues of repeated stimulation during maintained fixation. These studies examine the activity of area V4 neurons to flashed sequences of stimuli; subsequent reports will examine controlled saccade sequences. This work confirms and extends initial reports made in V1 (Gawne and Woods, 2003) and draws attention to the differences in response habituation between transient and sustained response components.
Materials and Methods
The present study was undertaken to investigate the response sensitivity of neurons in extrastriate area V4 during presentations of sequences of stimuli. Neural responses were analyzed to define the temporal profiles of population activity and their dependence on the preceding events. The experiments that are reported establish the time frame and sensitivity to repeatedly flashed stimuli delivered to peripheral receptive fields of area V4 neurons during maintained central fixation. Data were obtained from four rhesus monkeys that were trained and prepared for behavioral neurophysiological recording experiments. Standard electrophysiological techniques were used to obtain recordings from neurons in extrastriate area V4 (Motter, 1994). The impulse activity of single cortical neurons was recorded with glass-coated Elgiloy microelectrodes inserted transdurally into the cortex. Histological examination was used to confirm the neurophysiological recording locations. The time of neural discharge was recorded with 0.1 ms precision. Eye position was measured with a scleral search coil system sampling eye position at 400 Hz. All experimental protocols were approved by the Institutional Animal Care and Use Committees at the Veterans Affairs Medical Center and at State University of New York Upstate Medical University.
Behavioral paradigms.
Monkeys were trained to perform several principal behavioral tasks relevant to these experiments and to other experiments summarized previously. The task for these experiments was a standard simple fixation paradigm that required the monkey to fixate steadily on a small spot of light for several seconds while at the same time behaviorally ignoring stimuli presented in the near periphery (1–15° from fixation). At the end of the trial the fixation spot moved a small distance, and the monkey was required to re-fixate it within a reaction time window to receive a reward. The fixation task was used to locate and to map the receptive field of each neuron and to determine the response preferences of each neuron for stimulus shape, size, orientation, and color. Using this information and the fixation paradigm, we then tested specific sequences of stimuli to determine the response of each neuron to repetitively flashed stimuli. The monkeys were required to keep eye position inside a 1° window centered on the fixation spot. All stimuli were viewed binocularly. The fixation target was displaced from screen center so the receptive field on the screen could be centered during the tests used to characterize each neuron. These same monkeys also were trained on several visual search and saccade paradigms for data collected in the same sessions, but not reported here. The animals worked daily for ∼1200–1500 trials at ∼85% correct performance. In addition to these experiments, data obtained in previous experiments (Motter and Holsapple, 2000; our unpublished data) were analyzed to provide data for saccade and fixation durations occurring during typical active search through arrays of stimulus objects.
Stimulus presentation.
Stimuli were generated by using custom software controlling a Number Nine Pepper SGT graphics card (800 × 600 pixel resolution) and were presented on a Sony GDM F520 monitor located at a 57 cm viewing distance. Stimulus timing was synchronized with the 55 Hz vertical refresh. Each series of stimuli was presented in a pseudo-random sequence. The stimuli consisted of a set of shapes that may be described as variations on block letters or circles, as illustrated in the bottom left of Figure 1. Each stimulus could be varied in orientation, length, bar width, and color. Stimuli were presented on a gray background of 8 cd/m2. A standard set of color levels was used, based on the use of individual RGB (red/green/blue) guns or combinations of two guns. These colors were adjusted to an average value of 15 cd/m2 by comparisons of the frame-averaged values obtained from integrating the output of an EG&G model 450 photometer (Gamma Scientific, San Diego, CA) fit with a photometric filter. A black stimulus also was used at an equal but opposite luminance contrast to the various color stimuli. In the text that follows, black will be considered a color when reference is made to a change in colors or a color pairing. Individual display frames were measured to ensure that the luminance of each video raster frame of a stimulus presentation was identical. No attempt was made to select isoluminant colors for individual animals or neurons.
Figure 1.

Stimuli and paradigm. Left, Variations in size, color, and orientation of these letter-like shapes were used to characterize a preferred stimulus, map the receptive field of each neuron, and characterize the neural response to sequences of stimuli. Right, The task was to maintain fixation on a small target (cross) while stimuli were flashed sequentially in the receptive field (dashed circle). Stimuli were on for 200 ms (STM) and off for an ISI of 55, 110, 217, or 327 ms. ISIs were constant within a trial. The stimuli either were identical (data not shown) or alternated between two colors (open and closed symbols) as in the sequence that has been depicted.
Procedures.
Single neurons initially were selected for study if they responded to flashed stimuli of ∼2.0° long with a bar width of 0.25°, used to activate the neural record during electrode advancement. A variety of computer runs was used to define the receptive field location and preferences for size, color, shape, and orientation of stimuli. It is our experience that V4 neurons have many relatively broad tuning properties and, as a result, can be driven weakly by a wide range of stimuli. It is also our experience that, once the dominant columnar properties are discovered, most initially weakly activated neurons can be driven robustly by finding a particular combination of stimulus properties delivered to the center of the receptive field. A significant effort was made to find a combination of parameters that elicited robust responses, and studies were abandoned if this could not be accomplished within 20 min of initial isolation of the neuron. This time limit was chosen because a full set of tests took ∼1 h of recording, and that requirement had to balance against the probability of holding electrophysiological isolation on the neuron and the monkey's continuous working during that period. Studies also were abandoned if the preferred stimuli were either much larger or much smaller than the principal stimulus set we chose to use or if receptive field centers were outside the 2–7° eccentricity range required by the other concurrent studies. From these efforts a preferred or “PR” stimulus was defined. A secondary or “SE” stimulus differing in color (including black) also was chosen for some studies. The intention of the secondary choice was to pick an SE stimulus that produced an unambiguous but distinctly suboptimal response. Two experimental series of repetitively flashed stimulus sequences were used. One was an identical stimulus series in which the PR stimulus was flashed repetitively six to eight times, using a stimulus duration of 200 ms and four different interstimulus intervals (ISIs) of 327, 217, 110, or 55 ms. A second, mixed stimulus series also was used in which the PR and SE stimuli were intermixed in an eight stimulus sequence, using a stimulus duration of 200 ms and an ISI of 55 ms. Figure 1 illustrates the sequence used for the mixed stimulus series for an ISI of 110 ms.
Data analysis.
The spike rate activity was measured in defined periods of time around stimulus onset. Stimulus onset time was defined with respect to the midpoint of the first raster scan frame containing the stimulus. On the basis of the response profiles that were observed, most individual and population comparisons were based on the neural activity in the interval from 50 ms after stimulus onset to 150 ms after stimulus onset. Other ranges are indicated with respect to specific analyses. The average population activity was achieved first by normalizing the activity of each neuron to a standard and then by averaging across cells. All histogram representations are binned at 10 ms intervals. Several normalization methods were explored, all yielding equivalent results. The method that has been reported scales the activity of each neuron so that the response to the PR stimulus at the beginning of any sequence averages to 1.0 in the interval from 50 ms after stimulus onset to 150 ms after stimulus onset. This method made for a simple reference point in the comparisons of individual or population groupings. For population analyses the averages of activity for each condition were used in a repeated measures ANOVA, using neurons as subjects. Pairwise multiple comparisons (Holm–Sidak method) were made between conditions. Multiple linear regressions also were used to identify trends within population activity.
Results
Fixation and saccade durations during search
Measures of fixation durations and saccade durations during an active search task were obtained from previous experiments in this laboratory [Motter and Holsapple (2000) and similar unpublished data]. In those experiments the monkeys were trained to search through randomly organized arrays of stimuli (Ts and Ls) to find and fixate a target stimulus that was cued at the beginning of each trial. As previously reported, the average fixation duration during this search behavior is ∼180 ms. A histogram of the distribution of saccade durations during active search within the boundaries of a display monitor is shown in Figure 2. The data are from one monkey during the performance of 11,600 trials of a search task and summarize 66,000 saccades. The mean duration is slightly >30 ms and rarely longer than 55 ms. The relation between saccade duration and saccade amplitude also is graphed in Figure 2 for the same data set. It can be seen that saccades of ∼32 ms in duration and 5° in amplitude were common in our search tasks, which used 6–96 items scattered across a 34.0 × 25.5° display area. These parameters define the time scale of events occurring within a receptive field during active search; stimuli may appear in a receptive field for ∼200 ms and then are replaced over an interval of <50 ms by a new stimulus. Whether the saccade period is effectively a blank period or a mask period or a “stimulus” period generated by the rapid movement of the field of view or some combination of these events is not as critical to this summary as is the recognition that the distribution of saccade durations is fairly narrow, ranging from ∼25 to ∼50 ms for the set of saccade amplitudes that characterize saccades of up to 15° in amplitude during visual search. It is within this framework of timing that the following neurophysiological studies were made.
Figure 2.

Distribution of saccade durations and saccade amplitudes during search. Stepped histogram depicts saccade durations during simple visual search. Filled circles depict saccade amplitude for the same sample of 66,000 saccades. Saccade durations average ∼32 ms, corresponding to an average saccade of ∼5° in amplitude.
Response to flashed sequences of stimuli
The visual field representation of the lower contralateral quadrant within area V4 was located on the crown of the prelunate gyrus in the extrastriate cortex in each hemisphere. Within area V4, 310 neurons were characterized fully in the standard fixation paradigm, and responses to repetitive sequences of identical stimuli were obtained in 108 neurons, with responses to mixed stimuli in 130 neurons. Neurons were recorded from both superficial and deep lamina, but no correlations between cellular lamina and the observations reported below were observed.
Identical stimulus sequences
Many simple search displays contain a handful of stimuli scattered across an otherwise blank scene. During a sequence of fixations a peripheral receptive field at the level of V4 or earlier in the cortical visual system would encounter stimuli on some fixations and on others would encompass only a blank area of the scene. The repetitive flashing of stimuli in the receptive field of a neuron is known to lead to a habituation of the response of the neuron under various conditions. In these experiments we sought to establish what happens when stimuli simply, repetitively, are flashed on and off in the receptive field on a time scale similar to the fixation–saccade–fixation intervals of visual search. The responses to flashed sequences of an identical preferred stimulus were obtained by using a stimulus duration of 200 ms and four different ISIs of 327, 217, 110, or 55 ms. The ISI times were chosen to mimic conditions that spanned the transition from saccadic sequences in which one stimulus after another was present in the receptive field, separated in time only by a transient interval (ISI, 55 ms) that mimics the saccade duration, to a saccade condition that mimicked having a blank area fill the receptive field on every other fixation (ISI, 327 ms). Each sequence of stimuli used a single duration × ISI combination delivered during the fixation period of one behavioral trial, using the standard fixation task. The different ISI conditions were interleaved randomly on a trial-by-trial basis.
The responses for each condition for each neuron were averaged separately across trials. Then the response rate for each neuron was normalized to the maximum rate encountered in the interval from 50 to 150 ms after the first stimulus onset in any of the conditions for that neuron. After this normalization the population histograms were obtained by averaging across neurons. It was expected that V4 neurons would show habituation to repeated stimuli, as had been found in previous studies of neurons in striate cortex (Gawne and Martin, 2002). This is in fact what occurs for all four ISI conditions, as shown in Figure 3. The degree of habituation changes as a function of the ISI. Three trends in particular are notable for V4 neurons. (1) There is a decrease in the amplitude of the response for successive stimuli at each ISI. The decrease appears to settle to a plateau in each case. (2) There is a change in the baseline response between stimuli, in part no doubt to the observation that V4 neurons with sustained responses have approximately the same latency to cessation of response at stimulus offset as they have to activation at response onset. For short ISIs this leads to an overlap between cessation to the previous stimulus and activation to the next stimulus in a stimulus train. (3) There is an apparent preferential loss of the initial transient peak of activity. That peak is clearly visible in the response to the first stimulus of each sequence. These three trends are examined in turn.
Figure 3.
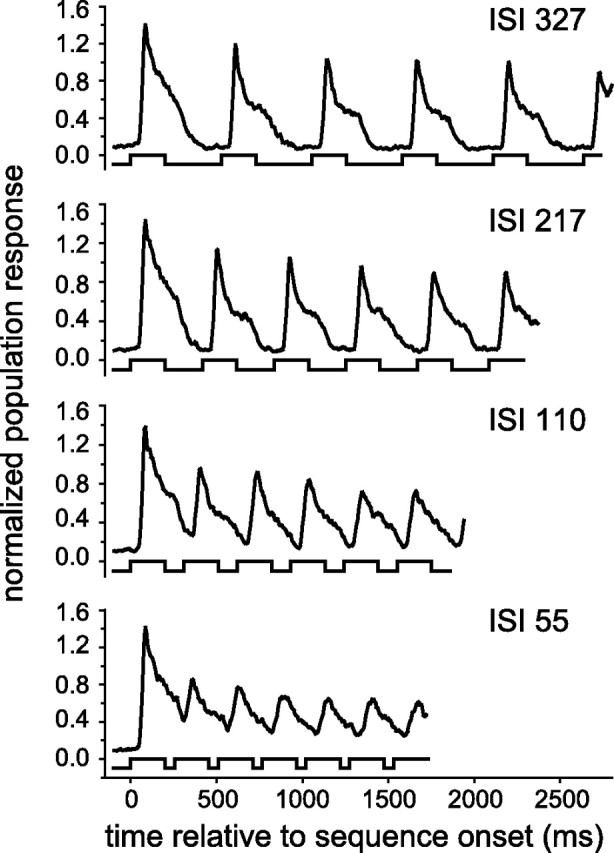
Population response histograms for repeated identical stimuli. Histograms depict the changes in neural response during a sequence of flashed stimuli for four ISI conditions. Within each sequence there is a reduction in the response that is a function of the ISI condition. The early transient response component, in particular, is affected. Stimulus duration is fixed at 200 ms. ISIs decrease from top to bottom as noted. The alternating timeline below each histogram indicates stimulus (up) and ISI (down).
The quantitative differences within each ISI condition are depicted better in cycle histograms synchronized to the onset of each stimulus, as shown in Figure 4, which depicts the V4 responses to the first through fifth stimulus for each ISI condition. In Figure 4 the time base for each graph is constant and longer than one cycle to show events before and after each cycle; therefore, for the shorter ISI conditions the next stimulus cycle can be seen on the right. The response to the first stimulus in a sequence reaches a greater sustained amplitude than any of the remaining stimuli. The difference is substantial. Although the initial phasic component continues to degrade as the ISI becomes shorter, the difference in the sustained components (∼40% decrease) appears to plateau at the level of the second response. Average firing rates were calculated for the interval from 50 to 150 ms after stimulus onset. A repeated measures ANOVA with neurons as subjects and with ISI and stimulus cycle as factors was conducted. Both factors (ISI, F = 18.2 and p < 0.001; cycle, F = 181.5 and p < 0.001) and their interaction (F = 12.3 and p < 0.001) were significant. Pairwise multiple comparisons (Holm–Sidak method) were obtained and indicated that all ISI conditions were different from each other (p < 0.05) and that the first and second stimulus cycles were different from each other as well as from the third, fourth, and fifth stimulus cycles, which in turn were not different from each other.
Figure 4.

Cycle histograms for a population of 108 neurons. The normalized population response is depicted in cycle histograms for the four different ISI conditions of stimulation. For each ISI condition the first cycle is the solid line marked by an arrow; the second cycle is a dashed line marked by an arrow. The second and succeeding cycles overlap extensively, indicating that for the population as a whole a major change occurs after a single repetition. The time base is held constant in each histogram; therefore, the response to the next cycle appears on the right as the ISI decreases in the successive display panels.
In the 110 and 55 ms ISI conditions the population activity does not return completely to baseline values by the time the next stimulus and ensuing response occur. Elevated baseline activity in combination with decreased response amplitude markedly reduces the contrast of the response profiles and makes detection of the individual responses to each subsequent stimulus in the stimulus train less reliable. In the 110 and 55 ms ISI conditions not only is there a decrease in the amplitude on the initial response, but also there is a decrease in the slope of the onset of the response that is apparent in the population histograms. V4 neurons, like those in other visual areas, often have distinct blends of a rapid initial transient discharge activity and a longer sustained discharge activity in response to the sudden appearance of a stimulus in the receptive field. The changes in the slope of the onset response (Fig. 4) represent a preferential loss of the initial transient component of the response at short ISIs.
The loss of the initial transient and the accompanying shift in response latency are illustrated in Figure 5 for three neurons chosen for illustration because they clearly depict the impact of changing ISI timing. The spike rasters depict the responses for the first five cycles per ISI condition for the three neurons. Only the first three trials for each condition are depicted. The vertical sync lines represent the onset time of each stimulus. In Figure 5 the top group of rasters for each neuron represents the response to the 327 ms ISI sequence, the middle group the response to the 110 ms ISI, and the bottom group the response to the 55 ms ISI condition. Within each group the responses to the first through fifth stimulus of the sequence are arranged one beneath the other. Numbers one to five indicate the order on the left. The 217 ms ISI sequence closely resembles the 327 ms ISI sequence and is not shown. The response to the first stimulus in the 327 ms ISI condition is the strongest, with subsequent stimuli producing nearly equivalent responses. For the 110 ms ISI and 55 ms ISI conditions the responses to the second and subsequent stimuli are diminished. The responses in the 110 ms ISI condition are greater than those in the 55 ms ISI condition. In the 110 ms ISI condition the shift of the effective latency from the initial to later stimuli in the sequence is apparent for neurons KAG and KAQ. For neuron KAG, on the left side, the latency shift accompanies a diminishment of the initial transient response that blends into the sustained component. For neurons such as KAQ (middle column) that have predominantly a phasic response, the dropout of the initial transient results in essentially a complete loss of the response. For some neurons such as KBI (right column) that display mostly a sustained discharge, the shorter ISIs merge responses into a prolonged steady response. Furthermore, the dramatic loss of the initial transient component results in a change in response latency for many neurons beginning with the second and subsequent stimuli in a train of stimuli. The loss of the initial discharge in some, but not all, neurons leads directly to the change in the slope of the onset response in the averaged population histograms, as seen for the 55 ms ISI condition in Figure 4.
Figure 5.

Spike raster plots for three V4 neurons. The neurons are arranged in three columns. The top group of rasters in each column represents the responses to the first five stimulus cycles in the 327 ms ISI condition. Sequential stimulus onsets within a trial are aligned one beneath the other at the long vertical marks for each condition. The stimulus cycle is denoted by the numbers one to five along the left side. The short vertical tics represent the neural discharges. Only the first three trials for each condition are displayed. The middle and bottom groups represent the responses to the 110 and 55 ms ISI conditions, respectively. On the left, neuron KAG has both transient and sustained response components, KAQ has a predominantly transient response, and on the right neuron KBI has a predominantly sustained response. Suppression of the transient component to successive stimuli is clear for KAG and KAQ. Neural activity preceding the long vertical marks is activity-related mostly to the preceding stimulus and response combination.
The overall loss of response amplitude observed between the first and subsequent responses to stimuli (Fig. 4) and the preferential loss of the initial transient response that declines with each subsequent stimulus suggested that the train of stimuli differentially modulated these two response components. This possibility was investigated by using an index to rank the neurons between transient and sustained tendencies. Neurons that were predominantly sustained were separated from those that were predominantly transient by rank ordering the 108 neurons by the mean activity (after the normalization described in Materials and Methods) present in the latter part of the response period from 150 to 250 ms after onset of the 200 ms duration stimulus. The response to the initial stimulus of a sequence was used to construct this index. The ranking, shown in Figure 6, depicts a population of neurons that smoothly grade according to the activity in that interval. The 108 neurons simply were divided evenly into two groups (54 and 54) based on this ranking, and cycle histograms were made for each stimulus cycle, combining in one plot the four different ISI conditions for each cycle. The results are shown for the separate transient and sustained groups in Figure 7. Naturally, the response to the first stimulus (cycle 1) of each sequence is the same for all ISI conditions. The time base of each graph in Figure 7 is extended beyond one cycle so that the response to subsequent stimuli can be seen following at the different intervals defined by each ISI condition. Two observations can be made from inspection of the first cycle in Figure 7, A and C. First, for both the transient and sustained groups the response to the second stimulus is reduced. Second, for the transient group, but not the sustained group, the amplitude of the second response is dependent on the ISI condition. This latter observation is confirmed by synchronizing the histograms to the onset of the second stimulus (Fig. 7B,D). In Figure 7B the decrease in response amplitude as a function of ISI in the interval 50–100 ms after stimulus onset (arrow) reflects the loss of the initial transient response. That loss also results in a shift in peak latency. On the right of Figure 7B are the responses to the third stimulus in the sequence. Again the responses depict an ISI condition dependency for the transient group of neurons.
Figure 6.

Transient and sustained ranking. Neurons were divided into transient and sustained response subgroups by normalizing the response of each neuron to the interval 50–150 ms and then ranking the neurons by the sustained activation in the interval 150–250 ms after stimulus onset. Neurons with high rank order had high late sustained activity as compared with the earlier transient response activity. The 108 neurons were ranked and divided into two equal groups: a transient group indicated by small filled circles and a sustained group indicated by open circles. The rank positions of the neurons depicted in Figure 5 (KAQ, KAG, KBI) are marked by triangles.
Figure 7.

Cycle histograms for transient and sustained groups. Population responses to all four ISI conditions are shown superimposed with onsets synchronized for the first (left side) and second (right side) stimulus cycle of each stimulus series. The extended time base illustrates the subsequent response that follows at the different ISIs. Differences in the transient (top) and sustained (bottom) group ranking are clear in terms of the duration of the initial responses shown in A, C. The amplitude of the transient response component decreases as the ISI decreases. The population transient peak latency increases as ISI decreases, noted at arrow in B, primarily because the transient response drops out for a proportion of individual neurons. D, Sustained group neurons do not show a progressive change related to the ISI; the amplitude of succeeding sustained responses is not dependent on the previous level of activation. ISI 55 ms, solid line; ISI 110 ms, dotted line; ISI 217 ms, dashed line; ISI 327 ms, dashed and dotted line.
In contrast, the amplitude of the response for the sustained group of neurons is not ISI condition-dependent for either the second or the third response, as seen in Figure 7D. Note that for the sustained group the amplitude of a response is not affected by the level of activity remaining from the previous response. For example, although the responses for the 327 ms ISI and the 55 ms ISI conditions originate from quite different baselines, their response amplitudes are the same. Thus baseline conditions of activation at the time of the response do not affect the amplitude of the ensuing sustained response. The changing baseline of the sustained group, however, makes detection of individual stimulus onsets within the spike train sequence very difficult. At short ISIs there is only a small dip in averaged population activity, and at the level of single neurons there is little if any evidence of stimulus onset, as illustrated for neuron KBI in Figure 5. The baselines for the transient group are nearly the same for each ISI; thus a comparable observation and interpretation are not justified there. The average response in the 50–150 ms interval after stimulus onset depicted in Figure 7 for the first five stimulus cycles was measured and is depicted on the left side of Figure 8. There the response amplitudes are shown for the transient and sustained groups as a function of both stimulus cycle and ISI condition. For both groups the response amplitude decreases substantially between the first and second stimulus and moderately thereafter for each stimulus cycle. The response amplitude dependency for the ISI is clear for the transient group and absent in the sustained group.
Figure 8.

Response rate and onset contrast for transient and sustained groups. Population response rate in the 50–150 ms interval after stimulus onset is plotted for each ISI condition for transient (A) and sustained (C) groups. Then a major rate change on the first repetition is followed by gradual decline. A differential ISI impact on transient, but not sustained, neurons is evident. Detection of the onset of individual stimulus responses is examined in B, D in terms of a contrast index (Re – Co)/(Re + Co) that compares the response (Re) with the immediately preceding control (Co) activity from the –50 to +50 ms interval surrounding stimulus onset. ISIs on the order of saccade durations result in a dramatically reduced onset contrast for sustained neurons (D), which indicates a continuous signal bridging across the ISI gap. Symbol legend in C defines the ISI conditions for the entire figure.
Activity in the interval preceding a response reduces the signal-to-noise ratio of the onset response of subsequent stimuli. For stimulus events well separated in time the activity has returned to background levels; however, for stimuli separated by intervals as short as saccade durations there can be considerable masking of the subsequent response. To demonstrate the consequence of this masking, we created an index to rate the contrast between a control period covering the interval from 50 ms before to 50 ms after the stimulus onset, with the response period of 50–150 ms after stimulus onset. These intervals were chosen to cover a time period that characterizes the average population response, as seen in Figure 4. A standard contrast index, (response – control)/(response + control), was applied to both transient and sustained groups, and the results are presented on the right side of Figure 8. This calculation provides a temporal contrast index that can be used to make a judgment regarding the onset of new stimulus. According to the results, the signal of the onset of the second and succeeding stimuli in a train of identical stimuli separated in time by the normal durations of saccades is diminished severely in V4 neurons. The transient response component fades (Fig. 8A) with decreasing ISIs and cycle repetitions. The remaining response activity, aided by a low background rate, maintains a small but viable contrast index value (Fig. 8B). The sustained component (Fig. 8C), on the other hand, maintains a clear signal of the presence of a receptive field stimulus, gradually decreasing with cycle repetitions but unchanged by decreasing ISIs. However, for neurons with sustained response components the response onset is obscured gradually as ISIs encroach on the response decay latency. As shown in Figure 8D, the response contrast index falls dramatically as the ISI approaches that of standard saccade durations. This indicates that neurons with predominantly sustained responses cannot be used to detect repeated stimulus onsets at ISIs in the saccade duration range. The activity of sustained components bridges across ISIs in the saccade duration range.
It is important to recall that the division into transient and sustained groups is arbitrary. The presence of these response components is graded smoothly across the population of V4 neurons, with many individual neurons having both components. Overall, these results demonstrate that, for trains of identical stimuli, ISIs that are in the range of saccade durations result in significantly diminished initial peak responses and increased peak latencies (>25 ms) (Fig. 7B). If measured with respect to the immediately preceding baseline activity, the responses are reduced additionally. In fact, at ISIs that mimic the saccade durations typical of visual search behavior, the activities of many V4 neurons fail to reflect the discrete sequential presentation of stimuli and adopt a rather continuous pattern of firing. Note the observation is that there is no clear onset response to the stimuli and not that there is a lack of activity. In fact, the activity in the sustained component of the response remains reasonably intact. This is indeed somewhat paradoxical in that phasic or transient response systems normally are associated with mechanisms that do respond to higher rates of stimulation; here the opposite seems to be the case.
There are several ways to interpret this observation; one hypothesis based on these results is that V4 neurons are relatively insensitive to the brief interruptions generated by saccades that effectively do not change what is in the receptive field. These conditions might occur regularly while the subject views an object, making only minor changes in the point of fixation. This hypothesis assumes that there are differences when the stimulus in the receptive field changes and that the appearance of a stimulus in a receptive field as the result of a saccade is comparable to the flash onset of a stimulus. This later assumption has some support (Gawne and Martin, 2002) and is consistent with our own preliminary investigation at the level of V4.
Mixed stimulus sequences
The conditions of habituation extend across intervening stimuli. If the response depends only on the intervening interval and the strength of response to the preceding stimulus, then a waxing and waning of the response to the sequence of repeated identical stimuli should be observed. Instead, the response progressively fades to lower response levels (Fig. 8A,C), indicating that the responsiveness is not tied directly to the level of the immediately preceding activation but rather to a cumulative factor, hence habituation. Nor is habituation tied directly to the base level of activity at the time of stimulus onset (Fig. 7D). However, during a mixed stimulus sequence the response to the preferred stimulus could be conditioned not only by whether there was a stimulus in the preceding interval but also by what that stimulus was. A response caused by a secondary, nonpreferred stimulus may not be equivalent to a habituation-reduced response produced by a preferred stimulus.
Using flashed stimuli during a maintained fixation task, we examined whether the responses to repeated objects were sensitive to the history of the stimulus properties of objects appearing in the receptive field. The examination of this issue was made by changing the color of the object (or by pairing dark and light stimuli) in the receptive field from one presentation to the next, again on a time scale similar to the fixation–saccade–fixation intervals. The SE stimulus was chosen to provide a clear but smaller response than the PR stimulus (see Materials and Methods). The relative strength of the response to the SE stimulus varied across neurons. The responses to the PR and SE stimuli were obtained for 130 neurons, using a stimulus duration of 200 ms and an ISI of 55 ms. A sequence consisted of eight stimuli. Two variations were used that provided tests of responsiveness at transitions between stimuli after one stimulus and after four consecutive stimuli. The Train A sequence (S-P-P-P-P-S-S-S) started with the SE stimulus; the Train B sequence (P-S-S-S-S-P-P-P) started with the PR stimulus (Fig. 1).
The analysis of the mixed sequence data considered the response to the PR stimulus as a function of the potential conditioning effects of the SE stimulus. In addition, the set of 130 cells for the mixed sequence study also was divided evenly into transient and sustained subgroups, using the same technique as for the identical stimulus series. This activity of each neuron was normalized to the response of the PR stimulus in the 50–150 ms interval after stimulus onset when it was presented without a preceding stimulus. After normalization the neurons were ranked according to the response in the interval 150–250 ms after stimulus onset for the same stimulus. Using the ranking, we then divided the neurons evenly (65 and 65) into transient and sustained groups.
The first issue to examine is whether there is a predictive relationship between sequential responses. Figure 10A depicts the response to the PR stimulus when it follows the SE stimulus that begins the Train A sequence. The different symbols in Figure 10A correspond to the transient and sustained (TS) categorizations of the neurons. Note that the response rates are normalized as above so that the PR stimulus when presented at the beginning of a Train B evokes a response of 1.0. The scattergram shows a broad trend in which the PR response is suppressed below 1.0 when SE responses are near a value of 1.0 and rebound to values at or even enhanced above 1.0 as SE responses approach a value of 0.0. The SE stimulus as the initial stimulus in the train elicits a response that is <1.0; that is the definition used to select secondary stimuli. A multiple linear regression on the PR response reveals that both the SE response (p < 0.001) and TS category (p = 0.002) contribute significantly to predicting the PR response. The relationship is given by the following equation: PR = 1.18 – 0.61 × SE + 0.23 × TS, with standard errors for each parameter of 0.1 in units of normalized spike rate. The spike rate of the sustained category data was shifted above the transient category data by 0.23. The unexpected result is that the PR response actually can be enhanced above its baseline when it is preceded by a weak SE response. However, the overall correlation (r = 0.48) accounts for only 23% of the variance.
Figure 10.

Scattergrams comparing responses during mixed stimulus sequences. Axis labels are coded by the stimulus type, PR or SE, and by a number that represents the position of the stimulus in the sequence train. The data for each neuron (n = 130) are coded as either transient (open inverted triangles) or sustained (filled circles) according to a ranked division of the set of neurons. The sustained neuron group (n = 65) had a slightly higher average test response than did the transient group (n = 65). The response of all neurons was normalized to the PR 1 stimulus response. A, A negative correlation exists between the responses to SE and PR stimuli delivered in that order at the beginning of Train A. B, The same SE and PR stimulus sequence occurring later in Train B results in a very different weak positive correlation, suggesting that the level of SE-evoked activity does not determine the conditioning effect. C, Direct comparison of the PR responses in A, B shows a strong positive correlation, indicating that the same conditioning effect of the SE stimulus (PR response different from 1.0) is present despite differences in the strength of the response to the SE stimulus. D, Strong correlations exist between the responses to the sequential presentation of the PR stimuli in the seventh and eighth positions of Train B. Comparison of B, D illustrates a quite different response to the PR stimulus, depending on whether it is preceded by an SE or PR conditioning stimulus, even if the conditioning stimuli elicit very similar responses. The diagonal lines show identity condition.
The time course of these relationships was examined by constructing histograms of the stimulus sequence. First, the transient and sustained categories were subdivided additionally according to the response to the SE stimulus. The median SE response in each category was used to divide each category evenly (32 and 33) into strong and weak SE response subgroups. The average population histogram for each of these four subgroups was calculated and is shown in Figure 9. The top graphs in Figure 9 show the transient neuron groups, with the data for the strong SE response subgroup shown as a thick line and the data for the weak subgroup as a narrow line. The bottom graphs show the same for the sustained neuron groups. The first two responses to the Train A sequence are shown on the left, and the full stimulus and response sequence is shown for Train B on the right. The histograms in Figure 9A illustrate the average response relationships shown by the transient neuron group (Fig. 10A, filled circles). The strength of the PR responses can be compared with the PR response when it is evoked by the first stimulus in the sequence, as shown in Figure 9B. A strong SE response (Fig. 9A) results in decreased response to the PR stimulus that follows, whereas a weak SE response is followed by a PR response that is practically the same as that evoked without a previous stimulus. For the sustained neuron group in Figure 9C the results are similar except that overall the PR response is greater, as is indicated by the regression evaluation of Figure 10A.
Figure 9.

Population response histograms to mixed stimulus sequence presentations. Trains A and B differ in the sequence of preferred and secondary stimuli. The full sequence for Train B is shown in the alternating timeline at the bottom of each histogram, with the stimulus periods marked by P for preferred and S for secondary stimuli. Histograms A, B show the results for the transient group of neurons, and C, D show the results for the sustained group of neurons. Each group has been subdivided additionally into strong (thick line) and weak (thin line) subgroups based on the response to the SE stimulus. The responses to PR stimuli after strong SE stimuli follow a pattern of reduced activation similar to sequential identical stimuli, but with an overall weaker effect (see Fig. 3). Responses to PR stimuli are enhanced after weak SE stimuli, even when the responses to weak and strong SE stimuli are equivalent. Stimulus duration, 200 ms; ISI, 55 ms.
The conditioning and test response relationship generated for the SE and PR stimuli were examined additionally after a series of four repeated stimuli, as illustrated in Figure 9, B and D. During the repetitions of the SE stimulus the sustained neuron groups adopt a nearly constant level of activity, with the individual stimulus onsets barely noticeable, whereas the transient groups fade enough between stimulus presentations that the onset of each stimulus in the sequence is apparent. The division into strong and weak SE response subgroups results in a distinct difference between the transient subgroups in Figure 9B, whereas for the sustained group neurons, Figure 9D, the difference between subgroups is not noticeable. The weak transient subgroup drops to low levels not only because it is defined by a weak response but also because the transient component is particularly vulnerable to repeated stimuli (Fig. 8). The weak sustained subgroup, on the other hand, benefits from the fact that the sustained component is not as susceptible to repeated stimuli. The paradigm provides a conditioning and test comparison for the SE and PR stimuli occurring as the fifth and sixth stimuli, respectively, in the trains. The response to the PR stimulus that follows the SE stimulus resembles the same basic pattern seen between the SE and PR stimuli presented at the beginning of Train A. The responses to the SE stimuli are, however, on the average considerably smaller, suggesting that the test response to the PR stimulus is not coupled tightly to the conditioning response produced by the SE stimulus. This was examined by comparing the two sets of responses directly.
If the amplitude of the response to the conditioning stimulus determines the response to the test stimulus, then we would expect to see a consistent pattern of condition and test relationships. In Figure 10B the responses to the PR stimulus in the sixth position of Train B are graphed as a function of the responses to the SE stimulus in the fifth position of Train B. The scattergrams (Fig. 10A,B) are clearly different yet represent conditioning and test relationships for the same set of stimuli and neurons at different positions in the stimulus train. This result indicates that the evoked response to the conditioning (SE) stimulus does not closely determine the test (PR) response. The individual PR responses under the two conditions are similar, but not well correlated with the SE response. Figure 10C illustrates that issue by plotting the response to the PR stimulus at the second and sixth positions in their respective trains. Responses to the PR stimulus at these two different conditioning intervals are nearly the same, clumping near or slightly below the identity line, and are correlated significantly (r = 0.76; p < 0.001). The displacement of the PR responses away from the normalized value of 1.0 marks the substantial conditioning effect of the SE stimulus. Thus the response of V4 neurons to a PR stimulus that follows an SE stimulus is nearly the same regardless of the amplitude of the actual response to the preceding SE stimulus.
One hypothesis that needs to be considered and then discarded is that this result (Fig. 10C) occurs because the PR responses are independent of the preceding stimulus condition and simply yield approximately the same response each time. The population histograms of Figure 9 demonstrate that this is not the case; the responses to PR stimuli are modulated by what precedes them, including the initial baseline case in which there is no immediately preceding stimulus. A second hypothesis to consider and reject is that the response of individual V4 neurons to a stimulus is inconsistent across repetitions. Figure 10C demonstrates that the responses are consistent even when examples are drawn from different parts of different stimulus trains. Consecutive identical stimuli within the same train offer additional support. Figure 10D plots the responses to the PR stimulus in the seventh and eighth positions of Train B and shows a significant correlation (r = 0.83; p < 0.001) among the responses of individual neurons to a repeated stimulus. For consecutive repetitions of the PR stimulus within the train sequence the correlations ranged from 0.70 to 0.95, and for consecutive repetitions of the SE stimulus the correlations ranged from 0.64 to 0.94, with a rise in correlation paralleling the level of habituation. Figure 10D illustrates that for many neurons the habituated level of activity is well below their initial response, which is for the PR stimulus a value of 1.0. This result is consistent with the results described earlier for the identical stimulus series (Fig. 8). Finally, Figure 10, B and D, offers an additional comparison of the importance of the stimulus properties rather than the evoked response in modulating a subsequent stimulus. The abscissas represent different stimuli (SE and PR) with a broad overlap in the amplitude of the evoked response (0.1–0.7). The ordinates represent the response to a subsequent PR stimulus. The response of the neurons to the PR stimulus under these two conditions is quite different despite the similarity of the evoked activity by the previous stimulus.
Relation to stimulus tuning properties
The simplest remaining hypothesis is that the responses in the mixed stimulus sequences are governed by the effectiveness of the conditioning stimuli as measured in isolation rather than the actual level of response during a prolonged stimulus sequence. Given the observation that identical (or nearly identical) stimuli generate the greatest conditioning suppression, the effectiveness of the PR stimulus may be a decreasing function of the baseline effectiveness of the SE conditioning stimulus. This distinction stresses the inherent static properties of the neuron, the baseline or tuning expression of its connections, over its current dynamic state. To pursue this issue, we asked whether the response to the SE stimulus was correlated to the stimulus tuning properties of the V4 neurons. That is, did the response to the SE stimulus index the tuning sensitivity of the neuron? The set of eight stimuli used to characterize the color sensitivity of the neurons represents a crude slice through color dimensional space and provides a rough assessment of tuning. Neurons were divided into three tuning categories, based on their responses to this set of eight stimuli. The “tuned” category represents neurons with sharply tuned responses to one or two items of the eight item stimulus set, the “broad” category represents broad sensitivity to the items in the set, and “exclusion” category represents neurons with broad responsiveness but distinct nonresponsiveness to one or two stimuli. The categorization was done in a blinded manner with regard to the selection of the PR and SE stimuli. As described in Materials and Methods, of the eight stimuli the one giving the best response was chosen as the PR stimulus, and the SE stimulus selection was intended to pick a stimulus that produced an obvious but distinctly suboptimal response. The choice of the SE stimulus was not based explicitly on a color-tuning consideration, however; for sharply tuned neurons a fairly poor response was the only available choice, and for broadly tuned neurons the only choice was a nearly equivalent stimulus. Figure 11A shows the relationship between the tuning category of a neuron and the response to the SE stimulus when it was presented as the first stimulus in Train B. Neurons in tuned and broad categories had obviously different response rates to the SE stimulus that was selected. Neurons in the exclusion category were similar to the broad category. This result simply demonstrates that the choice of the SE stimuli in fact did parallel the basic tuning distinction. Figure 11B replots the data of Figure 10A but with the symbols for each neuron now representing the tuning category for that neuron. Triangles represent neurons in the tuned category, and circles represent neurons in the broad category. As expected from Figure 11A, triangles generally have low SE responses, and circles generally have high SE responses. The few triangles to the right side and circles to the left side indicate that the selection of SE stimuli did not reflect perfectly the tuning category. More importantly, the few triangles to the right side demonstrate that, when an SE stimulus for a tuned neuron in fact does generate a good response, then response to the test PR stimulus is reduced. In summary, the tuned neurons in Figure 11B are responding well to the PR test stimulus because they are not tuned to the SE conditioning stimulus. When they are tuned to the SE stimulus (Fig. 11B, right side), then they respond poorly to the next PR stimulus.
Figure 11.

Correspondence between color tuning and the SE response amplitude. A, Neurons were divided into three categories based on their sensitivity to a set of eight color stimuli. Responses to SE stimuli are shown as box plots indicating medians and the 5th, 25th, 75th, and 95th percentiles. The box plots establish a general correspondence between tuning sensitivity and SE stimulus effectiveness. B, Replot of Figure 10A with symbols changed to indicate tuning category of the neurons. From the relationships that are depicted, an inference can be drawn that sharply tuned neurons are more likely to be activated strongly than are broadly tuned neurons during a heterogeneous sequence of stimuli. Categories are tuned (triangles), broad (circles), and exclusion (stars). The diagonal line shows identity condition.
From these results we draw the conclusion that selective tuning to stimulus properties underlies a particular pattern of sensitivity to the temporal sequence of stimuli. The response of a neuron to a rapid sequence of stimuli is governed by the sensitivity of the neuron to each stimulus. This is hardly a surprising statement except that in this case it is the tuning sensitivity of the neuron, not the actual state of activation of the neuron, that determines whether a particular response occurs. Consequently, although different stimuli may evoke equivalent responses during a sequence of stimuli, the conditioning effect of the stimuli is determined primarily by the tuning sensitivity of the neuron, not the amplitude of the evoked response. If in the extreme case the neuron is truly insensitive to the SE stimulus, then the conditioning stimulus is equivalent to a blank ISI period during which the neuron recovers from habituation. Neurons are therefore more sensitive to transitions from nonpreferred stimuli to preferred stimuli than to transitions between preferred stimuli (Fig. 9).
Given these conditions, the activation of neurons with different tuning characteristics can be summarized. Neurons with broad tuning sensitivity treat a wide range of stimuli as being nearly equivalent. Their response to a series of stimuli is similar to that observed in the identical stimulus series; at ISIs mimicking saccade durations, their transient components are suppressed, but their sustained components continue to signal the stimulus presence with little interruption during short ISI periods. On the other hand, sharply tuned neurons are activated relatively rarely (outside of laboratory stimulus sequences) and are therefore usually in a baseline state of responsiveness. One anticipated consequence for V4 neurons is that the stimulus transitions produced by eye movements (mimicking short ISIs) should produce relatively few response transients during search through relatively homogeneous scenes, because the receptive field stimulus will not change substantially. Sharply tuned neurons remain sensitive but have a low probability of encountering an effective stimulus in the receptive field, whereas broadly tuned neurons become habituated, paradoxically as the result of the high probability of encountering a receptive field stimulus that normally would excite the neuron.
Discussion
These results challenge the idea that the flow of visual information through the visual system simply is refreshed with each eye movement. When stimulus durations approximate fixation durations (∼200 ms) and when ISIs approximate saccade durations (∼55 ms or less), then sequences of repeated stimuli result in habituation-like response decreases. The result is a dramatic reduction in the response to each sequential stimulus onset. The initial transient response often is extinguished, leading to an apparent delayed response onset of the remaining sustained response component that itself often is weakened. Some neurons simply stop firing; in other cases a sustained discharge is maintained but with typically irregular synchronization to the stimulus onsets. These severe truncations in the response of neurons are alleviated at ISIs (217 and 327 ms) that mimic a short fixation with no stimulus in the receptive field. Certainly, the low variability of discharge and higher gain relationships associated with the transient components observed under some conditions (Muller et al., 2001) become quite irregular under sequenced flash and presumably saccade conditions. Saccade paradigms confirm that the short ISIs of flashed stimuli mimic aspects of sequences of stimuli appearing in the receptive field as a result of a saccade (Gawne and Martin, 2002). Thus our typical visual experience clearly is shaped by temporal crowding within the stream of visual information.
Temporal sensitivity and stimulus tuning curves
The breadth of tuning curves historically has been the provenance of stimulus sensitivity and coding associated with the properties of an object. The observations made here with mixed stimulus sequences suggest another major function or consequence of tuning properties, namely the temporal sensitivity of neurons to stimulus changes within the receptive field. During a sequence of mixed stimuli the habituation effects are modulated by the sensitivity of the neuron to the different stimuli. When the sequence was examined in terms of conditioning and test pairs of stimuli, neither individual nor population analyses could identify a clear relationship between the active response to the conditioning stimulus and the modulated test response. Neither the amplitude of neural activity evoked by a conditioning stimulus nor the level of activity in the immediate interstimulus decay interval reliably predicts the response to a preferred test stimulus. Instead, there is a negative correlation between the response to the preferred test stimulus and the tuning sensitivity of the neuron to the conditioning stimulus. The response to the preferred test stimulus is based on the potential sensitivity of the neuron to the conditioning stimulus and not on the actual response to the conditioning stimulus. The simplest explanation for this result is that the conditioning and test stimuli share some common pathway in proportion to their similarity in tuning. The conditioning stimulus then could trigger a habituation in the test stimulus pathway that is proportional to the tuning overlap between the two stimuli rather than a function of the V4 response to the conditioning stimulus. Regardless of this explanation, the observed relationship has major consequences. Neurons with coarse tuning profiles will be less sensitive to moment-to-moment, fixation-to-fixation changes of stimuli within their receptive field, because responses to successive equivalent stimuli are subject to habituation. The habituated responses tend to lose their onset transients and meld into a sustained level of firing across sequences of equivalent stimuli. On the other hand, neurons with sharp tuning profiles will remain relatively sensitive to stimulus changes in their receptive fields. It seems unlikely that these issues are restricted to any particular stimulus dimension but rather expose a consequence of tuning within the temporal domain.
The responses of middle temporal area (MT) neurons to condition and test pairs of moving stimuli (Priebe and Lisberger, 2002; Priebe et al., 2002) show some remarkable similarities to the results described here. Over approximately the same ISIs there is a gradual loss of the transient component of the MT response to motion (Priebe et al., 2002). Furthermore, the greatest degree of rapid adaptation (habituation) observed in MT neurons occurred when the direction of conditioning motion matched that of the test stimulus motion (Priebe and Lisberger, 2002). The conclusions of the MT studies were that the response adaptations were attributable to mechanisms within MT and that MT results were neither relayed from earlier visual areas nor simply related to the activity of individual MT neurons. These results dovetail nicely with the time scale and stimulus tuning described here for V4 neurons. The conclusions reached for MT neurons, that the sustained components carried the motion signal, suggest a similar conclusion that MT neurons would be relatively insensitive to eye movements that did not change effectively the stimulus in the receptive field. This conclusion is consistent with the observation in MT that conditioning and test stimuli could be placed at different locations within the receptive field without a major change in the results (Priebe et al., 2002). The similarity in the profiles of activity for MT and V4 neurons across transient stimulus intervals suggests a relatively unexplored physiological relationship between eye movements and stimulus histories in visual cortical processing.
Visual transients and transient responses
In the studies reported here, stimulus onset asynchronies in the flash sequences were always >255 ms. Therefore, the time frame of these presentations is outside the typical framework for masking studies (Breitmeyer, 1984). These parameters are also outside the standard ranges associated with spatiotemporal interactions involving motion perception. However, the results of these studies seem to be relevant to change blindness and rapid serial visual presentation (RSVP) paradigms.
Change blindness is a phenomenon in which the observer is unable to detect changes in his or her field of view across some momentary interruption of the visual scene, such as a blank interval, or across a blink or saccadic eye movement (Rensink, 2002). Within change blindness paradigms the detection of change is often relatively easy to make in the absence of the interrupting event, but it requires attention to be paid to the changing item to detect the change across the interrupting event. The neural studies here report that a blanking event of 100 ms is sufficient to reset many V4 neurons to a greater level of sensitivity, whereas shorter interruptions tend toward relatively stable or habituated levels of response. Change detection in stable uninterrupted conditions is aided by the tendency for attention to be drawn to onset events (Yantis and Jonides, 1984; Egeth and Yantis, 1997). This advantage is defeated if an interrupting mask lasts sufficiently long to reset the visual system such that many onset-like events occur at the end of the interrupting event. Discovery of the object that actually changes is confounded by the introduction of many onset events, thereby reducing the possibility that attention is drawn to the changed location. The neural responses seen in V4 provide evidence that a sufficiently long blank interval is as effective as an active addition of many stimuli (mud splash) or even a shift of the entire scene (as during a saccade) in generating a large number of onset events that reduce the probability of noticing any particular change detection event. If attention is directed to the changing item location, whether by cueing or by chance, the change event is noted easily. Given that the changed object will appear after a blank interval, the response it evokes actually may be stronger than it would have been in the absence of the blanking interval.
What defines the visual transient? Most arguments regarding the capture of attention and detection of object appearance are based on the timeline of the physical stimuli. Our results demonstrate that the temporal profile of activity is altered considerably at or before the level of V4. Both transient and sustained aspects of neural coding as well as the tuning properties of neurons play important roles in this transformation. The specific loss of the information-rich transient components (Gershon et al., 1998; Mechler et al., 1998; Muller et al., 2001) might underlie some of the decreased ability to identify particular stimuli or stimulus pairs in RSVP paradigms. In addition, the wide variations in response onset latencies caused by the partial or complete loss of the transient component of V4 responses might underlie some identification loss or confusion, particularly if temporal synchronization across different hierarchical areas plays a significant role in stimulus identification (Thorpe et al., 2001). Morphing these relatively simple response alterations to explain the varieties of blindness phenomena that have been described in the literature is difficult. In addition, simple changes in attentional bias significantly alter the sensitivity of V4 neurons to objects. For example, a top-down selection for red stimuli dramatically alters the sensitivity of V4 neurons to red and non-red objects (Motter, 1994). Thus the neural representation of objects in a RSVP stream can be altered significantly by both attentive and temporal crowding factors. Certainly, these factors need to be considered in interpreting the results of paradigms that use sequences of stimuli.
Footnotes
This work was supported by the Veterans Affairs Medical Research Program.
References
- Allman J, Miezin F, McGuiness E. Stimulus-specific responses from beyond the classical receptive field: neurophysiological mechanisms for local–global comparisons in visual neurons. Annu Rev Neurosci. 1985;8:407–430. doi: 10.1146/annurev.ne.08.030185.002203. [DOI] [PubMed] [Google Scholar]
- Breitmeyer BG. Visual masking: an integrative approach. New York: Oxford UP; 1984. [Google Scholar]
- DiCarlo JJ, Maunsell JHR. Form representation in monkey inferotemporal cortex is virtually unaltered by free viewing. Nat Neurosci. 2000;3:814–821. doi: 10.1038/77722. [DOI] [PubMed] [Google Scholar]
- Egeth HE, Yantis S. Visual attention: control, representation, and time course. Annu Rev Psychol. 1997;48:269–297. doi: 10.1146/annurev.psych.48.1.269. [DOI] [PubMed] [Google Scholar]
- Gallant JL, Connor CE, van Essen DC. Neural activity in areas V1, V2, and V4 during free viewing of natural scenes compared to controlled viewing. NeuroReport. 1997;9:2153–2158. doi: 10.1097/00001756-199806220-00045. [DOI] [PubMed] [Google Scholar]
- Gawne TJ, Martin JM. Responses of primate visual cortical neurons to stimuli presented by flash, saccade, blink, and external darkening. J Neurophysiol. 2002;88:2178–2186. doi: 10.1152/jn.00151.200. [DOI] [PubMed] [Google Scholar]
- Gawne TJ, Woods JM. The responses of visual cortical neurons encode differences across saccades. NeuroReport. 2003;14:105–109. doi: 10.1097/00001756-200301200-00020. [DOI] [PubMed] [Google Scholar]
- Gershon ED, Wiener MC, Latham PE, Richmond BJ. Coding strategies in monkey V1 and inferior temporal cortices. J Neurophysiol. 1998;79:1135–1144. doi: 10.1152/jn.1998.79.3.1135. [DOI] [PubMed] [Google Scholar]
- Kapadia MK, Westheimer G, Gilbert CG. Spatial distribution of contextual interactions in primary cortex and in visual perception. J Neurophysiol. 2000;84:2048–2062. doi: 10.1152/jn.2000.84.4.2048. [DOI] [PubMed] [Google Scholar]
- Knierim JJ, van Essen DC. Neuronal responses to static texture patterns in area V1 of the alert macaque monkey. J Neurophysiol. 1992;67:961–980. doi: 10.1152/jn.1992.67.4.961. [DOI] [PubMed] [Google Scholar]
- Landman R, Spekreijse H, Lamme VA. Set size effects in the macaque striate cortex. J Cogn Neurosci. 2003;15:873–882. doi: 10.1162/089892903322370799. [DOI] [PubMed] [Google Scholar]
- Livingstone MS, Freeman DC, Hubel DH. Visual responses in V1 of freely viewing monkeys. Cold Spring Harbor Symp Quant Biol. 1996;61:27–37. [PubMed] [Google Scholar]
- Mazer JA, Gallant JL. Goal-related activity in V4 during free viewing visual search: evidence for a ventral stream visual salience map. Neuron. 2003;40:1241–1250. doi: 10.1016/s0896-6273(03)00764-5. [DOI] [PubMed] [Google Scholar]
- Mechler F, Victor JD, Purpura KP, Shapley R. Robust temporal coding of contrast by V1 neurons for transient but not for steady-state stimuli. J Neurosci. 1998;18:6583–6598. doi: 10.1523/JNEUROSCI.18-16-06583.1998. [DOI] [PMC free article] [PubMed] [Google Scholar]
- Motter BC. Neural correlates of color and luminance feature selection in extrastriate area V4. J Neurosci. 1994;14:2178–2189. doi: 10.1523/JNEUROSCI.14-04-02178.1994. [DOI] [PMC free article] [PubMed] [Google Scholar]
- Motter BC, Belky EJ. The guidance of eye movements during active visual search. Vision Res. 1998;38:1805–1815. doi: 10.1016/s0042-6989(97)00349-0. [DOI] [PubMed] [Google Scholar]
- Motter BC, Holsapple JW. Cortical image density determines the probability of target discovery. Vision Res. 2000;40:1311–1322. doi: 10.1016/s0042-6989(99)00218-7. [DOI] [PubMed] [Google Scholar]
- Muller JR, Metha AB, Krauskopf J, Lennie P. Information conveyed by onset transients in responses of striate cortical neurons. J Neurosci. 2001;21:6978–6990. doi: 10.1523/JNEUROSCI.21-17-06978.2001. [DOI] [PMC free article] [PubMed] [Google Scholar]
- Priebe NJ, Lisberger SG. Constraints on the source of short-term motion adaptation in macaque area MT. II. Tuning of neural circuit mechanisms. J Neurophysiol. 2002;88:370–382. doi: 10.1152/jn.2002.88.1.370. [DOI] [PMC free article] [PubMed] [Google Scholar]
- Priebe NJ, Churchland MM, Lisberger SG. Constraints on the source of short-term motion adaptation in macaque area MT. I. The role of input and intrinsic mechanisms. J Neurophysiol. 2002;88:354–369. doi: 10.1152/.00852.2002. [DOI] [PMC free article] [PubMed] [Google Scholar]
- Rensink RA. Change detection. Annu Rev Psychol. 2002;53:245–277. doi: 10.1146/annurev.psych.53.100901.135125. [DOI] [PubMed] [Google Scholar]
- Richmond BJ, Hertz JA, Gawne TJ. The relation between V1 neuronal responses and eye movement-like stimulus presentations. Neurocomputing. 1999;26:247–254. [Google Scholar]
- Shapiro KL. The limits of attention. New York: Oxford UP; 2001. [Google Scholar]
- Sheinberg DL, Logothetis NK. Noticing familiar objects in real world scenes: the role of temporal cortical neurons in natural vision. J Neurosci. 2001;21:1340–1350. doi: 10.1523/JNEUROSCI.21-04-01340.2001. [DOI] [PMC free article] [PubMed] [Google Scholar]
- Simons DJ. Attentional capture and inattentional blindness. Trends Cogn Sci. 2000;4:147–155. doi: 10.1016/s1364-6613(00)01455-8. [DOI] [PubMed] [Google Scholar]
- Thorpe S, Delorme A, Van Rullen R. Spike-based strategies for rapid processing. Neural Netw. 2001;14:715–725. doi: 10.1016/s0893-6080(01)00083-1. [DOI] [PubMed] [Google Scholar]
- Yantis S, Jonides J. Visual onsets and selective attention: evidence from visual search. J Exp Psychol Hum Percept Perform. 1984;10:601–621. doi: 10.1037//0096-1523.10.5.601. [DOI] [PubMed] [Google Scholar]
- Zipser K, Lamme VAF, Schiller PH. Contextual modulation in primary visual cortex. J Neurosci. 1996;16:7376–7389. doi: 10.1523/JNEUROSCI.16-22-07376.1996. [DOI] [PMC free article] [PubMed] [Google Scholar]