

Abstract
Lesion and functional imaging studies in humans have suggested that the dorsolateral prefrontal cortex (DLPFC), ventrolateral prefrontal cortex (VLPFC), and intraparietal sulcus (IPS) are involved in orienting attention. A functional magnetic resonance imaging study supplemented by a behavioral experiment examined the effects of 5 Hz repetitive transcranial magnetic stimulation (rTMS) conditioning to the right and left DLPFC on reaction times and synaptic activity as indexed by changes in the blood oxygenation level-dependent (BOLD) signal during a cued choice reaction time task. Orienting precues were either correct (valid) or incorrect (invalid) with respect to the subsequent move cue. The effects of real and sham rTMS were compared for each site of stimulation. Invalid trials showed a significant increase in response times and increases in the BOLD signal in right frontal and parietal regions when compared with valid trials. Conditioning left DLPFC with rTMS led to decreased BOLD signal during performance of this reorienting task in areas including left VLPFC and left IPS. Comparing invalid to valid trials after right DLPFC conditioning revealed decreased BOLD signal in right VLPFC. Data from the behavioral study showed that right DLPFC rTMS selectively increases response times in invalid trials. This effect was only present in the first 10 min after rTMS conditioning. No effect was found in either validly or invalidly cued trials with left DLPFC conditioning. These results suggest that 5 Hz rTMS over right DLPFC exerts remote effects on the activity of areas that functionally interact with the DLPFC during attentional processes, particularly when the reorienting of attention is more demanding as in invalid trials.
Keywords: attention, functional imaging, dorsolateral prefrontal cortex, Posner task, reorienting, repetitive transcranial magnetic stimulation
Introduction
The “Posner task” has been used extensively in the study of reorienting attention (Posner et al., 1984). Neuropsychological studies in patients with frontal and parietal lesions showed that damage to parietal cortex leads to impaired stimulus detection, particularly when misleading advance information is provided, such as when trials are invalidly precued (Posner et al., 1984, 1987; Petersen et al., 1989; Losier and Klein, 2001). Patients with prefrontal damage are also very slow in such tasks (Mesulam, 1981; Posner et al., 1987; Petersen et al., 1989). Neuroimaging studies identified a specific network for reorienting attention comprising the middle frontal gyri bilaterally and the intraparietal sulcus (IPS) (Steinmetz and Constantinidis, 1995; Coull and Nobre, 1998; Corbetta and Shulman, 2002; Giessing et al., 2004; Thiel et al., 2004). However, recent evidence shows diverging lateralized networks in the context of shifting visual attention (Corbetta et al., 2000; Liu et al., 2003) compared with shifting attention for task-relevant information (Banich et al., 2000; Dove et al., 2000; Stephan et al., 2003). Previous neuroimaging experiments with repetitive transcranial magnetic stimulation (rTMS) delivered to the primary motor cortex (M1) or dorsal premotor cortex (PMd) showed changes in task-related activity and connectivity, suggesting that the brain reorganizes in response to rTMS conditioning (Lee et al., 2003; Rounis et al., 2005). The aim of this study was to test whether similar reorganization occurs when rTMS is delivered to the lateral prefrontal cortex, known to play a crucial role in the process of reorienting attention (Asaad et al., 2000; Wallis et al., 2001; Wallis and Miller, 2003).
Physiological studies of the effects of “off-line” 5 Hz rTMS to motor (Peinemann et al., 2004) and dorsal premotor (Rizzo et al., 2004) cortices have shown that it induces efficient, long-lasting increases in neuronal excitability. By analogy with on-line “virtual” lesions caused by single-pulse TMS applied during task performance (Jahanshahi and Rothwell, 2000), we hypothesized that persistent effects of conditioning 5 Hz rTMS over dorsolateral prefrontal cortex (DLPFC) would alter behavioral performance and lead to changes in brain activity measured with functional magnetic resonance imaging (fMRI) in a variant of the original Posner paradigm in which subjects performed a cued visual choice reaction time (RT) task that required bimanual responses. This was based on evidence from a preliminary behavioral study suggesting that right DLPFC conditioning leads to selective prolongation of RTs in invalid trials (Siebner et al., 2003).
In the present study, the combined fMRI/rTMS investigation was supplemented with a separate behavioral study performed outside the scanner to replicate the rTMS effect reported by Siebner et al. (2003). In both studies, a counterbalanced design was used in which RTs of validly and invalidly cued trials were compared between real and sham sessions on separate days. Although it was not possible, for technical reasons, to start fMRI measurements earlier than ∼6 min after the end of rTMS stimulation, the advantage of the behavioral study outside the scanner was that it enabled us to test for rTMS-induced effects immediately after the end of the stimulation.
Materials and Methods
Subjects
Twelve healthy, right-handed volunteers (three females) aged between 24 and 48 years (mean age, 31.1 years) and an additional eight healthy, right-handed volunteers (two females) aged between 23 and 50 years (mean age, 35 years) with normal vision and no history of neurological disorder or head injury were recruited from the database of volunteers at the Functional Imaging Laboratory (Institute of Neurology, University College London, UK) for the neuroimaging and the behavioral studies, respectively. Written informed consent was obtained from all participants. The study was approved by the joint ethics committee for the National Hospital for Neurology and Neurosurgery (University College London Hospitals National Health Service Trust) and the Institute of Neurology (University College London).
Experimental design
Subjects in the fMRI experiment attended four separate 20 min event-related fMRI scanning sessions (Fig. 1) all preceded by an off-line session of 5 Hz rTMS. On the first two scanning sessions, they received either real or sham rTMS conditioning to one DLPFC. On two subsequent scanning sessions, they received real or sham rTMS to the other side (left DLPFC if they had started with right and vice versa).
Figure 1.

Experimental design for the fMRI study. A, Subjects attended on four separate sessions in which they received real and sham 5 Hz rTMS conditioning to their right and left DLPFC, followed by a 20 min fMRI scanning session. Subjects were allocated to each session in a counterbalanced order. B, Description of each individual session. Subjects had a 10 min practice session to ensure familiarity with the task, followed by all of the procedures before rTMS conditioning (left): motor hot spot identification, marking of the DLPFC site to be stimulated, and measurement of the AMT. These were all performed in a separate testing room outside of the scanner. After rTMS, subjects were wheeled into the scanner room with an MRI-compatible wheelchair and set up to begin fMRI scanning. This took on average 6 ± 2.4 min, accounting for the time to scout and allow the scanner to perform shimming before fMRI data acquisition.
Subjects in the behavioral experiment also attended four separate testing sessions, in which they underwent the same conditioning protocol as above, which was followed by behavioral testing (without fMRI scanning) on the same task as the fMRI participants (Fig. 2).
Figure 2.

Experimental design for the behavioral study. Subjects attended on four separate sessions in which they received real and sham 5 Hz rTMS conditioning to their right and left DLPFC, followed by two (time 1, 0–10 min; time 2, 10–20 min) 10 min blocks of behavioral testing starting immediately after the end of rTMS conditioning in the same testing room. There was no gap between the time 1 and time 2 testing blocks. Subjects were allocated to each session in a counterbalanced order.
Session order by side (right or left DLPFC) and type (real or sham) were counterbalanced across subjects. This generated two between-session factors (side and type of rTMS conditioning) plus within-session factors generated by the experimental task (see below). The use of separate sham conditioning of both hemispheres was motivated by the knowledge that there may be lateralized task-related changes of blood oxygenation level-dependent (BOLD) activity in the reorienting task we used (Corbetta and Shulman, 2002). We were particularly interested in the effects of conditioning on task performance in all trial types (task × TMS interaction), in the changes of local brain activity associated with valid and invalid trials separately (main effect of task type), and in interactions between validity and side of hand response (conditioning × validity interactions and conditioning × validity × hand interactions). Given that the right and left DLPFC were conditioned in separate sessions and that previous imaging studies suggested lateralization in reorienting attention (Rushworth et al., 1997, 2001a,b; Corbetta and Shulman, 2002; Liu et al., 2003), we hypothesized that the effects of rTMS conditioning might be hemisphere dependent.
Experimental task
fMRI study
A cued choice reaction time task was used (Fig. 3). Stimuli were presented in the scanner against the gray background of an liquid crystal display monitor projected (NEC LT 157 projector; NEC Visual Systems, Itasca, IL) onto a screen via a mirror at a distance of 105 cm from the subjects' eyes. Responses were made with subjects' index fingers using two MRI-compatible keypads. Subjects were instructed to fixate a central black cross subtending 1° of visual angle. Each trial began with the presentation of a cue in the form of directional arrows subtending 3.5° of visual angle to the left or right of the fixation cross, present on the screen for 250 ms. The side of cue indicated whether subjects should prepare to respond with a movement of the left or right finger. After disappearance of the cue, the fixation cross was visible alone for 750 ms and then followed by a visual target (on the screen for 250 ms). The target stimulus was a “0” centered 4° to either the left or right of the fixation cross. Subjects were required to respond as rapidly and accurately as possible by a finger press on the side at which the target stimulus appeared. In 80% of trials, the target location was correctly indicated by the cue (valid trials). In 20% of trials, subjects were cued toward the wrong location (invalid trials). In this case, subjects had to move the index finger opposite to the one they had prepared to move. After disappearance of the target, the fixation cross was presented alone for 1550 ms before the next trial sequence began. Each trial was 2.8 s in duration. Validly and invalidly cued trials were presented randomly and were interspersed by null events in which no cues were presented other than the central fixation cross. In each scanning session, subjects were presented with a total of 475 trials comprising 20% null events and 80% cued response trials, of which 20% were invalidly cued and 80% were validly cued. The random presentation of stimuli in each scanning session controlled for any order effects of stimulus presentation. Before scanning, subjects practiced for 10 min to familiarize themselves with the task.
Figure 3.

Task. The task was a Posner-type cued choice reaction time task. Subjects maintained fixation on a central black cross against a gray background. A cue in the form of two directional arrows placed on either side of the fixation cross indicated whether the subjects should prepare a response with their left or right index finger. After the disappearance of the cue, a target stimulus was presented to the left or right of a fixation cross. Subjects were required to respond as rapidly and accurately as possible by pressing the index finger corresponding to the side where the target stimulus appeared. In 80% of the trials, the target location was correctly indicated by the cue (valid trials). In 20% of the trials, the cue was incorrect and the target appeared in the opposite direction to that indicated by the cue (invalid trials).
Previous imaging studies of Posner-type paradigms have shown that invalid trials introduce consistent behavioral effects and changes in local brain activity (Corbetta et al., 1993; Nobre et al., 1997; Nobre, 2001; Thiel et al., 2004).
COGENT 2000 software (available at www.fil.ion.ucl.ac.uk/cogent2000/) was used to generate visual stimuli and record behavioral responses and reaction times. The behavioral data were subsequently analyzed using Matlab 6.5 (MathWorks, Sherborn, MA) and SPSS 11.5 (SPSS, Chicago, IL). In three subjects, eye movements were monitored with an infrared eye tracker (model R-LR06; Applied Science Laboratories, Bedford, MA) sampled at 60 Hz to confirm correct performance of the task. These data were not formally analyzed for any other purpose.
Behavioral study
This experiment used the same task as in the fMRI experiment to study the effects of 5 Hz rTMS over DLPFC on reaction times. It complemented the behavioral data obtained during imaging in that it allowed the effects of rTMS to be tested immediately after conditioning and outside the scanning environment. Indeed, as can be seen in Figure 1, BOLD fMRI scanning and hence behavioral testing in the fMRI study started 6.0 ± 2.4 min on average after the end of rTMS conditioning for technical reasons related to fMRI scanning.
A preliminary study, published previously in abstract form (Siebner et al., 2003), compared RTs with the same task before and after 5 Hz rTMS to the left and right dorsomedial PFC and DLPFC. It showed that right DLPFC conditioning selectively prolonged RTs in invalid trials. Although RT data collection in that study also started immediately after the end of stimulation, the results cannot be extrapolated to neuroimaging behavioral data in this study because of differences in design [RTs in the study by Siebner et al. (2003) were compared before and after rTMS]. We set out to investigate whether the changes in RTs observed by Siebner et al. (2003) could be replicated in a counterbalanced design in which valid and invalid trials were compared between real and sham 5 Hz rTMS conditioning on separate days.
The fMRI task was used, as illustrated in Figure 3. Stimuli were presented against the gray background of a cathode ray tube monitor refreshing at 120 Hz (screen 40 cm away from the subjects' eyes). Responses were made on two separate one-key button boxes (one for each hand). This experiment duplicated the size of stimuli and timings used during fMRI. As in the scanning experiment, valid and invalidly cued trials were presented randomly and were interspersed by null events. Although the proportions of null, valid, and invalidly cued trials remained the same, subjects were only presented with a total of 400 stimuli split in two blocks. Each block consisted of 200 trials, comprising 20% null events and 80% cued response trials, of which 20% were invalidly cued and 80% were validly cued. The length of each block was ∼10 min. RT measurements were therefore collected within the first 10 min after 5 Hz rTMS conditioning (time 1) and 10–20 min after conditioning (time 2). Eye movements were monitored with an infrared eye tracker (Eye-trac model 310; Applied Science Laboratories) and sampled at 200 Hz (12 bit analog-to-digital card; DAQ 1200; National Instruments, Austin, TX). If the eyes strayed horizontally from fixation by >3° of visual angle, a trial was repeated.
rTMS
In each rTMS conditioning session, 1800 biphasic stimuli, at a stimulation intensity of 90% of active motor threshold (AMT) for the right first dorsal interosseous (FDI) muscle, were given over left or right DLPFC area using a MagStim (Whitland, Wales, UK) rapid stimulator connected to four booster modules. The conditioning rTMS stimuli were delivered in six 1-min trains of 5 Hz at 90% of AMT separated by an intertrain interval of 1 min. A standard figure-of-eight-shaped coil (Double 70 mm Coil Type P/N 9925; MagStim) was used for real rTMS. For sham rTMS, a specially designed sham coil that induced no magnetic field but provided a comparable acoustic stimulus was used (MagStim). The coil was positioned with the handle at 45° to the sagittal plane. The current flow in the initial rising phase of the biphasic pulse in the TMS coil induced a posterior-to-anterior current flow in the underlying cortex.
The site of rTMS stimulation was located 5 cm anterior to the “motor hot spot” on a line parallel to the midsagittal line (Fig. 4). This is the same location of DLPFC stimulation as in the studies by Mottaghy et al. (2002) and Siebner et al. (2003). The motor hot spot was defined functionally as the point of maximum evoked motor response in the slightly contracted right FDI. The active motor threshold was defined as the lowest stimulus intensity that elicited at least five twitches in 10 consecutive stimuli given over the motor hot spot. The contracted FDI was used to define the active motor threshold because TMS-evoked twitches are clearly visible and it has a threshold below other intrinsic hand muscles (Wassermann et al., 1996). This ensured that the intensity used for rTMS was below motor threshold for all hand muscles. The use of subthreshold intensity reduced the spread of stimulation away from the targeted site (Pascual-Leone et al., 1994; Gerschlager et al., 2001; Munchau et al., 2002). An intensity of 90% AMT was used according to the stimulation protocol known to produce robust increases in corticospinal excitability when delivered to the PMd (Rizzo et al., 2004).
Figure 4.

rTMS conditioning protocol. rTMS conditioning protocol for the DLPFC. The 5 Hz rTMS was delivered in six 1 min blocks (300 pulses) at 90% AMT separated by an intertrain interval (ITI) of 1 min (Rizzo et al., 2004). The site of stimulation was determined functionally to be 5 cm anterior to the motor hot spot (Mottaghy et al., 2002). R, Right; L, left.
rTMS conditioning was performed off-line (Pascual-Leone et al., 1994; Jahanshahi and Rothwell, 2000) before scanning or testing but after an initial practice session. The total duration of stimulation was 11 min. In the fMRI study, scanning was initiated at ∼6 ± 2.4 min after the end of the stimulation period. In the behavioral study, testing was initiated immediately after the end of the stimulation period. Previous studies have shown that the effects of 5 Hz rTMS conditioning on cortical excitability or regional neuronal activity can last for up to 1 h after the end of the stimulation (Peinemann et al., 2004; Rounis et al., 2005).
fMRI
Scanning procedure
The experiment was performed on a 1.5 T Sonata whole-body scanner (Siemens Medical Systems, Erlangen, Germany) using a whole-body coil for receptive field transmission and a head coil for signal reception. A gradient echo planar imaging sequence was used (echo time, 50 ms; repetition time, 3.6 s). Each brain image was acquired in a descending sequence comprising 40 slices (2 mm thick with 1 mm gap), providing whole-brain coverage and consisting of 64 × 64 voxels. Head movement was minimized during scanning by a comfortable external head restraint. A total of 390 whole-brain images were obtained over 23.4 min. Whole-brain structural scans with fiducials marking the location of rTMS conditioning were also acquired in each subject using a T1-weighted three-dimensional modified driven equilibrium Fourier transform sequence with optimized parameters, as described previously (Deichmann et al., 2004).
Statistical analysis
fMRI study
Behavioral data.
Mean reaction times for each subject for each condition were calculated and entered into a four-way repeated-measures ANOVA with the following factors: between-session factors of (1) type and (2) side of rTMS conditioning with two levels (real vs sham for factor 1; right vs left for factor 2) and within-session factors of (3) cue type and (4) hand for motor response with two levels (invalid vs valid for factor 3; right vs left for factor 4). RTs larger than 3 SDs from the mean were excluded on a trial-by-trial basis. Error trials were also excluded from the RT analysis. A Greenhouse–Geisser correction was used when appropriate. Two classes of errors (errors of omission when subjects failed to respond to the target and errors of commission when subjects responded in the opposite direction) were combined and entered into four-way ANOVAs with the same factors.
When an F value was significant, post hoc paired-sample t tests were performed. Data are presented as means ± SD. A p value of <0.05 was considered significant.
Imaging data.
The imaging data were analyzed with SPM2 (http://www.fil.ion.ucl.ac.uk/spm/spm2.html) using Matlab 6.5 (MathWorks). The first five volumes were discarded to allow for T1 equilibration. The remaining 385 scans for each subject were realigned to the first image and unwarped (corrected for movement × distortion interactions) (Andersson et al., 2001). Using a nonlinear warping procedure (Ashburner and Friston, 1999), the images were then spatially transformed to standard stereotaxic space [with respect to the Montreal Neurologic Institute (MNI) coordinate system (x, y, z)] and spatially smoothed with a three-dimensional Gaussian kernel (full-width half-maximum of 8 mm).
In the subsequent statistical analysis, statistical parametric maps based on t statistics were calculated for condition-specific effects using a general linear model (Friston et al., 1995). Within each session, the four conditions of the 2 × 2 factorial experimental design (valid vs invalid cues for left- vs right-sided responses) were modeled by representing each correct response as a delta function convolved with two basis functions: a canonical hemodynamic response function and its temporal derivative. Incorrect (errors of commission) and missing (errors of omission) responses were modeled separately. Effects of interest were examined in each subject using linear contrasts. A high-pass filter ( s cutoff) was used to control for low-frequency drifts; the data were whitened using a first-order autoregressive [AR(1)] model to control for serial autocorrelation (Friston et al., 2002).
The resulting subject-specific contrast images were then entered into second-level random effects analyses using one-sample t tests. All reported results are significant at a threshold of p < 0.05 whole-brain corrected at the cluster level (using a standard p < 0.001 cutoff at the voxel level).
Behavioral study
For each subject, the mean RT and error rates were calculated in each condition, separately for each block (at time 1 and time 2). RTs larger than 3 SDs from the mean were excluded on a trial-by-trial basis. Error trials were also excluded from the RT analysis. Reaction times and error rates were entered into four-way repeated-measures ANOVAs, as above, using the Greenhouse–Geisser correction when appropriate. The factor type of stimulation had two levels (real vs sham), and the factor side of rTMS conditioning had two levels (right vs left) and so did the within-session factors cue type (valid vs invalid) and hand for motor response (right vs left). When an interaction F value was significant, follow up ANOVAs and/or post hoc paired-sample t tests were performed. Data were analyzed using SPSS 11.5 (SPSS). Results were considered significant if the p value was <0.05.
Results
fMRI study
No subject reported adverse side effects during the course of the study. Mean active motor threshold for right FDI was 53% of maximum stimulator output (range of 46–63%). Mean active motor threshold for left FDI was 49% of maximum stimulator output (range of 39–67%).
Behavioral data
Subjects made two types of errors in this task: errors of omission accounting for 10% of the total trials (missed responses) and errors of commission (responding to the opposite side of the target) accounting for 3%, making the total average of wrong responses 13%. Errors of omission were not significantly different in either validly or invalidly cued trials after 5 Hz rTMS conditioning to either hemisphere. Errors of commission, however, did show a trend for a main effect of cue type (F(1,11) = 4.712; p = 0.073), suggesting an increase in error rates in invalid compared with validly cued trials. No effects of 5 Hz rTMS were revealed on errors of commission.
A four-way repeated-measures ANOVA with stimulation type (real vs sham rTMS), stimulation side (right vs left DLPFC), cue type (valid vs invalid), and hand for motor response (right vs left) revealed a significant main effect of cue type (F(1,11) = 52.89; p < 0.001). Post hoc t tests revealed that reaction times on invalid trials were slower than on valid trials (t(11) = −5.503; p < 0.001) (Fig. 5). No other significant main effects or interactions were found (Table 1). Table 1 and Figure 5 summarize the RT results.
Figure 5.
fMRI study. behavioral effects of cue type and conditioning of DLPFC on RTs. The 5 Hz rTMS conditioning did not lead to any significant changes in RTs in either valid or invalid trials whether applied over the left or right DLPFC. However, a significant main effect of cue revealed slower RTs in invalidly cued trials (352 ± 12 ms) than in validly cued trials (267 ± 7 ms) when pooled across all levels of stimulation type, stimulation site, and hand response.
Table 1.
Behavioral effects of 5 Hz rTMS over the DLPFC
| Invalid/valid RT × 100 | After real rTMS | After sham rTMS | t value (df = 11) | p value |
|---|---|---|---|---|
| Right side | 129.54 ± 25.02 | 132.99 ± 22.64 | −0.92 | 0.377 |
| Left side | 127.19 ± 18.90 | 130.89 ± 12.55 | −1.15 | 0.275 |
Mean ± SD group data for the ratio between invalidly versus validly cued reaction times in each condition in each session.
Imaging data
Structural data.
Inspection of structural T1-weighted scans with TMS surface markers was used to obtain fiducial locations for all 12 subjects. The average location of fiducials adjacent to the DLPFC were as follows: x = 37 ± 3.5, y = 46 ± 3.6, z = 51 ± 4.1 (right); and x = −34 ± 5.1, y = 44 ± 3.4, z = 55 ± 4.3 (left) in native space. These coordinates are more dorsal than those reported in previous fMRI studies (Corbetta and Shulman, 2002; Boettiger and D'Esposito, 2005). The location on the right is very close to a cluster of significant activation we found in the right DLPFC, in the contrast of invalid versus valid cues (described below and see Table 4), located at (33, 42, 42) (local maximum, p < 0.001; Z = 4.06). The MNI coordinates from the right DLPFC group activation found in this contrast were identified and transformed onto the native space of each subject using the inverse of the deformation field produced by the spatial normalization step. The Euclidian distance between this site (right DLPFC activation) and the fiducial location (i.e., the site of stimulation) in native space was estimated for each subject, and the average was found to be 18 ± 4.3 mm.
Table 4.
Effects of validity: areas of activation associated with presentation of the invalid trials compared with valid trials (kE indicates cluster size)
| Anatomical location | kE | Side | MNI coordinates |
Cluster activation |
|||
|---|---|---|---|---|---|---|---|
| x | y | z | p value | z value | |||
| Dorsolateral prefrontal cortex | 21 | Right | 45 | 42 | 33 | <0.001 | 5.87 |
| 33 | 42 | 42 | <0.001 | 4.06 | |||
| 27 | 57 | 30 | <0.001 | 3.57 | |||
| Ventrolateral prefrontal cortex | 15 | Right | 48 | 42 | −6 | 0.004 | 4.22 |
| 42 | 39 | 0 | 0.004 | 3.54 | |||
| Anterior insula | 10 | Right | 36 | 18 | −3 | 0.043 | 3.61 |
| 42 | 15 | 3 | 0.043 | 3.35 | |||
| Inferior frontal gyrus | 13 | Right | 51 | 9 | 24 | 0.01 | 3.79 |
| 48 | 9 | 15 | 0.01 | 3.73 | |||
| Intraparietal sulcus | 31 | Left | −39 | −39 | 42 | <0.001 | 4.99 |
| −51 | −45 | 45 | <0.001 | 3.71 | |||
| −33 | −54 | 45 | 0.003 | 3.96 | |||
| IPS/angular gyrus | 136 | Right | 33 | −66 | 57 | <0.001 | 4.44 |
| 45 | −57 | 51 | <0.001 | 4.27 | |||
| 54 | −48 | 48 | <0.001 | 4.27 | |||
Main effects and interactions.
The fMRI results in this study, a 2 × 2 × 2 × 2 factorial design with the factors side of stimulation, type of stimulation, validity of cue, and hand response were analyzed in a similar way to the behavioral results. All main effects, two-way, three-way, and four-way interactions, and simple main effects were analyzed. However, because of the fact that both the effect of validity and the effect of rTMS over DLPFC did not lead to any significant BOLD changes relating to the side of target response (left or right), all results presented in this section are pooled across this level.
The effect of cue validity on brain activity.
Tables 2 and 3 show the activations induced by valid and invalid conditions, respectively, pooled across all levels of stimulation type, stimulation site, and hand responses. As shown in Figure 6 and Table 4, the main effect of invalid versus valid trials, pooled across all levels of stimulation type, stimulation site, and hand responses, was associated with increased brain activity in the right frontal and parietal lobes, including the right DLPFC and ventrolateral prefrontal cortex (VLPFC), right inferior frontal gyrus and insula, as well as the IPS bilaterally.
Table 2.
Task-related activity: areas of activation associated with presentation of the valid trials only (kE indicates cluster size)
| Anatomical location | kE | Side | MNI coordinates |
Cluster activation |
|||
|---|---|---|---|---|---|---|---|
| x | y | z | p value | z value | |||
| Pre-supplementary motor area | 2 | Right | 9 | −9 | 69 | 0.012 | 3.97 |
| Primary sensorimotor/PMd | 2 | Right | 27 | −24 | 52 | 0.04 | 3.60 |
| Anterior insula | 9 | Left | −36 | 6 | 6 | 0.035 | 4.09 |
| IPS | 22 | Left | −39 | −60 | 57 | 0.021 | 3.92 |
| IPS/angular gyrus | 19 | Left | −36 | −51 | 63 | 0.01 | 4.34 |
| −42 | −45 | 60 | 0.01 | 3.73 | |||
| 5 | Right | 42 | −54 | 48 | 0.042 | 3.48 | |
| Inferior occipital gyrus | 80 | Right | 9 | −72 | −3 | <0.001 | 4.00 |
| Superior occipital gyrus | 197 | Right | 9 | −93 | 21 | <0.001 | 4.17 |
| 18 | −90 | 27 | <0.001 | 4.15 | |||
| Superior cerebellum | 77 | Right | 34 | −60 | −21 | 0.002 | 4.35 |
Table 3.
Task-related activity: areas of activation associated with presentation of the invalid trials only (kE indicates cluster size)
| Anatomical location | kE | Side | MNI coordinates |
Cluster activation |
|||
|---|---|---|---|---|---|---|---|
| x | y | z | p value | z value | |||
| Dorsolateral prefrontal cortex | 4 | Right | 30 | 30 | 45 | 0.02 | 3.54 |
| 2 | 24 | 42 | 42 | 0.028 | 3.48 | ||
| Ventrolateral prefrontal cortex | 13 | Right | 29 | 31 | −9 | 0.001 | 3.27 |
| 44 | 27 | 12 | 0.016 | 3.65 | |||
| Anterior insula | 49 | Right | 42 | 9 | 9 | 0.001 | 4.84 |
| 42 | 17 | 0 | 0.001 | 3.26 | |||
| IPS | 22 | Left | −52 | −38 | 42 | 0.03 | 3.88 |
| IPS/angular gyrus | Left | −58 | −42 | 42 | 0.03 | 3.88 | |
| 11 | Right | 42 | −48 | 54 | 0.033 | 3.65 | |
| Inferior occipital gyrus | 8 | Left | −12 | −102 | −6 | 0.037 | 3.42 |
| Superior occipital gyrus | 205 | Right | 12 | −96 | 21 | <0.001 | 4.18 |
| 15 | −90 | 27 | <0.001 | 3.79 | |||
| 44 | Left | −15 | −88 | 30 | 0.003 | 3.93 | |
| −15 | −100 | 18 | 0.003 | 3.76 | |||
| Lingual gyrus | 92 | Right | 12 | −81 | −6 | <0.001 | 3.82 |
| Superior cerebellum | 77 | Right | 30 | −60 | −21 | <0.001 | 4.10 |
| 24 | −60 | −21 | <0.001 | 3.69 | |||
| 18 | Left | −42 | −42 | −37 | 0.043 | 3.36 | |
| Posterior cingulate gyrus | 27 | Left | −12 | −36 | 46 | 0.035 | 4.47 |
Figure 6.

BOLD signal increases in invalid compared with valid trials. A direct contrast of invalid versus valid trials pooled across all levels of stimulation site, stimulation type, and hand response is displayed on the rendered T1-weighted canonical template from SPM2 (extent threshold, p < 0.001). RIPS, Right IPS; RDLPFC, right DLPFC; RVLPFC, right VLPFC; LIPS, left IPS.
The effects of 5 Hz rTMS over DLPFC.
The effect of real rTMS versus sham rTMS (task × TMS interaction) across both hemispheres and all conditions revealed no significant change in task-related BOLD signal. This supports our original hypothesis for possible hemisphere-dependent changes in activity given that the right and left DLPFC were conditioned in separate sessions and that previous imaging studies suggested lateralization in reorienting attention (Rushworth et al., 1997, 2001a,b; Corbetta and Shulman 2002; Liu et al., 2003). Data on the effects of rTMS over DLPFC are therefore presented separately for the two hemispheres.
Left DLPFC conditioning.
Compared with sham rTMS, real 5 Hz rTMS over left DLPFC caused widespread decreases in task-related activity regardless of the validity of the cue (i.e., task × rTMS interaction). The areas affected included the bilateral superior parietal gyri, left IPS, left VLPFC, left superior temporal gyrus, and lateral occipital cortex, as well as the right primary sensorimotor area, right insula, and right cerebellum (Table 5). In left VLPFC, the decrease in task-related activity was located at MNI coordinates (−39, 42, 3) (local maximum, p = 0.012; Z = 4.08) (Fig. 7). There were no changes in task-related activity at the site of stimulation with rTMS. There was no significant three-way interaction (task × validity × rTMS), suggesting that rTMS-induced decreases in BOLD signal occurred during trials with valid and invalid precues. No relative increases in BOLD signal were found after left-sided 5 Hz rTMS conditioning.
Figure 7.

Effects of left DLPFC conditioning on BOLD activity during the performance of the reorienting task. BOLD activity decreases in the VLPFC [local maximum, (−39, 42, 3); Z = 4.08; p = 0.012] are displayed on transverse (left) and sagittal (right) sections of average anatomical MRI scans from all subjects (extent threshold, p < 0.001). L, Left; R, right; P, posterior; A, anterior.
Table 5.
Main effects of 5 Hz rTMS over left DLPFC in all conditions: areas of deactivation associated with 5 Hz rTMS over the left DLPFC preconditioning with real rTMS compared with sham on all trials (kE indicates cluster size)
| Anatomical location | kE | Side | MNI coordinates |
Cluster activation |
|||
|---|---|---|---|---|---|---|---|
| x | y | z | p value | z value | |||
| Decreases in BOLD after left DLPFC conditioning with rTMS (sham TMS) | |||||||
| Ventrolateral prefrontal cortex | 11 | Left | −39 | 42 | 3 | 0.004 | 3.87 |
| Superior parietal gyrus | 47 | Right | 6 | −60 | 60 | <0.001 | 4.08 |
| Left | −3 | −48 | 66 | <0.001 | 3.92 | ||
| Posterior intraparietal sulcus | 27 | Left | −18 | −69 | 51 | 0.006 | 4.15 |
| −21 | −60 | 48 | 0.006 | 3.65 | |||
| Superior cerebellum | 20 | Right | 21 | −60 | −21 | 0.031 | 4.11 |
| Primary sensorimotor area | 24 | Right | 45 | −21 | 57 | 0.012 | 4.07 |
| Anterior insula | 35 | Right | 45 | 15 | −3 | 0.001 | 3.99 |
| 48 | 6 | 3 | 0.001 | 3.45 | |||
| Superior temporal gyrus | 28 | Left | −57 | −15 | 3 | 0.005 | 4.00 |
| −45 | −18 | 12 | 0.005 | 3.75 | |||
| Lateral occipital cortex | 32 | Left | −51 | −72 | −9 | 0.002 | 4.00 |
| −42 | −69 | −9 | 0.002 | 3.5 | |||
Right DLPFC conditioning.
The initial comparison of real versus sham 5 Hz rTMS on valid and invalidly cued trials analyzed together did not reveal a significant task-× rTMS interaction. However, right DLPFC conditioning led to a significant three-way task × validity × rTMS interaction. The right VLPFC showed a stronger decrease in task-related BOLD signal change for invalidly cued trials relative to validly cued trials after rTMS conditioning compared with sham [local maximum, (36, 42, 12); Z = 4.31; p = 0.013] (Fig. 8). Activity in this area is located approximately at the border of ventral area 9/46 and rostral area 47/12 (Petrides and Pandya, 2002).
Figure 8.

Validity × conditioning interaction after 5 Hz rTMS to the right DLPFC. The effect of right DLPFC conditioning on BOLD activity during the performance of invalidly compared with validly cued trials. Top, A significant decrease in BOLD activation was revealed in the right VLPFC [local maximum, (36, 42, 12); Z = 4.31; p = 0.013] displayed on transverse (left) and sagittal (right) sections of average anatomical MRI scans from all subjects (extent threshold, p < 0.001). Bottom, Parameter estimates showing mean ± SE activation of the invalid–valid contrast during the two experimental sessions: sham (left) and real (right). L, Left; R, right; P, posterior; A, anterior.
Behavioral study
No subject reported adverse side effects during the course of the study. Mean active motor threshold for rTMS over the right FDI was 46%, ranging from 36 to 59% of maximum stimulator output, and over the left FDI was 49%, ranging from 37 to 61% of maximum stimulator output.
The numbers of errors in the two blocks of trials were small (block 1, 4% of total trials; block 2, 3% of total trials pooled across all factors). Given that no differences relating to the validity of trials or conditioning were found with the different error types in this experiment, errors of omission were combined with errors of commission and entered into a four-way ANOVA as described in Materials and Methods. Analyzed across the entire experiment, error rates were not affected by 5 Hz rTMS to either hemisphere. However, they were affected by the validity of cues as revealed by a main effect of cue type in both time 1 (F(1,11) = 14.913; p = 0.006) and time 2 (F(1,11) = 16.164; p = 0.004). Error rates were larger in invalid (10.6% in time 1; 10.3% in time 2) compared with valid (4.6% in time 1; 4.2% in time2) trials.
The effect of real 5 Hz rTMS compared with sham over the right or left DLPFC on response times (Fig. 9) was examined with two separate four-way repeated-measures ANOVA for time 1 (the first 10 min after stimulation) and time 2 (10–20 min after stimulation).
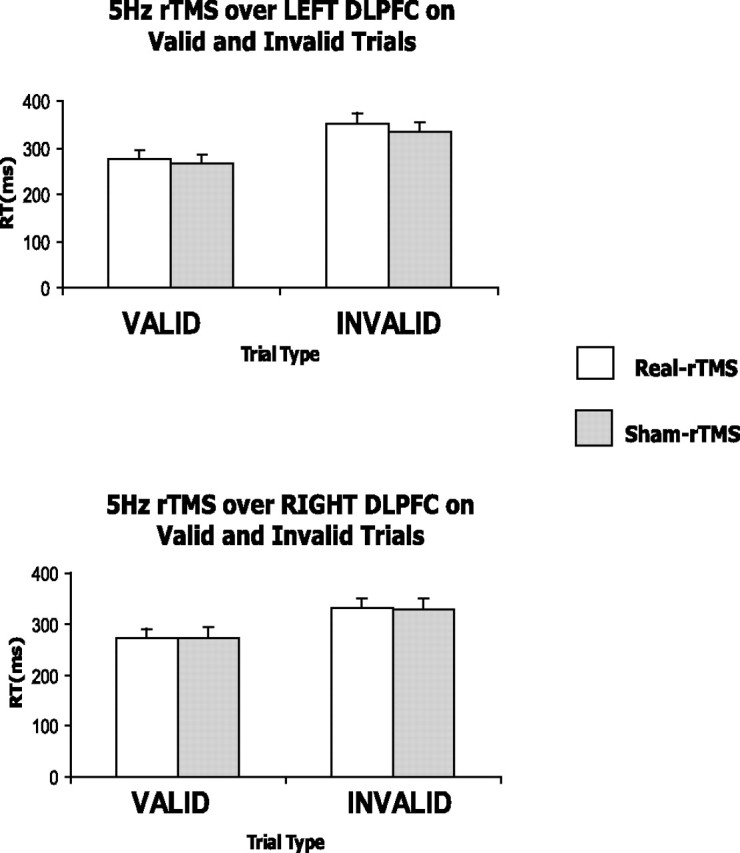
Figure 9.

Behavioral study: behavioral effects of cue type and conditioning of DLPFC on RTs. At time 1, 5 Hz rTMS conditioning over the right DLPFC led to a significant increase in RTs in invalidly cued trials (338 ± 17 ms) compared with sham (295 ± 15 ms). This was not the case for left DLPFC conditioning (RTs in invalid trials: 285 ± 10 ms for real-rTMS; 297 ± 12 ms for sham). At time 2, 5 Hz rTMS conditioning did not lead to any significant changes in RTs in either valid or invalid trials whether applied over the left or right DLPFC. Note that RTs, pooled across all levels of stimulation type, stimulation site, and hand response, averaged over time 1 and time 2, were significantly slower (303 ± 16 ms) in invalidly cued trials than in validly cued trials (227 ± 10 ms). *p = 0.015.
In the analysis performed for time 1, a significant main effect of cue type revealed, as expected, that RTs on invalid trials were slower than on valid trials (main effect of cue validity, F(1,7) = 184.200; p < 0.001). In addition, a main effect of side of rTMS conditioning (F(1,7) = 56.342; p < 0.001) and significant two-way (TMS side × cue type, F(1,7) = 14.912, p = 0.006; TMS type × cue type, F(1,7) = 9.651, p = 0.017; and TMS type × TMS side, F(1,7) = 99.232, p < 0.001) and three-way (TMS type × TMS side × cue type, F(1,7) = 10.293; p = 0.015) interactions were found. We therefore ran two three-way ANOVAs testing each side of 5 Hz rTMS conditioning separately. RTs after left DLPFC conditioning showed no significant interactions, the only significant main effect being the main effect of cue type (F(1,7) = 57.745; p < 0.001). However, the ANOVA for RTs with right DLPFC conditioning demonstrated a significant two-way interaction (TMS type × cue type, F(1,7) = 13.717; p = 0.008) alongside significant effects of cue type (F(1,7) = 168.099; p < 0.001) and TMS type (F(1,7) = 21.364; p = 0.002). Additional analysis of the right-sided stimulation data with two two-way repeated-measures ANOVAs tested the effects of 5 Hz rTMS on valid and invalidly cued trials separately. The two-way ANOVA for validly cued trials revealed a significant main effect of hand (F(1,7) = 7.012; p = 0.033). Post hoc t tests suggested that right-hand were faster than left-hand responses, but this was not a significant effect (t(7) = −1.442, p = 0.09 for the real rTMS condition; t(7) = −2.188, p = 0.065 for the sham). The two-way ANOVA for invalidly cued trials revealed a significant main effect of TMS type (F(1,7) = 27.165; p = 0.001), whereas post hoc t tests confirmed that right DLPFC selectively increased RTs in the real rTMS condition compared with sham (t(7) = 5.335, p = 0.001 for left cue, right-hand responses; t(7) = 3.689, p = 0.008 for right cue, left-hand responses).
The analysis performed for time 2 revealed main effects of cue type (F(1,7) = 133.226; p < 0.001) and TMS side (F(1,7) = 7.610; p = 0.028). However, as opposed to the effects obtained in time 1, no other interactions were significant, suggesting that the selective prolongation of invalidly cued RTs was no longer present 10–20 min after 5 Hz rTMS conditioning (post hoc t tests of 5 Hz rTMS over right DLPFC on invalidly cued trials: t(7) = −0.368, p = 0.724 for left cue, right-hand responses; t(7) = 0.905, p = 0.396 for right cue, left-hand responses).
Discussion
We examined changes in task-related BOLD activity and behavior during performance of a precued choice reaction time task induced by off-line 5 Hz rTMS to the right or left DLPFC. Conditioning of neither the left nor the right DLPFC resulted in significant changes in cortical activity at the site of stimulation. In contrast, changes in task-related activity were seen remotely in areas that have been implicated previously in attentional reorienting tasks. Behavioral testing outside the scanner showed that conditioning of the right DLPFC resulted in a selective slowing of invalidly cued RTs, which only occurred within the first 10 min after the end of stimulation. The possibility that our findings might constitute an adaptation to the physiological changes induced by rTMS, given that the cognitive demands of this task were not manipulated, is discussed below.
rTMS conditioning of the DLPFC and task-related behavior
An initial analysis of the behavioral RTs averaged over the total length of fMRI scanning showed that rTMS conditioning of DLPFC did not affect performance. However, preliminary results (Siebner et al., 2003) had suggested an effect of 5 Hz rTMS over the right DLPFC on invalidly cued trials, possibly reflecting the roles of PFC in inhibiting prepared responses (Aron et al., 2004) and covert reorienting of attention (Mesulam, 1981). Differences in the designs of the two studies, which may have accounted for this discrepancy, did not allow direct comparisons between these results to be made. The order of intervention by Siebner et al. (2003) was task–off-line rTMS–task, whereas the effects of rTMS in the current study were assessed by making comparisons between separate sessions of real and sham rTMS in a counterbalanced design. Moreover, Siebner et al. (2003) tested task performance immediately after the end of rTMS, whereas ∼6 min elapsed in the present study between the end of rTMS and the beginning of the task. For these reasons, we decided to run a behavioral companion study, in which the counterbalanced design of the fMRI study was kept, whereas RT measurements started immediately after the end of rTMS conditioning, to parallel the time course by Siebner et al. (2003) and possibly capture effects early after stimulation.
The selective prolongation in RTs in invalidly cued trials after right DLPFC conditioning with 5 Hz rTMS (Siebner et al., 2003) was confirmed in this study. The effect only lasted for the first 10 min after the end of the stimulation period. This is at odds with evidence from electrophysiological studies showing that the conditioning effects of the same 5 Hz rTMS protocol on motor cortical excitability may last for up to 1 h (Peinemann et al., 2004; Rizzo et al., 2004). Most information about the duration of 5 Hz rTMS is extrapolated from data on motor cortical excitability. It remains unknown whether the duration of changes induced by rTMS might differ according to the site of stimulation. In the absence of physiological data from the prefrontal cortex, it is difficult to speculate on the time course of rTMS conditioning effects on the DLPFC. However, we suggest that a rapid functional reorganization of brain areas involved in orienting might have occurred to recover task performance. The lasting physiological effects of rTMS might therefore have been masked in the behavioral results presented here. The DLPFC lies at an anterior point of rich convergence of many neuronal pathways (Young, 1992). Its interaction with multiple association networks may be sufficiently complex that disruption of one area alone may not result in long-lasting behavioral deficits.
rTMS to the DLPFC did not alter activity at the site of stimulation
Despite accurate localization of the sites of DLPFC and little variance across subjects, as revealed by the structural data, no significant BOLD signal changes were observed at the stimulated sites after conditioning with rTMS. Several “on-line” fMRI studies suggest that stimulation of an area with rTMS at subthreshold intensities does not necessarily lead to acute changes in BOLD signal at the site of stimulation (Bohning et al., 1999; Baudewig et al., 2001; Bestmann et al., 2003); however, acute activity changes have been reported in anatomically connected areas. Off-line studies using 1 Hz rTMS over the M1 and PMd areas (Lee et al., 2003; Siebner et al., 2003) using positron emission tomography have shown that subthreshold rTMS stimulation failed to evoke significant changes in regional cerebral blood flow (rCBF) during task performance at the site of stimulation despite physiological evidence that this protocol of stimulation decreases excitability (Chen et al., 1997; Maeda et al., 2000; Touge et al., 2001; Rizzo et al., 2004). However, changes in rCBF were induced over these areas at rest (Siebner et al., 2001). This is in line with observations that the absence of changes in rCBF does not rule out the presence of significant neuronal activity (Nielsen and Lauritzen, 2001). A recent study on the lasting effects of off-line low- and high-frequency rTMS (Rounis et al., 2005) suggests that similar effects may occur with higher frequencies of stimulation (5 Hz). Given electrophysiological evidence of the effects of 5 Hz rTMS (Peinemann et al., 2004) on cortical excitability, there appears to be a dissociation between excitability changes and local changes in rCBF or BOLD signal. Off-line rTMS delivered over the DLPFC could have induced changes in neuronal activity at the site of stimulation at rest, which failed to reveal task-related activity changes in the stimulated area observed using fMRI.
rTMS to DLPFC led to BOLD signal changes in remote areas
Decreases in task-related responses were observed in adjacent and remote cortical areas including the VLPFC and IPS after DLPFC conditioning at 5 Hz during performance of our task. Evidence from off-line rTMS connectivity studies (Lee et al., 2003; Rounis et al., 2005) suggests that rTMS may change the internal processing of the stimulated area, leading to an alteration in its output to other cortical areas as well as a change in the responsiveness to inputs from remote areas, while keeping the overall synaptic activity constant.
Changes in activity of remote areas requires evidence that the stimulated DLPFC and the aforementioned VLPFC and IPS are anatomically and/or functionally related in the performance of this task. Excitability changes in DLPFC induced by conditioning may lead to changes in postsynaptic activity in anatomically connected regions via direct activation of projecting fibers or indirectly by modulation of intermediate regions. The presence of direct connections between the DLPFC and both VLPFC and IPS in humans remains speculative because it relies on comparative work to establish correspondences between macaque and human brain areas (Petrides and Pandya, 1999, 2002). However, there is good evidence of coactivation in these areas during performance of attentional tasks (Rushworth et al., 1997, 2001a; Corbetta and Shulman, 2002; Liu et al., 2003).
Task-related BOLD signal changes after rTMS conditioning
rTMS changed activity within areas of the reorienting network, remote from the site of stimulation, selectively in invalidly cued trials. As mentioned above, 5 Hz rTMS leads to activity changes within entire functional networks, possibly through alterations in effective connectivity of the stimulation site with other regions involved in the task (Pleger et al., 2006). A disruption of the DLPFC with rTMS might have compromised its outputs to functionally connected areas during reorienting of attention, leading to activity changes being observed in remote areas, particularly because these were most prominent in the invalidly cued condition. Previous studies have shown evidence of adjustment in the activity of the lateral prefrontal areas after modulation of task difficulty (Dove et al., 2000; Nagahama et al., 2001). In their study proposing a two-stage model of spatial working memory processing, Owen et al. (1996) suggested differential involvement of the VLPFC and DLPFC in the active manipulation of on-line information that may depend on the working memory demands of the task (Petrides, 1994; Owen et al., 1996).
Conditioning the left or the right DLPFC with rTMS resulted in different changes in the activity pattern observed in remote areas. Studies by Rushworth et al. (1997, 2001a,b) have suggested a hemispheric asymmetry in the parietal cortex concerning reorienting in the context of visual versus motor attention. This asymmetry might also apply in the prefrontal regions and might account for our results given that our task involved both visual and motor attention switching.
The main effect of conditioning the left DLPFC was a decrease in activation of the left VLPFC, the left IPS, and the right primary motor cortex. These results are reminiscent of evidence that changes in DLPFC excitability affects areas at earlier levels of stimulus processing (Moore and Armstrong, 2003). The lack of validity × conditioning interactions after conditioning of left DLPFC is likely to be attributable to the absence of any left DLPFC activity in the direct comparisons of invalid versus valid trials. Such an interaction was only found with right DLPFC conditioning in the right VLPFC. The functional significance of this finding points toward the possibility of a degenerate but potentially functional network in the prefrontal cortex for cued choice reaction tasks. This network may have a role in recovery from suitably sited brain injury and may differ according to the demands of the task being used.
Footnotes
This work was supported by the Brain Research Trust (E.R.), the Wellcome Trust (K.E.S., L.L.., R.S.J.F., K.J.F.), the Medical Research Council (J.C.R., A.P.), and Deutsche Forschungsgemeinschaft Grant SI 738/1-1 (H.R.S.).
References
- Andersson JL, Hutton C, Ashburner J, Turner R, Friston KJ. Modeling geometric deformations in EPI time series. NeuroImage. 2001;13:903–919. doi: 10.1006/nimg.2001.0746. [DOI] [PubMed] [Google Scholar]
- Aron AR, Monsell S, Sahakian BJ, Robbins TW. A componential analysis of task-switching deficits associated with lesions of the left and right frontal cortex. Brain. 2004;127:1561–1573. doi: 10.1093/brain/awh169. [DOI] [PubMed] [Google Scholar]
- Asaad WF, Rainer G, Miller EK. Task-specific neural activity in the primate prefrontal cortex. J Neurophysiol. 2000;84:451–459. doi: 10.1152/jn.2000.84.1.451. [DOI] [PubMed] [Google Scholar]
- Ashburner J, Friston KJ. Nonlinear spatial normalization using basis functions. Hum Brain Mapp. 1999;7:254–266. doi: 10.1002/(SICI)1097-0193(1999)7:4<254::AID-HBM4>3.0.CO;2-G. [DOI] [PMC free article] [PubMed] [Google Scholar]
- Banich MT, Milham MP, Atchley RA, Cohen NJ, Webb A, Wszalek T, Kramer AF, Liang Z, Barad V, Gullet D, Shah C, Brown C. Prefrontal regions play a predominant role in imposing an attentional “set”: evidence from fMRI. Brain Res Cogn Brain Res. 2000;10:1–9. doi: 10.1016/s0926-6410(00)00015-x. [DOI] [PubMed] [Google Scholar]
- Baudewig J, Siebner HR, Bestmann S, Tergau F, Tings T, Paulus W, Frahm J. Functional MRI of cortical activations induced by transcranial magnetic stimulation (TMS) NeuroReport. 2001;12:3543–3548. doi: 10.1097/00001756-200111160-00034. [DOI] [PubMed] [Google Scholar]
- Bestmann S, Baudewig J, Siebner HR, Rothwell JC, Frahm J. Subthreshold high-frequency TMS of human primary motor cortex modulates interconnected frontal motor areas as detected by interleaved fMRI-TMS. NeuroImage. 2003;20:1685–1696. doi: 10.1016/j.neuroimage.2003.07.028. [DOI] [PubMed] [Google Scholar]
- Boettiger CA, D'Esposito M. Frontal networks for learning and executing arbitrary stimulus-response associations. J Neurosci. 2005;25:2723–2732. doi: 10.1523/JNEUROSCI.3697-04.2005. [DOI] [PMC free article] [PubMed] [Google Scholar]
- Bohning DE, Shastri A, McConnell KA, Nahas Z, Loberbaum JP, Roberts DR, Teneback C, Vincent DJ, George MS. A combined TMS/fMRI study of intensity-dependent TMS over motor cortex. Biol Psychiatry. 1999;45:385–394. doi: 10.1016/s0006-3223(98)00368-0. [DOI] [PubMed] [Google Scholar]
- Chen R, Classen J, Gerloff C, Celnik P, Wassermann EM, Hallett M, Cohen LG. Depression of motor cortex excitability by low-frequency transcranial magnetic stimulation. Neurology. 1997;48:1398–1403. doi: 10.1212/wnl.48.5.1398. [DOI] [PubMed] [Google Scholar]
- Corbetta M, Shulman GL. Control of goal-directed and stimulus-driven attention in the brain. Nat Rev Neurosci. 2002;3:201–215. doi: 10.1038/nrn755. [DOI] [PubMed] [Google Scholar]
- Corbetta M, Miezin FM, Shulman GL, Petersen SE. A PET study of visuospatial attention. J Neurosci. 1993;13:1202–1226. doi: 10.1523/JNEUROSCI.13-03-01202.1993. [DOI] [PMC free article] [PubMed] [Google Scholar]
- Corbetta M, Kincade JM, Ollinger JM, McAvoy MP, Shulman GL. Voluntary orienting is dissociated from target detection in human posterior parietal cortex. Nat Neurosci. 2000;3:292–297. doi: 10.1038/73009. [DOI] [PubMed] [Google Scholar]
- Coull JT, Nobre AC. Where and when to pay attention: the neural systems for directing attention to spatial locations and to time intervals as revealed by both PET and fMRI. J Neurosci. 1998;18:7426–7435. doi: 10.1523/JNEUROSCI.18-18-07426.1998. [DOI] [PMC free article] [PubMed] [Google Scholar]
- Deichmann R, Schwarzbauer C, Turner R. Optimisation of the 3D MDEFT sequence for anatomical brain imaging: technical implications at 1.5T and 3T. NeuroImage. 2004;21:757–767. doi: 10.1016/j.neuroimage.2003.09.062. [DOI] [PubMed] [Google Scholar]
- Dove A, Pollmann S, Schubert T, Wiggins CJ, von Cramon DY. Prefrontal cortex activation in task-switching: an event-related fMRI study. Brain Res Cogn Brain Res. 2000;9:103–109. doi: 10.1016/s0926-6410(99)00029-4. [DOI] [PubMed] [Google Scholar]
- Friston KJ, Holmes AP, Poline JB, Grasby PJ, Williams SC, Frackowiak RS, Turner R. Analysis of fMRI time-series revisited. NeuroImage. 1995;2:45–53. doi: 10.1006/nimg.1995.1007. [DOI] [PubMed] [Google Scholar]
- Friston KJ, Glaser Dem Henson RN, Kiebel S, Phillips C, Ashburner J. Classical and Bayesian inference in neuroimaging: applications. NeuroImage. 2002;16:484–512. doi: 10.1006/nimg.2002.1091. [DOI] [PubMed] [Google Scholar]
- Gerschlager W, Siebner HR, Rothwell JC. Decreased corticospinal excitability after subthreshold 1Hz rTMS over lateral premotor cortex. Neurology. 2001;57:449–455. doi: 10.1212/wnl.57.3.449. [DOI] [PubMed] [Google Scholar]
- Giessing C, Thiel CM, Stephan KE, Rosler F, Fink GR. Visuospatial attention: how to measure effects of infrequent, unattended events in a blocked stimulus design. NeuroImage. 2004;23:1370–1381. doi: 10.1016/j.neuroimage.2004.08.008. [DOI] [PubMed] [Google Scholar]
- Jahanshahi M, Rothwell J. Transcranial magnetic stimulation studies of cognition: an emerging field. Exp Brain Res. 2000;131:1–9. doi: 10.1007/s002219900224. [DOI] [PubMed] [Google Scholar]
- Lee L, Siebner HR, Rowe JB, Rizzo V, Rothwell JC, Frackowiak RS, Friston KJ. Acute remapping within the motor system induced by low-frequency repetitive transcranial magnetic stimulation. J Neurosci. 2003;23:5308–5318. doi: 10.1523/JNEUROSCI.23-12-05308.2003. [DOI] [PMC free article] [PubMed] [Google Scholar]
- Liu T, Stolnick SD, Serences JT, Yantis S. Cortical mechanisms of feature-based attentional control. Cereb Cortex. 2003;13:1334–1343. doi: 10.1093/cercor/bhg080. [DOI] [PubMed] [Google Scholar]
- Losier NJ, Klein RM. A review of the evidence for a disengage deficit following parietal lobe damage. Neurosci Biobehav Rev. 2001;25:1–13. doi: 10.1016/s0149-7634(00)00046-4. [DOI] [PubMed] [Google Scholar]
- Maeda F, Keenan JP, Tormos JM, Topka H, Pascual-Leone A. Modulation of corticospinal excitability by repetitive transcranial magnetic stimulation. Clin Neurophysiol. 2000;111:800–805. doi: 10.1016/s1388-2457(99)00323-5. [DOI] [PubMed] [Google Scholar]
- Mesulam MM. A cortical network for directed attention and unilateral neglect. Ann Neurol. 1981;10:309–325. doi: 10.1002/ana.410100402. [DOI] [PubMed] [Google Scholar]
- Moore T, Armstrong KM. Selective gating of visual signals by microstimulation of frontal cortex. Nature. 2003;421:370–373. doi: 10.1038/nature01341. [DOI] [PubMed] [Google Scholar]
- Mottaghy FM, Gangitano M, Sparing R, Krause BJ, Pascual-Leone A. Segregation of areas related to visual working memory in the prefrontal cortex revealed by rTMS. Cereb Cortex. 2002;12:369–375. doi: 10.1093/cercor/12.4.369. [DOI] [PubMed] [Google Scholar]
- Munchau A, Bloem BR, Irlbacher K, Trimble MR, Rothwell JC. Functional connectivity of human premotor and motor cortex explored with repetitive transcranial magnetic stimulation. J Neurosci. 2002;22:554–561. doi: 10.1523/JNEUROSCI.22-02-00554.2002. [DOI] [PMC free article] [PubMed] [Google Scholar]
- Nagahama Y, Okada T, Katsumi Y, Hayashi T, Yamauchi H, Oyanagi C, Konishi J, Fukuyama H, Shibasaki H. Dissociable mechanisms of attentional control within the human prefrontal cortex. Cereb Cortex. 2001;11:85–92. doi: 10.1093/cercor/11.1.85. [DOI] [PubMed] [Google Scholar]
- Nielsen NA, Lauritzen M. Coupling and uncoupling of activity-dependent increases of neuronal activity and blood flow in rat somatosensory cortex. J Physiol. 2001;533:773–785. doi: 10.1111/j.1469-7793.2001.00773.x. [DOI] [PMC free article] [PubMed] [Google Scholar]
- Nobre AC. Orienting attention to instants in time. Neuropsychologia. 2001;39:1317–1328. doi: 10.1016/s0028-3932(01)00120-8. [DOI] [PubMed] [Google Scholar]
- Nobre AC, Sebestyen GN, Gitelman DR, Mesulam MM, Frackowiak RS, Frith CD. Functional localization of the system for visuospatial attention using positron emission tomography. Brain. 1997;120:515–533. doi: 10.1093/brain/120.3.515. [DOI] [PubMed] [Google Scholar]
- Owen AM, Evans AC, Petrides M. Evidence of a two-stage model of spatial working memory processing within the lateral frontal cortex: a positron emission tomography study. Cereb Cortex. 1996;6:31–38. doi: 10.1093/cercor/6.1.31. [DOI] [PubMed] [Google Scholar]
- Pascual-Leone A, Valls-Sole J, Wassermann EM, Hallett M. Responses to rapid-rate transcranial magnetic stimulation of the human motor cortex. Brain. 1994;117:847–858. doi: 10.1093/brain/117.4.847. [DOI] [PubMed] [Google Scholar]
- Peinemann A, Riemer B, Loeer C, Quartarone A, Munchau A, Conrad B, Siebner HR. Long-lasting increase in corticospinal excitability after 1800 pulses of subthreshold 5 Hz repetitive TMS to the primary motor cortex. Clin Neurophysiol. 2004;115:1519–1526. doi: 10.1016/j.clinph.2004.02.005. [DOI] [PubMed] [Google Scholar]
- Petersen SE, Robinson DL, Currie JN. Influences of lesions of parietal cortex on visual spatial attention in humans. Exp Brain Res. 1989;76:267–280. doi: 10.1007/BF00247887. [DOI] [PubMed] [Google Scholar]
- Petrides M. Frontal lobes and behaviour. Curr Opin Neurobiol. 1994;4:207–211. doi: 10.1016/0959-4388(94)90074-4. [DOI] [PubMed] [Google Scholar]
- Petrides M, Pandya DN. Dorsolateral prefrontal cortex: comparative cytoarchitectonic analysis in the human and the macaque brain and corticocortical connection patterns. Eur J Neurosci. 1999;11:1011–1036. doi: 10.1046/j.1460-9568.1999.00518.x. [DOI] [PubMed] [Google Scholar]
- Petrides M, Pandya DN. Comparative cytoarchtectonic analysis of the human and the macaque ventrolateral prefrontal cortex and corticocortical connection patterns in the monkey. Eur J Neurosci. 2002;16:291–310. doi: 10.1046/j.1460-9568.2001.02090.x. [DOI] [PubMed] [Google Scholar]
- Pleger B, Blankenburg F, Bestmann S, Ruff CC, Wiech K, Stephan KE, Friston KJ, Dolan RJ. Repetitive transcranial magnetic stimulation-induced changes in sensorimotor coupling parallel improvements of somatosensation in humans. J Neurosci. 2006;26:1945–1952. doi: 10.1523/JNEUROSCI.4097-05.2006. [DOI] [PMC free article] [PubMed] [Google Scholar]
- Posner MI, Walker JA, Friedich FJ, Rafal RD. Effects of parietal injury on covert orienting of attention. J Neurosci. 1984;4:1863–1874. doi: 10.1523/JNEUROSCI.04-07-01863.1984. [DOI] [PMC free article] [PubMed] [Google Scholar]
- Posner MI, Walker JA, Friedrich FA, Rafal RD. How do the parietal lobes direct covert attention? Neuropsychologia. 1987;25:135–145. doi: 10.1016/0028-3932(87)90049-2. [DOI] [PubMed] [Google Scholar]
- Rizzo V, Siebner HR, Modugno N, Pesenti A, Munchau A, Gerschlager W, Webb RM, Rothwell JC. Shaping the excitability of human motor cortex with premotor rTMS. J Physiol (Lond) 2004;554:483–495. doi: 10.1113/jphysiol.2003.048777. [DOI] [PMC free article] [PubMed] [Google Scholar]
- Rounis E, Lee L, Siebner HR, Rowe JB, Friston KJ, Rothwell JC, Frackowiak RS. Frequency specific changes in regional cerebral blood flow and motor system connectivity following rTMS to the primary motor cortex. NeuroImage. 2005;26:164–176. doi: 10.1016/j.neuroimage.2005.01.037. [DOI] [PubMed] [Google Scholar]
- Rushworth MR, Nixon PD, Renowden S, Wade DT, Passingham RE. The left parietal cortex and motor attention. Neuropsychologia. 1997;35:1261–1273. doi: 10.1016/s0028-3932(97)00050-x. [DOI] [PubMed] [Google Scholar]
- Rushworth MF, Krams M, Passingham RE. The attentional role of the left parietal cortex: the distinct lateralization and localization of motor attention in the human brain. J Cogn Neurosci. 2001a;13:698–710. doi: 10.1162/089892901750363244. [DOI] [PubMed] [Google Scholar]
- Rushworth MR, Ellison A, Walsh V. Complementary localization and lateralization of orienting and motor attention. Nat Neurosci. 2001b;4:656–661. doi: 10.1038/88492. [DOI] [PubMed] [Google Scholar]
- Siebner HR, Takano B, Peinemann A, Schwaiger M, Conrad B, Drzezga A. Continuous transcranial magnetic stimulation during positron emission tomography: a suitable tool for imaging regional excitability of the human cortex. NeuroImage. 2001;14:883–890. doi: 10.1006/nimg.2001.0889. [DOI] [PubMed] [Google Scholar]
- Siebner H, Pesenti A, Rizzo V, Rothwell J. Delayed response switching after 5 Hz repetitive transcranial magnetic stimulation to the right dorsal prefrontal cortex. NeuroImage. 2003;19:17896. [Suppl 1, issue 2, available on CD] [Google Scholar]
- Steinmetz MA, Constantanidis C. Neurophysiological evidence for a role of posterior parietal cortex in redirecting visual attention. Cereb Cortex. 1995;5:448–456. doi: 10.1093/cercor/5.5.448. [DOI] [PubMed] [Google Scholar]
- Stephan KE, Marshall JC, Friston KJ, Rowe JB, Ritzl A, Zilles K, Fink GR. Lateralized cognitive processes and lateralized task control in the human brain. Science. 2003;301:384–386. doi: 10.1126/science.1086025. [DOI] [PubMed] [Google Scholar]
- Thiel CM, Zilles K, Fink GR. Cerebral correlates of alerting, orienting and reorienting visuospatial attention: an event-related fMRI study. NeuroImage. 2004;21:318–328. doi: 10.1016/j.neuroimage.2003.08.044. [DOI] [PubMed] [Google Scholar]
- Touge T, Gerschlager W, Brown P, Rothwell JC. Are the after-effects of low-frequency rTMS on motor cortex excitability due to changes in the efficacy of cortical synapses? Clin Neurophysiol. 2001;112:2138–2145. doi: 10.1016/s1388-2457(01)00651-4. [DOI] [PubMed] [Google Scholar]
- Wallis JD, Miller EK. From rule to response: neuronal processes in the premotor and prefrontal cortex. J Neurphysiol. 2003;90:1790–1806. doi: 10.1152/jn.00086.2003. [DOI] [PubMed] [Google Scholar]
- Wallis JD, Anderson KC, Miller EK. Single neurons in prefrontal cortex encode abstract rules. Nature. 2001;411:953–956. doi: 10.1038/35082081. [DOI] [PubMed] [Google Scholar]
- Wassermann EM. Risk and safety of repetitive transcranial magnetic stimulation: report and suggested guidelines from the International Workshop on the Safety of Repetitive Transcranial Magnetic Stimulation, June 5–7, 1996. Electroencephalogr Clin Neurophysiol. 1998;108:1–16. doi: 10.1016/s0168-5597(97)00096-8. [DOI] [PubMed] [Google Scholar]
- Young MP. Objective analysis of the topological organization of the primate cortical visual system. Nature. 1992;358:152–155. doi: 10.1038/358152a0. [DOI] [PubMed] [Google Scholar]