Abstract
Ion channel localization to specific cell surface regions is essential for proper neuronal function. The Kv2.1 K+ channel forms large clusters on the plasma membrane of hippocampal neurons and transfected human embryonic kidney (HEK) cells. Using live cell imaging, we address mechanisms underlying this Kv2.1 clustering in both HEK cells and cultured hippocampal neurons. The Kv2.1-containing surface clusters have properties unlike those expected for a scaffolding protein bound channel. After channel is delivered to the plasma membrane via intracellular transport vesicles, it remains localized at the insertion site. Fluorescence recovery after photobleaching (FRAP) and quantum dot tracking experiments indicate that channel within the surface cluster is mobile (FRAP, τ = 14.1 ± 1.5 and 11.5 ± 6.1 s in HEK cells and neurons, respectively). The cluster perimeter is not static, because after fusion of adjacent clusters, green fluorescent protein (GFP)–Kv2.1 completely exchanged between the two domains within 60 s. Treatment of hippocampal neurons expressing GFP-Kv2.1 with 5 μm latrunculin A resulted in a significant increase in average cluster size from 0.89 ± 0.16 μm2 to 12.15 ± 1.4 μm2 with a concomitant decrease in cluster number. Additionally, Kv2.1 was no longer restricted to the cell body, suggesting a role for cortical actin in both cluster maintenance and localization. Thus, Kv2.1 surface domains likely trap mobile Kv2.1 channels within a well defined, but fluid, perimeter rather than being tightly bound to a scaffolding protein-containing complex. Channel moves directly into these clusters via trafficking vesicles. Such domains allow for efficient trafficking to the cell surface while sequestering channel with signaling proteins.
Keywords: Kv channel, restricted diffusion, membrane insertion, quantum dot tracking, fluorescence microscopy, hippocampal neurons
Introduction
Voltage-gated ion channels are often highly localized in electrically excitable cells such as nerve and muscle. Voltage-gated Na+ channels form high-density arrays within the axon node of Ranvier, and voltage-gated K+ channels localize in the paranodal region (Rasband and Trimmer, 2001). In smooth muscle, Ca2+-dependent K+ channels are found adjacent to the ryanodine receptors of the sarcoplasmic reticulum (Wellman and Nelson, 2003). L-type voltage-gated Ca2+ channels are exclusively localized to the T-tubule/sarcoplasmic reticulum triad junction in skeletal muscle (Dirksen, 2002). Whereas scaffolding proteins are known to cluster some neurotransmitter receptors (Kim and Sheng, 2004), the exact mechanisms underlying most ion channel localization remain unknown.
The delayed rectifier Kv2.1 regulates somato-dendritic excitability in the mammalian CNS where it forms unique cell surface clusters on the soma and proximal dendrites of hippocampal neurons both in situ and in culture (Misonou et al., 2004, 2005). Kv2.1 represents the predominant delayed rectifier current in these cells (Du et al., 2000). This clustering has been proposed to be attributable to interaction with scaffolding proteins (Surmeier and Foehring, 2004), even though this channel has no known PDZ (postsynaptic density-95/Discs large/zona occludens-1) interactors nor a PDZ consensus binding domain. Membrane depolarization and cytoplasmic Ca2+ activation of calcineurin fragment these clusters in cultured hippocampal neurons and shift the voltage dependence of activation to more hyperpolarized potentials, leading to the idea that cluster formation is linked to channel phosphorylation and function (Misonou et al., 2004, 2005; Mohapatra and Trimmer, 2006). Adding to the physiological significance of these surface structures, just 2 min of CO2 exposure completely dissolves these structures on the cell bodies of hippocampal neurons in situ (Misonou et al., 2005). In cultured neurons, chemically induced ischemia results in both declustering and a 20 mV hyperpolarizing shift in the voltage dependence of activation (Misonou et al., 2005). Thus, cluster formation is likely to be directly related to channel function and neuronal excitability, with declustering being a protective mechanism that stabilizes neuronal excitability under ischemic/hypoxic conditions.
We demonstrated previously that when expressed in human embryonic kidney (HEK) cells, Kv2.1 exhibits a clustered surface localization pattern similar to that observed in cultured hippocampal neurons (O'Connell and Tamkun, 2005), suggesting that pathways common among these diverse cell types are involved in the surface localization of Kv2.1 and that HEK cells offer a useful model system in which to study basic Kv2.1 cell biology. In the present work, we now examine the mechanisms underlying the formation and maintenance of these surface microdomains in both HEK cells and cultured hippocampal neurons. Surprisingly, fluorescence recovery after photobleaching (FRAP) and single-channel tracking experiments indicate that channel within the surface cluster is mobile, implicating a perimeter fence that corrals the freely diffusing channels as opposed to channels anchored to a scaffolding complex. Kv2.1-containing surface domains appear to be specialized sites for membrane clustering and/or insertion because they acquire channel from both Kv2.1-containing intracellular transport vesicles and adjacent surface clusters. These Kv2.1-containing cell surface structures allow for the efficient trafficking to and from the cell surface while at the same time sequestering channel with signaling proteins that regulate channel function.
Materials and Methods
Cell culture and expression of green fluorescent protein–Kv2.1.
Vectors containing green fluorescent protein (GFP)–Kv2.1–hemagglutinin (HA) (O'Connell and Tamkun, 2005) or GFP-Kv2.1-loopBAD were electroporated into HEK 293 cells (American Type Culture Collection, Manassas, VA) using a Genepulser Xcell (Bio-Rad, Hercules, CA). Electroporation was performed using a single pulse to 110 V for 25 ms in a 0.2 cm gap cuvette. Cells were then plated onto Matrigel-coated glass-bottom 35 mm dishes (Mat-Tek, Ashland, MA) in DMEM plus 10% fetal bovine serum and imaged within 24 h of electroporation.
Hippocampal neurons from embryonic day 18 (E18) rat pups were cultured as described previously (Bartlett and Banker, 1984; Brewer et al., 1993). Briefly, neurons from cryopreserved E18 hippocampal dissociations were plated at a density of ∼30,000 cells/cm2 on poly-d-lysine-coated glass-bottom dishes (Mat-Tek) in glial-cell-conditioned Neurobasal medium containing B27 supplement (GCM) (Invitrogen, Carlsbad, CA). Every 3–4 d, half of the culture medium was replaced with GCM. For transfections, 35 mm dishes of neurons in culture for 7–10 d were incubated with 2.0 μl of Lipofectamine 2000 (Invitrogen) and a total of 0.75 μg of plasmid DNA for 2 h. Cells were imaged 24–48 h after transfection.
For experiments using latrunculin A (LatA; Sigma, St. Louis, MO), LatA was directly added to the culture medium from a 1 mm stock in DMSO for either 10 min for HEK cells or overnight for hippocampal neurons. DMSO-only controls were performed for all experiments involving LatA.
Live cell confocal imaging.
HEK cells expressing GFP-Kv2.1 were imaged using an Olympus (Tokyo, Japan) FV1000 confocal microscope equipped with spectral detectors and the SIM scanner. GFP was excited using the 488 nm line of an argon laser set at 0.1–0.5% transmission and emission collected using the variable bandpass filter set at 500–550 nm. A 60×, 1.4 numerical aperture (NA) oil immersion objective was used for imaging, and the pinhole diameter was set for 1 Airy unit. For each image, the detector voltage was adjusted as necessary to use the full 12-bit linear range. For the imaging of individual Kv2.1-containing clusters, an optical zoom of 8–15× was often used. GFP-Kv2.1 was photobleached using the SIM scanner in tornado scan mode with the 405 nm diode laser set at 15–20% transmission for 500–1000 ms. The SIM scanner was synchronized with the main scanner during bleach and acquisition. Images were acquired every 0.5–10 s as indicated at a 512 × 512 resolution. The 655 quantum dots were imaged with the 633 laser line and the standard filter-based detector on the FV1000 at a 320 × 320 resolution. For imaging of 605 quantum dots, a DeltaVision RT wide-field microscope system was used with a 100×, 1.4 NA objective and filter sets optimized for FITC and rhodamine. Image exposure was 10 ms for the green channel and 200 ms for the red channel using a CoolSnap HQ camera at 3 × 3 binning. Imaging with both systems was performed in HEPES-buffered saline containing (in mm) 146 NaCl, 4.7 KCl, 2.5 CaCl2, 0.6 MgSO4, 1.6 NaHCO3, 0.15 NaH2PO4, 0.1 ascorbic acid, 8 glucose, and 20 HEPES, pH 7.4 (imaging saline). For all imaging experiments, the stage and objective were heated to 37°C. Cells were imaged for <1 h on the microscope stage. However, no changes in the Kv2.1 surface expression were observed after up to 4 h in imaging saline at 37°C. Long-term imaging under the conditions described above did not alter the expression pattern.
All off-line image analysis was performed using the Olympus FV1000 software (version 1.03) and Volocity 3.5 (Improvision, Lexington, MA). Data analysis and curve fitting was performed with SigmaPlot 8 (Systat, Point Richmond, CA) or IgorPro 5.03 (Wavemetrics, Portland, OR). Images were filtered in Volocity using a 3 × 3 median filter.
Enzymatic biotinylation of cell surface Kv2.1.
For the specific biotinylation of surface GFP-Kv2.1, the biotin acceptor peptide sequence (GGGAGGLVGLNDIFEAQKIEWHEARGGGAGG; boldfaced lysine is biotinylated, and the underlined sequence represents inserted amino acids not part of the actual biotin acceptor peptide) for biotin ligase was inserted into the extracellular loop between S1 and S2. This construct, referred to as GFP-Kv2.1-loopBAD, was expressed in HEK cells and biotinylated as described by Howarth et al. (2005) using bacterially synthesized biotin ligase. The live cells were then incubated for 10 min with a 1:10,000 dilution of streptavidin-coated quantum dots (either QD605 or QD655 from Invitrogen) in imaging saline containing 1% BSA (IgG/fatty acid free). After tagging, the cells were rinsed extensively with imaging saline plus 1 μm biotin to prevent streptavidin-induced channel cross-linking and imaged as described above. Controls for nonspecific quantum dot binding included the imaging of cells expressing GFP-Kv2.1-HA carried through the entire labeling protocol or the use of GFP-Kv2.1-loopBAD-expressing cells that were not incubated with the biotin ligase. The level of nonspecific binding was low, 1 or 2 dots per cell in <20% of the control cells imaged. Nonspecifically bound quantum dots were rarely mobile and not associated with the Kv2.1 surface clusters, thus most likely representing adsorption to extracellular matrix components. Although the imaging of individual quantum dots immobilized onto a glass coverslip confirmed single dots were tracked in the transfected cells, we cannot guarantee a single dot is tethered to a single channel in our imaging experiments. In some cases, biotinylated surface channel was labeled with Alexa-594-conjugated streptavidin (Invitrogen).
Results
Kv2.1-containing clusters are specialized membrane regions for channel concentration
Unlike most Kv channels, when expressed in both HEK cells and hippocampal neurons, Kv2.1 is efficiently trafficked to the surface and targeted to clusters that closely resemble those seen in hippocampal neurons in vivo (Fig. 1) (Misonou and Trimmer, 2004; O'Connell and Tamkun, 2005; Mohapatra and Trimmer, 2006). These clusters are on the cell surface, because they can be detected via enzymatic biotinylation and streptavidin labeling of HEK cells expressing GFP-Kv2.1-loopBAD (Fig. 1 A) or by using antibodies to the extracellular HA epitope in hippocampal neurons (Fig. 1 B) transfected with GFP-Kv2.1-HA. As shown in Figure 1 C, the addition of the fluorescent and epitope tags to Kv2.1 does not affect channel trafficking, because the GFP-Kv2.1-HA clusters are identical to those observed using an antibody against the endogenous channel. Furthermore, the tagged channel generates a delayed rectifier current indistinguishable from wild-type channel (data not shown), therefore neither channel localization nor channel function are affected by tagging Kv2.1. The data of Figure 1 also demonstrate that the machinery for the efficient targeting of this channel is well conserved between HEK cells and neurons, including the determinants for the formation of Kv2.1-containing surface clusters.
Figure 1.
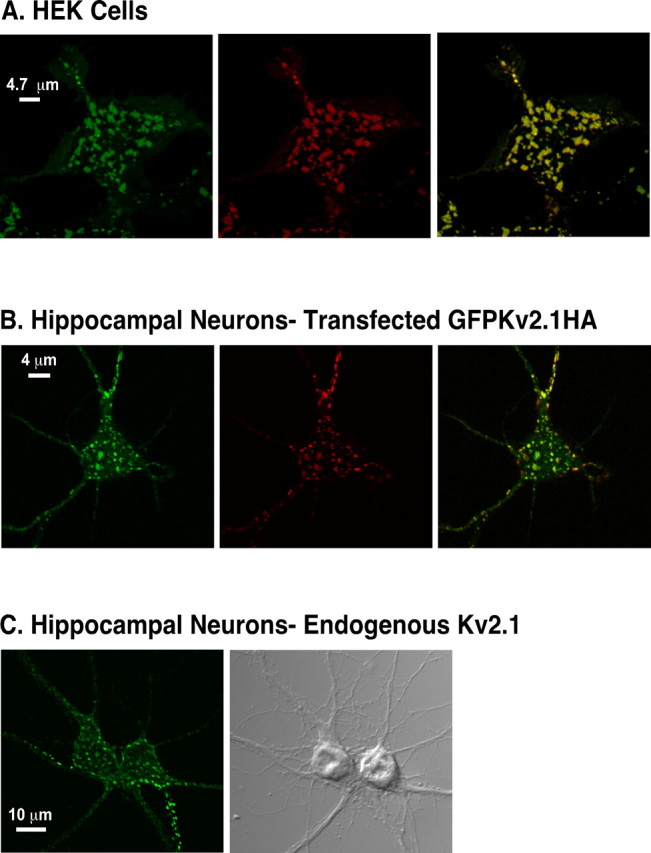
Expression of Kv2.1 in HEK cells and hippocampal neurons. A, Surface expression of GFP-Kv2.1-loopBAD in HEK cells. Cells were biotinylated and labeled with Alexa 594 streptavidin as described in Materials and Methods. B, Hippocampal neurons (10 DIV) transfected with GFP-Kv2.1-HA. The neurons were incubated with Alexa 594-conjugated anti-HA monoclonal antibody (1:500 dilution; Invitrogen) in imaging saline for 20 min at 37°C and washed once in antibody-free imaging saline to specifically detect surface channel. In A and B, the live cells were immediately imaged as described previously (O'Connell and Tamkun, 2005). The left panels show total GFP fluorescence, the middle panels show Alexa-594-conjugated streptavidin or anti-HA antibody, and the right panels show the overlay. C, Localization of endogenous Kv2.1 in cultured hippocampal neurons. Neurons in culture for 12 d were fixed with formaldehyde and incubated with an antibody against the Kv2.1 C terminus. Antibody binding was detected with Alexa 594-conjugated anti-rabbit secondary antibody. Left, Anti-Kv2.1 antibody binding. Right, DIC image.
We used FRAP to examine the stability of individual clusters located on the bottom of the cell. Focusing on the cell bottom had two advantages; it avoided much of the loss of focus/cell movement problems associated with high-magnification imaging and allowed for an accurate view of the cluster perimeter. In addition, because Kv2.1 preferentially localizes to the bottom of HEK cells (O'Connell and Tamkun, 2005), analysis of this region seemed most relevant. As shown in Figure 2, several entire clusters were photobleached as described in Materials and Methods (Fig. 2 A, yellow circle). Because GFP-Kv2.1 is unevenly distributed across the bleach region of interest (ROI), recovery was measured by drawing a second, smaller ROI contained entirely within one of the bleached clusters (Fig. 2 A, red circle). As shown in Figure 2 B, recovery of fluorescence within this ROI reached only ∼25% of the prebleach intensity within 12 min. The FRAP occurred exactly within the same regions as the original clusters (Fig. 2, red arrows), suggesting that the Kv2.1-containing clusters represent stable and well defined regions of the cell surface where channel exchange occurs. The yellow arrow in Figure 2 points to a cluster that was partially photobleached and that had a fluorescence recovery that appeared to be derived from an adjacent GFP-Kv2.1-containing cluster or trafficking vesicle (highlighted by the white arrow).
Figure 2.
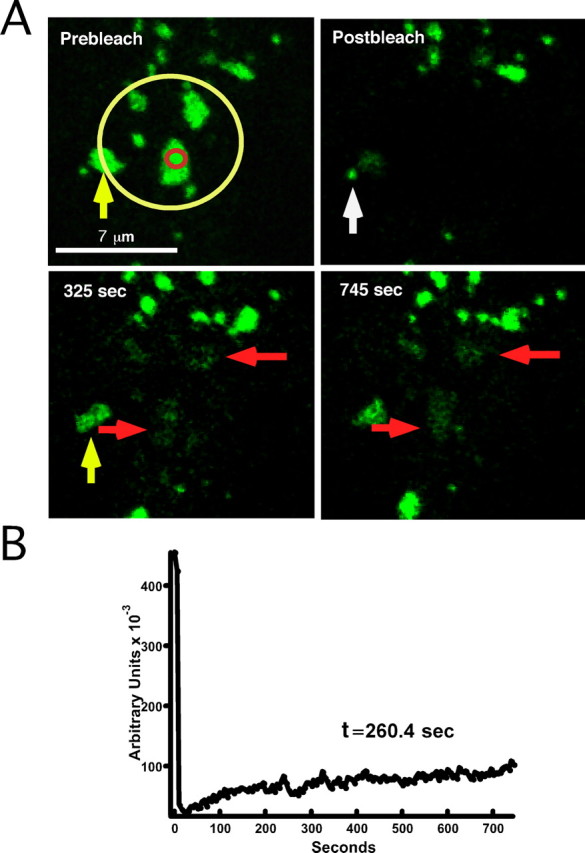
GFP-Kv2.1-containing surface clusters are stable domains for concentration of channel. A, FRAP of cell surface clusters. A magnified image of GFP-Kv2.1 clusters on the basal surface of a HEK cell is shown. The region within the yellow ROI (Prebleach) was photobleached, and recovery was monitored by imaging every 5 s for ∼12 min. Although GFP fluorescence did not recover fully after 12 min (Mf = 0.25), recovery clearly occurred within the original cluster perimeters (red arrows). The indicated times refer to time after the start of imaging. The yellow arrow points to a cluster that was partially photobleached, the fluorescence recovery of which appears to be derived from an adjacent GFP-Kv2.1-containing cluster or trafficking vesicle (highlighted by the white arrow). B, Recovery plot for FRAP experiment in A. Because GFP fluorescence was unevenly distributed across the bleach ROI, a second ROI (red circle) contained entirely within the lower cluster was used to obtain the fluorescence intensity during recovery. The time constant of recovery (τ) was derived by fitting the recovery curve in B with a single exponential. For this cell, τ = 260.4 s.
Delivery of new channel to cell surface clusters via trafficking vesicle fusion
To determine the mechanisms by which the FRAP illustrated in Figure 2 likely occurred, we used live-cell confocal imaging to visualize channel movement over time. We continued to use the basal surface of GFP-Kv2.1-expressing HEK cells for the reasons mentioned above. During time-lapse confocal imaging, mobile structures we categorize as intracellular transport vesicles occasionally entered the focal plane centered on the cell bottom. These vesicles were readily distinguishable from the surface clusters based on size (<0.5 μm) and their high degree of mobility (0.3–1 μm/s). This rate is considerably faster than the diffusion of surface clusters within the plane of the membrane (<2 μm/min) (see supplemental movie S6, available at www.jneurosci.org as supplemental material). These fast-moving GFP-Kv2.1-containing vesicles were also often observed to associate with surface clusters and, on rare occasions, fuse with the cell surface at, or adjacent to, a channel microdomain. Figure 3 and supplemental movie S1 (available at www.jneurosci.org as supplemental material) illustrate the fusion of such a transport vesicle with the cell surface in the immediate vicinity of a cluster that had been photobleached previously. At 9 min, 20 s into the experiment, a small (∼0.5 μm) vesicle appears in the vicinity of the original prebleached cluster (Fig. 3, 9 min, 25 s). The vesicle ceases its rapid movement, possibly because of interaction with the preexisting channel cluster on the surface. The vesicle then transfers its fluorescent contents to the surface membrane cluster. The fluorescence intensity of the vesicle before fusion ]3.1 × 10⁵ arbitrary units (AU)[ is equivalent to the fluorescence of the cluster after fusion (3.2 × 10⁵ AU). Notably, the contents of the vesicle did not diffuse out into the general membrane but remained constrained to a small domain, strongly suggesting that the vesicle contents were either delivered to a surface microdomain with a well defined border or that the vesicle membrane containing such a perimeter fence incorporates into the cell surface (Fig. 3, 11 min, 15 s).
Figure 3.
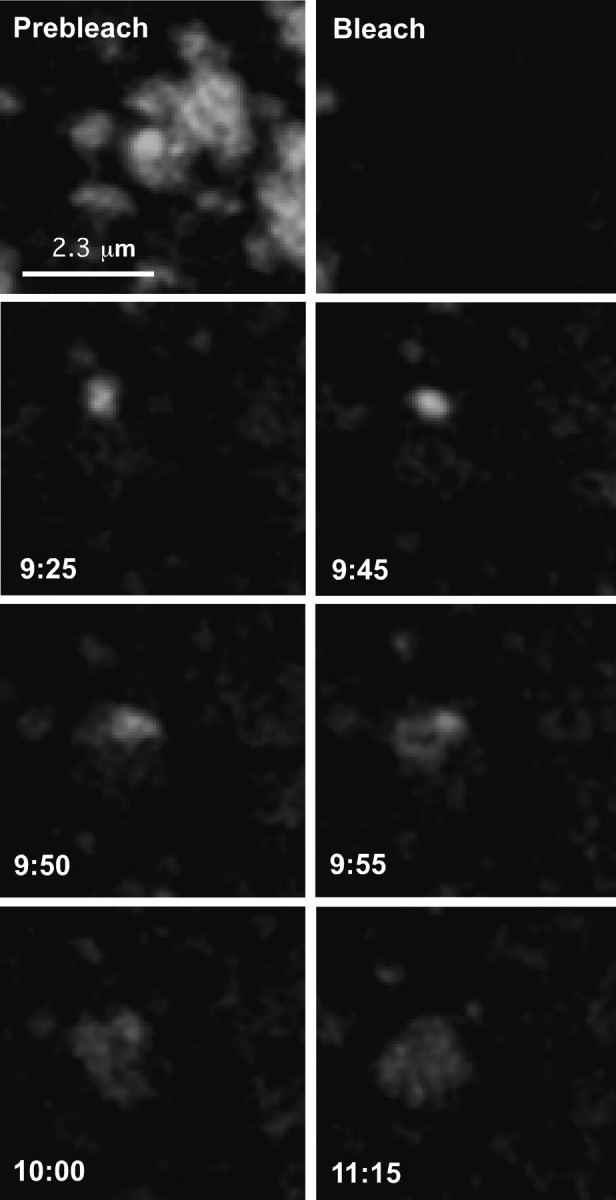
Intracellular transport vesicles deliver GFP-Kv2.1 to localized cell surface domains. Delivery at a bleached cluster. Images are from a bleach time series of a GFP-Kv2.1 cluster on the basal surface of an expressing HEK cell. Images have been magnified to highlight the small (∼0.5 μm) transport vesicle. The vesicle appears initially at 9 min, 25 s and fuses with the surface membrane within 30 s. Images were acquired every 5 s for 16 min. The fluorescence intensity of the vesicle before fusion (3.1 × 10⁵ AU) is equivalent to the fluorescence of the cluster after fusion (3.2 × 10⁵ AU).
We also observed vesicle fusion events in which GFP-Kv2.1 appeared to be delivered directly to preexisting (unbleached) clusters, as shown in Figure 4 A and supplemental movie S2 (available at www.jneurosci.org as supplemental material). In this experiment, the basal surface of the cell was imaged without photobleaching. A small vesicle (Fig. 4 A, 8 min, 24 s, arrow) appears in the bottom right corner of the image. Although this vesicle did not immediately fuse with a cluster, it was restricted to the image center and remained mobile for just over 1 min before attaching to the faint cluster highlighted by the arrowhead (Fig. 4 A, 9 min, 30 s) and then fusing with it (Fig. 4 A, 9 min, 39 s). As expected for vesicular delivery of GFP-tagged channel to a preexisting cluster, the total fluorescence intensity of the cluster after fusion (2.4 × 10⁷ AU) is equal to the sum of the prefusion cluster and the vesicle (2.4 × 10⁷ AU).
Figure 4.
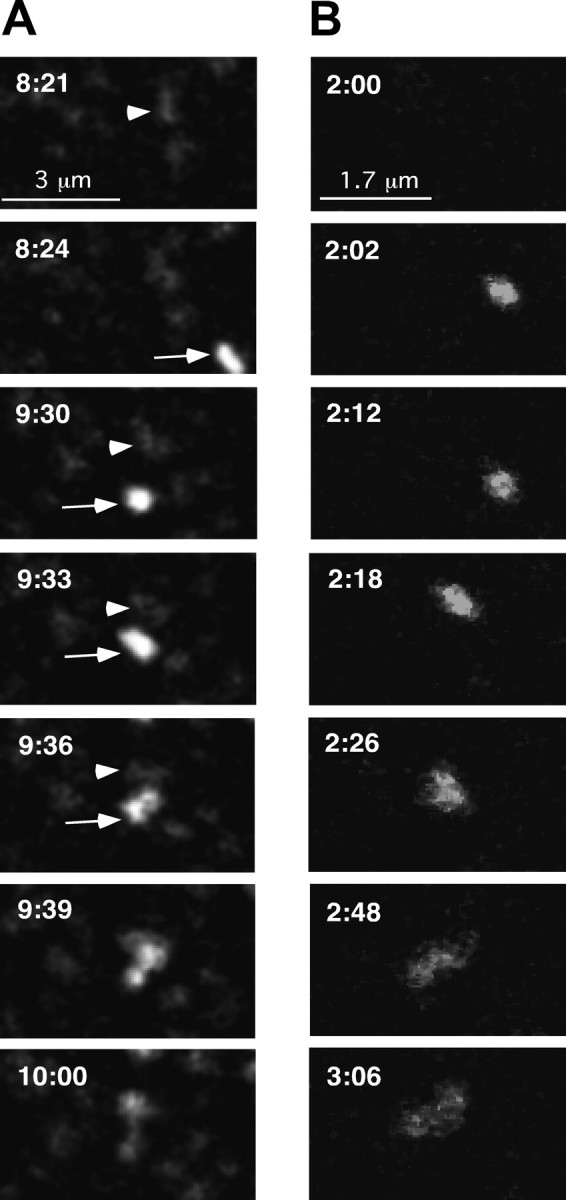
Intracellular transport vesicles deliver GFPKv2.1 to localized cell surface domains. A, Delivery to an unbleached cell surface cluster. Images are taken from a time series of a GFP-Kv2.1-containing cluster on the basal surface of a HEK cell. Images have been magnified to highlight fusion of the transport vesicle with the cluster. Times refer to the total time elapsed after the start of the time series. The pertinent preexisting cluster is highlighted (arrowhead) at 8 min, 21 s before the appearance of the transport vesicle (arrow; 8 min, 24 s). The time interval was 3 s. The total fluorescence intensity of the cluster after fusion (2.4 × 10⁷ AU) is equal to the sum of the prefusion cluster and the vesicle (2.4 × 10⁷ AU). B, Delivery to cell surface devoid of accumulated GFP-Kv2.1. A vesicle enters the field of view and tethers to a membrane region free of GFP fluorescence before transferring its contents to the plasma membrane where they remain localized within a stable perimeter. Images were acquired every 2 s.
The third type of delivery event observed occurred at a region devoid of apparent preexisting surface clusters. As shown in Figure 4 B and supplemental movie S3 (available at www.jneurosci.org as supplemental material), GFP-Kv2.1-containing vesicles delivered their contents to cell surface regions free of detectable GFP-Kv2.1 channel clusters. Here again, the newly delivered channel remained confined to the region of membrane insertion, diffusing <0.5 μm from the apparent site of delivery after 6 min.
Fusion of vesicles as shown in Figures 3 and 4 was observed 21 times in the 102 cells imaged. This delivery to the cell surface often was seen only once during 15–20 min of continuous imaging. We recorded six instances of GFP-Kv2.1 delivery at or adjacent to a bleached GFP-Kv2.1-containing cluster, 11 cases involving delivery to unbleached clusters, and four examples of delivery to channel-free membrane. As seen in Figure 3, vesicle fusion occurs very quickly, with the entire event often completed within 30 s of the first appearance of the vesicle near the cluster. The actual delivery of GFP-Kv2.1 channel to the plasma membrane took place over 10–15 s. Rapidly moving vesicles were frequently observed entering and leaving the focal plane, indicating that vesicular transport of channel may be a common means to regulate channel delivery to surface microdomains.
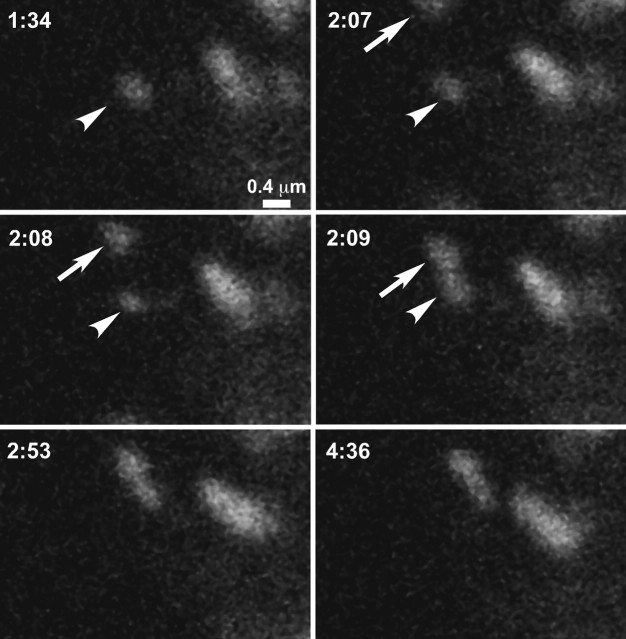
We also observed intracellular vesicles fusing with surface clusters in cultured hippocampal neurons expressing GFP-Kv2.1. As seen in Figure 5, a rapidly moving vesicle (Fig. 5, arrow) appears and quickly (<5 s) fuses with an existing surface cluster (Fig. 5, arrowhead). These events were observed less frequently in neurons than in HEK cells (three times out of 38 neurons), however this is likely attributable to the fact that the fluorescence of the neuronal vesicles was considerably fainter than their HEK cell counterparts, thus making them more difficult to image. Nevertheless, fusion of these vesicles with neuronal Kv2.1 surface clusters appeared nearly identical to the fusion events observed in HEK cells, suggesting that the underlying mechanism is similar between the two cell types; HEK cells are therefore an adequate model system for studying this phenomenon.
Figure 5.
Vesicle delivery to cell surface clusters in hippocampal neurons. Neurons 8 DIV were transfected with GFP-Kv2.1-loopBAD and imaged 24 h later. The time series shows vesicle-based delivery to the cell surface. The arrowhead indicates a stationary surface cluster, whereas the arrow indicates a mobile trafficking vesicle that appears and fuses with the surface cluster over a 3 s period. Note the times of the last two images, illustrating the stability of the cluster after delivery to the cell surface.
Mobility of Kv2.1 within the surface cluster
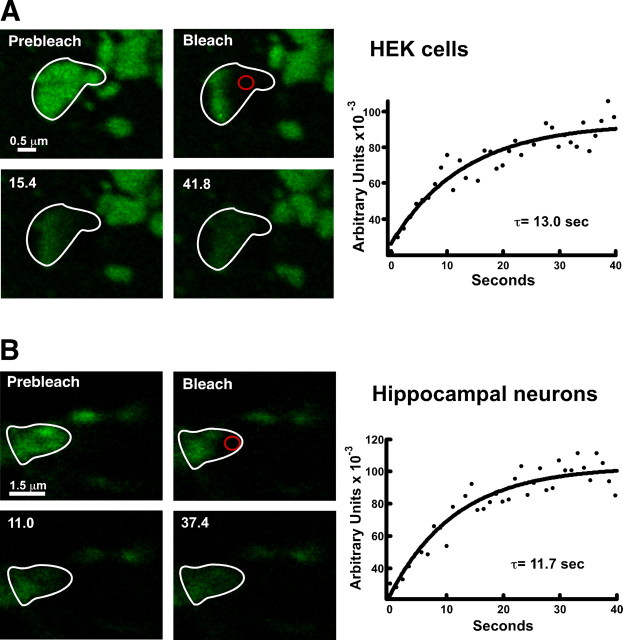
After fusion of a vesicle with the plasma membrane, the GFP-Kv2.1 signal appeared to diffuse evenly throughout a surface microdomain but remained near the point of delivery (Fig. 3), suggesting that Kv2.1 is freely mobile within a cluster. We first tested this hypothesis by photobleaching part of a cluster on the basal surface of a HEK cell as shown in Figure 6 A. A bleach ROI was drawn encompassing the lower half of the cluster outlined in white (prebleach) as well as the neighboring regions to ensure that any observed recovery comes from the unbleached half and not fusion with the surrounding clusters. As predicted, if Kv2.1 is freely mobile within the cluster itself, within 10 s fluorescent channel diffused into the bleached half and completely equilibrated within 30 s. Furthermore, the loss of fluorescence from the unbleached half paralleled the recovery of fluorescence into the bleached region (data not shown). The τ for the fluorescence recovery in Figure 6 A was 13.0 s. The mean time constant from all such experiments in HEK cells was 14.1 ± 1.5 s (n = 43). Similar FRAP experiments for Kv2.1 clusters on the surface of cultured hippocampal neurons are illustrated in Figure 6 B. For the FRAP illustrated here, the τ = 11.7 s, whereas the mean was 11.5 ± 6.1 (n = 24). Thus, these FRAP kinetics suggest the mobility of Kv2.1 within the surface clusters is very similar between HEK cells and hippocampal neurons.
Figure 6.
Channel within a cluster is freely mobile as demonstrated by FRAP analysis. A, FRAP of a HEK cell basal surface cluster. One-half of a basal surface cluster (white outline) was bleached, along with the surrounding clusters. By 30 s after the start of imaging (bleach occurred at t = 5 s), GFP fluorescence diffused from the unbleached half into the bleached region. The imaging interval was 1.1 s. B, FRAP of a GFP-Kv2.1-containing surface cluster in a cultured hippocampal neuron. Clusters on the bottom of the neuronal cell body were chosen for analysis as described above. The imaging interval was 3 s. In both cases, FRAP was quantitated within the small ROI (red circle) drawn in the bleached region. Solid lines represent a single exponential fit to the data; τ = 13.0 s for the HEK cell and 11.7 s for the neuron. Mean time constants were 14.1 ± 1.5 s (n = 43 in HEK cells) and 11.5 ± 6.1 s (n = 24 in hippocampal neurons).
In addition to the FRAP approach, we used quantum dot imaging to confirm Kv2.1 mobility within the surface clusters as done previously by Howarth et al. (2005) in their studies of AMPA and epidermal growth factor receptor mobility. Live cells were incubated with biotin ligase to biotinylate surface GFP-Kv2.1-loop BAD in both HEK cells and neurons. The biotinylated channel was then labeled with streptavidin-linked quantum dots as described in Materials and Methods. After this labeling, the GFP and quantum dot signals were collected over time as illustrated in Figure 7 and supplemental movies S4 and S5 (available at www.jneurosci.org as supplemental material). Figure 7 A shows a single quantum dot track acquired from images taken ∼0.9 s apart that show significant movement (0.5–0.8 μm/s) of the biotinylated channel within the GFP-defined cluster on the HEK cell surface, as expected if the channel is freely diffusible within the cluster boundaries. Similar results are shown in Figure 7 B for clusters on the surface of cultured hippocampal neurons. This mobility is best illustrated in supplemental movies S4 and S5 (available at www.jneurosci.org as supplemental material). The quantum dot imaging, together with the FRAP data, clearly demonstrate channel mobility within the cluster, and as the initial observations of trafficking vesicle fusion with the cell surface suggested, there must be a perimeter fence that retains the mobile channel within the surface microdomain. As supplemental movies S4 and S5 (available at www.jneurosci.org as supplemental material) indicate, surface channels do exist outside the clusters, because quantum dot labeling is seen where obvious GFP-Kv2.1 clusters are lacking. Presumably, a single channel is labeled with a quantum dot, but the fluorescence of the four GFP molecules within the channel tetramer cannot be detected under the imaging conditions used.
Figure 7.
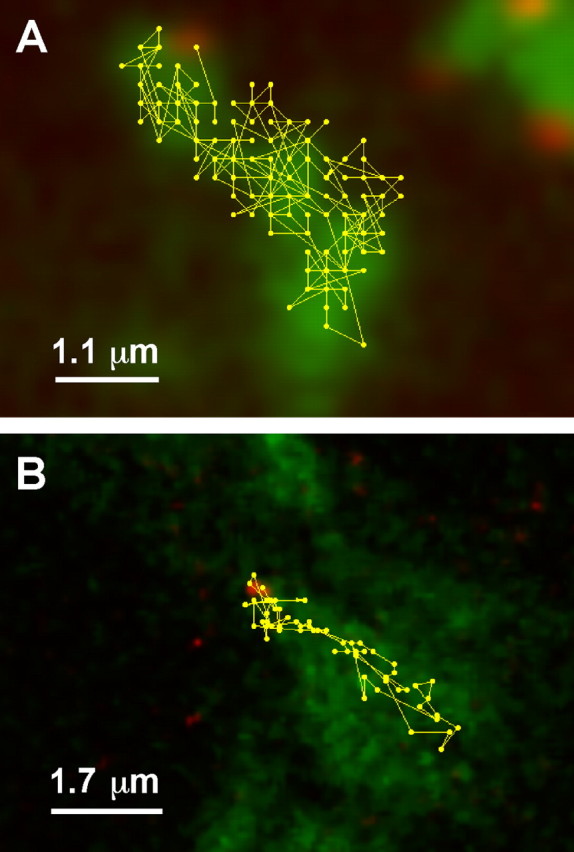
Channel within a cluster is freely mobile as demonstrated by quantum dot imaging. A, Quantum dot track on a HEK cell surface cluster. HEK cells expressing GFP-Kv2.1-loopBAD channels were biotinylated and tagged at low efficiency with streptavidin-coated 605 quantum dots as described in Materials and Methods. Cells were then imaged every 0.867 s for both GFP and quantum dot fluorescence. The track of a single quantum dot that can be seen at the top of the cluster is shown. B, Quantum dot track on a hippocampal neuron. Hippocampal neurons in culture for 8 d were transfected with GFP-Kv2.1-loopBAD and biotinylated 18 h later. Cells were then 655 quantum dot labeled and imaged every 0.56 s. The track of a single quantum dot first seen at the top of the cluster is shown.
Content exchange after cluster fusion
Although the FRAP experiments in Figure 2 suggest that the Kv2.1-containing clusters are stable on the cell surface, additional examination indicated these microdomains are also surprisingly dynamic in both HEK cells and hippocampal neurons. The clusters did move short distances (<2 μm over a period of minutes) and appear to fuse with one another as illustrated in supplemental movies S6 and S7 (available at www.jneurosci.org as supplemental material). This video sequence shows clusters fusing to form larger structures as well as breaking apart, generating smaller ones. Notably, they do not make large-scale movements, remaining roughly within the same membrane region.
Because channel is freely mobile within a cluster, it is plausible that true fusion of adjacent clusters and dissolution of the perimeter fence results in the exchange of the cluster contents. To determine whether clusters truly fuse and exchange contents or remain discrete structures, we photobleached single clusters that were in close proximity to neighboring clusters (and therefore had a higher probability of fusion). In Figure 8, the top cluster of the highlighted pair was photobleached, and fluorescence intensity in both clusters was monitored. Forty seconds after bleach, the bottom cluster fused with the bleached cluster to become one large cluster, completely exchanging contents (Fig. 8, 3 min). As expected, the total fluorescence intensity of the bottom cluster immediately after bleaching was similar to the total fluorescence intensity of the new larger cluster (6.5 × 10⁵ vs 7.1 × 10⁵ AU).
Figure 8.
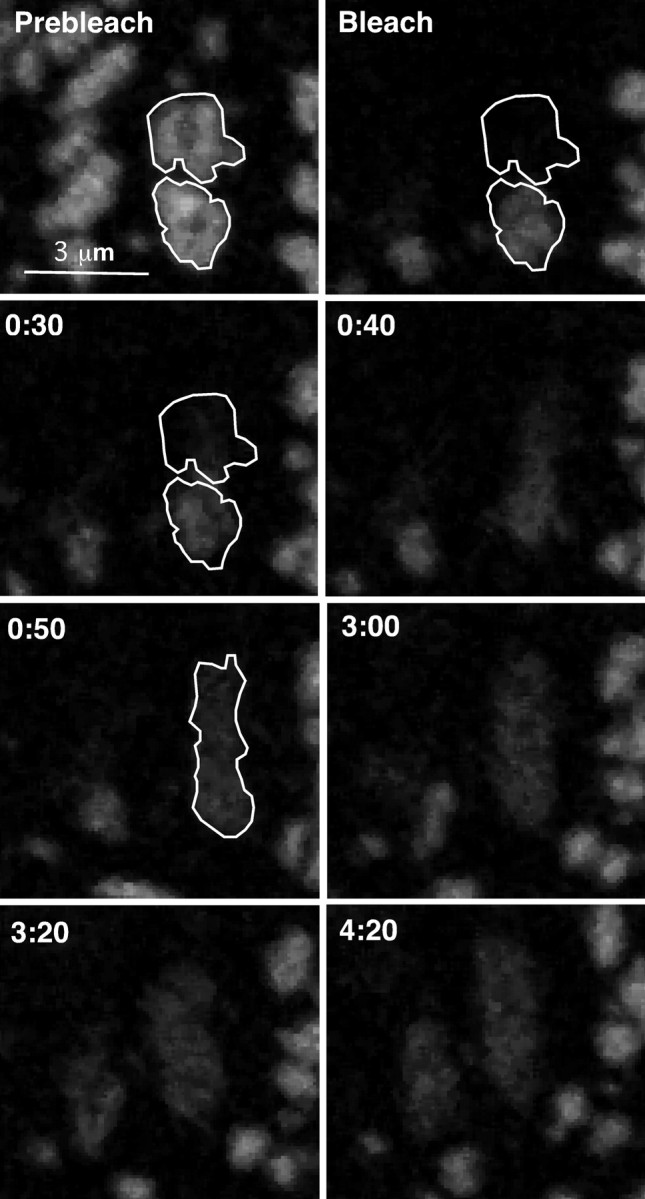
Adjacent clusters can fuse and exchange contents. The top cluster of the two highlighted clusters was bleached, and recovery in that region was monitored. Images are from a bleach series of basal surface clusters. At 50 s into the time series, the bottom cluster fuses with the bleached cluster, and their contents freely exchange. Fluorescence intensity of the unbleached cluster immediately after bleaching was equivalent to the to the total intensity of the fused clusters (6.5 × 10⁵ vs 7.1 × 10⁵ AU).
A role for cortical actin in the maintenance of Kv2.1 surface clusters
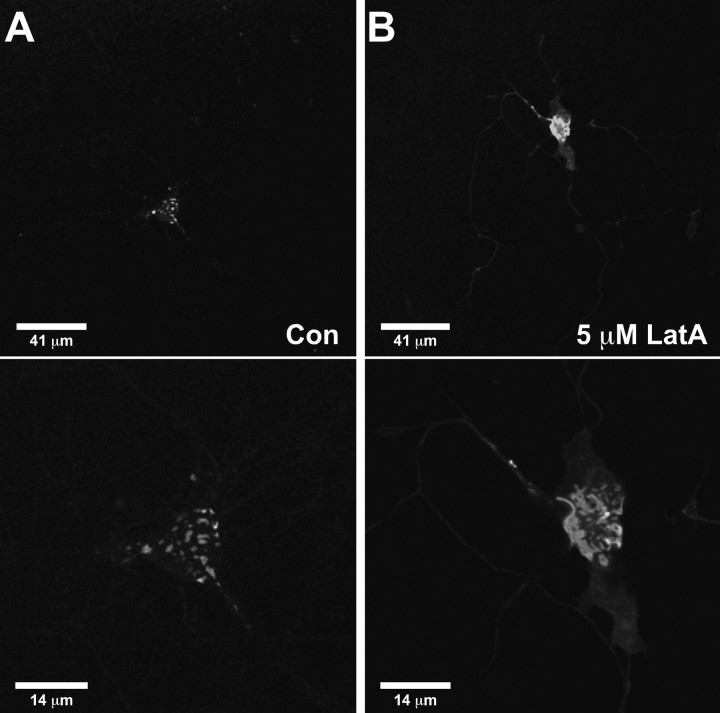
Cortical actin has been implicated in the restriction of plasma membrane diffusion and in the division of the cell surface into various microdomains (Kusumi et al., 2005; Suzuki et al., 2005). We therefore examined the effect of actin disruption via LatA treatment. LatA sequesters G-actin, thus destabilizing F-actin filaments. Cultured hippocampal neurons were treated with 5 μm LatA, a concentration expected to significantly disrupt the neuronal actin cytoskeleton (Allison et al., 2000). Neuronal morphology remained intact after overnight incubation in LatA, however two distinct effects were observed on Kv2.1 localization. As shown in Figure 9, the size of Kv2.1 surface clusters increased dramatically from an average surface area of 0.89 ± 0.16 μm2 (n = 10) to 12.15 ± 1.4 μm2 after 5 μm LatA treatment (n = 9; p < 0.001), with a corresponding decrease in the number of clusters (control, 63 ± 14 vs 5 μm LatA, 12.4 ± 2.2; p < 0.05), suggesting that the increase in cluster surface area results from the aggregation of existing clusters.
Figure 9.
Latrunculin treatment alters cluster size and Kv2.1 localization in hippocampal neurons. Hippocampal neurons were transfected at 7 DIV with GFP-Kv2.1-loopBAD and imaged 48 h later. A, Control (Con) neurons treated with 0.5% DMSO overnight. Top, Low-magnification image of a GFP-Kv2.1-expressing neuron illustrating that channel clusters are restricted to the cell body and proximal dendrites. The average maximum distance from cell body is 37.3 ± 3.5 μm (n = 10). Bottom, Typical GFP-Kv2.1 clusters on the basal surface of the same neuron. The average cluster area is 0.89 ± 0.16 μm2 (n = 10). B, Hippocampal neurons treated with 5 μm LatA overnight. Top, Low-magnification image of a GFP-Kv2.1-expressing neuron. Channel is widely distributed throughout the cell body and distal neurites. The average maximum distance from the cell body is 174.6 ± 13.2 μm (n = 9). Bottom, Higher-magnification image of the same neuron. Disruption of neuronal actin by LatA dramatically increases the surface area of GFP-Kv2.1 clusters. The average cluster area is 12.15 ± 1.4 μm2 (n = 9).
In hippocampal neurons, Kv2.1 is normally restricted to the cell body and proximal neurites; however, after overnight incubation with 5 μm LatA, Kv2.1 redistributed throughout the neurites. Under control conditions, channel extended, on average, 37.3 ± 3.5 μm (n = 10) from the cell body, typically down only one or two neurites. However, after LatA treatment, channel was observed an average maximum of 174.6 ± 13.2 μm (n = 9) from the cell body and was seen in all neurites (Fig. 9 A,B, top). Interestingly, although the average cluster surface area was only slightly larger after 1 μm LatA treatment (1.94 ± 0.2 μm2; n = 5; p < 0.05), channel restriction to the cell body was dramatically altered, with GFP fluorescence observed an average maximum distance of 136.6 ± 11.6 μm (n = 5) from the cell body (data not shown).
LatA had a similar effect on Kv2.1 cluster size in HEK cells. Treatment of GFP-Kv2.1-expressing HEK cells with 100 nm LatA for 10 min resulted in an increase in the average cluster size on the cell bottom from 0.34 ± 0.12 to 1.21 ± 0.75 μm2 (n = 7; p < 0.01, paired t test) (supplemental Fig. SF1, available at www.jneurosci.org as supplemental material). This effect was reversible after LatA washout. LatA treatment did not significantly alter diffusion of the channel within a surface cluster as measured by FRAP. This result suggests that while actin is involved in maintaining either the perimeter fence or cluster separation, it plays little role in controlling channel diffusion within the cluster itself.
Discussion
Appropriate localization of Kv channels is crucial for local regulation of electrical excitability, possibly placing the channels in proximity to local signaling pathways that modulate channel activity and/or cell surface expression. In this study, we have used FRAP and time-lapse confocal imaging techniques to investigate the kinetic behavior of GFP-Kv2.1-containing microdomains on the surface membrane of HEK cells and cultured hippocampal neurons. The data presented indicate that these microdomains are stable, yet dynamic, structures on the cell surface that are specialized sites for the concentration of Kv2.1. The mobility of Kv2.1 channels within the surface cluster border or fence argues against a static scaffolding-based structure being responsible for the microdomain. These clusters are very similar in the two cell types examined here, further indicating that HEK cells represent a reasonable model system in which to study the formation and maintenance of these unique membrane structures.
Kv2.1 microdomain dynamics
Although the clusters themselves exhibit little lateral mobility, these domains collide with each other, occasionally coalesce, and sometimes actually fuse, allowing the free exchange of channel as shown in Figure 8. Thus, despite the restricted mobility of the cluster domains as a whole, the channel within the microdomain is relatively mobile. We have not yet attempted to calculate meaningful diffusion coefficients for channel within the cluster perimeter because the standard approaches to relate recovery within a photobleached circle to the diffusion constant (D) are not directly applicable to our FRAP experiments in which half of a diffusion restricted microdomain is bleached. It is for this reason that we have relied on FRAP time constants when comparing channel mobility in HEK cell and neuronal clusters. However, if these time constants are used with the approach of Axelrod et al. (1976), our calculations yield diffusion coefficients of ∼0.02 μm2/s within the cluster. This value is consistent with the coefficients reported for membrane proteins such as E-cadherin (0.03–0.04 μm2/s) (Lippincott-Schwartz et al., 2001) and various unanchored neurotransmitter receptors (0.01–0.02 μm2/s) (Triller and Choquet, 2005), although it is well below the rate at which highly mobile transmembrane proteins diffuse on the cell surface (>0.2 μm2/s) (Lippincott-Schwartz et al., 2001).
Role of the actin cytoskeleton in Kv2.1 cluster maintenance
The C terminus of Kv2.1 (and specifically a small region termed the PRC domain) is likely to be responsible for the assembly of Kv2.1 into large surface clusters in HEK cells and neurons, as well as the restriction of the channel to the cell body and proximal dendrites in neurons (Lim et al., 2000; Mohapatra and Trimmer, 2006). Deletion of the last 318 aa of the Kv2.1 C terminus or point mutations within the PRC domain result in declustering of the channel and redistribution throughout the neurites. It is also thought that the phosphorylation state of the C terminus is a primary determinant of channel clustering because dephosphorylation of the channel by either phosphatase activation or glutamate or muscarinic stimulation also results in declustering. However, it remains unknown what cellular components are involved in the maintenance of the Kv2.1 microdomain perimeter. Data presented here strongly implicate the actin cytoskeleton in both the regulation of cluster size and Kv2.1 restriction to the cell body and proximal neurites. It is possible that actin has multiple roles because treatment with 1 μm LatA, which did not dramatically alter cluster area, did result in the redistribution of channel throughout the distal neurites.
It should be noted that latrunculin treatment is expected to have profound effects on many cellular processes dependent on the actin cytoskeleton, including endocytosis, tethering of other actin-associated proteins such as scaffolding proteins, and possibly even membrane dynamics. Therefore, the effects of LatA described here are unlikely to be the result of a specific action of this toxin on Kv2.1 and could be attributable to disruption of an unknown actin-associated protein intermediate to the channel and the cytoskeleton. However, our results are consistent with the “picket fence” model most recently emphasized by Kusumi and coworkers (Ritchie et al., 2003). In this model, membrane proteins are “corralled” by cytoskeletal elements (actin and associated proteins) that are in close proximity to the plasma membrane, forming a barrier to diffusion though the membrane. The compartments formed by these pickets can be tightly constrained, not even permitting the diffusion of membrane lipid (Nakada et al., 2003). Previous data in Kv2.1-expressing MDCK cells (a polarized cell line) shows an interdigitation of Kv2.1 clusters with phalloidin-stained actin (Scannevin et al., 1996), suggesting a role for the cytoskeleton in the maintenance or separation of Kv2.1 clusters.
Delivery of Kv2.1 to surface microdomains
We observed two distinct mechanisms for channel delivery to surface clusters. The most frequently observed was the fusion of adjacent clusters with one another (see supplemental movies S6 and S7, available at www.jneurosci.org as supplemental material), resulting in the complete exchange of contents as illustrated in Figure 8. The other was the insertion of channel via fusion of small, highly mobile intracellular transport vesicles with the plasma membrane at or near the surface microdomains. Although we observed many of these highly mobile vesicles near the cell surface in both HEK cells and neurons, fusion events occurred primarily in areas of preexisting clusters. Only four instances of vesicles fusing to channel-free membrane were observed as shown in Figure 4 B. Without knowing what else is present in the surface clusters, we cannot determine whether these structures preexist in cells before Kv2.1 expression. Thus, it remains possible that vesicles fusing to channel-free membrane represents direct delivery to these specialized surface structures, albeit ones devoid of GFP-Kv2.1.
Mobile channels within a fence-defined cluster are inconsistent with a static scaffolding protein model of Kv2.1 surface clusters
Previous models of the Kv2.1-containing surface clusters have suggested that the channel is tethered to scaffolding proteins via its C terminus because deletion of this region prevents cluster formation (Surmeier and Foehring, 2004). However, static tethering of individual channels to scaffolding or cytoskeletal proteins is inconsistent with the data presented here. An alternative model compatible with our data are presented in supplemental Figure SF2 (available at www.jneurosci.org as supplemental material). Here mobile channel is corralled within a perimeter fence, and individual clusters are separated by the cortical actin cytoskeleton. Disruption of cortical actin results in greater cluster mobility and thus enhanced collision and fusion as illustrated in supplemental movies 6 and 7 (available at www.jneurosci.org as supplemental material). Retention proteins may interact with the channel C terminus, perhaps in a phosphorylation-dependent manner, to prevent the channel from crossing the perimeter fence. Channel found outside the cluster would not have these retention proteins attached. Perhaps channels become phosphorylated only after entering the surface cluster. Such phosphorylation could both alter channel function and retain the channel within the cluster perimeter (Mohapatra and Trimmer, 2006). An alternative model not pictured in supplemental Figure SF2 (available at www.jneurosci.org as supplemental material) is one similar to that proposed for the localization of various neurotransmitter receptors with the synaptic membrane (Triller and Choquet, 2005). In this model, which is by no means confirmed, localized proteins spend more time in a cluster because of transient interactions with cluster components. Discrimination between these two models will require extensive analysis of dwell times and diffusion coefficients on both sides of the Kv2.1-containing cluster boundary.
Relationship between Kv2.1 clustering and channel function
Kv2.1 is phosphorylated within the C terminus, and this phosphorylation is functionally significant. In hippocampal neurons, glutamate or carbachol treatments induce both dephosphorylation and declustering. Both treatments also result in a 20 mV hyperpolarizing shift in the activation curve for I K (Misonou et al., 2004; Mohapatra and Trimmer, 2006). Also in neurons, chemically induced ischemia induces declustering, dephosphorylation and the hyperpolarizing shift in the midpoint of activation (Misonou et al., 2005). Similar relationships between the voltage dependence of activation, phosphorylation state, and surface clustering are observed in HEK cells (Mohapatra and Trimmer, 2006). Interestingly, Kv2.1 does not form clusters when expressed in COS cells and has both a lower phosphorylation state and a hyperpolarized activation curve. Together, these data suggest a strong link between cluster formation, channel phosphorylation, and the voltage dependence of activation. However, at this point, the exact relationship between phosphorylation, localization, and function remains unclear. Phosphorylation could play a role in sequestering Kv2.1 within the cluster or it could occur only after the channel enters the cluster. The question of whether Kv2.1 clustering is linked directly to altered voltage dependence can only be addressed by high resolution, on cell patch-clamp recording aimed at surface regions with or without channel clusters.
Conclusions
The data presented here demonstrate that Kv2.1 localization on the cell surface of HEK cells and hippocampal neurons is considerably more dynamic than previously realized. This is especially intriguing in light of the recent finding that the surface distribution of Kv2.1 in hippocampal neurons is dependent on both neuronal activity and Ca2+ release from internal stores (Misonou et al., 2004, 2005). Our data outline a mechanism by which Kv2.1 surface localization may be regulated by the modulation of channel retention within a cluster-defining fence or by altered vesicle delivery at or near these surface domains. The vesicular delivery of channel to the cell surface, where it is retained within a specific boundary, dramatically enhances the efficiency by which cell surface channel expression is controlled. In addition, by retaining the channel within a specific region, association with channel-specific signaling molecules is ensured.
Footnotes
This work was supported by National Institutes of Health (NIH) RO1 Grants NS41542 and HL49330 (M.M.T.) and NIH–National Research Service Award F32 HL77056 (K.M.S.O.). We thank Drs. Kathy Partin and Scott Earley for comments on this manuscript and Dr. Patrick Sarmiere for performing the hemagglutinin surface staining of transfected hippocampal neurons.
References
- Allison DW, Chervin AS, Gelfand VI, Craig AM. Postsynaptic scaffolds of excitatory and inhibitory synapses in hippocampal neurons: maintenance of core components independent of actin filaments and microtubules. J Neurosci. 2000;20:4545–4554. doi: 10.1523/JNEUROSCI.20-12-04545.2000. [DOI] [PMC free article] [PubMed] [Google Scholar]
- Axelrod D, Koppel DE, Schlessinger J, Elson E, Webb WW. Mobility measurement by analysis of fluorescence photobleaching recovery kinetics. Biophys J. 1976;16:1055–1069. doi: 10.1016/S0006-3495(76)85755-4. [DOI] [PMC free article] [PubMed] [Google Scholar]
- Bartlett WP, Banker GA. An electron microscopic study of the development of axons and dendrites by hippocampal neurons in culture. I. Cells which develop without intercellular contacts. J Neurosci. 1984;4:1944–1953. doi: 10.1523/JNEUROSCI.04-08-01944.1984. [DOI] [PMC free article] [PubMed] [Google Scholar]
- Brewer GJ, Torricelli JR, Evege EK, Price PJ. Optimized survival of hippocampal neurons in B27-supplemented Neurobasal, a new serum-free medium combination. J Neurosci Res. 1993;35:567–576. doi: 10.1002/jnr.490350513. [DOI] [PubMed] [Google Scholar]
- Dirksen RT. Bi-directional coupling between dihydropyridine receptors and ryanodine receptors. Front Biosci. 2002;7:d659–670. doi: 10.2741/A802. [DOI] [PubMed] [Google Scholar]
- Du J, Haak LL, Phillips-Tansey E, Russell JT, McBain CJ. Frequency-dependent regulation of rat hippocampal somato-dendritic excitability by the K+ channel subunit Kv2.1. J Physiol (Lond) 2000;522:19–31. doi: 10.1111/j.1469-7793.2000.t01-2-00019.xm. [DOI] [PMC free article] [PubMed] [Google Scholar]
- Howarth M, Takao K, Hayashi Y, Ting AY. Targeting quantum dots to surface proteins in living cells with biotin ligase. Proc Natl Acad Sci USA. 2005;102:7583–7588. doi: 10.1073/pnas.0503125102. [DOI] [PMC free article] [PubMed] [Google Scholar]
- Kim E, Sheng M. PDZ domain proteins of synapses. Nat Rev Neurosci. 2004;5:771–781. doi: 10.1038/nrn1517. [DOI] [PubMed] [Google Scholar]
- Kusumi A, Nakada C, Ritchie K, Murase K, Suzuki K, Murakoshi H, Kasai RS, Kondo J, Fujiwara T. Paradigm shift of the plasma membrane concept from the two-dimensional continuum fluid to the partitioned fluid: high-speed single-molecule tracking of membrane molecules. Annu Rev Biophys Biomol Struct. 2005;34:351–378. doi: 10.1146/annurev.biophys.34.040204.144637. [DOI] [PubMed] [Google Scholar]
- Lim ST, Antonucci DE, Scannevin RH, Trimmer JS. A novel targeting signal for proximal clustering of the Kv2.1 K+ channel in hippocampal neurons. Neuron. 2000;25:385–397. doi: 10.1016/s0896-6273(00)80902-2. [DOI] [PubMed] [Google Scholar]
- Lippincott-Schwartz J, Snapp E, Kenworthy A. Studying protein dynamics in living cells. Nat Rev Mol Cell Biol. 2001;2:444–456. doi: 10.1038/35073068. [DOI] [PubMed] [Google Scholar]
- Misonou H, Trimmer JS. Determinants of voltage-gated potassium channel surface expression and localization in mammalian neurons. Crit Rev Biochem Mol Biol. 2004;39:125–145. doi: 10.1080/10409230490475417. [DOI] [PubMed] [Google Scholar]
- Misonou H, Mohapatra DP, Park EW, Leung V, Zhen D, Misonou K, Anderson AE, Trimmer JS. Regulation of ion channel localization and phosphorylation by neuronal activity. Nat Neurosci. 2004;7:711–718. doi: 10.1038/nn1260. [DOI] [PubMed] [Google Scholar]
- Misonou H, Mohapatra DP, Menegola M, Trimmer JS. Calcium- and metabolic state-dependent modulation of the voltage-dependent Kv2.1 channel regulates neuronal excitability in response to ischemia. J Neurosci. 2005;25:11184–11193. doi: 10.1523/JNEUROSCI.3370-05.2005. [DOI] [PMC free article] [PubMed] [Google Scholar]
- Mohapatra DP, Trimmer JS. The Kv2.1 C terminus can autonomously transfer Kv2.1-like phosphorylation-dependent localization, voltage-dependent gating, and muscarinic modulation to diverse Kv channels. J Neurosci. 2006;26:685–695. doi: 10.1523/JNEUROSCI.4620-05.2006. [DOI] [PMC free article] [PubMed] [Google Scholar]
- Nakada C, Ritchie K, Oba Y, Nakamura M, Hotta Y, Iino R, Kasai RS, Yamaguchi K, Fujiwara T, Kusumi A. Accumulation of anchored proteins forms membrane diffusion barriers during neuronal polarization. Nat Cell Biol. 2003;5:626–632. doi: 10.1038/ncb1009. [DOI] [PubMed] [Google Scholar]
- O'Connell KM, Tamkun MM. Targeting of voltage-gated potassium channel isoforms to distinct cell surface microdomains. J Cell Sci. 2005;118:2155–2166. doi: 10.1242/jcs.02348. [DOI] [PubMed] [Google Scholar]
- Rasband MN, Trimmer JS. Developmental clustering of ion channels at and near the node of Ranvier. Dev Biol. 2001;236:5–16. doi: 10.1006/dbio.2001.0326. [DOI] [PubMed] [Google Scholar]
- Ritchie K, Iino R, Fujiwara T, Murase K, Kusumi A. The fence and picket structure of the plasma membrane of live cells as revealed by single molecule techniques (Rev) Mol Membr Biol. 2003;20:13–18. doi: 10.1080/0968768021000055698. [DOI] [PubMed] [Google Scholar]
- Scannevin RH, Murakoshi H, Rhodes KJ, Trimmer JS. Identification of a cytoplasmic domain important in the polarized expression and clustering of the Kv2.1 K+ channel. J Cell Biol. 1996;135:1619–1632. doi: 10.1083/jcb.135.6.1619. [DOI] [PMC free article] [PubMed] [Google Scholar]
- Surmeier DJ, Foehring R. A mechanism for homeostatic plasticity. Nat Neurosci. 2004;7:691–692. doi: 10.1038/nn0704-691. [DOI] [PubMed] [Google Scholar]
- Suzuki K, Ritchie K, Kajikawa E, Fujiwara T, Kusumi A. Rapid hop diffusion of a G-protein-coupled receptor in the plasma membrane as revealed by single-molecule techniques. Biophys J. 2005;88:3659–3680. doi: 10.1529/biophysj.104.048538. [DOI] [PMC free article] [PubMed] [Google Scholar]
- Triller A, Choquet D. Surface trafficking of receptors between synaptic and extrasynaptic membranes: and yet they do move! Trends Neurosci. 2005;28:133–139. doi: 10.1016/j.tins.2005.01.001. [DOI] [PubMed] [Google Scholar]
- Wellman GC, Nelson MT. Signaling between SR and plasmalemma in smooth muscle: sparks and the activation of Ca2+-sensitive ion channels. Cell Calcium. 2003;34:211–229. doi: 10.1016/s0143-4160(03)00124-6. [DOI] [PubMed] [Google Scholar]


