Abstract
We assessed (1) whether the enantiomers of terpinen-4-ol, odorants that activate nearly identical areas of the olfactory bulb, are more difficult to discriminate than those of carvone, odorants that activate different areas of the olfactory bulb, and (2) whether olfactory bulb lesions that disrupt the pattern of bulbar activation produced by these enantiomers degraded the ability of rats to discriminate between them. In psychophysical tests, normal rats discriminated between the enantiomers of terpinen-4-ol and of carvone equally well. Surgical lesions that removed the majority of bulbar glomeruli activated by these odorants (as demonstrated in previous olfactory bulb studies using intrinsic optical imaging and 2-deoxyglucose) resulted in increased detection thresholds but few or no deficits in discriminating between suprathreshold concentrations of the enantiomers. These results fail to confirm predictions based on 2-deoxyglucose maps of bulbar activity that enantiomers of terpinen-4-ol should be more difficult to discriminate than those of carvone and that the ability to discriminate between enantiomers of an odorant are based on differences in patterns of bulbar activation revealed in such maps.
Keywords: enantiomers, olfaction, olfactory bulb, lesions, odor discrimination, odor coding
Introduction
Because numerous odorants may activate similar olfactory bulb glomeruli and one odorant may activate multiple glomeruli, exposure to a monomolecular odorant produces activation of multiple and often widely separated bulb glomeruli (Bozza and Mombaerts, 2001; Meister and Bonhoeffer, 2001). Although structurally similar odors may activate similar or overlapping glomerular areas, in all cases examined, each odor produced a unique pattern of glomerular activation (Rubin and Katz, 1999, 2001; Uchida et al., 2000; Leon and Johnson, 2003; Igarashi and Mori, 2005).
These outcomes provide the primary evidence for a somewhat complex but generally accepted combinatorial view of odor coding: that each odorant molecule serves as a ligand for a subset of sensory neurons that provide inputs to a corresponding subset of olfactory bulb glomeruli and that the resulting pattern and strength of these inputs uniquely identifies an odor. Furthermore, the differences in such patterns should determine discriminability between odors. Thus, for this combinatorial theory, the spatial or “odotopic” organization at the level of the olfactory bulb primarily provides the neural basis for odor discrimination and odor identification (Xu et al., 2000; Rubin and Katz, 2001).
However, in behavioral studies, discrete lesions of identified bulbar areas or massive disruption of bulbar patterns of inputs produced few or no deficits in a variety of odor detection and discrimination tasks (Hudson and Distel, 1987; Lu and Slotnick, 1994, 1998; Slotnick et al., 1997; Youngentob et al., 1997; Slotnick and Bodyak, 2002; Bisulco and Slotnick, 2003). A potential problem with these behavioral studies is that the odorants used vary in a number of dimensions, some of which may cue discriminative responding but not contribute to bulbar maps. One solution to this problem is to use odorants that differ from one another physically in only one way and produce different patterns of bulbar activity. For such odorants, the dimension along which they differ must both be responsible for differences in bulbar input and provide the sole cue for differential responding in the behaving animal. If removal or disruption of these inputs degraded discrimination, this would provide strong support at the level of behavior for the functional significance of bulbar maps produced in intrinsic optical imaging and 2-deoxyglucose (2-DG) studies.
Linster et al. (2001) reported that the enantiomers of carvone activated both similar and different bulbar areas, whereas those of terpinen-4-ol activated almost identical bulbar areas and predicted that terpinen-4-ol enantiomers would be less easily discriminated than those of carvone. Habituation and instrumental conditioning tests provided some support of this prediction (Linster et al., 2001, 2002). However, the results were not definitive because the habituation method does not adequately assess ability to discriminate odors, between-group differences in their conditioning task were relatively small, and odor concentrations were not well controlled.
In the present study, we reexamined the discriminability of these compounds using precision olfactometry and psychophysical tests with normal rats and those with lesions that disrupted the identified patterns of bulbar inputs.
Materials and Methods
Experiment 1
Subjects
Twenty-nine male Long–Evans rats (Charles River Laboratories, Wilmington, MA) were housed individually in plastic cages in a temperature- and humidity-controlled vivarium maintained on a 12 h light/dark cycle (lights on at 8:00 A.M.). Rats were ∼100 d old at the beginning of the study and, beginning 10 d before behavioral training, were maintained on a water restriction schedule of 8–10 ml of water per day. The experiments were performed in the Department of Psychology at American University, and the American University Institutional Animal Care and Use Committee approved all procedures.
Apparatus
Rats were trained in six Knosys (Bethesda, MD) computer-controlled multiple-channel olfactometers functionally identical to those described in detail by Bisulco and Slotnick (2003). Briefly, solenoid pinch valves controlled air streams, and odors were generated by passing a 50 cc/min stream of air over the surface of mineral oil-diluted odorants contained in disposable 50 ml centrifuge tubes. This odorized air was diluted by a factor of 40 with clean air before being introduced to an odor sampling tube in the rat operant chamber.
Before use and when a new odorant was used, the olfactometer was washed with 95% ethanol and air dried. Previously unused C-flex tubing and saturator tubes used in detection and discrimination tasks described below were washed in 95% ethanol and maintained until use in a 50°C clean stainless steel-lined convection oven dedicated to alcohol-cleaned glass and plastic ware. Each odorant and odorant concentration was maintained in its own saturator tube, and the liquid odorant was refreshed daily. Previously used tubing and containers were discarded. Odorant solutions were kept refrigerated until shortly before use. As noted previously (Bodyak and Slotnick, 1999), the use of pinch valves, disposable plastic tubing, and clean glass manifolds for each task eliminated any potential contamination in the system and ensured that discriminative responding was based only on the odorant cues provided.
Odorants
The odorants used and their rated purities were ethyl acetate (99.5%), (+)-carvone (98%), (−)-carvone (99%), (+)-terpinen-4-ol (97%), and (−)-terpinen-4-ol (97%). Ethyl acetate was purchased from Sigma (St. Louis, MO), and the carvone and terpinen-4-ol enantiomers were purchased from Fisher Scientific/Acros (Houston, TX). The purity levels were the highest available from these suppliers. All odorants were diluted v/v with odorless mineral oil to the desired concentration, and 10 ml of solution was used as the odorant source in the odor saturation tubes. Odorant concentrations are given as the liquid dilution of the odorant in the saturator tubes, and positive and negative stimuli used in training are named with regard to the odorant and its liquid dilution. Because, as described above, the 50 cc/min odorant vapor from the saturator tube was manifolded with 1950 cc/min clean air before being introduced to the rat sampling port, the odor concentration delivered to the animal sampling port was ∼2.5% of the concentration of the headspace above the liquid odorant. The odorant concentration of the headspace above the liquid solution is not known, but gas chromatographic analyses indicate that headspace concentrations of a wide variety of hydrocarbons from mineral oil dilutions are proportional to their liquid dilution (Cometto-Muniz et al., 2003).
Preoperative behavior tests
Initial training.
All rats were first trained on a simple odor detection task using the go, no-go discrimination procedures described previously in detail (Slotnick and Schellinck, 2002). Five percent ethyl acetate served as the odorant. Standard operant conditioning methods were used to train rats to insert their snouts into the odor sampling port and respond by licking at the water delivery tube (located within the odor sampling port) in the presence of the ethyl acetate vapor. The first snout insertion after a 5 s intertrial interval (ITI) initiated a trial. At the beginning of the trial, the stimulus control valves and a valve that directed the air stream away from the rat sampling tube operated. This resulted in combining the odorant vapor with the main air stream and the diversion of that stream to an exhaust path. The diversion valve relaxed 1 s later, and the odor stimulus was presented to the odor sampling port. The stimulus valves relaxed 2.5 s later, thus terminating delivery of the odor. Delivery of reinforcement was contingent on the rat keeping its snout in the odor sampling port and licking on the water delivery tube in seven or more of the 10 last 0.2 s periods of the 2.5 s odor presentation period. Trials in which the rat did not keep its snout in the odor sampling port for at least 0.1 s after odor onset were aborted and counted as short sample trials. Completing the criterion response requirement produced a 0.04 ml water reward. All rats were given two to three such sessions before being trained on the odor detection and discrimination tasks described below.
Ethyl acetate detection.
On completion of initial training, rats were trained on a detection task in which 5% ethyl acetate served as the positive stimulus (S+) and the mineral oil solvent served as the negative stimulus (S−). On each trial, either the S+ or S− stimulus was presented. Making a criterion response on S+ trials was reinforced with 0.04 ml of water and scored as a hit, whereas failing to make a criterion response was scored as a miss. Making a criterion response on S− trials was scored as a false alarm, and failing to make a criterion response was scored as a correct rejection. S+ and S− trials were presented in a modified random order such that there were an equal number of each in each block of 20 trials and that one type of trial was not presented more than three times consecutively. The trial procedures were identical to those in initial training: the first snout insertion after a 5 s ITI initiated the trial. The rat was required to keep its snout in the odor sampling port through the final valve period and for at least 0.1 s after presentation of the stimulus. If the rat did not complete this requirement, the trial was aborted and scored as a short-sample trial, and that trial type was presented on the next trial. Percentage correct responding was determined for each block of 20 trials [(hits + correct rejections/20) × 100]. All rats were trained to a criterion of 85% correct responding in a block of 20 trials and then given 200 additional overtraining trials on this ethyl acetate detection task.
Enantiomer discrimination.
Next, rats were trained using enantiomer odors. Each rat was trained to discriminate between a series of (+)-carvone and (−)-carvone concentrations and then between a series of (+)-terpinen-4-ol and (−)-terpinen-4-ol concentrations. The (+)-enantiomer served as the S+ stimulus and the (−)-enantiomer served as the S− stimulus for 15 rats. The assignment of the S+ and S− stimuli were reversed for the remaining 14 rats. All rats were given a minimum of 60 trials on each of the tasks described below. If the rat did not achieve the criterion accuracy score of 85% correct responding in a block of 20 trials within these 60 trials, training was continued in 200 trial sessions until the criterion was achieved or for a maximum of 400 trials. A 10% concentration of each enantiomer was used in the first discrimination task. In each subsequent task, the same procedures were followed but the odorant concentration was reduced sequentially in separate sessions to 5, 1, 0.5, 0.1, 0.05, 0.01, 0.005, and 0.001%.
Postoperative behavior tests
Beginning 21 d after surgery, rats were retested on the 5% ethyl acetate detection task. They were then retested on the carvone and then on the terpinen-4-ol discrimination tasks as described above, except that each discrimination task was preceded by a detection task in which the concentration of the S+ stimulus to be used in the discrimination task served as the S+ stimulus and the mineral oil solvent served as the S− stimulus. Thus, for example, a rat that had been trained with (+)-carvone as the S+ stimulus was first tested with 10% (+)-carvone as S+ and mineral oil as S−, then tested with 10% (+)-carvone as S+ and 10% (−)-carvone as S−, then tested on detection of the next lower concentration of (+)-carvone, then to discriminate that concentration of the carvone enantiomers, etc.
Each rat was trained on each task until it failed to achieve criterion performance in two sequential concentration tests or achieved criterion on the lowest concentration used for that task. If an animal failed to reach criterion in two sequential concentrations of a task, it was not tested on lower concentrations and was assigned an error score of 200 (50% correct responding) for any remaining tests of that psychophysical series. Errors to criterion, percentage of group that failed to achieve criterion at each step of a psychophysical series, and detection and discrimination thresholds served as the dependent variables for the behavior tests. Threshold was defined as the last concentration at which criterion performance was achieved. If the rat achieved criterion performance on the lowest test concentration, that value was used to define threshold.
Surgical and histological methods
Rats were operated on 6–8 d after completing their preoperative training. Aseptic surgical procedures were used. Each rat was anesthetized with 80 mg/kg ketamine and 5 mg/kg xylazine and clamped into the head holder of a stereotaxic instrument. The scalp was incised, and the dorsal surfaces of both olfactory bulbs were exposed through the nasal bones. The left olfactory bulb was removed in each rat by aspiration through a fine glass pipette with the aid of a surgical microscope. In 23 rats, aspiration lesions were aimed at the dorsal and dorsolateral aspects of the remaining olfactory bulb. In some rats, an attempt was also made to remove a region of the posterior medial bulb that has been identified as responsive to (+)-carvone (Linster et al., 2001). The remaining olfactory bulb was left intact in six rats (controls). Scalp incisions were closed with metal wound clips, and rats were maintained in a warm room until they recovered their righting reflex. Wound clips were removed 10–12 d later.
As described in Results, two of the experimental rats proved to have very small lesions located outside of the enantiomer bulbar areas for carvone and terpinen-4-ol and, because their behavior scores on all tasks were essentially identical to those of controls, were included in the control group. A third experimental rat had virtually the entire right olfactory bulb removed and was excluded from the data analysis.
After completing the postoperative tasks, each rat was deeply anesthetized and killed by cardiac perfusion with saline and phosphate-buffered 10% paraformaldehyde. The brains were removed and stored in a solution of 10% paraformaldehyde and 25% sucrose for several weeks. After a 1-h-long rinse in tap water, the brains were embedded in a solution of 12% gelatin in 25% sucrose in a 50°C oven for several hours and then refrigerated, blocked, and fixed in 10% Formalin for 48 h. Because the brains were embedded in gelatin and there was extensive damage to the dorsal surface of the olfactory bulbs in experimental rats, we defined the angle of section as one parallel to a frontal transection of the forebrain at the level of the optic chiasm. This transection was made at a right angle to the dorsal surface of the cortex. The resulting plane of section through the olfactory bulbs approximated that described in the stereotaxic atlas of the rat olfactory bulb by Slotnick and Hersch (1980). The olfactory bulbs were sectioned on a freezing microtome at 60 μm, and every other section was saved, mounted on glass slides, and stained with thionin. Each section was drawn using a projection microscope and examined microscopically to identify the remaining mitral cell layer in the drawings.
The approximate position of the focal areas for terpinen-4-ol and carvone as described by Linster et al. (2001, 2002) were indicated on these section drawings. To do this, we used the two-dimensional charts provided in the Michael Leon laboratory web site (http://leonlab.bio.uci.edu) and the illustrations in the reports by Linster et al. to plot the approximate positions of glomerular foci in response to each enantiomer of carvone and of terpinen-4-ol. There were some uncertainties in plotting these sites on our drawings because the plane of section for the Slotnick and Hersch atlas and that used by Linster et al. are somewhat different. Also, the two-dimensional charts used by Linster et al. to illustrate 2-DG-defined glomerular fields were based on a rolled out map representation of the bulb, and points in that chart were not defined metrically. Thus, it was not possible to locate precisely on the Slotnick and Hersch atlas the position of the glomerular fields that were activated by carvone and terpinen-4-ol enantiomers. However, by comparing the relative positions of these fields from landmarks within the olfactory bulb as illustrated in their charts and frontal sections [Linster et al. (2001), their Figs. 2, 3] and illustrations on the Leon laboratory web site, it was possible to represent the approximate position on frontal sections of the Slotnick and Hersch atlas of each of the glomerular areas (those having Z scores of 1.5 or higher) identified in the reports. A set of nine approximately equally spaced frontal sections from the atlas was used to generate a standard set of drawings for illustrating bulbar lesions. The frontal level of each of these sections was based on the measurements made on the right olfactory bulb of five rats that were approximately the same age and weight as the experimental rats. For these five cases, the mean distance between the most anterior aspect of the accessory olfactory bulb (AOB) and the most anterior section that contained a complete mitral cell layer was 3.7 ± 0.41 mm (mean ± SD), and the mean distance between that AOB level and the most posterior section that contained glomeruli was 1.2 ± 0.20 mm (mean ± SD).
Because Linster et al. (2001) found no statistically significant differences or only small differences in the position of foci for the two terpinen-4-ol enantiomers, only a single symbol was used to identify terpinen-4-ol foci. For carvone, some bulbar areas responded only or predominately to the (+) enantiomer and some only or predominately to the (−) enantiomer. The approximate positions of these foci was indicated using + and − symbols, respectively. Other glomerular areas responded to both carvone enantiomers, and these areas were illustrated using both + and − symbols. Figure 1 shows the resulting set of standard sections used to plot bulbar lesions and approximate positions of the glomerular areas that responded to the terpinen-4-ol and carvone enantiomers.
Figure 1.
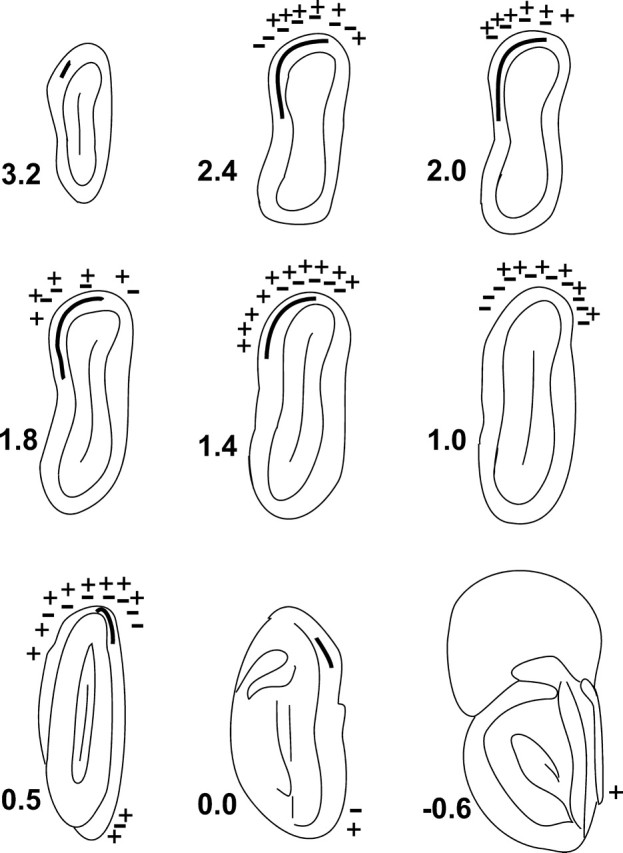
A set of nine approximately equally spaced drawings of frontal sections of the rat olfactory bulb showing the approximate positions of glomerular foci for enantiomers of carvone (+ and − symbols) and terpinen-4-ol (thick curved line). The loci were transposed from the rolled-out map plots of Linster et al. (2001) to drawings made from the atlas of Slotnick and Hersch (1980) of the olfactory system (see Materials and Methods). Medial is to the right on each figure. Numbers to the left of each section denote distance in millimeters from the rostral edge of the accessory olfactory bulb.
Each histological section from each experimental rat was assigned a frontal level based on its distance from the rostral aspect of the accessory olfactory bulb or, in cases in which the AOB was missing, from the last section containing identifiable glomeruli. The locus and extent of the bulbar lesions for each rat was then represented on the standard set of sections. This was accomplished by selecting one or two sections from the experimental rat that most closely approximated each level illustrated in the standard set of sections and, using local anatomical landmarks, shading in the bulbar areas that had been removed by the lesion.
Data analysis
To measure lesion size, we first determined the cumulative perimeter of the glomerular layer and of the mitral cell layer for the nine sections shown in Figure 1. We then made the same measurements on each set of drawings for each experimental rat and calculated the lesion size both as a percentage of “volume” lost and percentage of mitral cell layer lost. These measurements were obtained by tracing the circumference of the glomerular layer and mitral cell layer with a digitizing pad and accumulating these measures using the Canvas7 software program (Deneba Systems, Miami, FL).
For preoperative performance on the carvone and terpinen-4-ol discrimination tasks, acquisition functions and thresholds of subgroups that had the positive enantiomer as the S+ stimulus did not differ from those that had the negative enantiomer as the S+ stimulus for either terpinen-4-ol or carvone (t tests). Likewise, the postoperative acquisition and thresholds of control rats trained with the (+) enantiomer of each odorant did not differ from those trained using the (−) enantiomer as S+. Thus, for data analyses, we combined subgroups within each enantiomer for each odorant.
As described in Results, the 20 experimental rats were divided into three groups based on lesion size. We used one-way ANOVA to evaluate errors to criterion on the initial postoperative ethyl acetate detection task, on the carvone and terpinen-4-ol stimuli used on dilution step two [a 40-fold air dilution from the headspace of the 5% mineral oil diluted odorant, a concentration similar to that used for carvone in the study by Rubin and Katz (2001)], and on dilution step 8 and to evaluate mean thresholds for detection and discrimination for the carvone and terpinen-4-ol tasks. Tukey’s honestly significant difference post hoc tests were used to evaluate differences between each experimental group and the control group. Thirteen one-way ANOVA tests were performed, and, thus, the adopted α level of 0.05 was adjusted to 0.004 using Bonferroni’s correction. However, all p values ≤0.01 are reported.
Experiment 2
Experiment 2 used independent groups of normal rats to assess discrimination between the enantiomers of carvone and terpinen-4-ol. This study was undertaken because of the failure to counterbalance the presentation of tests on carvone and terpinen-4-ol enantiomers in experiment 1 and to provide an additional and independent test of whether differences in patterns of bulbar activation revealed in the 2-DG maps of Linster et al. (2001, 2002) predict discrimination difficulty.
Subjects
Ten male 90-d-old Long–Evans rats (Charles River Laboratories), housed as described in experiment 1, were maintained on a water restriction schedule of 8–10 ml of water per day.
Procedures
Rats were initially trained to detect 5% ethyl acetate as described above and then were arbitrarily assigned to a carvone (n = 5) or a terpinen-4-ol (n = 5) condition. In successive sessions, each group was then trained to detect 10, 5, and 1% concentrations of the (+) enantiomer and to discriminate between 10, 5, 1, 0.1, 0.05, 0.01, 0.005, 0.001, and 0.0005% concentrations of the + and − enantiomers of its assigned odorant using the training procedures and criteria described in experiment 1. For discrimination, the (+) enantiomer served as the positive stimulus and the (−) enantiomer served as the negative stimulus.
Results
Experiment 1
Preoperative performance
Mean errors to criterion for all 29 rats on the carvone and the terpinen-4-ol discrimination tasks as a function of odorant concentration are shown in Figure 2A. The insets in this figure show the percentage of rats failing to reach criterion and the SD of error scores on each concentration of each enantiomer discrimination task.
Figure 2.
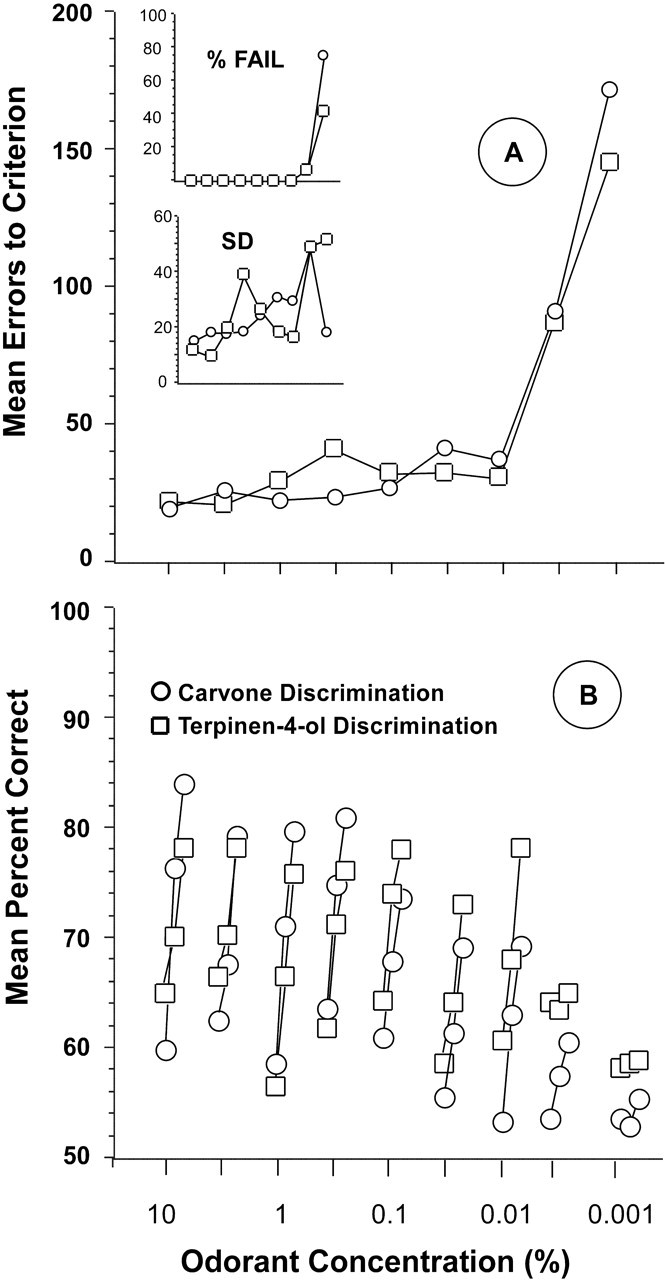
A, Preoperative mean errors to criterion performance of 85% correct responding in blocks of 20 trials for 29 rats in discriminating between sequentially lower concentrations of carvone enantiomers and terpinen-4-ol enantiomers. Top inset, Percentage of group that failed to reach criterion at each concentration. Bottom inset, SD of error scores at each concentration. B, Mean percentage correct responding in the first three 20-trial blocks on each enantiomer discrimination task at each concentration.
Mean performance accuracy on the carvone and terpinen-4-ol discrimination tasks at each test concentration were essentially identical, although rats made, on average, slightly more errors on the lowest concentration of carvone than on terpinen-4-ol, and more rats (73%) failed to achieve criterion performance on the lowest concentration of carvone than on the corresponding concentration of terpinen-4-ol (43%). Variability in performance tended to increase with decreasing odorant concentrations, but there was no consistent difference in SD of error scores between the carvone and terpinen-4-ol tasks (Fig. 2A, inset). The difference between thresholds for the carvone discrimination (0.005%) and the terpinen-4-ol discrimination (0.003%) was not significant (t test). Finally, performance on the carvone tasks was not predictive of performance on the terpinen-4-ol tasks: product moment correlations between total errors across all concentrations and between threshold values for each discrimination were −0.09 and 0.15, respectively.
Because in the study of Linster et al. (2002) differences in learning to discriminate between enantiomers of carvone and terpinen-4-ol were found in the initial acquisition phase but not in later trials, we examined the performance of rats in this study in the first three 20-trial blocks for each concentration of each compound. As shown in Figure 2B, there were no consistent differences in the acquisition phase between the carvone and terpinen-4-ol discrimination tasks.
Anatomical results
In each rat, the left olfactory bulb had been completely removed, and the lesions in that hemisphere extended into the anterior olfactory nucleus and, in most cases, invaded the first 1–2 mm of the frontal pole cortex. Of the eight control rats, the remaining olfactory bulb was intact in six rats. The other two control rats had small lesions of the anterior medial aspect of the remaining bulb, a bulbar area that is outside the region of activation for both carvone and terpinen-4-ol enantiomers as defined by Linster et al. (2001).
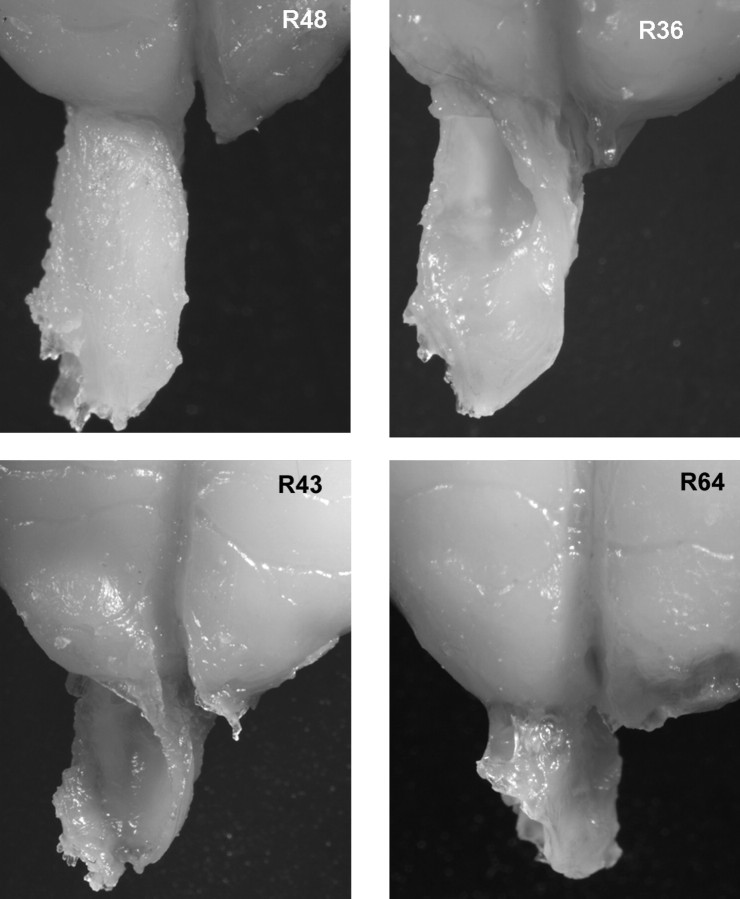
Of the 21 experimental rats, there were only small fragments of the right olfactory bulb in one rat (R41). This rat had only chance performance on each of the postoperative tasks, and its scores were not used in the statistical analyses of postoperative scores presented below. The mean lesion size for the remaining 20 experimental rats, as indexed by percentage of bulbar volume and mitral cell layer removed, was 58% (range, 18–88%; SD, 21%) and 55% (range, 14–84%; SD, 25%), respectively. The correlation between these two measures was 0.88, but the mitral cell measure was better related to behavior scores and was used in the analyses presented below. Experimental rats were divided into three groups (small, n = 6; medium, n = 7; and large, n = 7) on the basis of lesion size (percentage of mitral cell layer removed). Mean lesion size for groups small, medium, and large were 23% (range, 14–37%), 57.1% (range, 45–68%), and 80.3% (range, 73–84%), respectively. Figure 3 illustrates the intact olfactory bulb of a control rat and lesioned olfactory bulbs in three experimental rats.
Figure 3.
Photographs of the rostral forebrain showing the intact right olfactory bulb of a control rat (R48) and lesions in the right olfactory bulbs of three experimental rats. The entire dorsal half of the bulb is removed in R36. The dorsal and lateral aspects of the bulb were removed in R43, and the rostral two-thirds and most of the dorsal surface of the bulb were removed in R64. The left olfactory bulb was completely removed in each case.
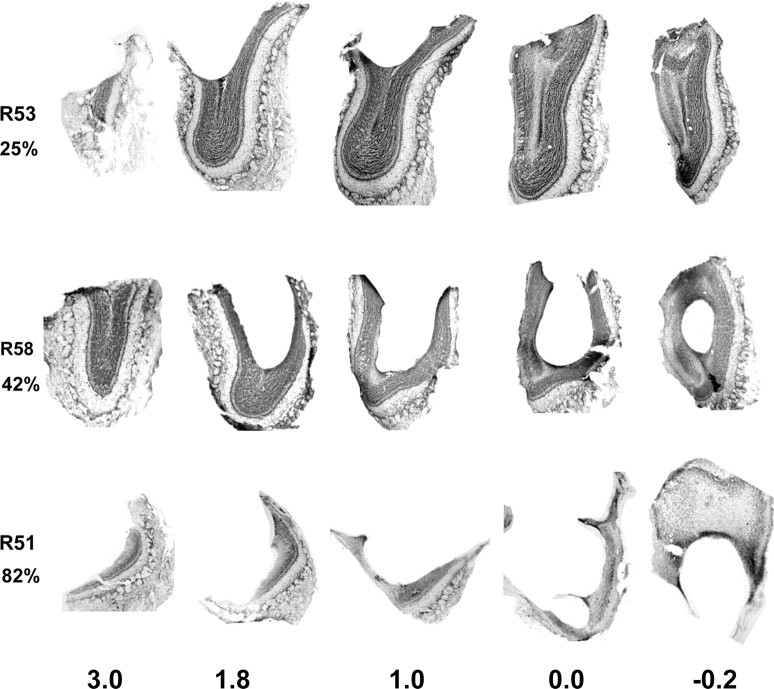
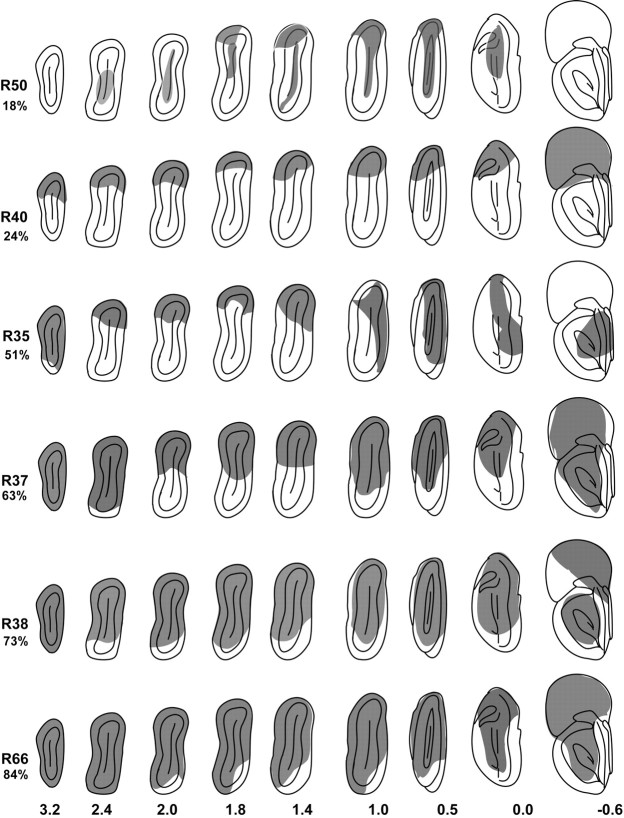
The right olfactory bulb lesions in all experimental rats removed most or all of the dorsal, dorsolateral, and dorsomedial regions identified as responsive to carvone and terpinen-4-ol odorants. The most posterior ventromedial region containing an area that is particularly responsive to (−)-carvone (Linster et al., 2001) was spared in all but one rat in group large (R34). Selected photographs of frontal sections through the right olfactory bulb representative of those with small, medium, and large lesions are shown in Figure 4. Diagrammatic representations of lesions relative to the position of foci for carvone and terpinen-4-ol enantiomers (Linster et al., 2001) for six other experimental rats are shown in Figure 5.
Figure 4.
Photomicrographs illustrating five frontal levels through the right olfactory bulb of three experimental rats. Numbers on the bottom are millimeters from the rostral aspect of the accessory olfactory bulb. The animal number and the percentage of the mitral cell layer removed are given on the left. The relatively superficial lesion of the dorsal bulb in R53 is characteristic of rats in the small lesion group. Lesions in R58 from the medium lesion group are deeper and destroy more of the mitral cell layer. The large lesions in rat R51 are representative of those in the large lesion group (see Results). Dorsal is to the top, and medial is to the right in each section.
Figure 5.
Diagrammatic representations of frontal sections of the olfactory bulb for six experimental rats showing the areas removed by the lesion (shaded regions). The percentage of the mitral cell layer removed is given under the rat identification numbers on the left. Numbers on the bottom are millimeters from the rostral aspect of the accessory olfactory bulb. Dorsal is to the top, and medial is to the right in each section drawing.
Among experimental rats, lesions varied from removal limited primarily to the dorsal aspect of the olfactory bulb (e.g., Fig. 4, R53; Fig. 5, R40) to extensive destruction of all but the ventral and posterior medial wall of the bulb (e.g., Fig. 4, R51; Fig. 5, R38 and R66).
Postoperative performance of controls
Controls with one intact olfactory bulb and those with small medial bulbar lesions in their remaining olfactory bulb had nearly identical mean error scores on each of the postoperative carvone and terpinen-4-ol tasks, and these two subgroups were combined into a single control group of eight rats. Controls made somewhat fewer errors on the discrimination tasks postoperatively, and their improvement on the lowest concentration was substantial for both the carvone (p < 0.007) and terpinen-4-ol (p < 0.004) discrimination tasks (t tests).
Postoperative performance of experimental rats
The mean number of errors to criterion on the postoperative ethyl acetate detection task for all rats was 3.5 (range, 1–26), and differences among groups were not significant.
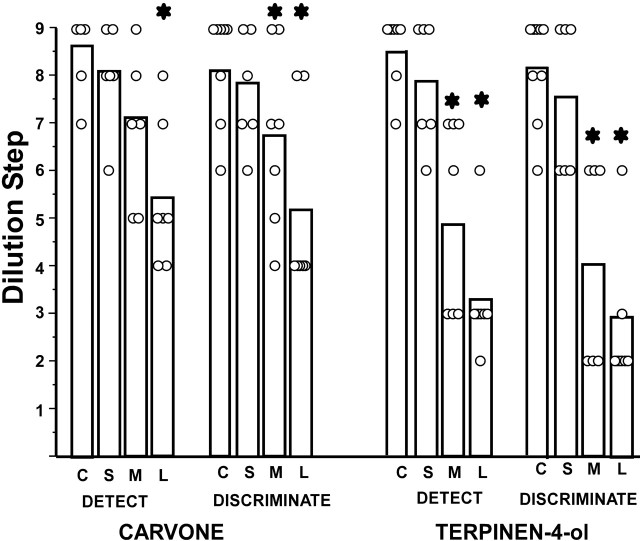
On average, experimental rats performed progressively more poorly than controls as concentration of the enantiomer odorants decreased, and those with large lesions performed more poorly than those with small lesions (Fig. 6). An effect of lesion size is also reflected by a monotonic increase in mean threshold on each of the carvone and terpinen-4-ol tasks with increasing lesion size (Fig. 7). Across all experimental rats, the mean product moment correlation between percentage of mitral cell removed and threshold over each of the detection and discrimination tasks was −0.66 (p < 0.01).
Figure 6.
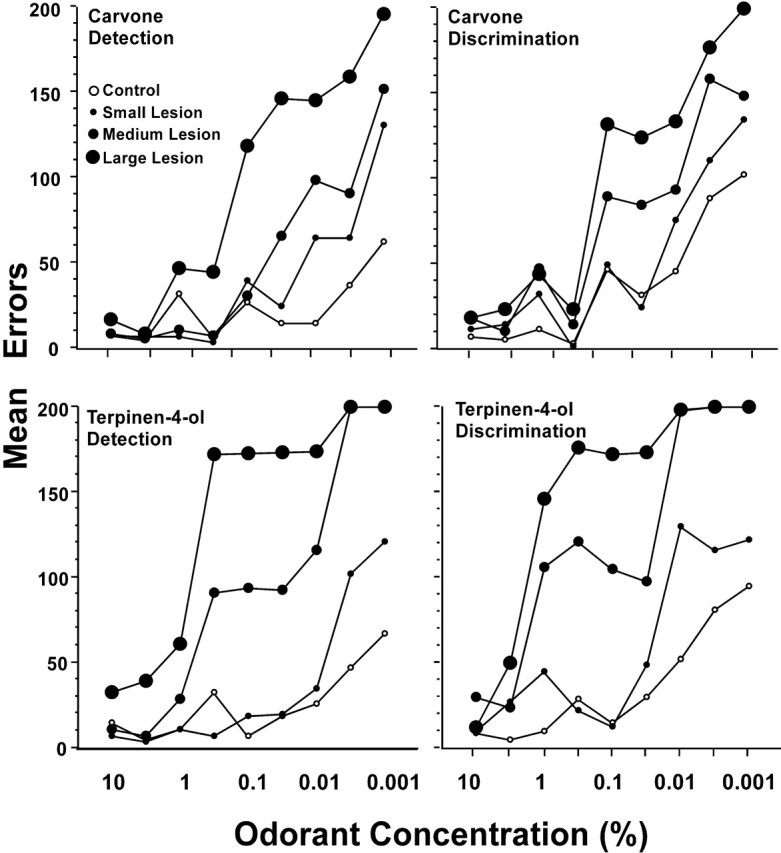
Postoperative errors to criterion for control rats and for the small, medium, and large lesion experimental subgroups at each concentration of the detection and discrimination tasks for carvone (top graphs) and terpinen-4-ol (bottom graphs).
Figure 7.
Mean threshold (vertical bars) and data for individual rats on the carvone and terpinen-4-ol detection and discrimination tasks. Asterisks denote a significant difference from control scores. C, Controls; S, small lesion group; M, medium lesion group; L, large lesion group.
Differences in mean threshold among groups (Fig. 7) were significant or approached significance for the carvone detection (F = 8.2; p < 0.001) and discrimination (F = 5.2; p < 0.006) tasks and the terpinen-4-ol detection (F = 7.7; p < 0.001) and discrimination (F = 16.3; p < 0.001) tasks. For each task, thresholds of the large lesion group were significantly higher than those of controls, and, on all but the carvone detection task, thresholds of the medium lesioned groups were significantly higher than those of controls (Tukey’s tests). Thresholds for the small lesion group did not differ from controls in any of these comparisons.
In general, threshold scores of rats in groups large and medium were higher on the terpinen-4-ol than the carvone tasks. Group large had significantly higher thresholds for terpinen-4-ol on both the detection (p < 0.04) and discrimination (p < 0.02) tasks. Differences on these tasks for group medium were smaller and not significant (within-group t tests).
Despite the poorer performance of experimental rats in the large and medium groups at low concentrations, most performed as well as controls at high concentrations of carvone and terpinen-4-ol (Fig. 6). Four of the seven rats in the medium lesion group achieved criterion performance at a concentration of or lower than 0.05% (concentration step 6) on all four tasks, and, at higher odorant concentrations, the error scores of these rats were similar to those of controls. Rats in the large lesion group performed more poorly, but each reached criterion on at least the first four carvone detection and discrimination tasks and each of the seven rats in this group reached criterion on at least the first two or three steps of the terpinen-4-ol detection and discrimination tasks. Differences in errors to criterion among groups on the second concentration step were not significant on any of the tasks. Additional analyses revealed that failure on a discrimination task could be accounted for primarily by a loss in ability to detect the odorant. Thus, for each rat, the lowest concentration step that could be discriminated was equal to or was one concentration step higher than detection threshold. Indeed, as shown in Figure 8, error scores on discrimination tasks, although generally higher, closely paralleled those for detection tasks in each group. Across all experimental rats, product moment correlations between the last concentration step on which criterion performance was achieved for detection and discrimination on carvone and terpinen-4-ol tasks were 0.94 and 0.97, respectively (p < 0.001 each case). Thus, in almost all cases, if a rat was able to detect an enantiomer of an odorant, it was able to discriminate between the enantiomers of that odorant at that concentration (but not at a lower concentration) or at one step higher than that concentration.
Figure 8.
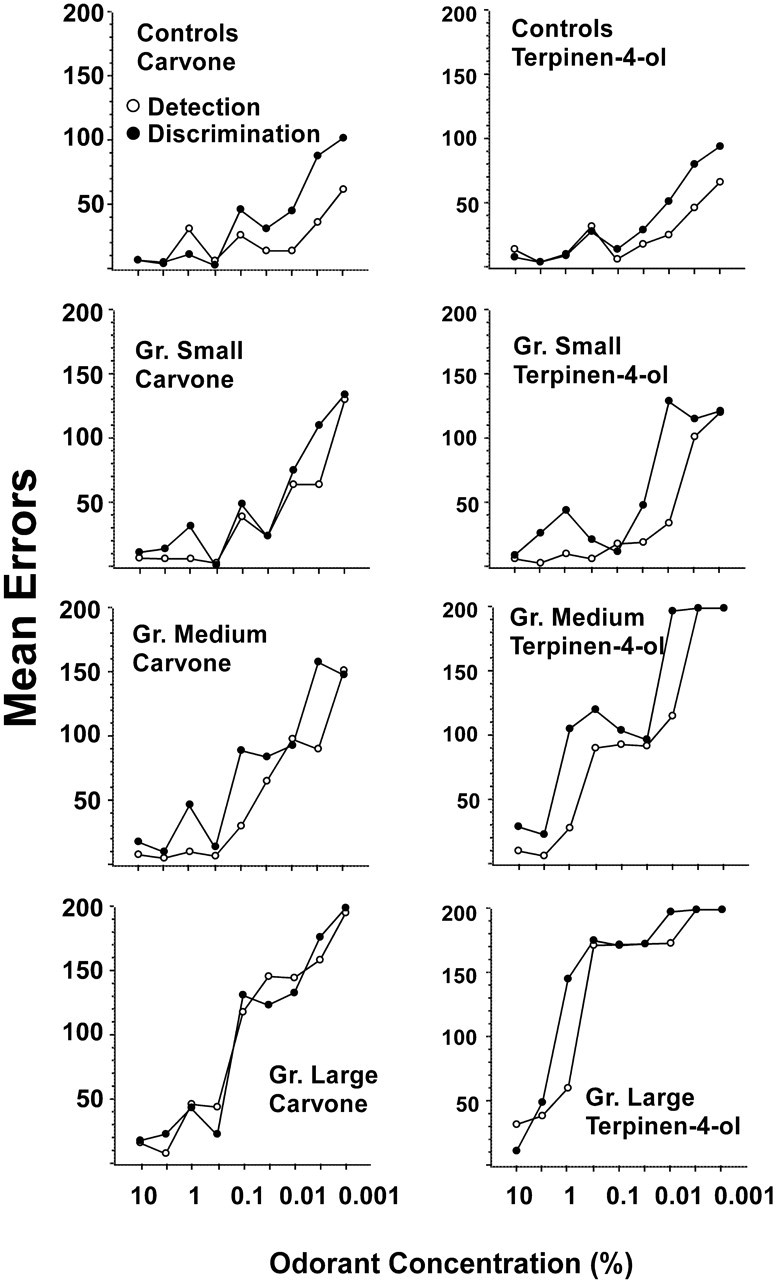
Comparison of error scores on the carvone and terpinen-4-ol detection and discrimination tasks for controls and each of the lesion groups. Note that the detection and discrimination functions within each group on each task are similar.
Performance as a function of remaining identified enantiomer sites
More carvone- and terpinen-4-ol-identified glomerular regions were removed in rats with large lesions than in those with small lesions, and, hence, the extent to which these enantiomer foci were removed is confounded with lesion size. Because the focal areas for carvone enantiomers are more widely distributed across the olfactory bulb, in most cases, lesions destroyed more of the terpinen-4-ol sites than the carvone sites. In particular, the most posterior ventromedial focal area for (−)-carvone was not invaded in most experimental rats (Fig. 5). However, examination of individual cases did not reveal any obvious relationship between the extent to which carvone and terpinen-4-ol bulbar sites were removed and the performance on the odorant tasks. Thus, two rats with large lesions performed better on the terpinen-4-ol than on the carvone tasks, although one (R38) had virtually all of the terpinen-4-ol focal areas removed but had sparing of the posterior ventral carvone foci. The other rat (R37) had approximately equal amounts of carvone and terpinen-4-ol areas spared. Three other rats (R40, R53, and R58) performed more poorly on the terpinen-4-ol tasks than on the carvone tasks despite the fact that lesions in these rats spared more of the terpinen-4-ol areas than carvone areas.
Experiment 2
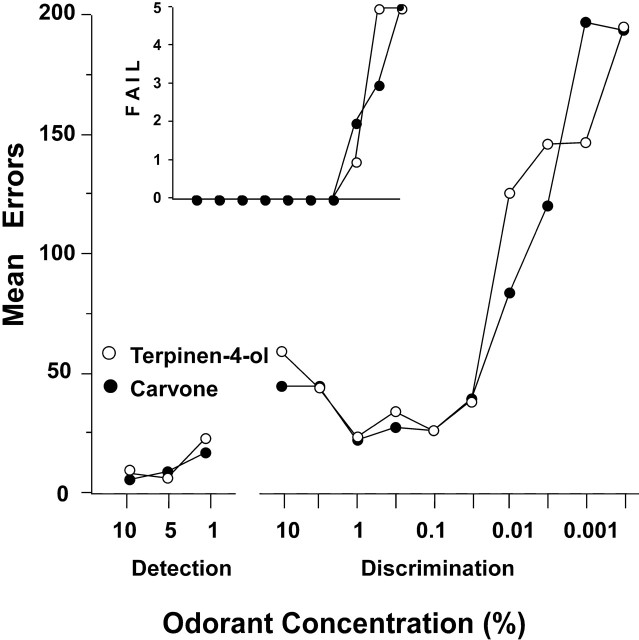
Figure 9 shows mean errors to criterion for the carvone and terpinen-4-ol groups in this study. The inset shows the number of rats that failed to reach criterion at each concentration step. In the first enantiomer detection task, the carvone group made slightly but not significantly fewer errors than the terpinen-4-ol group. Group differences in discrimination were largest on the 0.01 and 0.001% concentration steps. Differences on the 0.01% problem were not significant, but the terpinen-4-ol group made significantly fewer errors than the carvone group on the 0.001% task (p < 0.04, t tests).
Figure 9.
Detection of (+)-carvone and (+)-terpinen-4-ol and discrimination of their enantiomers for rats in experiment 2 (independent group study). Inset shows the number of rats failing on each discrimination task.
Discussion
The present study address two predictions based on maps showing the pattern of olfactory bulb activation in response to different odors: that the discriminability of two odors is related to the difference in spatial patterns produced by such odors and that the pattern of bulbar activation provides the neural basis for identifying the odorant. Our evidence fails to support either of these predictions. Although enantiomers of terpinen-4-ol produce more similar patterns of bulbar activation than those of carvone (Linster et al., 2001), the initial acquisition, psychophysical functions, and discrimination thresholds of normal rats in both experiments were equivalent in discriminating between the enantiomers of these odorants. Linster et al. (2002) reported that, in initial trials, rats made more errors discriminating terpinen-4-ol enantiomers than carvone enantiomers. This small difference in initial performance may have been masked in experiment 1 because rats were first trained on carvone discrimination tasks and, hence, were more practiced when tested on terpinen-4-ol. However, there are reasons to doubt that this training order masked a potential difference in ability to discriminate between the enantiomers of these compounds. First, all rats had received extensive training on the ethyl acetate detection task before being trained on enantiomers. Second, previous training on the carvone problems conferred no obvious advantage in performance on the initial discrimination tasks (Fig. 2A) or in initial trials on the terpinen-4-ol tasks (Fig. 2B). Third, even after extensive training on both enantiomer discrimination series before surgery (experiment 1), control rats continued to perform as well as or somewhat better on the terpinen-4-ol problems after surgery, and there were no differences in performance at near-threshold concentrations. Finally, the results of experiment 2 demonstrate that, using independent groups, enantiomers of terpinen-4-ol were no more difficult to discriminate than were the enantiomers of carvone.
The extent to which discrimination of enantiomers is dependent on patterns of bulbar activation was assessed in rats with bulbar lesions. The smallest lesions destroyed the majority of the identified bulbar sites for these enantiomers and certainly produced a major disruption in the identified pattern of inputs. Despite this, the performance of rats in group small did not differ significantly from that of controls in any comparison, although, as might be expected, they made somewhat but not significantly more errors than controls in the lowest odor concentration tasks. Thus, lesions that produced a severe disruption in patterns of inputs for these odorants had neither a marked nor a differential effect on the ability of rats to detect these odors or discriminate between them.
Rats with more extensive lesions performed more poorly, and deficits in odor detection and discrimination tasks were graded approximately in proportion to the amount of bulbar tissue removed. Obviously, larger lesions destroyed more bulbar tissue including more of the carvone and terpinen-4-ol identified sites and, thus, lesion size and the extent to which lesions destroyed carvone and terpinen-4-ol bulbar areas are confounded. However, it is noteworthy that most rats with extensive bulbar lesions were able to detect and discriminate carvone and terpinen-4-ol enantiomers at odorant concentrations that were at least an order of magnitude lower than that used in a previous mapping study to identify bulbar sites responsive to carvone enantiomers (Rubin and Katz, 2001). Equally relevant was the finding that the deficits in odor discrimination in these rats was secondary to or could be accounted for by a decrease in odor sensitivity: if rats were able to detect an enantiomer, they were generally able to discriminate between the enantiomers of that odorant. Thus, the major effect of large lesions and the consequent massive disruption of patterns of bulbar inputs were on odor sensitivity, not on ability to discriminate between odors.
One outcome of the present study is in accord with predictions based on the mapping study of Linster et al. (2001): rats in the medium and large lesion groups had more of the terpinen-4-ol-identified than the carvone-identified areas removed and performed more poorly on terpinen-4-ol problems. However, in rats with small- to moderate-sized lesions, there was no obvious relationship between the extent to which terpinen-4-ol areas were removed and deficits in terpinen-4-ol tasks. In some cases, rats with medium lesions had no more of their identified bulbar sites removed than did rats with small lesions, yet performed more poorly. Thus, bulbar areas other than those identified in the 2-DG studies by Linster et al. (2001, 2002) probably participate in detection and discrimination of these odorants.
In general, the present results are in agreement with our previous studies showing that surgical disruption of identified patterns of bulbar inputs are primarily without effect in a variety of behavior tests, including those for odor quality (Lu and Slotnick, 1994; Slotnick and Bodyak, 2002; Bisulco and Slotnick, 2003), sensitivity (Slotnick et al., 1997), and two-odor and odor mixture discrimination tasks (Slotnick et al., 1989; Lu and Slotnick, 1998; Bisulco and Slotnick, 2003). One explanation for these outcomes is that extensive training may have altered patterns of bulbar activation. Salcedo et al. (2005) tested this directly by comparing bulbar c-Fos expression to ethyl acetate in naive mice and those that received intensive olfactometric training to detect ethyl acetate. Fos expression was more intense in trained mice, but the spatial pattern of activation was quite similar for both groups. Thus, odor training may enhance bulbar responsiveness, but there is no evidence that it creates a different map or a new pattern of inputs.
Another explanation, addressed specifically in this report, is that the physical qualities of odorants used in previous studies differ along several dimensions (e.g., molecular structure, vapor pressure, partial pressure in solvents, and solubility in olfactory mucosa). Although only a subset of these factors may contribute to maps generated in imaging studies, rats may have used different cues or different combinations of cues in solving these tasks. However, enantiomers differ from one another in only one physical property, and we assume that only the difference in the chiral properties of the molecules can be responsible for both their different patterns of bulbar activation and the ability to discriminate between them. If, as shown here, these patterns do not predict discrimination difficulty in normal rats and the major effect of a massive disruption of the patterns is a reduction in odor sensitivity rather than discrimination between suprathreshold concentrations, it seems clear that these spatial patterns are not the determinant or certainly not the sole determinant of how odors are coded in the behaving animal.
A more likely explanation for the failure of bulbar lesion studies to support predictions based on intrinsic optical imaging and 2-DG is that those methods yield a static representation of activity averaged over many seconds or minutes. However, trained rodents need only very brief samples to detect and discriminate odors (Slotnick and Bodyak, 2002; Slotnick and Schellinck, 2002). Recent studies demonstrate that rats (Uchida and Mainen, 2003) and mice (Abraham et al., 2004) can make even fine odor discriminations after a single 200–300 ms sniff of the stimulus. Thus, it is the bulbar activation and potential changes in temporal and spatial events that occur within the first few hundred milliseconds of stimulus sampling that allows the animal to identify the stimulus. Furthermore, rats can alter their modes of sniffing as a function of concentration and discrimination difficulty (Youngentob et al., 1987), and odor stimulation in both awake and anesthetized animals can produce dynamic temporal and spatial changes across the epithelium and olfactory bulb that vary with odorant, flow parameters, respiratory cycle, and duration of odor exposure (Youngentob et al., 1987; Cinelli and Kauer, 1995; Cinelli et al., 1995; Kent et al., 1996; Scott-Johnson et al., 2000; Wachowiak and Cohen, 2001; Spors and Grinvald, 2002; Lehmkuhle et al., 2003, 2006). Spors et al. (2006) have shown that the spatial pattern of glomerular activation changes within and across a respiration cycle and that the initial pattern and strength of glomerular responses are not predictive of that seen a few hundred milliseconds later. In short, it seems unlikely that maps based on activity averaged over relatively long periods would reflect the spatial and temporal dynamics involved in the brief odor samples made by attentive rats trained to respond correctly in detection and discrimination tasks.
These considerations together with the repeated failure of lesion studies to reveal functional correlates for odor maps used to document chemotopic organization in the olfactory bulb support the contention that such maps probably do not reflect the temporal and spatial dynamics of odor sampling in the alert behaving animal. Other methods, including the use of voltage-sensitive dyes (Cinelli and Kauer, 1995; Spors et al., 2006), unit recording from multiple-electrode arrays (Lehmkuhle et al., 2003), functional magnetic resonance imaging (Kida et al., 2002; Pautler and Koretsky, 2002), or probes that selectively label presynaptic terminals (Bozza et al., 2004), may provide greater insight to the neural events that must code for odor detection and discrimination during the brief odor samples made by the behaving animal.
Footnotes
This work was supported in part by National Institutes of Health Grant DC04671 (B.S.).
References
- Abraham NM, Spors H, Carleton A, Margie TW, Kuner T, Schaefer AT. Maintaining accuracy at the expense of speed: Stimulus similarity defines odor discrimination time in mice. Neuron. 2004;44:865–876. doi: 10.1016/j.neuron.2004.11.017. [DOI] [PubMed] [Google Scholar]
- Bisulco S, Slotnick B. Olfactory discrimination of short-chain fatty acids in rats with large bilateral lesions of the olfactory bulbs. Chem Senses. 2003;28:361–370. doi: 10.1093/chemse/28.5.361. [DOI] [PubMed] [Google Scholar]
- Bodyak N, Slotnick B. Performance of mice in an automated olfactometer: odor detection, discrimination and odor memory. Chem Senses. 1999;6:637–639. doi: 10.1093/chemse/24.6.637. [DOI] [PubMed] [Google Scholar]
- Bozza TC, Mombaerts P. Olfactory coding: revealing intrinsic representations of odors. Curr Biol. 2001;11:R687–R690. doi: 10.1016/s0960-9822(01)00409-2. [DOI] [PubMed] [Google Scholar]
- Bozza T, McGann JP, Mombaerts P, Wachowiak M. In vivo imaging of neuronal activity targeted expression of a genetically encoded probe in the mouse. Neuron. 2004;42:9–21. doi: 10.1016/s0896-6273(04)00144-8. [DOI] [PubMed] [Google Scholar]
- Cinelli AR, Kauer JS. Salamander olfactory bulb neuronal activity observed by video rate, voltage-sensitive dye imaging. II. Spatial and temporal properties of responses evoked by odorant stimulation. J Neurophysiol. 1995;73:2033–2052. doi: 10.1152/jn.1995.73.5.2033. [DOI] [PubMed] [Google Scholar]
- Cinelli AR, Hamilton KA, Kauer JS. Salamander olfactory bulb neuronal activity observed by video rate, voltage-sensitive dye imaging. III. Spatial and temporal properties of responses evoked by odorant stimulation. J Neurophysiol. 1995;73:2053–2071. doi: 10.1152/jn.1995.73.5.2053. [DOI] [PubMed] [Google Scholar]
- Cometto-Muniz JE, Cain WS, Abraham MH. Quantification of chemical vapors in chemosensory research. Chem Senses. 2003;28:467–477. doi: 10.1093/chemse/28.6.467. [DOI] [PubMed] [Google Scholar]
- Hudson R, Distel H. Regional autonomy in the peripheral processing of odor signals in newborn rabbits. Brain Res. 1987;421:85–94. doi: 10.1016/0006-8993(87)91278-9. [DOI] [PubMed] [Google Scholar]
- Igarashi KM, Mori K. Spatial representation of hydrocarbon odorants in the ventrolateral zones of the rat olfactory bulb. J Neurophysiol. 2005;93:1007–1019. doi: 10.1152/jn.00873.2004. [DOI] [PubMed] [Google Scholar]
- Kent PF, Mozell MM, Murphy SJ, Hornung DE. The interaction of imposed and inherent olfactory mucosal activity patterns and their composite representation in a mammalian species using voltage-sensitive dyes. J Neurosci. 1996;16:345–353. doi: 10.1523/JNEUROSCI.16-01-00345.1996. [DOI] [PMC free article] [PubMed] [Google Scholar]
- Kida I, Xu F, Shulman RG, Hyder F. Mapping at glomerular resolution: fMRI of rat olfactory bulb. Magn Reson Med. 2002;48:570–576. doi: 10.1002/mrm.10248. [DOI] [PubMed] [Google Scholar]
- Lehmkuhle MJ, Normann RA, Maynard EM. High-resolution analysis of the spatio-temporal activity patterns in rat olfactory bulb evoked by enantiomer odors. Chem Senses. 2003;28:499–508. doi: 10.1093/chemse/28.6.499. [DOI] [PubMed] [Google Scholar]
- Lehmkuhle MJ, Normann RA, Maynard EM. Trial-by-trial discrimination of three enantiomer pairs by neural ensembles in mammalian olfactory bulb. J Neurophysiol. 2006;95:1369–1379. doi: 10.1152/jn.01334.2004. [DOI] [PubMed] [Google Scholar]
- Leon M, Johnson BA. Olfactory coding in the mammalian olfactory bulb. Brain Res Rev. 2003;42:23–32. doi: 10.1016/s0165-0173(03)00142-5. [DOI] [PubMed] [Google Scholar]
- Linster C, Johnson BA, Yue E, Morse A, Xu Z, Hingco EE, Choi Y, Choi M, Messiha A, Leon M. Perceptual correlates of neural representations evoked by odorant enantiomers. J Neurosci. 2001;21:9837–9843. doi: 10.1523/JNEUROSCI.21-24-09837.2001. [DOI] [PMC free article] [PubMed] [Google Scholar]
- Linster C, Johnson BA, Morse A, Yue E, Leon M. Spontaneous versus reinforced olfactory discriminations. J Neurosci. 2002;22:6842–6845. doi: 10.1523/JNEUROSCI.22-16-06842.2002. [DOI] [PMC free article] [PubMed] [Google Scholar]
- Lu XC, Slotnick B. Recognition of propionic acid vapor after removal of the olfactory bulb area associated with high 2-DG uptake. Brain Res. 1994;639:26–32. doi: 10.1016/0006-8993(94)91760-4. [DOI] [PubMed] [Google Scholar]
- Lu XM, Slotnick B. Olfaction in rats with extensive lesions of the olfactory bulbs: implications for odor coding. Neuroscience. 1998;84:849–866. doi: 10.1016/s0306-4522(97)00520-4. [DOI] [PubMed] [Google Scholar]
- Meister M, Bonhoeffer T. Tuning and topography in an odor map on the rat olfactory bulb. J Neurosci. 21:1351–1360. doi: 10.1523/JNEUROSCI.21-04-01351.2001. [DOI] [PMC free article] [PubMed] [Google Scholar]
- Pautler RG, Koretsky AP. Tracing odor-induced activation in the olfactory bulbs of mice using manganese-enhanced magnetic resonance imaging. NeuroImage. 2002;16:441–448. doi: 10.1006/nimg.2002.1075. [DOI] [PubMed] [Google Scholar]
- Rubin BD, Katz LC. Optical imaging of odorant representations in the mammalian olfactory bulb. Neuron. 1999;23:499–511. doi: 10.1016/s0896-6273(00)80803-x. [DOI] [PubMed] [Google Scholar]
- Rubin BD, Katz LC. Spatial coding of enantiomers in the rat olfactory bulb. Nat Neurosci. 2001;4:355–356. doi: 10.1038/85997. [DOI] [PubMed] [Google Scholar]
- Salcedo E, Zhang C, Kronberg E, Restrepo D. Analysis of training-induced changes in ethyl acetate odor maps using a new computational tool to map the glomerular layer of the olfactory bulb. Chem Senses. 2005;30:615–626. doi: 10.1093/chemse/bji055. [DOI] [PubMed] [Google Scholar]
- Scott-Johnson PE, Blakley D, Scott JW. Effects of air flow on rat electroolfactogram. Chem Senses. 2000;25:761–768. doi: 10.1093/chemse/25.6.761. [DOI] [PubMed] [Google Scholar]
- Slotnick B, Bodyak N. Odor discrimination and odor quality perception in rats with disruption of connections between the olfactory epithelium and olfactory bulbs. J Neurosci. 2002;22:4205–4216. doi: 10.1523/JNEUROSCI.22-10-04205.2002. [DOI] [PMC free article] [PubMed] [Google Scholar]
- Slotnick B, Hersch S. A stereotaxic atlas of the rat olfactory system. Brain Res Bull. 1980;5:1–55. [Google Scholar]
- Slotnick B, Schellinck H. Methods in olfactory research with rodents. In: Simon SA, Nicolelis M, editors. Frontiers and methods in chemosenses. Boca Raton, FL: CRC; 2002. pp. 21–61. [Google Scholar]
- Slotnick B, Panhuber H, Bell GA, Laing DL. Odor-induced 2-DG activity in the olfactory bulb of rats trained to detect propionic acid vapor. Brain Res. 1989;500:161–168. doi: 10.1016/0006-8993(89)90310-7. [DOI] [PubMed] [Google Scholar]
- Slotnick B, Bell GA, Panhuber H, Laing DG. Detection and discrimination of propionic acid after removal of its 2-DG identified major focus in the olfactory bulb: a psychophysical analysis. Brain Res. 1997;762:89–96. doi: 10.1016/s0006-8993(97)00357-0. [DOI] [PubMed] [Google Scholar]
- Spors H, Grinvald A. Spatio-temporal dynamics of odor representations in the mammalian olfactory bulb. Neuron. 2002;34:301–315. doi: 10.1016/s0896-6273(02)00644-x. [DOI] [PubMed] [Google Scholar]
- Spors H, Wachowiak M, Cohen LB, Friedrich RW. Temporal dynamics and latency patterns of receptor neuron input to the olfactory bulb. J Neurosci. 2006;26:1247–1259. doi: 10.1523/JNEUROSCI.3100-05.2006. [DOI] [PMC free article] [PubMed] [Google Scholar]
- Uchida N, Mainen ZF. Speed and accuracy of olfactory discrimination in the rat. Nat Neurosci. 2003;6:1224–1229. doi: 10.1038/nn1142. [DOI] [PubMed] [Google Scholar]
- Uchida N, Takahashi YK, Tanifuji M, Mori K. Odor maps in the mammalian olfactory bulb: domain organization and odorant structural features. Nat Neurosci. 2000;3:1035–1043. doi: 10.1038/79857. [DOI] [PubMed] [Google Scholar]
- Wachowiak M, Cohen LB. Representation of odorants by receptor neuron input to the mouse olfactory bulb. Neuron. 2001;32:723–735. doi: 10.1016/s0896-6273(01)00506-2. [DOI] [PubMed] [Google Scholar]
- Xu F, Greer CA, Shepherd GM. Odor maps in the olfactory bulb. J Comp Neurol. 2000;422:489–495. doi: 10.1002/1096-9861(20000710)422:4<489::aid-cne1>3.0.co;2-#. [DOI] [PubMed] [Google Scholar]
- Youngentob SL, Mozell MM, Sheehe PR, Hornung DE. A quantitative analysis of sniffing strategies in rats performing odor detection tasks. Physiol Behav. 1987;41:59–69. doi: 10.1016/0031-9384(87)90131-4. [DOI] [PubMed] [Google Scholar]
- Youngentob SL, Schwob JE, Sheehe PR, Youngentob LM. Odorant threshold following methyl bromide-induced lesions of the olfactory epithelium. Physiol Behav. 1997;62:1241–1252. doi: 10.1016/s0031-9384(97)00301-6. [DOI] [PubMed] [Google Scholar]


