

Abstract
Although it is widely accepted that exogenous and voluntary factors jointly determine the locus of attention, the rules governing the integration of these factors are poorly understood. We investigated neural responses in the lateral intraparietal area (LIP) to transient, distracting visual perturbations presented during task performance. Monkeys performed a covert search task in which they discriminated the orientation of a target embedded among distractors, and brief visual perturbations were presented at various moments and locations during task performance. LIP neurons responded to perturbations consisting of the appearance of new objects, as well as to abrupt changes in the color, luminance, or position of existing objects. The LIP response correlated with the bottom-up behavioral effects of different perturbation types. In addition, neurons showed two types of top-down modulations. One modulation was a context-specific multiplicative gain that affected perturbation, target, and distractor activity in a spatially nonspecific manner. Gain was higher in blocks of trials in which perturbations directly marked target location than in blocks in which they invariably appeared opposite the target, thus encoding a behavioral context defined by the statistical contingency between target and perturbation location. A second modulation reflected local competitive interactions with search-related activity, resulting in the converse effect: weaker perturbation-evoked responses if perturbations appeared at the location of the target than if they appeared opposite the target. Thus, LIP encodes an abstract dimension of salience, which is shaped by local and global top-down mechanisms. These interacting mechanisms regulate responsiveness to external input as a function of behavioral context and momentary task demands.
Keywords: attention, exogenous, endogenous, parietal, context, competitive interactions
Introduction
Theoretical accounts postulate that attention is controlled as an interaction between “bottom-up” (stimulus-driven) and “top-down” (voluntary or cognitive) factors (Egeth and Yantis, 1997). Bottom-up control refers to the ability of a physically conspicuous object to attract attention automatically regardless of its task relevance. Top-down control refers to the ability of subjects to allocate attention according to a large class of behavioral influences, including spatial or temporal anticipation, statistical contingencies, or motor planning (Egeth and Yantis, 1997). In natural behavior, attentional weight is typically determined jointly by bottom-up and top-down influences (Folk et al., 1992; Chastain and Cheal, 2001; Lamy et al., 2004; Serences et al., 2005).
Neurophysiological studies show that information about physical conspicuity emerges as early as primary visual cortex and converges with top-down influences in several higher-order areas related to attention (Itti and Koch, 2001). In humans, these areas include a dorsal frontoparietal network and a more ventral network comprising the temporoparietal junction and the ventral prefrontal cortex (Corbetta and Shulman, 2002; Serences et al., 2005). Similarly, in the monkey, single-neuron recordings suggest that top-down and bottom-up influences converge in a dorsal sensorimotor network implicated in attention (Goldberg et al., 2002). This network is thought to construct topographic “salience representations” of the environment, which encode attentional priority based on both stimulus- and task-related factors (Kusunoki et al., 2000; Itti and Koch, 2001; Navalpakkam and Itti, 2005; Thompson and Bichot, 2005).
One cortical area suggested to act as a salience representation is the lateral intraparietal area (LIP) (Gottlieb et al., 1998; Bisley and Goldberg, 2003). LIP neurons are visually responsive and have retinotopic receptive fields (RFs) but respond little to stable, task-irrelevant objects in complex environments (Gottlieb et al., 1998). Neurons respond selectively to suddenly appearing objects even if these are not task relevant and also respond to inconspicuous stable objects if these objects become relevant to the ongoing task (Gottlieb et al., 1998, 2005; Bisley and Goldberg, 2003). Responses to abrupt onset objects are rapid and transient, whereas those to voluntary target selection arise more slowly and are longer lasting, consistent with the different time course of automatic and voluntary orienting (Bisley and Goldberg, 2003; Gottlieb et al., 2005).
Although the convergence of bottom-up and top-down inputs in LIP is well established, many open questions remain. For instance, it is not known whether LIP neurons respond specifically to abruptly appearing objects, which may constitute a special class of attentional attractors (Egeth and Yantis, 1997), or whether they register a wider range of salient stimuli. Second, the top-down factors modulating exogenous input in LIP remain unclear. Previous work has shown that LIP responses can be either enhanced or suppressed by attention (Robinson et al., 1995; Colby et al., 1996; Powell and Goldberg, 2000), but the circumstances governing these opposite modulations are not known. To explore these questions, we examined responses of LIP neurons to transient visual perturbations presented at different moments and locations during a visual search task. We found that neurons responded to perturbations with different physical characteristics, consistent with the idea that they provide a generalized representation of salience. Perturbation responses were shaped by two top-down mechanisms: global gain settings reflecting behavioral context, which were not specific for a particular object or location, and spatially specific competitive interactions with task-related activity. These modulations could either enhance or suppress perturbation responses, resulting in dynamic and flexible adjustments as a function of behavioral context and momentary task engagement.
Materials and Methods
Experiments used standard behavioral and neurophysiological techniques, using the Tempo software (Reflective Computing, St. Louis, MO) for behavioral control and stimulus presentation, the Eye Tracking System (Applied Sciences Laboratory, Bedford, MA) for eye position recording, the APM digital processing module (Frederick Haer Company, Bowdoinham, ME) for neural signal recording, and Matlab (MathWorks, Natick, MA) for data analysis. All methods were approved by the Animal Care and Use Committees of Columbia University and New York State Psychiatric Institute as complying with the guidelines within the Public Health Service Guide for the Care and Use of Laboratory Animals.
Behavioral paradigm.
During experimental sessions, monkeys sat in a primate chair with their head fixed 57 cm in front of a television monitor (CTX MS3400V; 62.5 × 46.5 cm viewing area). For the covert visual search task, a circular display of 12 figure-8 placeholders was constantly present during the intertrial interval and changed on each trial to reveal the search display (see Fig. 1a). We used this mode of presentation to avoid abrupt visual onsets that are known powerfully to capture attention as well as LIP activity (Gottlieb et al., 1998, 2005). To begin each trial, monkeys achieved fixation of a central point and grabbed hold of two response bars, which were positioned at waist level and were outside of the monkeys’ view during central fixation. For each neuron, the placeholder array was rotated and its radius was scaled so that, during central fixation, one placeholder fell in the center of the RF. After a period of stationary fixation and bar grasp of 800 or 1200 ms, a fraction of two segments were removed from each placeholder. The segments to be removed were selected randomly for each placeholder, with the constraint that, on each trial, one placeholder turned into the search target (a letter “E”) and the others were unique distractors. The target could appear in one of two neighborhoods centered inside and opposite the RF (see below) and could be either right or left facing. Without shifting gaze from the center, monkeys had to report target orientation by releasing the right bar for a right-facing E and the left bar for a left-facing E (two-alternative forced choice). Trials were terminated without reward if the eye exited a square window of 1.5° around the fixation point at any time before 50 ms after bar release. A correct bar release within 100–1000 ms of target presentation was rewarded with a drop of water, after which the placeholder array was restored by redisplaying the missing segments.
Figure 1.
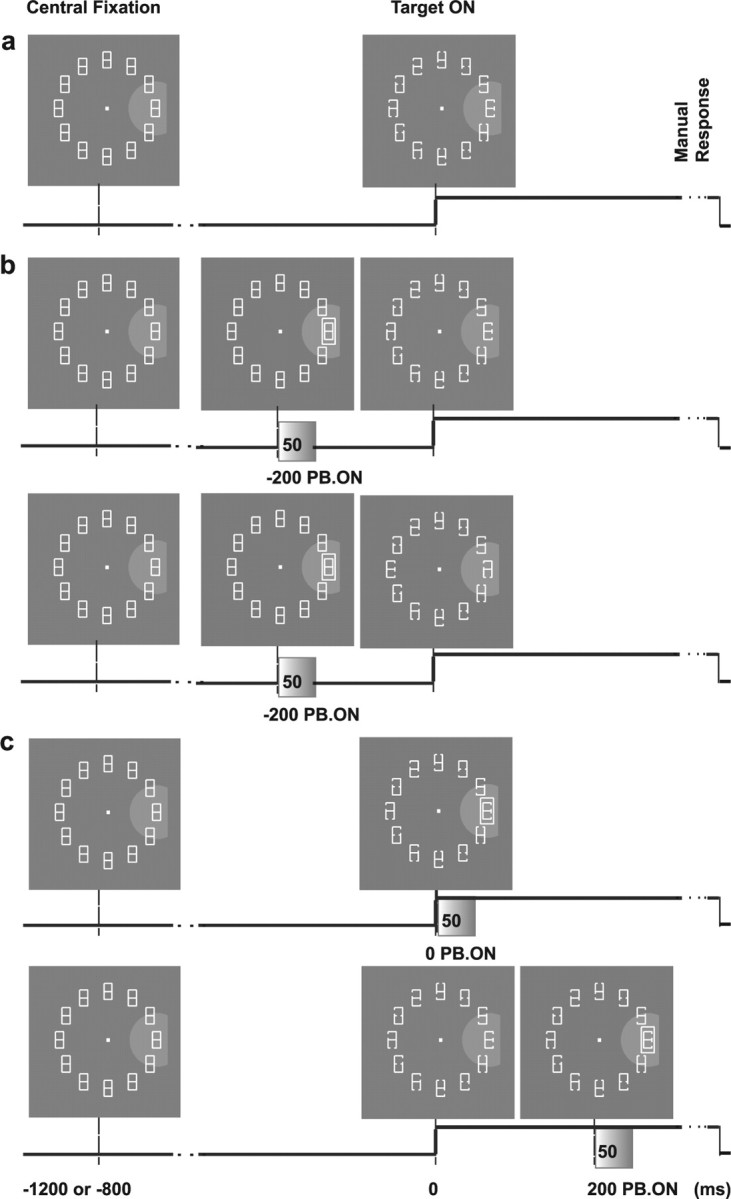
Behavioral task. a, Visual search without perturbation (25% of trials). The placeholder display is constantly on in the intertrial interval. To begin each trial, the monkey must fixate the central dot for a variable interval (1200 or 800 ms). In so doing, the monkey brings the RF of the neuron (gray semicircle) onto one of the display elements. The target display is revealed at time 0 (Target ON) by partial removal of two line segments, and the monkey must indicate the orientation of the E-shaped target by releasing one response bar (Manual Response). b, Perturbation trials for the SAME context (top row) and the OPPOSITE context (bottom row) when the perturbation (FRAME) appears 200 ms before the target (PB. ON; PTOA of −200 ms) in RF. The perturbation is always presented for 50 ms and then turned off. c, Trials in which the perturbation (FRAME) appeared at 0 ms (top row) and 200 ms (bottom row) PTOA in RF for the SAME context. In all trials, the placeholder display is restored 300 ms after the manual response.
To examine the effect of exogenous input, we presented, on 75% of trials, a transient visual perturbation consisting of a 50 ms change in one of the display elements. Perturbations were presented in two behavioral contexts run in separate trial blocks: in the SAME context, the perturbation always appeared at the target location, and in the OPPOSITE context, the perturbation always appeared opposite the target. Within each block, the appearance (type), timing, and location of the perturbation were randomly intermixed. The appearance of the perturbation was selected from a subset of five possible types: (1) increase in luminance of 0.90 cd/m2 (INT+); (2) decrease in luminance of 0.90 cd/m2 (INT−); (3) color change at constant luminance (1.15 cd/m2) from white to green (COLOR); (4) back-and-forth 0.5° radial movement (MOVE); and (5) appearance of a frame surrounding one placeholder (FRAME), which was approximately two times bigger than the surrounded pattern and kept the global luminance constant (1.15 cd/m2). The timing of the perturbation could be 200 ms before target presentation, simultaneous with target presentation, or 200 ms after target presentation [perturbation–target onset asynchronies (PTOA) of −200, 0, and 200 ms]. The location of the perturbation was either inside or opposite the RF, depending on behavioral context and target location (see also below). All combinations of perturbation type, timing, and location were randomly interleaved and balanced within a block.
For each neuron, the target and perturbation could appear in two equal and opposite “neighborhoods,” each consisting of one, two, or three adjacent placeholders. One neighborhood was centered on the RF and always contained the RF center (the location eliciting the strongest responses on the memory–saccade task). The second neighborhood contained the diametrically opposite locations. Of the neurons described here, 49% were tested with neighborhoods of one element (two possible perturbation–target locations) and 16 and 35% with neighborhoods of two or three elements (four or six possible locations). For the latter neurons, all locations in the RF neighborhood elicited responses comparable with those in the RF center on the memory–saccade task. Neighborhood size was constant throughout the testing of a given neuron, and each individual location was equally likely to contain the target and perturbation. Whereas in the SAME configuration the perturbation and target appeared at the exact same location, in the OPPOSITE configuration, the exact locations of the perturbation and target were chosen independently within the appropriate (opposite) neighborhoods. Thus, in the OPPOSITE context, the perturbation was precisely opposite the target if neighborhood size was one element, but specified target location only within a range of two or three placeholders if neighborhood size was two or three elements. We initially adopted the neighborhood design to maintain the task challenging enough to observe attentional effects. However, most likely because of extensive practice, in the data presented here, neighborhood size did not significantly affect performance. Average percentage correct for neighborhoods of one, two, and three locations was 80.3, 79.7, and 79.1% in the SAME context and 81, 79, and 77% in the OPPOSITE context (no-perturbation trials). The average reaction times (RTs) were 469, 475, and 479 ms in the SAME context and 465, 470, and 473 ms in the OPPOSITE context (all p values >0.05, Kruskal–Wallis ANOVA).
Blocks of the SAME and OPPOSITE context were presented in random order, and each neuron included in this report was tested in at least one block in each context. On average, two types of perturbations (range, one to three) were randomly interleaved within a block, with 8–12 correct trials collected for each condition. If the neuron was held long enough, additional pairs of SAME/OPPOSITE blocks were run, selecting a different set of perturbations for each repetition. Average block length was 300 correct trials (range, 160–480). For example, a block testing two perturbation types with 10 repetitions each included 240 correct perturbation trials (10 repetitions × 2 perturbation types × 2 neighborhoods × 2 target orientations × 3 PTOA), as well as 80 trials (25% of total) on which no perturbation was presented.
The luminance of visual stimuli was calibrated with a photometer and was as follows: 1.61 cd/m2 for placeholder, 1.15 cd/m2 for target or distractor, 2.05 cd/m2 for fixation point, and 0.01 cd/m2 for background. Display refresh rate was 60 Hz, and the precise timing of all display events was verified with a diode detecting the beginning of vertical refresh. Reaction times and neural response latencies (see below) were measured according to the diode-defined time. Placeholders, target, and distractors were colored white, and their size was linearly scaled with eccentricity, to have width of E/10 and height of 2 × E/10, where E is the eccentricity in degree of visual angle.
Neural recording.
Electrode tracks were directed to the lateral bank of the intraparietal sulcus as verified with structural magnetic resonance imaging before the start of recordings. On isolation, each neuron was first characterized with the memory–saccade task. On this task, the monkey was first required to fixate a central fixation point. A 100 ms target (round annulus, ∼2° in diameter) was then flashed at a randomly selected location, and, after a delay period of 800–1000 ms, the monkey was rewarded for making a saccade to the remembered location of the target. The location of the RF center was first estimated by hand, and responses on the memory–saccade task were tested at each of the 12 placeholder locations used in the search task to determine whether that location was inside or outside the receptive field. Neurons were tested further if they had significant spatially tuned responses in a visual (50–250 ms after target onset), delay (400–900 ms after target onset), and presaccadic epoch (200 ms before saccade onset) of the memory–saccade task (Kruskal–Wallis ANOVA, p < 0.05). RF eccentricity ranged from 5 to 20° (14.1 ± 3.2°, average ± SD) and was contralateral to recording hemisphere in 87.3% (69 of 79) of neurons. The location of the neurons on the lateral bank on the intraparietal sulcus along with the presence and properties of spatially tuned activity on the memory–saccade task unambiguously identify our neurons as belonging to LIP (Barash et al., 1991).
Data analysis: behavior.
Behavioral performance was scored as a two-alternative forced-choice task, including only trials in which the monkey released one or the other bar within the proscribed latency limits (100–1000 ms after target presentation). Trials in which monkeys made errors by breaking fixation, by prematurely releasing a bar, or by failing to release a bar within the latency limits were excluded from the analysis. These constituted 12.67% of total trials in the SAME context and 13.39% in the OPPOSITE context (p > 0.1 for effect of context). Approximately half of the excluded trials had breaks of fixation (5.28% of total in the SAME condition and 5.70% in the OPPOSITE condition; p > 0.1 across conditions), which, in >90% of cases occurred before, and were therefore unrelated to, the perturbation or target. The remaining errors consisted of early or late bar release, and their prevalence also did not vary according to context, the presence or absence of a perturbation, or the timing, location, or type of perturbation. Catch trials (33% of total in both SAME and OPPOSITE blocks) were included in 35 recording sessions as additional verification of task performance. On these trials, all placeholders turned into distractors and monkeys were rewarded for holding the bars for 1000 ms after display change. The fraction of false alarms on catch trials (bar release with either hand) was 15%.
Data analysis: neurons.
Neuronal firing rates were measured on correct trials from the raw spike count, in the time epochs noted in the text, and compared using nonparametric statistics (Wilcoxon’s test or Kruskal–Wallis ANOVA). Average response histograms (used for display only) are constructed by averaging and smoothing raw spike trains using a Gaussian kernel (SD of 10 ms). To construct population histograms, an average response was calculated for each neuron and the individual traces were averaged across the population.
Neural response latencies were calculated for each neuron and for each perturbation at PTOA −200 ms using previously described methods (Maunsell and Gibson, 1992; Bisley et al., 2004). Briefly, we first constructed a frequency histogram of the number of spikes measured in 1 ms bins spanning the 200 ms before perturbation onset and fit it with a Poisson distribution. We then calculated a cutoff from the Poisson fit, as the number of spikes below which the spike count would be expected to fall 99% of the time (p < 0.01). Response latency was defined as the time from stimulus onset to the time of the first three consecutive poststimulus bins, each of which contained a number of spikes that was greater than or equal to the cutoff. Comparisons of activity on perturbation and no-perturbation trials when perturbations were opposite the RF showed no significant differences for any context and PTOA. For example, at 0 ms PTOA in the SAME context, median firing rates were 21.0 spikes per second (sp/s) on perturbation trials when both target and perturbation were opposite the RF, and 21.4 sp/s on no-perturbation trials when only the target was opposite the RF (50–250 ms after target onset; p > 0.1). Similarly, in the OPPOSITE context, median firing rates were 30.5 sp/s on perturbation trials when the perturbation as well as a distractor were opposite the RF and 29.3 sp/s on no-perturbation trials when only a distractor was opposite the RF (p > 0.1). Thus, the presence of a perturbation opposite the RF did not affect responses to either a distractor or the target within the RF. For the analysis of contextual effects, responses were pooled across all blocks of a given context (SAME or OPPOSITE) that were tested for each neuron. A total of 55, 21, and 24% of neurons were tested with one, two, or three pairs of SAME and OPPOSITE blocks. We obtained equivalent results when we repeated the analysis using only the first pair in the sequence, showing that contextual differences were not a function of repeated testing. To evaluate the possibility of firing rate saturation, we compared peak firing rates during the visual epoch of the memory–saccade task (50–250 ms after target presentation) with peak firing rates in the interval of 50–250 ms after perturbation onset. We first found the time of maximal firing during this interval and then calculated the average firing rate in a 100 ms interval symmetric around the maximum.
Results
Behavioral task
Two monkeys performed a covert discrimination task in which they reported the orientation of a target embedded in a distractor array using a nontargeting hand movement. On each trial, a stable placeholder display (Fig. 1a, left) changed to reveal a search display containing one target and 11 distractors (middle). Without breaking central fixation, monkeys reported target orientation (right or left facing) by releasing hold of, respectively, the right or left bar. The display was arranged so that one placeholder fell into the center of the RF of the neuron. To examine neural responses to extraneous visual input, we introduced, on 75% of trials, a transient visual perturbation: a 50 ms change in one of the display elements (Fig. 1b,c). Although the location of the perturbation was unpredictable (either inside or opposite the RF), its relationship with target location was fixed within trial blocks: in SAME-context blocks, the perturbation always appeared at the target location, whereas in OPPOSITE-context blocks, the perturbation and target were always opposite each other. Thus, a context (consisting of ∼300 trials) was defined by the spatial relationship between perturbation and target rather than by a specific stimulus location. Within each context, we randomly varied the physical appearance and the timing of the perturbation (which could be 200 ms before, simultaneously with, or 200 ms after the search array; PTOA of −200, 0, or 200 ms). Figure 1b illustrates trials in which one perturbation type (a frame surrounding a display element) appeared in the RF at −200 ms PTOA in the SAME and OPPOSITE contexts. Figure 1c illustrates trials in which the perturbation appeared in the RF in the SAME context at 0 and 200 ms PTOA.
Behavioral performance
Results were similar for the two monkeys, and the analysis is presented for the pooled data. Table 1 gives median RT and accuracy on perturbation and no-perturbation trials for each context and PTOA, and Figure 2a summarizes the average percentage change in RT on perturbation relative to no-perturbation trials.
Table 1.
Behavioral results
| Trial type Context | Reaction time ± SD (ms) |
Percentage correct ± SD (%) |
||
|---|---|---|---|---|
| SAME | OPPOSITE | SAME | OPPOSITE | |
| No perturbation | 473 ± 60a | 466 ± 53a | 92.0 ± 8.0a | 90.6 ± 8.2a |
| PTOA of −200 ms | 435 ± 59** | 467 ± 61 | 90.9 ± 8.7 | 89.2 ± 9.5* |
| PTOA of 0 ms | 484 ± 69** | 485 ± 61** | 90.9 ± 9.0 | 91.2 ± 8.5 |
| PTOA of 200 ms | 492 ± 73** | 481 ± 72** | 94.1 ± 7.3* | 91.4 ± 8.0 |
Population medians and SDs of reaction time and percentage correct for different trial types and both contexts (SAME, OPPOSITE). Wilcoxon’s test,
*p < 0.05, perturbation trials versus no perturbation trials;
**p < 10−10, perturbation trials versus no perturbation trials.
aNo significant difference between no-perturbation trials in SAME versus OPPOSITE.
Figure 2.

Average change in RT and search-related activity in no-perturbation trials. a, Average and SE of percentage change in RT in trials with (RTPB) relative to those without perturbations (RTNOPB) [(RTPB − RTNOPB)/RTNOPB], where RT is the average reaction time in each condition for each context and PTOA. *p < 0.01 relative to 0 (t test). b, Population neuronal responses on no-perturbation trials in the SAME condition (average and SE) when either the target or a distractor were in the RF.
When they appeared simultaneously with or after the search display (0 and 200 ms PTOA), perturbations significantly lengthened reaction times relative to no-perturbation trials, suggesting that they distracted from task performance (Fig. 2a; Table 1). Accuracy was essentially unaffected except for slight improvement in the SAME context at 200 ms PTOA (Table 1). The presence of significant interference in the OPPOSITE context (when the perturbation was far from the target) argues that this interference was attentional and not simply attributable to visual masking. Thus, in two of three trial types, perturbations had predominantly distracting effects on task performance.
When perturbations appeared before the target display (−200 ms PTOA), their behavioral effects were strongly context dependent. In the SAME context, perturbations produced a large decrease in RT relative to no-perturbation trials (38 ms, 7.35%) with no change in accuracy (Table 1), suggesting that monkeys used them as cues to target location. In contrast, in the OPPOSITE context, perturbations produced no change in RT and only slight decline in accuracy (Table 1). One possibility is that, in this context, monkeys suppressed most of the exogenous pull of the perturbation. Alternatively, it is possible that monkeys used the perturbation as a cue even in the OPPOSITE context, attending first toward and then opposite from it, to the expected target location. To address this possibility, we compared the behavioral effects of the OPPOSITE perturbation in sessions using only two possible target–perturbation locations (neighborhood size 1), in which the perturbation was always precisely 180° opposite the target, and in sessions using four or six possible locations (neighborhood size 2 or 3), in which the perturbation specified target location with lesser precision, within a range of two or three placeholders (see Materials and Methods). The percentage change in RT relative to no-perturbation trials was not significantly affected by neighborhood size, being 0.91, 0.37, and −0.14% for neighborhoods of one, two, and three placeholders (p > 0.05 for effect of neighborhood). This suggests that monkeys did not use the perturbation as a cue in the OPPOSITE context, because this strategy should yield greater facilitation at smaller neighborhood size when the perturbation was more informative about target. As expected, the fractional change in RT was unaffected by neighborhood size in the SAME condition (−5.75, −6.58, and −7.41%; p > 0.05) because, in this context, the perturbation precisely marked target location regardless of neighborhood size. These data, together with the neural effects described below, suggest that monkeys suppressed most of the exogenous pull of the perturbation in the OPPOSITE context (see also Discussion).
Neural responses
We report neural activity in 79 LIP neurons recorded in two hemispheres of each monkey (41 in monkey 1, 38 in monkey 2). Consistent with the idea that LIP participates in voluntary, covert attentional selection, neurons reliably encoded the location of the search target (Fig. 2b). Once the search display was presented, neural activity increased strongly if the target was in the RF but remained weaker if the target was opposite the RF and a distractor appeared in the RF, thus tracking the location of the task-relevant target.
Our focus in this report is on the responses evoked by the perturbations during the search task. Consistent with previous findings (Powell and Goldberg, 2000; Bisley and Goldberg, 2003), we found that, when perturbations appeared opposite the RF, they produced no significant change in neural responses in any context or PTOA (see Materials and Methods). Therefore, the following analysis concentrates on half of all trials, in which the perturbation appeared in the RF and evoked a robust neural response.
By design, in the SAME context, perturbation-evoked activity coalesced with responses to the search target. This superposition is illustrated in Figure 3a for an individual neuron tested with the INT− perturbation. At −200 ms PTOA (left panel, top row), the neuron gave an initial robust response to the perturbation (thick trace) and, on presentation of the search display (time 0, TG. ON), showed a second increase in activity reflecting the presence of the target in the RF. The thin dashed trace illustrates responses in interleaved no-perturbation trials when only the target appeared in the RF. The influence of the perturbation essentially dissipated after ∼200 ms after target onset, by which time the neuron responded similarly on perturbation and no-perturbation trials. At 0 ms PTOA (middle panel), perturbations appeared simultaneously with the search display. The neuron showed a single peak of activity, which was only slightly higher on perturbation relative to no-perturbation trials (thick vs thin dashed traces). Finally, at 200 ms PTOA, the neuron responded initially to the target in its RF (0–200 ms) and had a second response to the perturbation (200–400 ms) riding on this search-related activity. In the OPPOSITE context, perturbations appeared together with a distractor in the RF, and the perturbation-evoked response coalesced with the lower distractor-evoked activity (Fig. 3a, bottom row). A similar response pattern was seen in the entire population (Fig. 3b).
Figure 3.
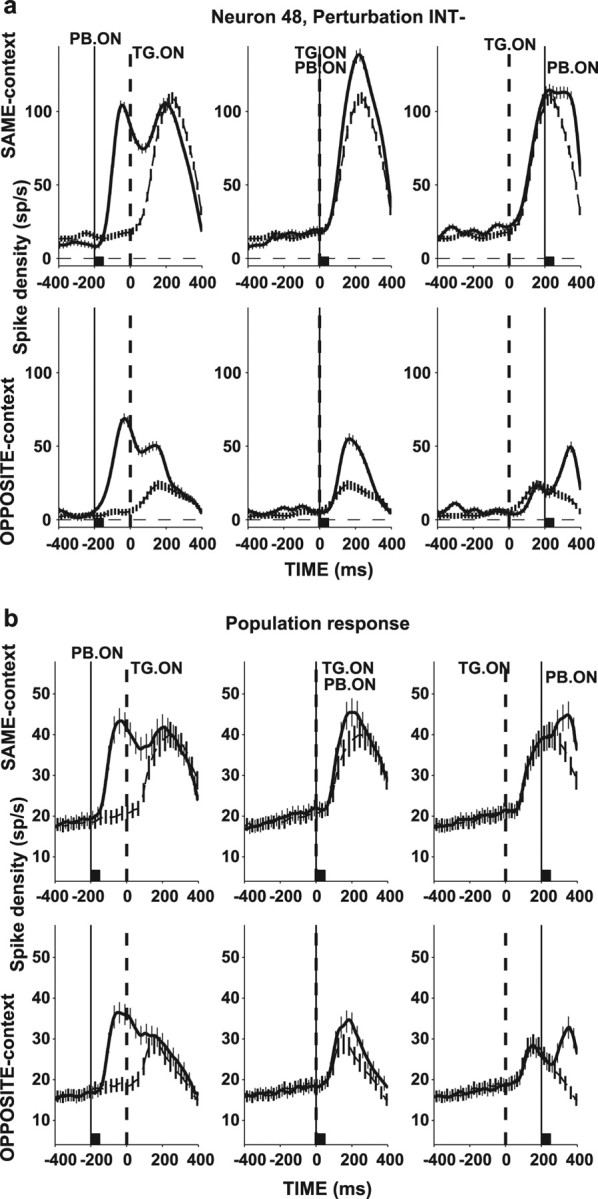
Superposition of search and perturbation-related responses. a, Responses (mean and SE) of a representative neuron for trials in which the perturbation was in the RF (thick traces) and for the corresponding no-perturbation trials (thin dashed traces). Top row shows responses for the SAME context, and bottom row shows responses in the OPPOSITE context, for PTOAs of −200 ms (left), 0 ms (middle), and 200 ms (right). Traces are aligned with target onset (time 0, broken vertical line), and the time of perturbation (INT−) onset is marked with the solid vertical line. The back squares mark the perturbation lifetime. b, Population responses, averaged across all neurons and perturbation types. Same format as in a. TG. ON, Target onset; PB. ON, perturbation onset.
In the following analyses, we examine first responses at −200 ms PTOA, when neurons responded to the perturbation before developing search-related activity. Next, we analyze the response evoked by the perturbation (the increase in firing rate on perturbation relative to no-perturbation trials) at 0 and 200 ms PTOA.
Effect of perturbation features
Figure 4 compares neural responses to different perturbation types at −200 ms PTOA. To highlight the perturbation-evoked component of the response, we calculated the difference between activity on perturbation and no-perturbation trials (by subtracting, for each neuron, the average response in no-perturbation trials from responses to each perturbation type). Although neurons responded robustly to all perturbation types, their responses to isoluminant color change appeared to be slightly weaker and have longer latencies than those to the other perturbations. Median responses (50–250 ms after perturbation onset) for increase and decrease in luminance, frame, movement, and color perturbations were 12.34, 14.86, 13.98, 14.07, and 6.35 sp/s in the SAME context and 10.19, 13.53, 9.36, 10.71, and 5.61 sp/s in the OPPOSITE context. Corresponding latencies were 64, 58, 50, 77, and 101 ms in the SAME context and 92, 71, 55, 92, and 105 ms in the OPPOSITE context. The effect of perturbation type, however, was not statistically significant at the population level for either firing rate or latency (Kruskal–Wallis ANOVA, p > 0.1). Paired comparisons between response magnitude to COLOR and to other perturbations reached statistical significance in one case only [p = 0.007, COLOR relative to MOVE; p = 0.068, 0.011, and 0.076 relative to INT+, INT−, and FRAME; criterion p (corrected for multiple comparisons) is 0.01]. Similarly, paired comparisons of response magnitude in individual neurons (Fig. 4b) yielded significant differences in fewer than 25% of neurons (with a liberal criterion of p = 0.05). Similar results were obtained at PTOA of 0 and 200 ms. A possible explanation for the lack of statistical significance of this effect may be the relatively low number of neurons tested with the COLOR perturbation (n = 26 vs 37, 57, 42, and 44 tested with INT+, INT−, FRAME, and MOVE).
Figure 4.
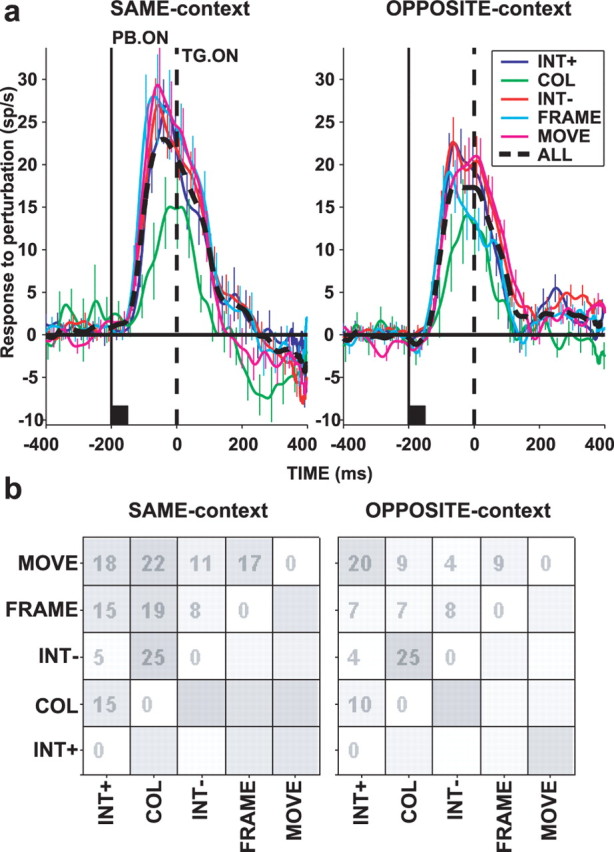
Responses to each perturbation type. a, Population response to perturbations (difference between response on trials with and without perturbation) for PTOA of −200 ms, SAME context (left) and OPPOSITE context (right). The black squares mark the perturbation lifetime. The different types of perturbations are designated as follows: INT+, increase in luminance; INT−, decrease in luminance; COL, color change; MOVE, back-and-forth radial movement; FRAME, appearance of frame surrounding one pattern; ALL, all perturbations together. b, Gray map representing the similarity matrices for SAME context (left) and OPPOSITE context (right). Numbers show the percentage of neurons with statistically significant different responses for each perturbation pair (Kruskal–Wallis ANOVA on perturbation responses 50–250 ms after perturbation onset followed by multiple pairwise comparisons). We used a liberal criterion of 0.05 to ensure that we did not miss any differences that may have occurred. TG. ON, Target onset; PB. ON, perturbation onset.
Given the possibility that LIP responses to color change are weaker than those to other perturbation, we examined whether different perturbations elicit different behavioral effects. Consistent with the neural response, the behavioral effects of the COLOR perturbation were relatively weak in both the SAME and OPPOSITE contexts. In the SAME context, median percentage change in reaction time (−200 ms PTOA) was −6.6, −7.9, −4.4, −8.1, and −2.8% for INT+, INT−, FRAME, MOVE, and COLOR (each p < 0.05 relative to 0, and p = 0.015 for effect of perturbation type, Kruskal–Wallis ANOVA). In the OPPOSITE context, the corresponding values were 2.7, 2.4, 0.5, −0.4, and 0.2% (each p > 0.07 relative to 0, and p = 0.016 for effect of perturbation type, Kruskal–Wallis ANOVA). Figure 5 shows the correlation between the fractional change in reaction time and the response to the perturbation across the entire set of neurons and perturbation types. In the SAME context, the variables were negatively correlated (r = −0.18; p < 0.0012), showing that a larger perturbation response was associated with a larger decrease in reaction time. In the OPPOSITE context, there was a positive correlation (r = 0.14; p < 0.045), showing that a larger perturbation response tended to produce a larger increase in RT. Thus, variations in the LIP response to different perturbation types correlate with attentional weight as measured through the facilitatory or distracting effects of the perturbation.
Figure 5.
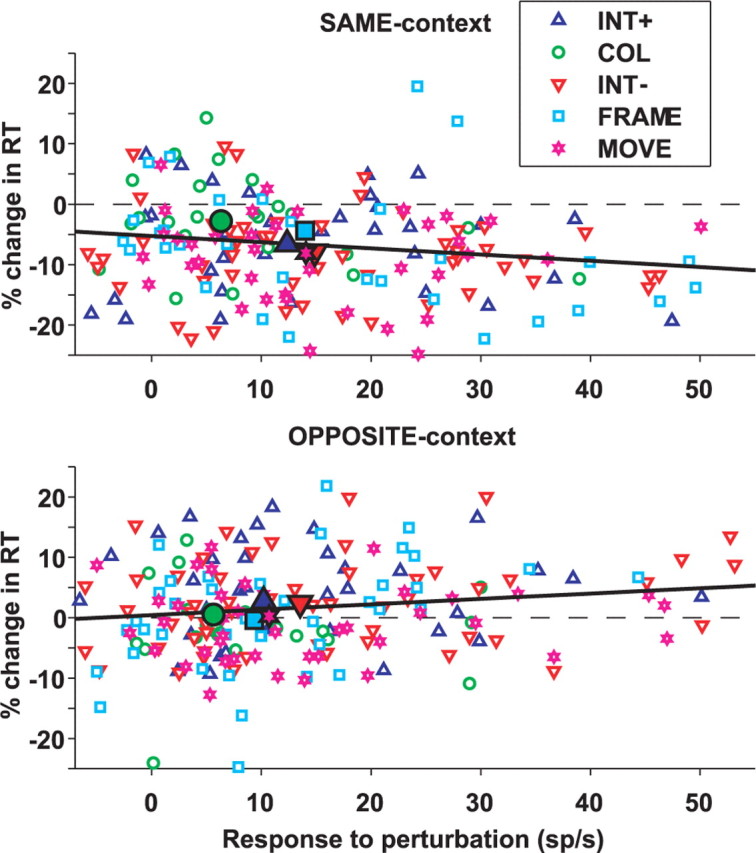
Correlation between the fractional change in RT and the response to the perturbation. Each point represents the fractional change in RT (as defined in Fig. 2) and average response to a specific perturbation (difference between average firing rate on perturbation and no-perturbation trials, 50–250 ms after perturbation onset) for one neuron, at −200 ms PTOA, in the SAME (top row) and OPPOSITE (bottom row) contexts. The color coding is the same as in Figure 4. Filled symbols show medians for each perturbation type, and thick lines represent the linear regression through all data points.
A final question pertains to the neural responses to the two luminance perturbations with opposite polarity, INT+ and INT−. Because both perturbations contained both an increase and a decrease in luminance (INT+ consisted of increase followed by decrease of luminance 50 ms later, and INT− consisted of decrease followed by increase in luminance), it is conceivable that neurons may have responded to only one of these transients, say, only to increase or only to decrease. If this were the case, we would expect a latency difference on the order of 50 ms (duration of the perturbation) between responses for INT+ and INT− trials. However, response latencies were equivalent (median latencies of 64 vs 58 ms for INT+ and INT− in the SAME context, and 92 vs 71 ms in the OPPOSITE context; both p > 0.1), and the distribution of latency differences showed a single peak with mean 1.8 ms for the SAME context and 3.6 ms for the OPPOSITE context (both p > 0.3 relative to 0). This argues that neurons had bona fide responses for changes of luminance with opposite polarities.
Contextual effects
Examination of the single-neuron and population responses in Figure 3 suggests that the baseline (presearch) and perturbation-evoked responses were stronger in the SAME than in the OPPOSITE context (compare top and bottom rows in a and b, −200 ms PTOA). To examine this effect in more detail, Figure 6a shows population response histograms for SAME and OPPOSITE trial blocks at −200 ms PTOA. The histograms depict the initial fixation and perturbation epochs, during which the visual display was identical in both contexts. (After time 0, the display changed to include either the target or a distractor in the RF so that firing rate differences could no longer be interpreted purely in terms of contextual effects.) Although firing rates were not affected by context in the early fixation (presearch) epoch, responses became larger in the SAME than in the OPPOSITE context shortly before perturbation onset. The average firing rate difference between the two contexts (Fig. 6b, circles) became significant at approximately −400 ms and greatly increased during the perturbation-evoked response (p < 10−15, Kruskal–Wallis ANOVA for effect of time, −400 to 100 ms after target onset).
Figure 6.

Quantitative analysis of contextual effect. a, Population responses (mean and SE) for −200 ms PTOA in the SAME and OPPOSITE contexts. Traces show the presearch fixation epoch and the perturbation response and are truncated 100 ms after target presentation, when neurons began reflecting the presence of the target or a distractor in the RF. b, Average difference (circles) and ratio (triangles) between neural response in the SAME and OPPOSITE contexts, for the responses in a. Values were calculated in a sliding window (50 ms width, 25 ms step), separately for each neuron and then averaged across the population. Error bars show SE, and asterisks indicate values significantly different from 0 (for difference) or 1 (for ratio; both Wilcoxon’s test, p < 0.05). c, Distribution of the difference in firing rates between SAME and OPPOSITE contexts for PTOA of −200 ms in individual neurons. d, Distribution of the ratio between responses in SAME and OPPOSITE contexts for PTOA of −200 ms. Vertical lines and symbols show medians for the corresponding histogram. TG. ON, Target onset; PB. ON, perturbation onset.
The large increase in firing rate differences during the perturbation epoch suggests that the contextual effect may have been a multiplicative gain change, because this would result in a larger difference during epochs of high activity relative to those with low activity. Consistent with a multiplicative effect, the average gain (the ratio between firing rates in the SAME and OPPOSITE contexts) became significantly >1 at approximately −400 ms and remained approximately constant thereafter (Fig. 6b, triangles) (p = 0.998 for effect of time, −400 to 100 ms). Figure 6, c and d, shows the distributions of firing rate differences and ratios in individual neurons, measured in early fixation (−800 to −600 ms), pre-perturbation (−400 to −200 ms), and perturbation (−150 to 50 ms) epochs. Whereas median difference increased with time (medians of −0.23, 0.99, and 3.23 sp/s in the corresponding epochs; p = 0.77, 0.04, and 0.0009 relative to 0; p < 0.05 relative to each other), gain values increased from the early fixation to the pre-perturbation epoch (medians of 0.97 vs 1.07; p = 0.76 and p < 0.02 relative to 1; p < 0.05 relative to each other) but did not increase further in the perturbation epoch (median of 1.14; p < 0.02 relative to 1; p = 0.25 relative to the pre-perturbation epoch). For the example neuron in Figure 3a, the firing rate differences in the three epochs were 0.66, 4.65, and 17.95 sp/s, with corresponding gain values of 1.15, 1.56, and 1.45. Thus, response gain remained constant, whereas response differences increased, consistent with a multiplicative effect.
The gain effect was not specific to the perturbation-evoked response but was also found in no-perturbation trials. Figure 7 compares activity in the SAME and OPPOSITE contexts for no-perturbation trials when either the target (Fig. 7a) or a distractor (Fig. 7b) was in the RF. When the target was in the RF, median firing rate differences between SAME and OPPOSITE contexts were 0.83 sp/s in the presearch epoch (−200 to 0 ms) and 2.53 sp/s in the search epoch (50–250 ms; each p < 0.05 relative to 0; p < 0.05 relative to each other), with corresponding gain values of 1.09 and 1.07 (both p < 0.02 relative to 1; p = 0.59 relative to each other). When a distractor was in the RF, median firing rate differences were 0.93 in the presearch epoch and 1.85 in the search epoch (p < 0.05 relative to 0; p < 0.04 relative to each other), with gains of 1.05 and 1.08 (p < 0.02 relative to 1; p = 0.97 relative to each other). Thus, the contextual gain change uniformly affected perturbation and search-related activity.
Figure 7.

Contextual effect in trials without perturbation. Population responses for the SAME and OPPOSITE contexts when the target was in the RF (a) and when a distractor was in the RF (b). Same format as in Figure 6a. Traces are aligned on time of target presentation (TG. ON).
Effect of timing
After presentation of the search display, neurons developed task-related activity, and the response to the perturbation was superimposed on either target-related activity in the SAME context or distractor-related activity in the OPPOSITE context (Fig. 3). To examine the responses elicited by the perturbations themselves, we calculated the difference between activity on perturbation and no-perturbation trials (Fig. 8a).
Figure 8.

Quantitative analysis of timing effect. a, Perturbation-evoked component of the response, obtained by subtracting response on trials with and without perturbation. The subtraction was calculated separately for each neuron, and resulting traces were averaged across neurons. Thick traces represent responses for the SAME context, and thin traces represent responses for the OPPOSITE context. The two traces in the left panel (−200 ms PTOA) are the same as the black dashed traces in the SAME and OPPOSITE contexts in Figure 4a. b, Scatter plots of perturbation component of the response in the SAME versus the OPPOSITE context for PTOA of −200 ms (left), 0 ms (middle), and 200 ms (right). Filled symbols represent neurons with a statistically significant effect of context. The dashed gray lines and the associated numbers represent the center of mass coordinates. Diagonal line is the equality line. TG. ON, Target onset; PB. ON, perturbation onset.
Perturbation-evoked responses were much weaker at 0 and 200 relative to −200 ms PTOA. Whereas at −200 ms PTOA the perturbation evoked median increases in firing rates of 11.21 and 10.31 sp/s in the SAME and OPPOSITE contexts (means of 16.12 vs 12.12 sp/s), median responses at 0 ms PTOA were only 4.60 and 3.64 sp/s (means of 4.70 vs 3.87 sp/s; both p < 10−5 relative to −200 ms PTOA), and at 200 ms PTOA were 4.61 and 6.23 sp/s (means of 7.48 vs 9.81 sp/s; both p < 0.05 relative to −200 ms PTOA). In addition to the overall reduction in response, the contextual effect disappeared at 0 ms PTOA (p = 0.5, SAME vs OPPOSITE context) and reversed at 200 ms PTOA, when neurons responded significantly more in the OPPOSITE than in the SAME context (p < 0.05). Figure 8b shows neuron-by-neuron comparison of perturbation responses in the SAME and OPPOSITE contexts. Whereas at −200 ms PTOA 45% of neurons showed significant preference for the SAME context and only 11% favored the OPPOSITE context, these fractions dropped to 28 and 22% at 0 ms PTOA and rose in a reverse pattern, to 16 and 37% at 200 ms PTOA.
These response changes at 0 and 200 ms PTOA may have been attributable to competitive interactions with simultaneous search-related responses. At 0 ms PTOA, perturbation-related input competes with the simultaneous visual transient caused by unmasking the search array. At 200 ms PTOA, perturbation responses are relatively weaker in the SAME context, when they compete with stronger target-related activity, than in the OPPOSITE context, when they compete with weaker distractor-related responses. An alternative possibility is that these changes were attributable to a ceiling effect, because neurons may have simply reached their intrinsic maximal firing rates when driven by both the perturbation and visual search. To evaluate this possibility, we compared peak firing rates in the SAME context with peak firing rates during the visual epoch of the memory–saccade task (usually the maximal responses of the neurons throughout these experiments). Median firing rates in the memory–saccade task were 66 sp/s, significantly higher than those evoked by the perturbation and target in the RF at 0 ms PTOA (median of 45 sp/s; p < 10−4) and at 200 ms PTOA (median of 43 sp/s; p < 10−4). Most neurons had significantly higher peak firing rates in the memory-guided saccade task than in the search task (64% for 0 ms PTOA and 67% for 200 ms PTOA), and only a minority showed a significant difference in the opposite direction (15% for 0 ms PTOA and 20% for 200 ms PTOA). Thus, most neurons were capable of firing at higher rates than those seen on trials in which both perturbation and target were in the RF. However, an additional possibility is that, as firing rates were driven toward an intrinsic maximum by the search task, any additional input attributable to the perturbation would elicit incrementally smaller changes in response. To evaluate this possibility, we calculated correlations between two quantities: the incremental response evoked by the perturbation (difference between peak response on perturbation and no-perturbation trials) and the task-related level of activity of the neuron relative to its putative maximum (the difference between peak firing rate on the memory-guided saccade task and the peak firing rate on no-perturbation trials, in the interval corresponding to the perturbation response on perturbation trials). Contrary to the predictions of the hypothesis, we found neither correlation between these two quantities within a context nor when data were pooled across contexts (SAME or OPPOSITE, 0 or 200 ms PTOA; all r values <0.08; p > 0.5). In other words, how far the neuron was from its putative maximal firing rate did not predict the degree to which it would respond to the perturbation. These results make an explanation in terms of firing rate saturation unlikely and suggest that competitive interactions with search-related activity caused the decline in perturbation responses and reversal of the contextual effect at 0 and 200 ms PTOA.
Discussion
We describe two main findings regarding the integration of top-down and bottom-up influences in LIP. First, LIP neurons respond not only to suddenly appearing objects, but also to abrupt changes in color, luminance, or position of existing objects. The level of LIP response correlates with the bottom-up distracting effect of different visual transients. This supports the idea that LIP encodes an abstract dimension of salience that mediates the bottom-up effects of a wide variety of sensory inputs. Second, responses to salient objects are modulated by at least two top-down mechanisms: a gain control setting that is not spatially specific but describes a global behavioral context, and local, spatially specific competitive interactions with task-related activity. These two influences act on the same population of neurons, allowing for the flexible regulation of responsiveness to external input as a function of behavioral context and momentary task engagement.
General salience representation
Previous studies have shown that LIP neurons preferentially encode newly appearing relative to stable objects (Gottlieb et al., 1998). We extend these findings by showing that LIP responses generalize to other perturbing visual transients, whether these represent the appearance of a new object or an abrupt change in an existing object. Neurons responded for transients defined by motion, luminance, and color changes and responded similarly for transients with opposite physical characteristics (increase and decrease in luminance). Responses to color change tended to be weaker and have slightly longer latencies than those to the other perturbations (although, in our dataset, these trends did not reach statistical significance), consistent with the fact that isoluminant color changes produce weaker responses in the visual system (Livingstone and Hubel, 1988). The color perturbation produced the weakest behavioral effect on reaction times, resulting in significant correlations between the neural and behavioral effects of the perturbation in both SAME and OPPOSITE contexts. These findings suggest that a change in color is a relatively poor attentional attractor (Theeuwes, 1995) and bolsters the evidence for a functional contribution of LIP to covert attention (Robinson et al., 1995; Colby et al., 1996; Gottlieb et al., 1998; Bisley and Goldberg, 2003; Wardak et al., 2004). A question left open by our data is whether neurons are also sensitive to sustained forms of salience, such as a color, shape, or motion pop-out. Given the generality of the responses we find here and the fact that sensitivity to static pop-out is found in area 7a that is adjacent to LIP (Constantinidis and Steinmetz, 2005), this is likely also to be the case for LIP.
Contextual modulations
The gain modulation differs from previous attentional modulations in LIP in that it was not specific for an object or location (Colby et al., 1996) but uniformly affected baseline, perturbation, and search-related responses. Consistent with a gain change, firing rate differences were small during the baseline epoch but much higher during perturbation and search-related responses. Interestingly, the differential gain setting did not start immediately during the onset of fixation but built up in anticipation of the first visual event, ruling out the possibility that it represented nonspecific excitability changes and suggesting that it was sensitive not only to spatial but also to temporal trial contingencies (Janssen and Shadlen, 2005). This global modulation may have been triggered by the task we chose, which did not allow monkeys to anticipate the location of the target or perturbation but only to deduce the higher-order relationship between the two. Thus, the gain change may have reflected the adoption of a behavioral set (Dosenbach et al., 2006), which may have been optimal for controlling the impact of the perturbation depending on its statistical association with the task-relevant target.
The contextual effect in neural responses helps constrain our interpretation of the monkeys’ behavioral strategy in solving the task. For example, it could be argued that, in the OPPOSITE context, monkeys treated the perturbation as a valid cue, attending toward and then quickly opposite from it, toward the expected target location. However, in this case, we should have found, contrary to what we observed, that perturbation-evoked responses were initially similar in the two contexts but declined faster in the OPPOSITE than in the SAME context. Moreover, monkeys (in stark contrast with humans) do not orient attention opposite an “anti-predictive” cue in a cued-detection task (Bowman et al., 1993), and, in the present task, we found that the behavioral effect of the perturbation in the OPPOSITE context did not vary according to the precision with which the perturbation specified target location (i.e., neighborhood size). A final possibility is that the lack of a behavioral effect in the OPPOSITE context may have had a purely bottom-up explanation, i.e., the perturbation may have been simply ineffectual in distracting the monkey’s attention. This idea however is inconsistent with the distracting effects of the OPPOSITE perturbation at 0 and 200 ms PTOA and with the presence of a top-down contextual effect in neural responses. Together, these considerations suggest that monkeys adapted to the two contexts with a global gain change in attention-related areas.
Competitive interactions
A second mechanism suggested by our results is the competitive suppression of the perturbation-evoked activity by search-related responses. At 0 ms PTOA, the perturbation-evoked response was much weaker than at −200 ms PTOA, possibly reflecting competition from neurons activated by the simultaneous change from the placeholder to the search display. At 200 ms PTOA, perturbation-related activity was weaker in the SAME context than in the OPPOSITE context (a reversal of the contextual effect at −200 ms PTOA), suggesting that it may have been suppressed by the higher search-related activity in the SAME context. This reverse contextual modulation appears similar to the findings of Robinson et al. (1995) and Powell and Goldberg (2000), that a visual stimulus elicited weaker responses if it appeared at a cued (attended) location than if it appeared at an unattended location in a cued-detection or memory–saccade task. We show that this effect could not be accounted for by an intrinsic limit in the maximal firing rates of the neurons but was most likely attributable to competitive interactions between search and perturbation-evoked activity.
Behaviorally, such competitive interactions can facilitate attentional shifts toward novel, unattended locations or equivalently, discourage repeated orienting toward already attended locations (e.g., inhibition of return). This is consistent with the view that LIP provides control signals for shifting or reengaging attention at a previously unattended location (Robinson et al., 1995; Yantis et al., 2002; Shomstein and Yantis, 2004). An implication of this attentional suppression is that the LIP signal resembles more an attentional control signal rather than a visual response that is modulated by attention, because a visual response would be expected to be enhanced whether a stimulus is newly attended or appears within an already attended locus. This idea is further bolstered by the fact that reaction times for identifying the target correlated with the LIP response preceding target presentation (Fig. 5).
Multiple top-down effects
The attentional suppression found by previous investigators (Robinson et al., 1995; Powell and Goldberg, 2000) and at 200 ms PTOA in the present task appears to contradict the phenomenon of attentional enhancement (Colby et al., 1996). The present results argue that these opposite effects of attention do not reflect spurious methodological differences (among tasks, subjects, or neuronal populations examined) but reflect the operation of several interacting mechanisms impinging on the same neuronal population. Both gain modulations and competitive interactions have been suggested as attentional mechanisms in extrastriate visual areas (McAdams and Maunsell, 1999; Reynolds et al., 1999; Recanzone and Wurtz, 2000; Kastner et al., 2001), suggesting that different implementations of the same fundamental mechanisms may subserve attentional selection throughout extrastriate and association areas. These interacting mechanisms may allow dynamic, multifaceted modulations of responses to external input, which may be critical for maintaining an optimal balance between the voluntary and stimulus-driven control of attention.
Footnotes
This research was supported by The National Eye Institute, The Alfred P. Sloan Foundation, The Keck Foundation, The Klingenstein Fund, and the McKnight Endowment Fund for Neuroscience. We thank S. Narula and R. Radulescu for expert technical assistance, M. Osman and G. Asfaw for veterinary care, and G. Johnson and T. Hill for technical assistance.
References
- Barash S, Bracewell RM, Fogassi L, Gnadt JW, Andersen RA. Saccade-related activity in the lateral intraparietal area. I. Temporal properties. J Neurophysiol. 1991;66:1095–1108. doi: 10.1152/jn.1991.66.3.1095. [DOI] [PubMed] [Google Scholar]
- Bisley JW, Goldberg ME. Neuronal activity in the lateral intraparietal area and spatial attention. Science. 2003;299:81–86. doi: 10.1126/science.1077395. [DOI] [PubMed] [Google Scholar]
- Bisley JW, Krishna BS, Goldberg ME. A rapid and precise on-response in posterior parietal cortex. J Neurosci. 2004;24:1833–1838. doi: 10.1523/JNEUROSCI.5007-03.2004. [DOI] [PMC free article] [PubMed] [Google Scholar]
- Bowman EM, Brown VJ, Kertzman C, Schwarz U, Robinson DL. Covert orienting of attention in macaques. I. Effects of behavioral context. J Neurophysiol. 1993;70:431–443. doi: 10.1152/jn.1993.70.1.431. [DOI] [PubMed] [Google Scholar]
- Chastain G, Cheal M. Attentional capture with various distractor and target types. Percept Psychophys. 2001;63:979–990. doi: 10.3758/bf03194517. [DOI] [PubMed] [Google Scholar]
- Colby CL, Duhamel J-R, Goldberg ME. Visual, presaccadic and cognitive activation of single neurons in monkey lateral intraparietal area. J Neurophysiol. 1996;76:2841–2852. doi: 10.1152/jn.1996.76.5.2841. [DOI] [PubMed] [Google Scholar]
- Constantinidis C, Steinmetz MA. Posterior parietal cortex automatically encodes the location of salient stimuli. J Neurosci. 2005;25:233–238. doi: 10.1523/JNEUROSCI.3379-04.2005. [DOI] [PMC free article] [PubMed] [Google Scholar]
- Corbetta M, Shulman GL. Control of goal-directed and stimulus-driven attention in the brain. Nat Rev Neurosci. 2002;3:201–215. doi: 10.1038/nrn755. [DOI] [PubMed] [Google Scholar]
- Dosenbach NU, Visscher KM, Palmer ED, Miezin FM, Wenger KK, Kang HC, Burgund ED, Grimes AL, Schlaggar BL, Petersen SE. A core system for the implementation of task sets. Neuron. 2006;50:799–812. doi: 10.1016/j.neuron.2006.04.031. [DOI] [PMC free article] [PubMed] [Google Scholar]
- Egeth HE, Yantis S. Visual attention: control, representation, and time course. Annu Rev Psychol. 1997;48:269–297. doi: 10.1146/annurev.psych.48.1.269. [DOI] [PubMed] [Google Scholar]
- Folk CL, Remington RW, Johnston JC. Involuntary covert orienting is contingent on attentional control settings. J Exp Psychol Hum Percept Perform. 1992;18:1030–1044. [PubMed] [Google Scholar]
- Goldberg ME, Bisley J, Powell KD, Gottlieb J, Kusunoki M. The role of the lateral intraparietal area of the monkey in the generation of saccades and visuospatial attention. Ann NY Acad Sci. 2002;956:205–215. doi: 10.1111/j.1749-6632.2002.tb02820.x. [DOI] [PubMed] [Google Scholar]
- Gottlieb J, Kusunoki M, Goldberg ME. The representation of visual salience in monkey parietal cortex. Nature. 1998;391:481–484. doi: 10.1038/35135. [DOI] [PubMed] [Google Scholar]
- Gottlieb J, Kusunoki M, Goldberg ME. Simultaneous representation of saccade targets and visual onsets in monkey lateral intraparietal area. Cereb Cortex. 2005;15:1198–1206. doi: 10.1093/cercor/bhi002. [DOI] [PMC free article] [PubMed] [Google Scholar]
- Itti L, Koch C. Computational modelling of visual attention. Nat Rev Neurosci. 2001;2:194–203. doi: 10.1038/35058500. [DOI] [PubMed] [Google Scholar]
- Janssen P, Shadlen MN. A representation of the hazard rate of elapsed time in macaque area LIP. Nat Neurosci. 2005;8:234–241. doi: 10.1038/nn1386. [DOI] [PubMed] [Google Scholar]
- Kastner S, De Weerd P, Pinsk MA, Elizondo MI, Desimone R, Ungerleider LG. Modulation of sensory suppression: implications for receptive field sizes in the human visual cortex. J Neurophysiol. 2001;86:1398–1411. doi: 10.1152/jn.2001.86.3.1398. [DOI] [PubMed] [Google Scholar]
- Kusunoki M, Gottlieb J, Goldberg ME. The lateral intraparietal area as a salience map: the representation of abrupt onset, stimulus motion, and task relevance. Vision Res. 2000;40:1459–1468. doi: 10.1016/s0042-6989(99)00212-6. [DOI] [PubMed] [Google Scholar]
- Lamy D, Leber A, Egeth HE. Effects of task relevance and stimulus-driven salience in feature-search mode. J Exp Psychol Hum Percept Perform. 2004;30:1019–1031. doi: 10.1037/0096-1523.30.6.1019. [DOI] [PubMed] [Google Scholar]
- Livingstone M, Hubel D. Segregation of form, color, movement, and depth: anatomy, physiology, and perception. Science. 1988;240:740–749. doi: 10.1126/science.3283936. [DOI] [PubMed] [Google Scholar]
- Maunsell JHR, Gibson JR. Visual response latencies in striate cortex of the macaque monkey. J Neurophysiol. 1992;68:1332–1344. doi: 10.1152/jn.1992.68.4.1332. [DOI] [PubMed] [Google Scholar]
- McAdams CJ, Maunsell JHR. Effects of attention on orientation-tuning functions of single neurons in macaque cortical area V4. J Neurosci. 1999;19:431–441. doi: 10.1523/JNEUROSCI.19-01-00431.1999. [DOI] [PMC free article] [PubMed] [Google Scholar]
- Navalpakkam V, Itti L. Modeling the influence of task on attention. Vision Res. 2005;45:205–231. doi: 10.1016/j.visres.2004.07.042. [DOI] [PubMed] [Google Scholar]
- Powell KD, Goldberg ME. Response of neurons in the lateral intraparietal area to a distractor flashed during the delay period of a memory-guided saccade. J Neurophysiol. 2000;84:301–310. doi: 10.1152/jn.2000.84.1.301. [DOI] [PubMed] [Google Scholar]
- Recanzone GH, Wurtz RH. Effects of attention on MT and MST neuronal activity during pursuit initiation. J Neurophysiol. 2000;83:777–790. doi: 10.1152/jn.2000.83.2.777. [DOI] [PubMed] [Google Scholar]
- Reynolds JH, Chelazzi L, Desimone R. Competitive mechanisms subserve attention in macaque areas V2 and V4. J Neurosci. 1999;19:1736–1753. doi: 10.1523/JNEUROSCI.19-05-01736.1999. [DOI] [PMC free article] [PubMed] [Google Scholar]
- Robinson DL, Bowman EM, Kertzman C. Covert orienting of attention in macaques. II. Contributions of parietal cortex. J Neurophysiol. 1995;74:698–712. doi: 10.1152/jn.1995.74.2.698. [DOI] [PubMed] [Google Scholar]
- Serences JT, Shomstein S, Leber AB, Golay X, Egeth HE, Yantis S. Coordination of voluntary and stimulus-driven attentional control in human cortex. Psychol Sci. 2005;16:114–122. doi: 10.1111/j.0956-7976.2005.00791.x. [DOI] [PubMed] [Google Scholar]
- Shomstein S, Yantis S. Control of attention shifts between vision and audition in human cortex. J Neurosci. 2004;24:10702–10706. doi: 10.1523/JNEUROSCI.2939-04.2004. [DOI] [PMC free article] [PubMed] [Google Scholar]
- Theeuwes J. Abrupt luminance change pops out; abrupt color change does not. Percept Psychophys. 1995;57:637–644. doi: 10.3758/bf03213269. [DOI] [PubMed] [Google Scholar]
- Thompson KG, Bichot NP. A visual salience map in the primate frontal eye field. Prog Brain Res. 2005;147:251–262. doi: 10.1016/S0079-6123(04)47019-8. [DOI] [PubMed] [Google Scholar]
- Wardak C, Olivier E, Duhamel JR. A deficit in covert attention after parietal cortex inactivation in the monkey. Neuron. 2004;42:501–508. doi: 10.1016/s0896-6273(04)00185-0. [DOI] [PubMed] [Google Scholar]
- Yantis S, Schwarzbach J, Serences JT, Carlson RL, Steinmetz MA, Pekar JJ, Courtney SM. Transient neural activity in human parietal cortex during spatial attention shifts. Nat Neurosci. 2002;5:995–1002. doi: 10.1038/nn921. [DOI] [PubMed] [Google Scholar]