Abstract
The α2 adrenoceptor antagonist yohimbine (YO) increases transmitter release from adrenergic/noradrenergic (NA) neurons. Systemic YO activates the hypothalamic–pituitary–adrenal (HPA) axis, inhibits feeding, and supports conditioned flavor avoidance (CFA) in rats. To determine whether these effects require NA inputs to the bed nucleus of the stria terminalis (BNST), vehicle or saporin toxin conjugated to an antibody against dopamine β hydroxylase (DSAP) was microinjected bilaterally into the BNST to remove its NA inputs. Subsequent tests failed to reveal any lesion effect on the ability of YO (5.0 mg/kg, i.p.) to inhibit food intake or to support CFA. Conversely, HPA axis responses to YO were significantly blunted in DSAP rats. In a terminal experiment, DSAP and control rats were perfused 90–120 min after intraperitoneal injection of YO or vehicle. Brains were processed to reveal Fos immunolabeling and lesion extent. NA fibers were markedly depleted in the BNST and medial parvocellular paraventricular hypothalamus (PVNmp) in DSAP rats, evidence for collateralized NA inputs to these regions. DSAP rats displayed significant loss of caudal medullary NA neurons, and markedly blunted Fos activation in the BNST and in corticotropin-releasing hormone-positive PVNmp neurons after YO. We conclude that a population of medullary NA neurons provides collateral inputs to the BNST and PVNmp, and that these inputs contribute importantly to Fos expression and HPA axis activation after YO treatment. Conversely, NA-mediated activation of BNST and PVNmp neurons is unnecessary for YO to inhibit food intake or support CFA, evidence for the sufficiency of other intact neural pathways in mediating those effects.
Keywords: anorexia, bed nucleus of the stria terminalis, conditioned flavor avoidance, corticosterone, Fos, HPA axis, norepinephrine, noradrenaline
Introduction
Physiological and behavioral stress responses can be provoked by drugs such as yohimbine (YO) that increase central adrenergic/noradrenergic (NA) signaling (Morilak et al., 2005). YO increases NA signaling by antagonizing α2 adrenoceptors that are negatively coupled to cAMP production. Blockade of presynaptic receptors on NA axon terminals promotes increased neurotransmitter release from those terminals. At the same time, blockade of postsynaptic receptors reduces the inhibitory effects of synaptically released NA at those receptors while leaving unopposed the excitatory effects of NA at other adrenoceptor subtypes (Wozniak et al., 2000). Systemic YO produces peripheral sympathomimetic effects, but also crosses the blood–brain barrier to act centrally. In humans, YO induces subjective feelings of anxiety, can provoke panic attacks, and has pronounced stressor-like autonomic and neuroendocrine effects that include hypertension and activation of the hypothalamic–pituitary–adrenal (HPA) axis (Charney et al., 1983, 1989).
We demonstrated previously that systemic YO activates viscerosensory circuits that include NA neurons in the nucleus of the solitary tract (NST) and caudal ventrolateral medulla (VLM) in rats (Myers et al., 2005). YO increases Fos expression and extracellular NA levels within the NST and VLM, and also in stress-related brain regions that receive NA inputs from the NST and VLM, including the PVN, lateral parabrachial nucleus (PBN), central nucleus of the amygdala (CeA), and bed nucleus of the stria terminalis (BNST) (Szemeredi et al., 1991; Pacak et al., 1992; Tsujino et al., 1992; Forray et al., 1997; Khoshbouei et al., 2002; Singewald et al., 2003; Myers et al., 2005). These YO effects occur in concert with conditioned avoidance, increased anxiety-like behavior, hypophagia, and HPA axis activation (Callahan et al., 1984; File, 1986; Baldwin et al., 1989; Johnston and File, 1989; Khoshbouei et al., 2002; Myers et al., 2005).
YO activates NA neurons within the NST and VLM that project directly to the BNST (Myers et al., 2005), but it is unclear whether these projections are necessary for YO to produce its distinct effects. NA inputs to the lateral BNST are implicated in physiological and behavioral responses to diverse stimuli that promote stress responses and anxiety-like behavior in rats, including drug withdrawal, immobilization, and exposure to predator odor (Aston-Jones et al., 1999; Delfs et al., 2000; Cecchi et al., 2002a,b; Fendt et al., 2005; Myers and Rinaman, 2005; Schweimer et al., 2005). The BNST is reciprocally connected with the NST, VLM, PBN, and CeA (Dong et al., 2001b), and the ventrolateral BNST densely innervates the medial parvocellular PVN (PVNmp) (Dong et al., 2001a), which contains corticotropin-releasing hormone (CRH)-positive neurons that comprise the apex of the HPA stress axis. Thus, the BNST is tactically positioned to participate in diverse behavioral and physiological responses to YO. The present study used an immunotoxin lesioning approach to test the hypothesis that NA inputs to the lateral BNST are necessary for YO to increase hypothalamic and limbic Fos activation, and also are necessary for YO to inhibit food intake, support conditioned flavor avoidance (CFA), and increase plasma corticosterone levels.
Materials and Methods
Animals
Adult male Sprague Dawley rats [250–330 g body weight (BW); Harlan Laboratories, Indianapolis, IN] were housed singly in stainless-steel cages in a controlled environment (20–22°C; 12 h light/dark cycle, lights off at 7:00 P.M.) with ad libitum access to water and pelleted chow [Purina (Bethlehem, PA) 5001], except as noted. Experimental protocols were approved by the University of Pittsburgh Institutional Animal Care and Use Committee.
DSAP injections
DSAP [a mouse antibody against dopamine β hydroxylase (DbH) conjugated to saporin toxin] was used to specifically lesion NA neurons with inputs to the BNST. DbH converts dopamine to norepinephrine; thus, the presence of DbH phenotypically defines NA neurons and terminals. A subset of medullary NA neural inputs to the BNST also synthesize the enzyme phenylethanolamine N-methyl transferase, which processes norepinephrine to epinephrine; this “adrenergic” subset of NA neurons also is subject to DSAP lesions. DSAP binds to vesicular DbH when vesicles are exposed to the synaptic cleft during transmitter exocytosis (Wrenn et al., 1996). The DSAP antibody–toxin complex is internalized during vesicle endocytosis and is retrogradely transported. After reaching the cell body, saporin inactivates ribosomes (Ippoliti et al., 1992) to interrupt protein synthesis and produce NA cell death within 1–2 weeks (Madden et al., 1999, 2006; Rinaman, 2003; Ritter et al., 2003). The specificity of DSAP as an NA lesioning agent has been demonstrated in several reports (Madden et al., 1999, 2006; Ritter et al., 2001, 2003; Rinaman, 2003).
For bilateral injections of DSAP or vehicle into the BNST, rats (n = 27 DSAP; n = 17 sham control) were anesthetized by halothane inhalation (Halocarbon Laboratories, River Edge, NJ; 1–3% in oxygen) and mounted into a stereotaxic frame in the flat-skull position. A 1.0 μl Hamilton syringe was attached to the stereotaxic arm. Injection coordinates targeting the left and right ventral lateral BNST (0.28 mm posterior, 2.8 mm lateral, and 7.6 mm ventral to bregma) were selected based on a standard rat brain atlas (Paxinos and Watson, 1997). The injecting needle was angled 10 degrees from vertical to avoid passing through the lateral ventricle and septum en route to the BNST target site. DSAP (11 ng delivered in 50 nl of 0.15 m NaCl vehicle; Advanced Targeting Systems, San Diego, CA) was pressure injected over a 1–2 min period. Sham control rats were similarly injected with 50 nl of vehicle alone. The syringe was left in place for 10 min after each injection to reduce injectate diffusion up the needle tract. BNST injections were repeated on the opposite side of the brain in the same surgical session. The skin was closed with stainless-steel clips and rats were returned to their home cages after recovery from anesthesia. DSAP and sham control rats recovered for at least 10 d after surgery before experiments were initiated.
Each DSAP and sham control rat participated in one of the following experiments: a behavioral test to determine the ability of systemic YO to inhibit food intake (experiment 1), a behavioral test to determine the ability of YO to support CFA (experiment 2), or a physiological test to determine the ability of YO to elevate plasma corticosterone levels (experiment 3). Rats used in behavioral experiments 1 or 2 were subsequently included in a terminal experiment to assess the ability of YO to activate central Fos expression (experiment 4). Rats used in experiment 3 (plasma corticosterone assays) were not included in experiment 4 (Fos analyses) because of the additional manipulations they experienced during insertion and maintenance of indwelling arterial catheters. The brains of all DSAP and control rats, including those used in experiment 3, were examined postmortem to ascertain lesion extent (described below, Quantification of Fos activation and DSAP lesion extent).
YO preparation and administration
YO (Sigma, St. Louis, MO) was freshly dissolved before each experiment by vortexing in sterile 0.15 m NaCl for 5 min at room temperature, followed by passage through a 0.45 μm syringe filter (Millex HV) to remove particulate residue. Rats were injected intraperitoneally with 2.0 ml of 0.15 m NaCl vehicle alone, or with vehicle containing YO at a dose of 5.0 mg/kg BW. Injection volumes were adjusted around an average of 2.0 ml per rat to account for small between-animal differences in BW within each experimental cohort. The 5.0 mg/kg BW dose of YO was selected based on recent findings demonstrating that a lower dose of YO (i.e., 1.0 mg/kg BW) did not produce significant effects on food intake, CFA, or central Fos activation (Myers et al., 2005).
Experiment 1
Effect of DSAP lesions on the ability of YO to inhibit food intake.
Food was removed from cages at 3:30 P.M. (i.e., 3.5 h before dark onset). At 3:00 P.M. on the following day (i.e., 23.5 h later), food-deprived rats (n = 8 DSAP; n = 8 sham control) were injected intraperitoneally with either YO (n = 4 DSAP; n = 4 sham control) or vehicle (n = 4 DSAP; n = 4 sham control). A measured amount of pelleted chow was provided 30 min later, at 3:30 P.M.. Cumulative food intake by each rat, corrected for spillage, was determined after 30 min, 60 min, and 18 h of food access. Rats then were returned to ad libitum chow access for 48 h. The 24 h food deprivation and feeding test was repeated in a counterbalanced design in which rats treated previously intraperitoneally with YO subsequently received vehicle intraperitoneally, and vice versa. Thus, each rat served as its own control for determining the effect of YO on deprivation-induced food intake.
Data analysis.
The effect of YO on food intake was analyzed by repeated measures ANOVA with lesion group (DSAP vs sham), treatment (i.p. YO vs vehicle), and time (30 min, 60 min, 18 h) as independent variables. When F values indicated significant main effects of experimental variables on cumulative food intake, the ANOVA was followed up with Fisher's protected least significant difference (LSD) tests. Differences were considered significant when p < 0.05.
Experiment 2
Effect of DSAP lesions on the ability of YO to support CFA.
A sensitive two-bottle choice paradigm (Deutsch and Hardy, 1977) was used to determine whether DSAP lesions alter the ability of rats to express conditioned avoidance of flavors previously paired with YO treatment (Myers et al., 2005). Flavor exposure during CFA training and testing was conducted near the end of the light cycle of the photoperiod, between 3:00 and 5:00 P.M. Rats (n = 14 DSAP; n = 7 sham) were acclimated for 2 d to intraperitoneal injection of vehicle (0.15 m NaCl; 2.0 ml) before beginning the CFA experiment. Rats also were acclimated to one trial of overnight water deprivation followed by morning access to water in the same type of graduated drinking tube used in the CFA experiment. Food was available ad libitum.
Rats underwent an initial 22 h water deprivation period beginning at 3:00 P.M., then were given 30 min access to water containing 0.5% almond or vanilla flavor extract (McCormick, Hunt Valley, MD). Half of the DSAP or sham control rats within each experimental cohort were presented with one flavor, and the remainder with the other flavor. The left–right position of the drinking tube on each cage was switched after 15 min, with intake recorded at 15 and 30 min time points. Thirty minutes after the end of the first flavor exposure session, all rats were injected intraperitoneally with 2.0 ml of 0.15 m NaCl vehicle. Plain water was returned 30 min after intraperitoneal vehicle injection, with ad libitum access provided for the next 24 h. Rats were then water deprived again for 22 h beginning at 3:00 P.M., after which each rat received the alternate novel flavor to drink for 30 min, with drinking tube positions switched after 15 min and cumulative intakes recorded at 15 and 30 min. Thirty minutes after the end of this second flavor exposure, all rats were injected intraperitoneally with YO (5.0 mg/kg BW). Plain water was returned 30 min after intraperitoneal YO injection, with ad libitum access until the day before the final two-bottle choice test, which occurred 3–4 d later.
Before the choice test, rats were water deprived for 22 h beginning at 3:00 P.M., and then given 30 min of simultaneous access to two drinking tubes, one containing the YO-paired flavor (either almond or vanilla) and the other containing the alternate vehicle-paired flavor. The volume of each flavor consumed was recorded at 15 min, tube positions were switched, and cumulative intake was recorded at 30 min. Rats were returned to ad libitum water access immediately after the two-bottle choice test.
Data analysis.
Flavor preferences displayed by each rat during the two-bottle choice test were determined by dividing the volume consumed from each drinking tube (i.e., vehicle-paired flavor vs YO-paired flavor) by the total volume consumed from both tubes during the 30 min choice test. Individual preference ratios were combined by surgical group (i.e., DSAP vs sham control rats) to obtain group preference ratios (mean ± SE) for vehicle-paired versus YO-paired flavors. Outcomes indicating group mean flavor preference ratios that did not differ significantly (i.e., close to 50:50%) were interpreted as an absence of CFA, whereas outcomes indicating significantly shifted preference ratios (e.g., 70:30%) were interpreted as evidence for conditioned avoidance of the flavor represented by the lower value in the ratio. Student's t tests within each group were used to determine whether preference ratios for vehicle-paired and YO-paired flavors were significantly different, with significance set at p < 0.05.
Experiment 3
Effect of DSAP lesions on the ability of YO to elevate plasma corticosterone levels.
DSAP (n = 6) and weight-matched control rats (n = 6) were anesthetized with halothane. The control group of six rats included three intact controls (i.e., with no previous stereotaxic surgery) and three sham controls with previous stereotaxic injections made into the region of the BNST bilaterally. With the aid of a surgical microscope, the right femoral artery was cannulated with polyethylene (PE) 50 tubing (Intramedic Clay Adams Brand; Becton Dickinson, Sparks, MD) and the cannula tip secured within the artery using silk sutures. PE tubing extending from the artery was tunneled subcutaneously to emerge through a small incision between the scapulae. The cannula tubing was secured at the exit site with a purse-string suture and was protected by a lightweight flexible harness system (Instech Laboratories, Plymouth Meeting, PA). Cannula tubing was extended distally and connected to a liquid swivel tether system (Instech Laboratories) mounted to a counterbalanced arm. The arm was attached to the stainless-steel top of a standard shoebox cage in which each cannulated rat was individually housed with corncob bedding, with pelleted rat chow and water available ad libitum. This tether system allowed remote arterial blood sampling in freely moving rats.
Rats were prepared with arterial cannulas and tested experimentally in cohorts of three, as described below. Rats were allowed to recover from surgery and acclimate to the tether system and cage for 48 h before beginning the experiment. During recovery, the arterial cannula line was opened twice each day (at 10:00 A.M. and 4:00 P.M.) to allow a few drops of blood to flow, followed by infusion of 200 μl of heparinized saline into the line to maintain patency.
On experimental day 1, a baseline blood sample (150 μl) was collected from each rat into a vial containing 3.75 IU of heparin at time 0 (10:00 A.M.). Immediately afterward, one or two of the rats in each cohort was injected intraperitoneally with YO (5.0 mg/kg BW). The remaining rat(s) in the same cohort was injected intraperitoneally with 0.15 m NaCl vehicle. Additional blood samples (150 μl) were collected 30, 60, and 90 min after intraperitoneal injection of YO or vehicle. Rats were subsequently left undisturbed after the final 90 min sample. The intraperitoneal injection and blood sampling procedure was repeated on the following day, with each rat receiving the alternate intraperitoneal injection (i.e., vehicle or YO) after the time 0 baseline sample. In this manner, each rat served as its own control for determining baseline corticosterone levels and the temporal effect of YO and vehicle injections.
Blood samples were collected on ice and centrifuged within 5 min of collection to separate plasma from blood cells. Plasma samples were stored at −20°C until being assayed for corticosterone concentrations using an EIA kit (Immunodiagnostic Systems, Fountain Hills, AZ). Kit assay sensitivity for corticosterone was 0.55 ng/ml, with synthetic corticosterone recovery of 98.6 ± 6.3%, and linearity of 99.7 ± 4.3%.
A few hours after completing blood sampling on experimental day 2, DSAP and control rats were anesthetized and perfused transcardially with fixative as described below for rats used in experiment 4. Fixed brains were sectioned and processed for immunocytochemical analysis of DbH to qualitatively assess DSAP lesion extent.
Data analysis.
Three-way ANOVA was used for statistical comparisons of plasma corticosterone levels. Independent variables included lesion group (DSAP, intact control, or sham control), intraperitoneal treatment condition (YO vs vehicle) and time (baseline, 30, 60, and 90 min blood samples). When F values indicated significant main effects and/or interactions among experimental variables, the ANOVA was followed up with planned t comparisons of interest. Areas under the curve also were computed based on corticosterone levels over time within each experimental group. Differences were considered statistically significant when p < 0.05.
Experiment 4
Effect of DSAP lesions on the ability of YO to activate central Fos expression.
In a terminal experiment, DSAP (n = 22) and sham control rats (n = 14) used in behavioral experiment 1 or 2 received an intraperitoneal injection of YO (n = 12 DSAP; n = 5 sham) or 0.15 m NaCl vehicle (n = 10 DSAP; n = 9 sham) between 11:00 A.M. and 2:00 P.M. Rats were left undisturbed in their home cages for 90–120 min after intraperitoneal injection, then were deeply anesthetized with sodium pentobarbital (Nembutal, 100 mg/kg BW, i.p.) and transcardially perfused with a brief saline rinse followed by 500 ml of fixative (4% paraformaldehyde in 0.1 m phosphate buffer). Brains were postfixed in situ overnight at 4°C, then removed from the skull, blocked, and cryoprotected in 20% sucrose solution before sectioning.
Histology and immunocytochemistry.
Coronal 35-μm-thick tissue sections were cut from the caudal extent of the medullary dorsal vagal complex through the rostral extent of the corpus callosum using a freezing microtome. Sections were collected serially in six adjacent sets and stored at −20°C in cryopreservant (Watson et al., 1986). Sections were removed from storage and rinsed for 1 h in buffer (0.1 m sodium phosphate, pH 7.4) before immunocytochemical procedures. Antisera were diluted in buffer containing 0.3% Triton X-100 and 1% normal donkey serum. Biotinylated secondary antisera (Jackson Immunochemicals, West Grove, PA) were used at a dilution of 1:500.
Tissue sections were processed for immunocytochemical localization of Fos protein using a rabbit polyclonal antiserum (1:50,000; provided by Dr. Philip Larsen, Rheoscience, Røodovre, Denmark) and Vectastain Elite ABC immunoperoxidase reagents (Vector Laboratories, Burlingame, CA). The specificity of this antibody for Fos has been reported (Rinaman et al., 1997). Sections were processed using a nickel sulfate-intensified DAB reaction to generate a blue-black nuclear reaction product in Fos-positive cells. Adjacent sets of Fos-labeled tissue sections were subsequently processed for immunoperoxidase localization of the NA synthetic enzyme DbH using a monoclonal anti-DbH antibody (1:30,000; Millipore, Temecula, CA), and for cytoplasmic CRH using a polyclonal rabbit anti-CRH antiserum (1:15,000; Peninsula, Belmont, CA). DbH or CRH immunolabeling was visualized using a nonintensified DAB reaction to generate a brown cytoplasmic reaction product. One set of tissue sections from each rat used in experiment 3 (plasma corticosterone assays) was processed for single immunocytochemical localization of DbH to document lesion extent. After immunocytochemical processing, tissue sections were mounted onto Superfrost Plus microscope slides (Fisher Scientific, Houston, TX), allowed to dry overnight, dehydrated and defatted in graded ethanols and xylene, and coverslipped using Cytoseal 60 (VWR, West Chester, PA).
Quantification of Fos activation and DSAP lesion extent.
Dual immunoperoxidase-labeled tissue sections were analyzed with a light microscope to determine the number of DbH-positive medullary NA neurons in the DSAP (n = 22) and sham control rats (n = 14) used in experiments 1, 2, and 4. The proportion of NA neurons activated to express Fos after intraperitoneal YO or vehicle treatment also was determined. Criteria for counting a neuron as DbH-positive included the presence of brown cytoplasmic immunoreactivity and a visible nucleus. NA neurons thus identified were considered Fos-positive (i.e., activated) if their nucleus contained blue-black immunolabel, regardless of intensity, and Fos-negative if their nucleus was unlabeled. DbH-positive neurons were counted bilaterally in the NST and VLM using a 60× microscope objective. Counts of DbH-positive NST and VLM neurons were grouped according to three rostrocaudal levels defined with respect to the area postrema (AP): (1) sections caudal to the AP (cNST and cVLM; A2 and A1 cell groups, respectively); (2) sections through the level of the AP (mNST and mVLM; A2/C2 and A1/C1 cell groups, respectively); and (3) sections rostral to the AP (rNST and rVLM; C2 and C1 cell groups, respectively). Counts within the rNST and rVLM were discontinued at the rostrocaudal level at which the dorsal vagal complex moves laterally away from the floor of the fourth ventricle. Counts of DbH-positive NST and VLM neurons classified as Fos-positive or negative were summed at each rostrocaudal level and then averaged across the number of sections analyzed per level in each rat to obtain mean counts per section, and to compute the proportion of DbH neurons activated to express Fos within each region at each rostrocaudal level.
A subset of DSAP lesioned (n = 4) and sham control rats (n = 4) that received intraperitoneal YO treatment before perfusion were selected for additional quantitative analyses. The behavioral data obtained in experiments 1 or 2 from each of these eight cases were fully representative of the relevant experimental group, but these eight cases were selected for additional anatomical analysis based on their optimal forebrain tissue preservation and (for the DSAP rats) the relative completeness and bilaterality of their lesions. YO-induced Fos expression was quantified in the dorsolateral and ventrolateral BNST, CeA, and PVNmp. Brown cytoplasmic CRH immunolabeling was used to identify nuclear boundaries within the BNST and CeA, and Fos-positive cells were counted within those boundaries. Within the PVNmp, CRH-positive neurons that expressed nuclear Fos labeling were counted. The total number of Fos-positive neurons counted within each specified region in each animal was divided by the number of sections analyzed per animal to obtain group mean counts per section for each region.
Data analysis.
ANOVA was used for statistical comparisons of the numbers of DbH-positive medullary neurons, and the proportions of phenotypically identified neurons expressing Fos within each brain region. Independent variables for each ANOVA included lesion group (DSAP vs sham control), treatment condition (i.p. YO vs vehicle) and rostrocaudal level (for NST and VLM). When F values indicated significant main effects and/or interactions among experimental variables, ANOVAs were followed up with planned t comparisons of interest or with Fisher's LSD tests. Differences were considered statistically significant when p < 0.05.
Results
Postmortem analyses of DSAP lesion extent in brain tissue sections from rats used to assess the effects of YO treatment on behavior (experiments 1 and 2) and on the HPA axis (experiment 3) revealed that DSAP microinjected into the lateral BNST significantly and consistently reduced the number of DbH-positive neurons within the NST and VLM, and virtually eliminated DbH immunolabeling within the BNST injection site as well as within the PVNmp. These anatomical data are presented in more detail below, after presentation of the behavioral and plasma corticosterone results.
Experiment 1: effect of DSAP lesions on the ability of YO to inhibit food intake
DSAP and sham control rats were of similar body weight at the onset of food intake experiments (DSAP, 247.5 ± 3.1 g; sham, 251.3 ± 2.4 g). Repeated-measures ANOVA revealed a significant main effect of treatment (i.e., vehicle vs YO) on deprivation-induced food intake in both DSAP and sham control rats (F(1,14) = 39.18; p < 0.0001) (Table 1). The overall effect of lesion group (i.e., DSAP vs sham control) on food intake approached but did not reach statistical significance (F(1,14) = 4.05; p = 0.064). As expected, ANOVA revealed a significant effect of time on cumulative food intake (F(2,13) = 678.38; p < 0.0001). However, there was no significant interaction between lesion group and time (F(2,13) = 1.58; p = 0.243) or between intraperitoneal treatment and time (F(2,13) = 1.60; p = 0.239).
Table 1.
Food intake after intraperitoneal injection of vehicle versus YO treatment in DSAP and sham control rats
| Surgical group (n) | Treatment (i.p.) | Cumulative food intake (g); mean ± SE |
||
|---|---|---|---|---|
| 30 min | 60 min | 18 h | ||
| Sham controls (8) | Vehicle | 5.1 ± 0.3 | 6.5 ± 0.6 | 30.2 ± 1.5 |
| YO | 2.4 ± 0.5* | 3.9 ± 0.6* | 27.9 ± 0.9 | |
| DSAP (8) | Vehicle | 5.8 ± 0.5 | 8.0 ± 0.7 | 30.7 ± 1.0 |
| YO | 2.2 ± 0.5* | 3.2 ± 0.7* | 24.6 ± 1.4* | |
*Significantly less (p < 0.05) compared to intake by the same rats after vehicle treatment. Vehicle, 0.15 m NaCl; YO, 5.0 mg/kg BW.
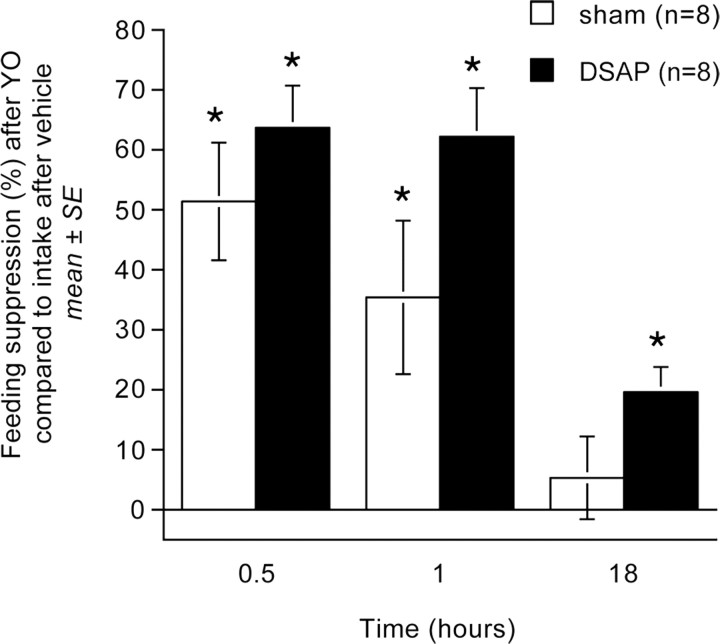
Post hoc t tests confirmed that YO treatment suppressed food intake significantly and to a similar extent in DSAP and sham control rats at the 30 and 60 min time points after food was returned (p < 0.01 at each time point within each lesion group) (Table 1; Fig. 1). In sham controls, cumulative food intake after YO treatment recovered to baseline (i.e., vehicle-treated) levels within 18 h after food was returned (Table 1, Fig. 1). In DSAP rats, cumulative food intake remained modestly but significantly suppressed at the 18 h time point after YO treatment compared with food intake by the same rats after vehicle treatment (p < 0.05) (Table 1). However, the magnitude of YO-induced feeding suppression at each time point did not differ significantly between DSAP and sham control rats (Fig. 1).
Figure 1.
Suppression of deprivation-induced food intake at three time points in sham control and DSAP rats after YO treatment (5.0 mg/kg BW, i.p.). Bars depict the magnitude of feeding suppression relative to intake by the same rats after deprivation and vehicle treatment (0.15 m NaCl, i.p.). YO-induced feeding suppression did not differ significantly between DSAP and sham control rats at any time point. *Significantly suppressed compared with intake at the same time point after vehicle treatment (p < 0.05). Error bars indicate SEM.
Experiment 2: effect of DSAP lesions on the ability of YO to support CFA
Rats consumed similar volumes of novel almond or vanilla flavored water during initial presentation on single-bottle CFA training days (12.4 ± 0.6 ml consumed on saline-paired day, 11. 9 ± 0.6 ml consumed on YO-paired day; range, 6–17 ml), with no significant effects of lesion group (DSAP vs sham) or flavor pairing order (vanilla plus vehicle followed by almond plus YO, or vice versa) on cumulative 15 or 30 min intakes.
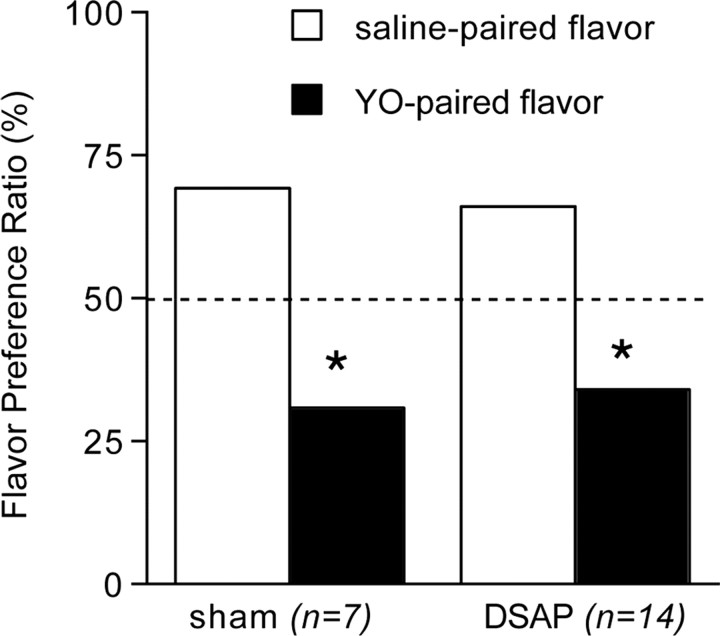
Repeated-measures ANOVA revealed a significant within-subjects difference between intake of saline-paired versus YO-paired flavors during the two-bottle choice test (F(1,20) = 20.99; p < 0.001), but no between-subjects effect of DSAP lesion (F(1,20) = 0.174; p = 0.682) (Fig. 2). In two-bottle choice tests, both groups of rats consumed significantly lower volumes of flavors previously paired with intraperitoneal YO (DSAP 6.1 ± 0.8 ml; sham 4.9 ± 1.0 ml) compared with intake of vehicle-paired flavors (DSAP 11.9 ± 0.9 ml; sham 11.3 ± 1.3 ml) (p < 0.01 for each group). The resulting flavor preference ratios of ∼70:30 (saline-paired:YO-paired) were similar in DSAP and sham control rats (Fig. 2).
Figure 2.
Average group preference ratios (mean ± SE) for novel flavors in two-bottle choice tests after flavors were previously paired with vehicle treatment (0.15 m NaCl, i.p.) or YO (5.0 mg/kg BW, i.p.). The dashed line indicates the expected preference ratio of 50%:50% if there was no effect of flavor pairing condition. Sham control and DSAP rats show a significantly lower preference for YO-paired flavors compared with vehicle-paired flavors. Error bars are too small to be visible. *Significantly reduced preference for YO-paired flavors compared with intake of saline-paired flavors (p < 0.05).
Experiment 3: effect of DSAP lesions on the ability of YO to increase plasma corticosterone
Baseline plasma corticosterone levels ranged from 18.7 to 61.0 ng/ml across animals (mean, 38.8 ± 3.1) and were not different between control versus DSAP rats or across treatment days (Fig. 3). ANOVA revealed no significant differences between intact control rats (n = 3) and sham control rats (n = 3) in their plasma corticosterone responses to intraperitoneal vehicle or YO treatment (p = 0.82) and so these data were combined to comprise a single control group of n = 6. Arterial blood samples could not be obtained from one of the six DSAP rats in this experiment, thereby reducing the DSAP group size to n = 5.
Figure 3.
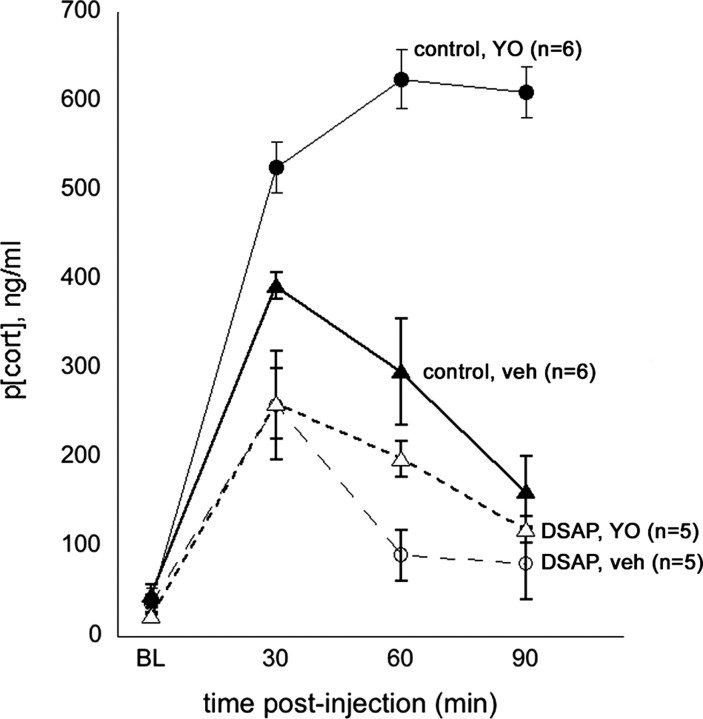
Plasma corticosterone levels (p[cort], ng/ml) measured at baseline (BL; preinjection) and at three subsequent time points (i.e., 30, 60, and 90 min) after intraperitoneal injection of 0.15 m NaCl vehicle (veh) or after intraperitoneal YO (5 mg/kg BW) in control rats (n = 6; solid symbols) and in DSAP rats (n = 5; open symbols). Symbols represent averaged group data (mean ± SE).
Computed area under the curve (AUC) values were as follows (group mean ± SE): control rats, vehicle treatment, 24,052.3 ± 296.0; control rats, YO treatment, 44,290.0 ± 658.6; DSAP rats, vehicle treatment, 16,131.3 ± 971.4; DSAP rats, YO treatment, 16,578.3 ± 1098.6. ANOVA revealed significant main effects of surgical group (DSAP vs control; F(1,10) = 317.6; p < 0.001) and intraperitoneal treatment (vehicle vs YO; F(1,10) = 547.5; p < 0.001) and a significant interaction between surgical group and intraperitoneal treatment (F(1,10) = 501.2; p < 0.001) on plasma corticosterone levels (AUC). In control rats, intraperitoneal injection of vehicle alone produced a significant increase in plasma corticosterone levels that peaked at 30 min and subsequently declined over the 90 min sampling period. YO injections in the same control rats promoted significantly greater elevations in plasma corticosterone levels that peaked at the 60 min postinjection time point, with no decline toward baseline evident within the 90 min period sampling period (Fig. 3).
Compared with responses in control rats, DSAP rats were characterized by significantly attenuated corticosterone levels after both intraperitoneal vehicle and intraperitoneal YO injections (p < 0.05 compared with control rats for each intraperitoneal treatment) (Fig. 3). Plasma corticosterone levels did increase significantly in DSAP rats after intraperitoneal injections, but the vehicle- and YO-induced increases were of similar magnitude in DSAP rats at the 30 and 90 min time points and were significantly attenuated compared with increases at the same time points in control rats (Fig. 3). Corticosterone levels were higher in DSAP rats after YO compared with vehicle treatment at only the 60 min time point (p < 0.05).
Experiment 4: effect of DSAP lesions on DbH immunolabeling and the ability of YO to activate Fos expression
BNST
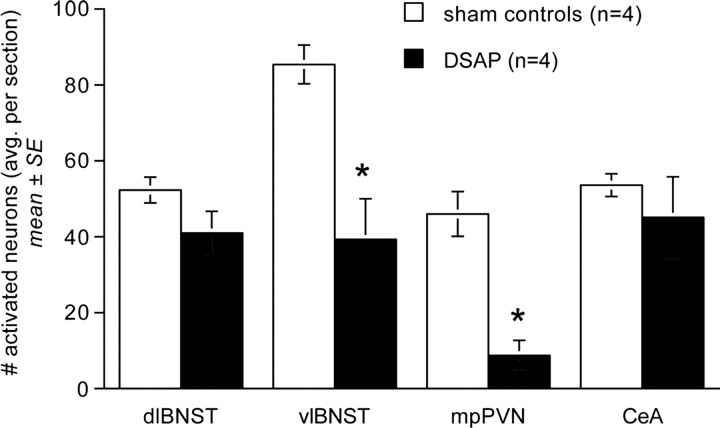
DSAP rats displayed a marked loss of DbH terminal labeling within the dorsolateral (dl) and ventrolateral (vl) BNST (Fig. 4). The ability of YO to activate Fos expression in BNST neurons was quantified in a selected subset of rats (n = 4 DSAP; n = 4 sham controls) using tissue sections double labeled for Fos and CRH combined with consultation of a rat brain atlas to ensure sampling of similar BNST subregions. YO activated Fos expression in an average of 41.0 ± 5.7 BNSTdl neurons per section in DSAP rats, compared with 52.3 ± 3.4 BNSTdl neurons per section in sham controls (Fig. 5); these values were not significantly different (p < 0.05). Conversely, Fos activation in the BNSTvl was significantly attenuated in DSAP rats (39.3 ± 10.7 neurons per section) compared with BNSTvl activation in sham controls (85.4 ± 5.1 neurons per section; p < 0.05) (Figs. 5, 6).
Figure 4.
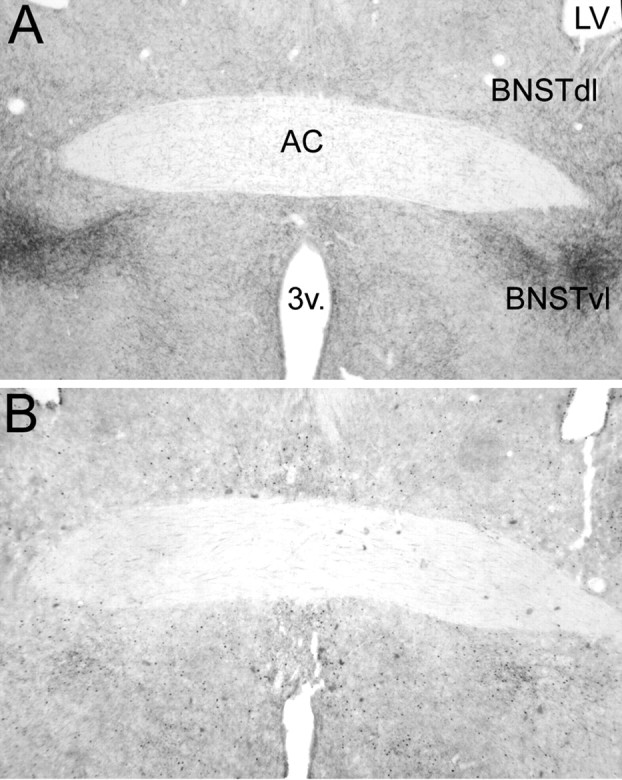
Representative low-magnification photomicrographs of dual DbH and Fos immunolabeling within the BNSTdl and BNSTvl. A, Sham control rat treated intraperitoneally with vehicle. B, DSAP rat treated intraperitoneally with YO. AC, Anterior commissure; 3v, third ventricle; LV, lateral ventricle. See Figure 6 for a higher-magnification view of YO-induced Fos immunolabeling within the BNSTvl.
Figure 5.
Comparison of YO-induced Fos expression within the BNST (dl and vl), PVNmp, and CeA in sham control and DSAP rats. *Significantly fewer activated neurons than in sham controls (p < 0.05).
Figure 6.
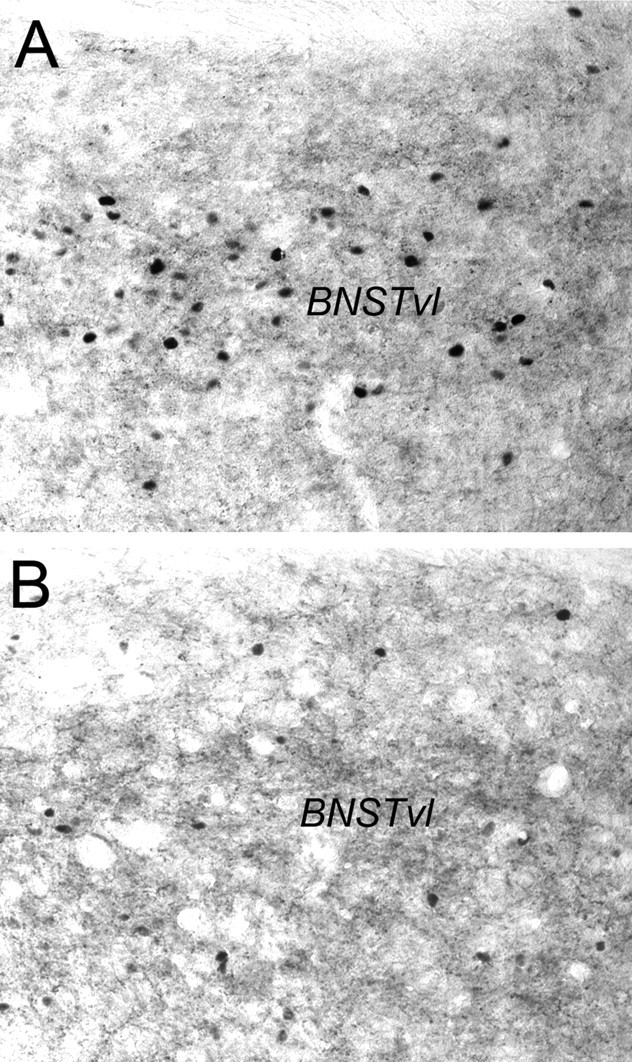
Representative photomicrographs of dual CRH and Fos immunolabeling within the BNSTvl. A, Sham control rat treated intraperitoneally with YO. B, DSAP rat treated intraperitoneally with YO. See Figure 4 for regional orientation.
PVN
DSAP rats displayed a clear loss of terminal DbH labeling within the PVNmp, whereas DbH immunolabeling within the lateral magnocellular (lm) PVN was relatively unaffected (Fig. 7). The ability of YO to activate CRH-positive PVNmp neurons (Myers et al., 2005) was quantified in a selected subset of rats (n = 4 DSAP; n = 4 sham controls). YO treatment activated Fos expression in an average of 46.0 ± 5.9 CRH-positive PVNmp neurons per section in sham controls, but in only 8.7 ± 4.0 CRH-positive PVNmp neurons per section in DSAP rats. These values were significantly different (p < 0.05) (Figs. 5, 8).
Figure 7.
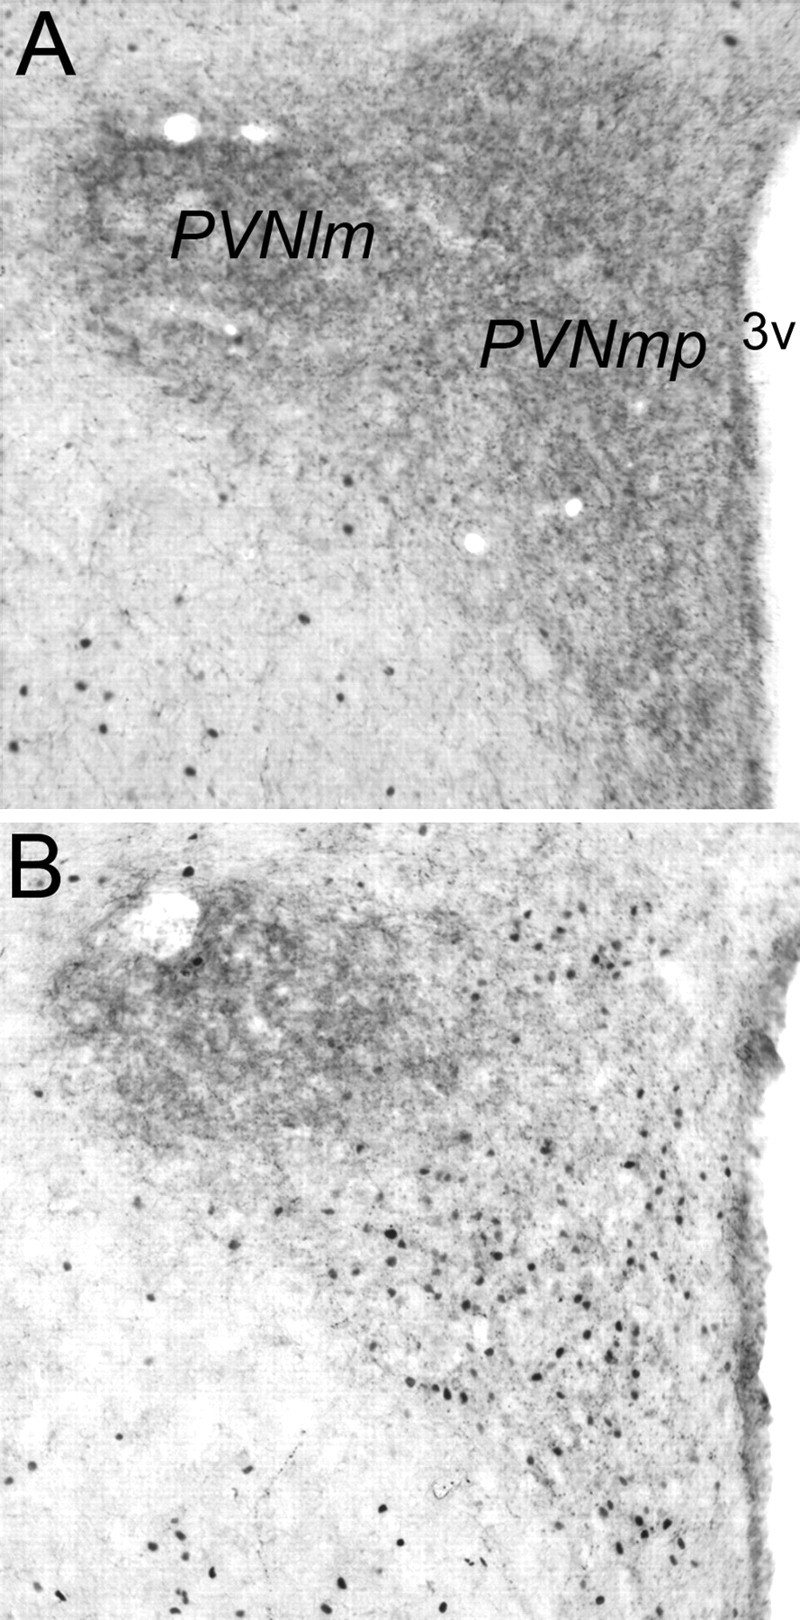
Representative photomicrographs of dual DbH and Fos immunolabeling within the PVN (lm, lateral magnocellular subdivision; mp, medial parvocellular subdivision). A, Sham control rat treated intraperitoneally with vehicle. B, DSAP rat treated intraperitoneally with YO. 3v, Third ventricle.
Figure 8.
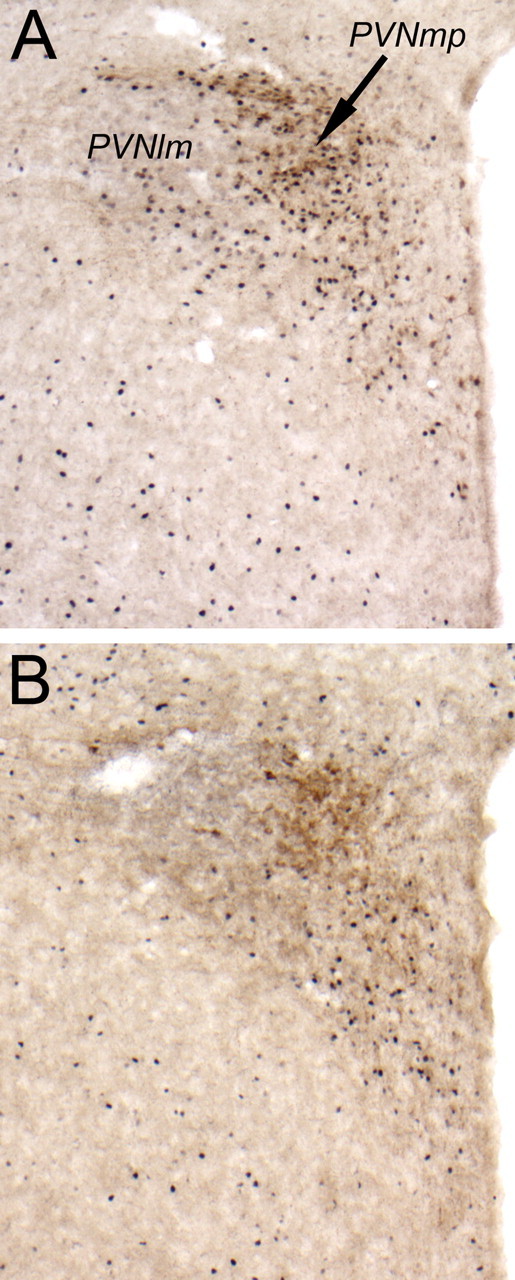
Representative color photomicrographs of dual CRH and Fos immunolabeling within the PVN (lm, lateral magnocellular subdivision; mp, medial parvocellular subdivision). A, Sham control rat treated intraperitoneally with YO. B, DSAP rat treated intraperitoneally with YO. 3v, Third ventricle.
PBN and CeA
DbH immunolabeling within the pontine PBN was moderately dense in both DSAP rats and sham controls, with no differences evident between groups (Fig. 9). DbH immunolabeling was relatively sparse within the CeA in both surgical groups, and appeared somewhat diminished in DSAP rats relative to sham controls (data not shown). Quantitative analysis of CeA Fos expression in a selected subset of rats (n = 4 DSAP; n = 4 sham control) using tissue sections double labeled for Fos and CRH to ensure similar regional sampling confirmed that DSAP lesions had no significant effect on YO-induced CeA activation (Figs. 5, 9). YO activated Fos expression in an average of 45.1 ± 10.7 CeA neurons per section in DSAP rats, and in an average of 53.6 ± 3.0 CeA neurons per section in sham controls, values that were not significantly different (p = 0.48) (Fig. 5). DSAP lesions did not appear to attenuate YO-induced Fos expression in the lateral PBN (Fig. 9), although PBN Fos labeling was not quantified because of frequent loss of tissue sections at the pontine tissue block sectioning interface.
Figure 9.
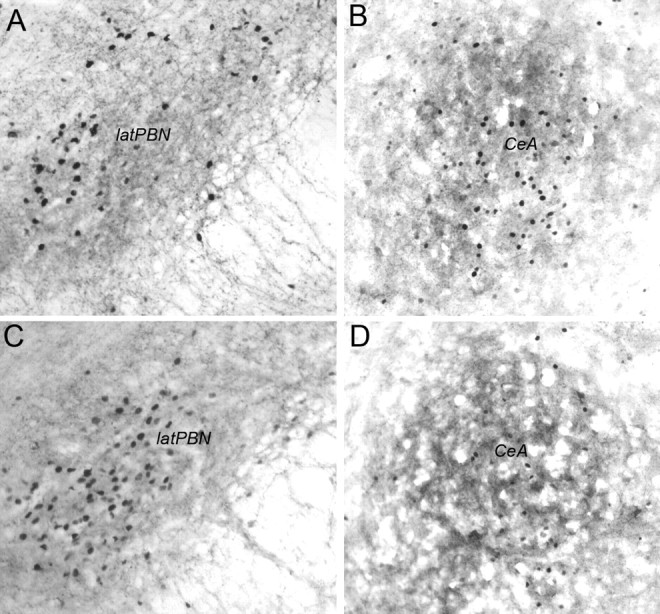
Representative photomicrographs of dual DbH and Fos immunolabeling in the lateral PBN (A, C) and dual CRH and Fos immunolabeling in the CeA (B, D). A, B, Sham control rat treated intraperitoneally with YO. C, D, DSAP rat treated intraperitoneally with YO. latPBN, Lateral parabrachial nucleus.
NST and VLM
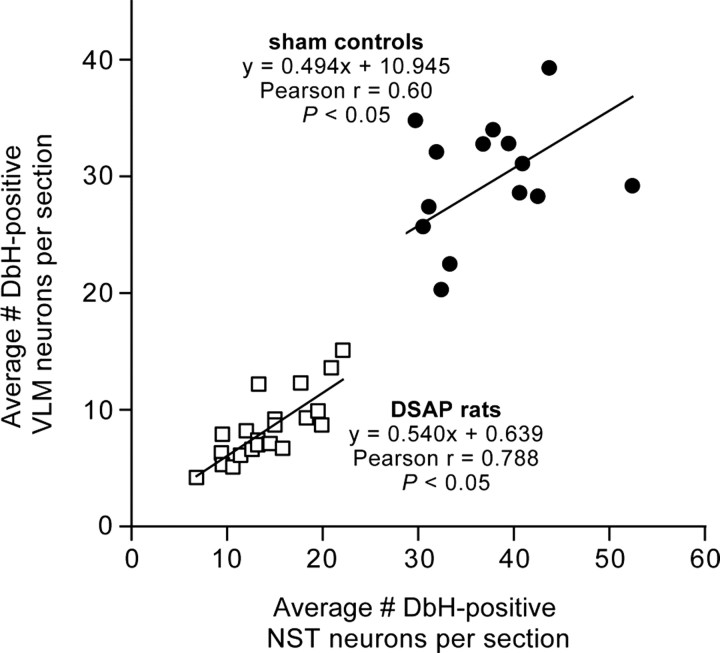
ANOVA revealed a significant main effect of DSAP lesions to reduce the number of DbH-positive NA neurons within the NST and VLM (F(1,34) = 288.72; p < 0.0001). DSAP lesions reduced the number of NA neurons within the NST and VLM by ∼59 and 69%, respectively, compared with counts in sham controls (Table 2, Fig. 10). The loss of NA neurons in DSAP rats was most pronounced at levels caudal to the AP (i.e., cNST and cVLM) (Table 2), but reductions were significant at all three rostrocaudal levels analyzed (p < 0.001 for each level). The average numbers of DbH-positive NST and VLM neurons counted per section in each rat were positively and significantly correlated within both sham and DSAP groups (Fig. 11), evidence that DSAP lesions affected both populations of medullary NA neurons in a proportional manner.
Table 2.
DSAP lesion effect on counts of DbH-positive NST and VLM neurons
| Medullary region | Number of DbH-positive NA neurons (average per section) |
Loss of NA neurons in DSAP rats compared with sham controls |
|
|---|---|---|---|
| Sham (n = 14) | DSAP (n = 22) | ||
| cNST | 23.6 ± 1.2 | 7.1 ± 0.6* | 69.9 ± 2.7% |
| mNST | 45.7 ± 3.4 | 20.0 ± 1.6* | 56.1 ± 3.4% |
| rNST | 47.1 ± 4.0 | 24.5 ± 2.2* | 47.9 ± 4.7% |
| Total NST | 37.4 ± 1.7 | 14.3 ± 0.9* | 58.9 ± 2.5% |
| cVLM | 24.4 ± 1.6 | 6.5 ± 0.5* | 73.5 ± 2.0% |
| mVLM | 30.2 ± 1.8 | 9.1 ± 0.9* | 70.0 ± 2.9% |
| rVLM | 37.7 ± 1.7 | 13.2 ± 1.2* | 64.9 ± 3.2% |
| Total VLM | 29.9 ± 1.3 | 8.4 ± 0.6* | 69.2 ± 2.2% |
*Significantly less compared to NA cell counts in the same medullary region in sham controls (p < 0.001).
Figure 10.
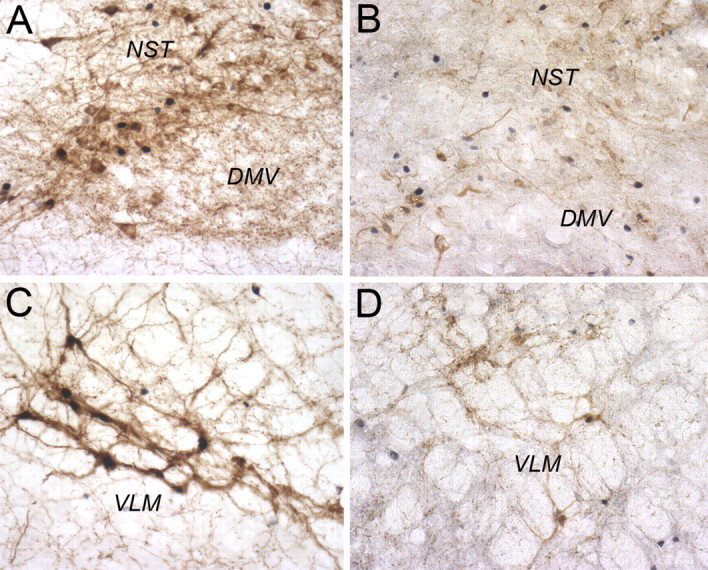
Representative color photomicrographs of dual DbH and Fos immunolabeling within the dorsomedial medulla (A, B) and VLM (C, D) at the rostrocaudal level of the area postrema. A, C, Sham control rat treated intraperitoneally with YO. B, D, DSAP rat treated intraperitoneally with YO. DMV, Dorsal motor nucleus of the vagus.
Figure 11.
Scatter plot showing correlations between counts of DbH-positive NA neurons within the VLM and NST in sham control and DSAP rats. Symbols represent individual rats.
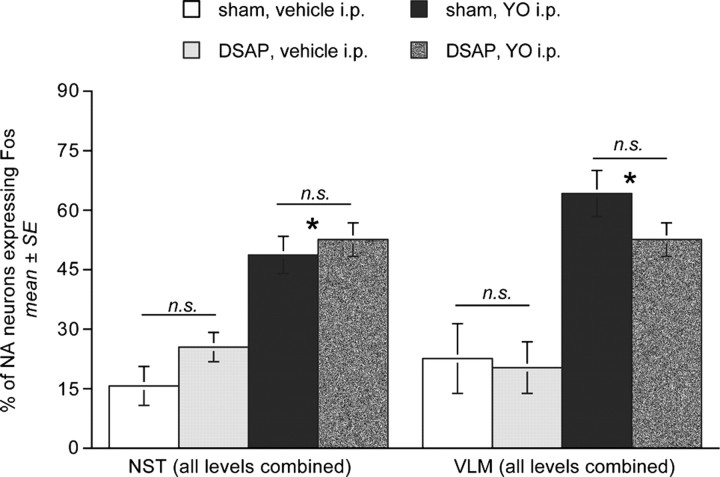
As expected, the loss of medullary NA neurons led to fewer absolute numbers of activated (i.e., Fos-positive) NA neurons within the NST and VLM in DSAP rats compared with sham controls after YO. Nevertheless, the overall proportions of medullary NA neurons activated in DSAP rats after YO treatment were statistically similar to the proportions activated after YO treatment in sham controls (F(1,29) = 0.01; p = 0.926) (Table 3, Fig. 12). In both groups of rats, ANOVA revealed a significant between-subjects effect of final treatment (i.e., YO vs vehicle) on the proportion of medullary NA neurons activated to express Fos within the NST (F(1,35) = 62.38; p < 0.001) and within the VLM (F(1,35) = 29.35; p < 0.001) (Table 3, Fig. 12). Post hoc t tests confirmed that YO significantly activated similar proportions of NA neurons at each rostrocaudal level of the NST and VLM in DSAP and sham control rats (Table 3), despite the overall reduced number of NA neurons in DSAP rats (Table 2). Only one significant difference in medullary NA activation was identified between lesion groups: after intraperitoneal vehicle treatment, a greater proportion of the NA neurons remaining within the caudal NST expressed Fos in DSAP rats compared with sham controls (Table 3).
Table 3.
Effect of DSAP lesions on YO-induced Fos activation of DbH-positive NST and VLM neurons
| Medullary region | Intraperitoneal treatment |
Sham controls (n = 9 vehicle; n = 5 YO) |
DSAP rats (n = 10 vehicle; n = 12 YO) |
|---|---|---|---|
| % NA neurons expressing Fos | |||
| cNST | Vehicle | 19.0 ± 6.2 | 48.9 ± 5.8*** |
| YO | 60.7 ± 7.0* | 76.8 ± 2.2** | |
| mNST | Vehicle | 15.6 ± 4.8 | 23.6 ± 3.6 |
| YO | 45.3 ± 4.5* | 53.0 ± 3.0** | |
| rNST | Vehicle | 10.8 ± 4.7 | 8.5 ± 2.9 |
| YO | 45.1 ± 4.8* | 38.8 ± 3.2** | |
| cVLM | Vehicle | 20.3 ± 8.2 | 18.9 ± 5.7 |
| YO | 61.1 ± 8.0* | 52.0 ± 6.1** | |
| mVLM | Vehicle | 25.2 ± 9.1 | 21.0 ± 7.5 |
| YO | 64.6 ± 5.0* | 48.9 ± 3.5** | |
| rVLM | Vehicle | 22.9 ± 8.8 | 11.8 ± 4.7 |
| YO | 64.9 ± 9.8* | 58.7 ± 5.4** |
Vehicle, 0.15 m NaCl; YO, 5.0 mg/kg BW.
*Significantly greater than NA activation in the same medullary region in sham controls after vehicle treatment (p < 0.05).
**Significantly greater than NA activation in the same medullary region in DSAP rats after vehicle treatment (p < 0.05).
***Significantly greater than NA activation within the cNST in sham control rats after vehicle treatment (p < 0.05).
Figure 12.
Similar proportions of DbH-immunopositive NA neurons present within the NST and VLM are activated to express Fos in sham control and DSAP rats after YO treatment. All three analyzed levels of the NST and VLM are combined (for breakdown by rostrocaudal level, see Table 3). *Significantly more activation in both surgical groups after YO treatment compared with activation after intraperitoneal vehicle (p < 0.05). n.s., No significant difference between surgical groups.
The DSAP and control rats used in experiment 3 (plasma corticosterone assays) were not included in the Fos analyses described above. However, tissue sections from these rats were processed for DbH immunoperoxidase labeling to qualitatively confirm DSAP-induced lesions. The six control rats (n = 3 intact; n = 3 sham control) included in experiment 3 each displayed the expected robust pattern of DbH fiber labeling within the BNST and PVN and of cellular labeling within the NST and VLM. Each of the six DSAP rats used in experiment 3 (only five of which contributed arterial blood samples) displayed a marked bilateral loss of DbH fiber immunolabeling within the BNST and PVN accompanied by clear reductions in the number of DbH-positive NST and VLM neurons, as reported above for the DSAP rats assessed in experiment 4.
Discussion
We reported previously that systemic YO suppresses food intake, supports CFA, activates hypothalamic and limbic regions that receive NA inputs, activates NA neurons within the NST and VLM that project to the BNST and CeA, and activates CRH-positive PVNmp neurons in rats (Myers et al., 2005). Because activation of medullary NA inputs to the lateral BNST was especially striking in that study, we sought to determine the extent to which behavioral and central neural activation responses to YO depend on these NA inputs. Our new findings support five main conclusions.
Axon collaterals arising from BNST-projecting NA neurons provide most of the NA innervation of the PVNmp
DSAP lesions targeting the lateral BNST produced a nearly complete loss of NA terminals within not only the DSAP injection site, but also within the PVNmp. Thus, at least a subset of BNST-projecting NA neurons have axon collaterals that innervate the PVNmp. Collateralized NA projections from caudal VLM neurons (A1 cell group) to the PVN and BNSTvl have been reported previously (Woulfe et al., 1990). The extent of collateralization was not quantified in that study, but appeared to be less extensive than what might be predicted based on the present findings. It is possible that the extent of collateralized projections is greater for NA neurons of the NST than of the VLM.
NA terminals occupying the PVNlm remained relatively intact in DSAP rats, despite concurrent marked depletion of NA terminals within the lateral BNST and PVNmp. This observation complements previous evidence that magnocellular and parvocellular PVN subdivisions are differentially innervated by NA inputs arising from the VLM and NST, respectively (Cunningham and Sawchenko, 1988), and provides new evidence that most NA inputs to the PVNlm arise from neurons that do not also project to either the lateral BNST or the PVNmp.
DSAP lesions do not attenuate hypophagic responses to YO treatment
The BNST has been implicated in stress-related hypophagia (Erb and Stewart, 1999; Koob, 1999; Roozendaal et al., 2002; Winsky-Sommerer et al., 2004). Systemic YO activates Fos in CRF-rich regions of the BNST (present study; Myers et al., 2005), and CRF acts within the BNST to inhibit food intake (Ciccocioppo et al., 2003). The BNST projects to feeding-related hypothalamic regions, including the PVN (Swanson, 2000; Dong et al., 2001a; Dong and Swanson, 2003, 2004). In the present study, however, DSAP rats remained quite sensitive to the hypophagic effect of systemic YO, evidence that NA inputs that recruit neural activation within the lateral BNST and PVNmp are not necessary for this effect.
Another DSAP study revealed that NA neurons within the NST are required for systemic cholecystokinin (CCK) to inhibit food intake (Rinaman, 2003). Although many of these NA NST neurons project to the PVN (Sawchenko and Swanson, 1981, 1982), these ascending projections are unnecessary for CCK hypophagia (Ritter et al., 2001). Considered together with the present findings, these results support the view that NST NA neurons that are necessary for CCK hypophagia do not project to the PVN and/or BNST; instead, they may project locally within the medulla and/or to other central sites. The same population of medullary NA neurons may also be necessary for YO-induced hypophagia, but this remains to be determined.
DSAP lesions do not reduce the ability of YO to support conditioned flavor avoidance
The CFA paradigm is based on the proclivity of rats to avoid ingesta previously associated with an aversive experience. Systemic YO is aversive to rats, as evidenced by a CFA response to flavors previously paired with YO treatment (Myers et al., 2005). The BNST and PVNmp have not been implicated in the ability of rats to learn or express CFA. However, NA signaling within the BNST is involved in other types of aversive conditioning (Schweimer et al., 2005). For example, blockade of NA receptors in the BNST reduces place avoidance conditioned by precipitated opiate withdrawal, evidence that NA acts within the BNST to promote the aversiveness of withdrawal and/or to promote learning based on the aversive experience (File, 1986; Aston-Jones et al., 1999; Delfs et al., 2000). Conditioned place avoidance also occurs after systemic YO (File, 1986), and so we hypothesized that BNST DSAP lesions would suppress the ability of YO to promote avoidance behavior in the form of CFA. This hypothesis was not supported by our results, as DSAP rats expressed a normally robust CFA response to YO-paired flavors.
A wealth of evidence indicates that CFA requires the pontine PBN, the CeA, and connections between them (Lasiter and Glanzman, 1985; Sakai and Yamamoto, 1998, 1999). The ability of YO to support CFA similarly in DSAP and sham control rats may relate to our finding that DSAP lesions did not alter YO-induced Fos expression within the CeA and did not appear to affect Fos expression within the PBN. DbH immunolabeling within the PBN was not noticeably altered in DSAP rats, suggesting that NA inputs to the PBN arise from neurons that do not also innervate the lateral BNST. DSAP lesions also did not attenuate YO-induced Fos expression within the CeA, evidence that remaining NA and/or other chemical signaling pathways are sufficient for activation of this limbic region.
NA inputs are necessary for systemic YO to activate Fos expression within CRH-rich regions of the BNSTvl and PVNmp
YO treatment increases extracellular norepinephrine (NE) levels and activates Fos expression in the medulla, hypothalamus, CeA, and BNST (Tsujino et al., 1992; Khoshbouei et al., 2002; Singewald et al., 2003). CRH immunolabeling was not affected by DSAP lesions, but DSAP significantly attenuated the previously reported ability of YO to activate neural Fos expression within CRH-rich regions of the lateral BNST and PVNmp (Myers et al., 2005). Thus, BNST and PVN Fos responses to YO treatment apparently require NA signaling in these regions. It is important to keep in mind, however, that other endogenous neurotransmitter chemicals are costored and released along with NE to modulate its physiological effects (Khoshbouei et al., 2002). Loss of these additional neurochemical transmitters from NA terminals may have contributed to DSAP-related effects.
In nonlesioned rats, YO-induced Fos expression within the BNST could result, in part, from direct neural effects of increased local NE signaling, including alterations of local GABAergic or glutamatergic tone (Alden et al., 1994; Dumont and Williams, 2004). The neural effects of NE within the BNST differ by subregion, as do the excitable properties of intrinsic BNST neurons (Egli and Winder, 2003; Dumont and Williams, 2004; Egli et al., 2005). DSAP lesions attenuated YO-induced increases in Fos expression in the BNSTvl, but not in the BNSTdl. The BNSTdl receives a moderate NA input that arises primarily from the locus ceruleus (A6 cell group), whereas the BNSTvl receives a dense NA input that arises primarily from the NST (A2 cell group) and VLM (A1 cell group) (Jones and Yang, 1985; Aston-Jones et al., 1999). Fos expression in the BNSTdl in DSAP rats potentially could be maintained by YO-induced activation of other signaling pathways, including CGRP-positive inputs from the PBN, which project heavily to the dorsal lateral BNST (Alden et al., 1994; Kozicz and Arimura, 2001), GLP-1 inputs from the NST (Merchenthaler et al., 1999), and/or inputs from the CeA (Dong et al., 2001b).
NA inputs are necessary for systemic YO to increase plasma corticosterone levels
YO generated large and sustained increases in plasma corticosterone levels in intact and sham control rats, as expected given the robust YO-induced Fos expression in the BNSTvl and in CRH-positive PVNmp neurons in sham controls in experiment 4. Because DSAP lesions significantly attenuated YO-induced Fos activation within CRH-rich regions of the BNSTvl and PVNmp, it was not surprising that they also significantly attenuated the ability of YO to elevate plasma corticosterone. HPA axis responses to intraperitoneal vehicle also were attenuated in DSAP rats compared with controls; however, intraperitoneal injections in DSAP rats still produced modest but significant increases in corticosterone above baseline levels. The residual HPA axis responses in DSAP rats could be caused by incompleteness of bilateral lesions and/or effects mediated by other intact neural pathways.
Together, these findings support the view that YO-induced activation of the HPA axis depends mainly on NA inputs to the PVNmp and/or BNSTvl that recruit activation of CRH neurons in the PVNmp. These data are consistent with findings that chemical lesions of the BNSTvl attenuate the ability of systemic IL-1β to activate Fos expression within the PVNmp and increase plasma ACTH (Crane et al., 2003). In addition to its direct NA input, the PVNmp receives a dense projection from neurons within the same BNSTvl region (Dong et al., 2001a) that is heavily innervated by medullary NA neurons. It is unclear whether the diminished PVNmp Fos response to YO in DSAP rats is caused by loss of direct NA inputs to the PVN, loss of NA inputs to the BNST, or both. Alternatively, or in addition, DSAP lesions could have affected neural processing in other brain regions that regulate the activity of PVNmp CRH neurons (Herman et al., 2005).
Previous studies have implicated NA inputs to the BNST in various physiological and behavioral responses to anxiogenic, stressful, and aversive stimuli (Aston-Jones et al., 1999; Delfs et al., 2000; Cecchi et al., 2002a,b; Fendt et al., 2005; Schweimer et al., 2005). Our new findings indicate that NA inputs to the BNST collateralize to provide most of the NA innervation of the PVNmp, and that these inputs are necessary for YO to activate neural Fos expression in the BNST and PVNmp and to increase plasma corticosterone. Conversely, NA inputs to the same regions are unnecessary for YO to inhibit food intake or to support CFA, implicating other neural pathways in those effects. Collectively, these findings provide new evidence for anatomical and functional dissociations among behavioral and physiological responses to YO.
Footnotes
This work was supported by National Institutes of Health Grant MH59911. We thank Victoria Maldovan for technical assistance and Dr. Thomas Koehnle for expert advice on statistical analyses. We especially thank Teresa Cox for generating cases used for arterial blood sampling and plasma corticosterone assays. Parts of this paper have been presented previously in abstract form at the Society for Neuroscience Annual Meeting 2004, San Diego, California; Neuroendocrinology of Stress Workshop 2005, San Diego, California; and Society for the Study of Ingestive Behavior 2005, Pittsburgh, Pennsylvania.
References
- Alden M, Besson JM, Bernard JF. Organization of the efferent projections from the pontine parabrachial area to the bed nucleus of the stria terminalis and neighboring regions: a PHA-L study in the rat. J Comp Neurol. 1994;341:289–314. doi: 10.1002/cne.903410302. [DOI] [PubMed] [Google Scholar]
- Aston-Jones G, Delfs JM, Druhan J, Zhu Y. The bed nucleus of the stria terminalis: a target site for noradrenergic actions in opiate withdrawal. Ann NY Acad Sci. 1999;877:486–498. doi: 10.1111/j.1749-6632.1999.tb09284.x. [DOI] [PubMed] [Google Scholar]
- Baldwin HA, Johnston AL, File SE. Antagonistic effects of caffeine and yohimbine in animal tests of anxiety. Eur J Pharmacol. 1989;159:211–215. doi: 10.1016/0014-2999(89)90709-7. [DOI] [PubMed] [Google Scholar]
- Callahan MF, Beales M, Oltmans GA. Yohimbine and rauwolscine reduce food intake of genetically obese (ob/ob) and lean mice. Pharmacol Biochem Behav. 1984;20:591–599. doi: 10.1016/0091-3057(84)90309-5. [DOI] [PubMed] [Google Scholar]
- Cecchi M, Khoshbouei H, Morilak DA. Modulatory effects of norepinephrine, acting on alpha1 receptors in the central nucleus of the amygdala, on behavioral and neuroendocrine responses to acute immobilization stress. Neuropharmacology. 2002a;43:1139–1147. doi: 10.1016/s0028-3908(02)00292-7. [DOI] [PubMed] [Google Scholar]
- Cecchi M, Khoshbouei H, Javors M, Morilak DA. Modulatory effects of norepinephrine in the lateral bed nucleus of the stria terminalis on behavioral and neuroendocrine responses to acute stress. Neuroscience. 2002b;112:13–21. doi: 10.1016/s0306-4522(02)00062-3. [DOI] [PubMed] [Google Scholar]
- Charney DS, Heninger GR, Redmond DE., Jr Yohimbine induced anxiety and increased noradrenergic function in humans: effects of diazepam and clonidine. Life Sci. 1983;33:19–29. doi: 10.1016/0024-3205(83)90707-5. [DOI] [PubMed] [Google Scholar]
- Charney DS, Woods SW, Heninger GR. Noradrenergic function in generalized anxiety disorder: effects of yohimbine in healthy subjects and patients with generalized anxiety disorder. Psychiatry Res. 1989;27:173–182. doi: 10.1016/0165-1781(89)90132-7. [DOI] [PubMed] [Google Scholar]
- Ciccocioppo R, Fedeli A, Economidou D, Policani F, Weiss F, Massi M. The bed nucleus is a neuroanatomical substrate for the anorectic effect of corticotropin-releasing factor and for its reversal by nociceptin/orphanin FQ. J Neurosci. 2003;23:9445–9451. doi: 10.1523/JNEUROSCI.23-28-09445.2003. [DOI] [PMC free article] [PubMed] [Google Scholar]
- Crane JW, Buller KM, Day TA. Evidence that the bed nucleus of the stria terminalis contributes to the modulation of hypophysiotropic corticotropin-releasing factor cell responses to systemic interleukin-1b. J Comp Neurol. 2003;467:232–242. doi: 10.1002/cne.10918. [DOI] [PubMed] [Google Scholar]
- Cunningham ET, Jr, Sawchenko PE. Anatomical specificity of noradrenergic inputs to the paraventricular and supraoptic nuclei of the rat hypothalamus. J Comp Neurol. 1988;274:60–76. doi: 10.1002/cne.902740107. [DOI] [PubMed] [Google Scholar]
- Delfs JM, Zhu Y, Druhan JP, Aston-Jones G. Noradrenaline in the ventral forebrain is critical for opiate withdrawal-induced aversion. Nature. 2000;403:430–434. doi: 10.1038/35000212. [DOI] [PubMed] [Google Scholar]
- Deutsch JA, Hardy WT. Cholecystokinin produces bait shyness in rats. Nature. 1977;266:196. doi: 10.1038/266196a0. [DOI] [PubMed] [Google Scholar]
- Dong HW, Swanson LW. Projections from the rhomboid nucleus of the bed nuclei of the stria terminalis: implications for cerebral hemisphere regulation of ingestive behaviors. J Comp Neurol. 2003;463:434–472. doi: 10.1002/cne.10758. [DOI] [PubMed] [Google Scholar]
- Dong HW, Swanson LW. Organization of axonal projections from the anterolateral area of the bed nucleus of the stria terminalis. J Comp Neurol. 2004;468:277–298. doi: 10.1002/cne.10949. [DOI] [PubMed] [Google Scholar]
- Dong HW, Petrovich GD, Watts AG, Swanson LW. Basic organization of projections from the oval and fusiform nuclei of the bed nuclei of the stria terminalis in adult rat brain. J Comp Neurol. 2001a;436:430–455. doi: 10.1002/cne.1079. [DOI] [PubMed] [Google Scholar]
- Dong HW, Petrovich GD, Swanson LW. Topography of projections from amygdala to bed nuclei of the stria terminalis. Brain Res Brain Res Rev. 2001b;38:192–246. doi: 10.1016/s0165-0173(01)00079-0. [DOI] [PubMed] [Google Scholar]
- Dumont EC, Williams JT. Noradrenaline triggers GABAA inhibition of bed nucleus of the stria terminalis neurons projecting to the ventral tegmental area. J Neurosci. 2004;24:8198–8204. doi: 10.1523/JNEUROSCI.0425-04.2004. [DOI] [PMC free article] [PubMed] [Google Scholar]
- Egli RE, Winder DG. Dorsal and ventral distribution of excitable and synaptic properties of neurons of the bed nucleus of the stria terminalis. J Neurophysiol. 2003;90:405–414. doi: 10.1152/jn.00228.2003. [DOI] [PubMed] [Google Scholar]
- Egli RE, Kash TL, Choo K, Savchenko V, Matthews RT, Blakely RD, Winder DG. Norepinephrine modulates glutamatergic transmission in the bed nucleus of the stria terminalis. Neuropsychopharmacology. 2005;30:657–668. doi: 10.1038/sj.npp.1300639. [DOI] [PubMed] [Google Scholar]
- Erb S, Stewart J. A role for the bed nucleus of the stria terminalis, but not the amygdala, in the effects of corticotropin-releasing factor on stress-induced reinstatement of cocaine seeking. J Neurosci. 1999;19:RC35. doi: 10.1523/JNEUROSCI.19-20-j0006.1999. [DOI] [PMC free article] [PubMed] [Google Scholar]
- Fendt M, Siegl S, Steiniger-Brach B. Noradrenaline transmission within the ventral bed nucleus of the stria terminalis is critical for fear behavior induced by trimethylthiazoline, a component of fox odor. J Neurosci. 2005;25:5998–6004. doi: 10.1523/JNEUROSCI.1028-05.2005. [DOI] [PMC free article] [PubMed] [Google Scholar]
- File SE. Aversive and appetitive properties of anxiogenic and anxiolytic agents. Behav Brain Res. 1986;21:189–194. doi: 10.1016/0166-4328(86)90236-6. [DOI] [PubMed] [Google Scholar]
- Forray MI, Bustos G, Gysling K. Regulation of norepinephrine release from the rat bed nucleus of the stria terminalis: in vivo microdialysis studies. J Neurosci Res. 1997;50:1040–1046. doi: 10.1002/(SICI)1097-4547(19971215)50:6<1040::AID-JNR15>3.0.CO;2-8. [DOI] [PubMed] [Google Scholar]
- Herman JP, Ostrander MM, Mueller NK, Figueiredo H. Limbic system mechanisms of stress regulation: hypothalamo-pituitary-adrenocortical axis. Prog Neuropsychopharmacol Biol Psychiatry. 2005;29:1201–1213. doi: 10.1016/j.pnpbp.2005.08.006. [DOI] [PubMed] [Google Scholar]
- Ippoliti R, Lendaro E, Bellelli A, Brunori M. A ribosomal protein is specifically recognized by saporin, a plant toxin which inhibits protein synthesis. FEBS Lett. 1992;298:145–148. doi: 10.1016/0014-5793(92)80042-f. [DOI] [PubMed] [Google Scholar]
- Johnston AL, File SE. Yohimbine's anxiogenic action: evidence for noradrenergic and dopaminergic sites. Pharmacol Biochem Behav. 1989;32:151–156. doi: 10.1016/0091-3057(89)90225-6. [DOI] [PubMed] [Google Scholar]
- Jones BE, Yang TZ. The efferent projections from the reticular formation and the locus coeruleus studied by anterograde and retrograde axonal transport in the rat. J Comp Neurol. 1985;242:56–92. doi: 10.1002/cne.902420105. [DOI] [PubMed] [Google Scholar]
- Khoshbouei H, Cecchi M, Dove S, Javors M, Morilak DA. Behavioral reactivity to stress: amplification of stress-induced noradrenergic activation elicits a galanin-mediated anxiolytic effect in central amygdala. Pharmacol Biochem Behav. 2002;71:407–417. doi: 10.1016/s0091-3057(01)00683-9. [DOI] [PubMed] [Google Scholar]
- Koob GF. Corticotropin-releasing factor, norepinephrine, and stress. Biol Psychiatry. 1999;46:1167–1180. doi: 10.1016/s0006-3223(99)00164-x. [DOI] [PubMed] [Google Scholar]
- Kozicz T, Arimura A. Axon terminals containing CGRP-immunoreactivity form synapses with CRF- and met-enkephalin-immunopositive neurons in the laterodorsal division of the bed nucleus of the stria terminalis in the rat. Brain Res. 2001;2001:11–20. doi: 10.1016/s0006-8993(00)03118-8. [DOI] [PubMed] [Google Scholar]
- Lasiter PS, Glanzman DL. Cortical substrates of taste aversion learning: involvement of dorsolateral amygdaloid nuclei and temporal neocortex in taste aversion learning. Behav Neurosci. 1985;99:257–276. doi: 10.1037//0735-7044.99.2.257. [DOI] [PubMed] [Google Scholar]
- Madden CJ, Ito S, Rinaman L, Wiley RG, Sved AF. Lesions of the C1 catecholaminergic neurons of the ventrolateral medulla in rats using anti-DbH saporin. Am J Physiol. 1999;277:R1063–R1075. doi: 10.1152/ajpregu.1999.277.4.R1063. [DOI] [PubMed] [Google Scholar]
- Madden CJ, Stocker SD, Sved AF. Attenuation of homeostatic responses to hypotension and glucoprivation after destruction of catecholaminergic rostral ventrolateral medulla neurons. Am J Physiol Regul Integr Comp Physiol. 2006;291:R751–R759. doi: 10.1152/ajpregu.00800.2005. [DOI] [PubMed] [Google Scholar]
- Merchenthaler I, Lane M, Shughrue P. Distribution of pre-pro-glucagon and glucagon-like peptide-1 receptor messenger RNAs in the rat central nervous system. J Comp Neurol. 1999;403:261–280. doi: 10.1002/(sici)1096-9861(19990111)403:2<261::aid-cne8>3.0.co;2-5. [DOI] [PubMed] [Google Scholar]
- Morilak DA, Barrera G, Echevarria DJ, Garcia AS, Hernandez A, Ma S, Petre CO. Role of brain norepinephrine in the behavioral response to stress. Prog Neuropsychopharmacol Biol Psychiatry. 2005;29:1214–1224. doi: 10.1016/j.pnpbp.2005.08.007. [DOI] [PubMed] [Google Scholar]
- Myers EA, Rinaman L. Trimethylthiazoline (TMT) supports conditioned flavor avoidance and activates viscerosensory, hypothalamic, and limbic circuits in rats. Am J Physiol Regul Integr Comp Physiol. 2005;288:R1716–R1726. doi: 10.1152/ajpregu.00479.2004. [DOI] [PubMed] [Google Scholar]
- Myers EA, Banihashemi L, Rinaman L. The anxiogenic drug yohimbine activates central viscerosensory circuits in rats. J Comp Neurol. 2005;492:426–441. doi: 10.1002/cne.20727. [DOI] [PubMed] [Google Scholar]
- Pacak K, Armando I, Komoly S, Fukuhara K, Weise VK, Holmes C, Kopin IJ, Goldstein DS. Hypercortisolemia inhibits yohimbine-induced release of norepinephrine in the posterolateral hypothalamus of conscious rats. Endocrinology. 1992;131:1369–1376. doi: 10.1210/endo.131.3.1505468. [DOI] [PubMed] [Google Scholar]
- Paxinos G, Watson C. San Diego, CA: Academic; 1997. The rat brain in stereotaxic coordinates. [DOI] [PubMed] [Google Scholar]
- Rinaman L. Hindbrain noradrenergic lesions attenuate anorexia and alter central cFos expression in rats after gastric viscerosensory stimulation. J Neurosci. 2003;23:10084–10092. doi: 10.1523/JNEUROSCI.23-31-10084.2003. [DOI] [PMC free article] [PubMed] [Google Scholar]
- Rinaman L, Stricker EM, Hoffman GE, Verbalis JG. Central c-fos expression in neonatal and adult rats after subcutaneous injection of hypertonic saline. Neuroscience. 1997;79:1165–1175. doi: 10.1016/s0306-4522(97)00022-5. [DOI] [PubMed] [Google Scholar]
- Ritter S, Bugarith K, Dinh TT. Immunotoxic destruction of distinct catecholamine subgroups produces selective impairment of glucoregulatory responses and neuronal activation. J Comp Neurol. 2001;432:197–216. doi: 10.1002/cne.1097. [DOI] [PubMed] [Google Scholar]
- Ritter S, Watts AG, Dinh TT, Sanchez-Watts G, Pedrow C. Immunotoxin lesion of hypothalamically projecting norepinephrine and epinephrine neurons differentially affects circadian and stressor-stimulated corticosterone secretion. Endocrinology. 2003;144:1357–1367. doi: 10.1210/en.2002-221076. [DOI] [PubMed] [Google Scholar]
- Roozendaal B, Brunson KL, Holloway BL, McGaugh JL, Baram TZ. Involvement of stress-released corticotropin-releasing hormone in the basolateral amygdala in regulating memory consolidation. Proc Natl Acad Sci USA. 2002;99:13908–13913. doi: 10.1073/pnas.212504599. [DOI] [PMC free article] [PubMed] [Google Scholar]
- Sakai N, Yamamoto T. Role of the medial and lateral parabrachial nucleus in acquisition and retention of conditioned taste aversion in rat. Behav Brain Res. 1998;93:63–70. doi: 10.1016/s0166-4328(97)00133-2. [DOI] [PubMed] [Google Scholar]
- Sakai N, Yamamoto T. Possible routes of visceral information in the rat brain in formation of conditioned taste aversion. Neuroscience Res. 1999;35:53–61. doi: 10.1016/s0168-0102(99)00067-x. [DOI] [PubMed] [Google Scholar]
- Sawchenko PE, Swanson LW. Central noradrenergic pathways for the integration of hypothalamic neuroendocrine and autonomic responses. Science. 1981;214:685–687. doi: 10.1126/science.7292008. [DOI] [PubMed] [Google Scholar]
- Sawchenko PE, Swanson LW. The organization of noradrenergic pathways from the brainstem to the paraventricular and supraoptic nuclei in the rat. Brain Res Rev. 1982;4:275–325. doi: 10.1016/0165-0173(82)90010-8. [DOI] [PubMed] [Google Scholar]
- Schweimer J, Fendt M, Schnitzler H-U. Effects of clonidine injections into the bed nucleus of the stria terminalis on fear and anxiety behavior in rats. Eur J Pharmacol. 2005;507:117–124. doi: 10.1016/j.ejphar.2004.11.044. [DOI] [PubMed] [Google Scholar]
- Singewald N, Salchner P, Sharp T. Induction of c-Fos expression in specific areas of the fear circuitry in rat forebrain by anxiogenic drugs. Biol Psychiatry. 2003;53:275–283. doi: 10.1016/s0006-3223(02)01574-3. [DOI] [PubMed] [Google Scholar]
- Swanson LW. Cerebral hemisphere regulation of motivated behavior. Brain Res. 2000;886:113–164. doi: 10.1016/s0006-8993(00)02905-x. [DOI] [PubMed] [Google Scholar]
- Szemeredi K, Komoly S, Kopin IJ, Bagdy G, Keiser HR, Goldstein DS. Simultaneous measurement of plasma and brain extracellular fluid concentrations of catechols after yohimbine administration in rats. Brain Res. 1991;542:8–14. doi: 10.1016/0006-8993(91)90990-d. [DOI] [PubMed] [Google Scholar]
- Tsujino T, Sano H, Kubota Y, Hsieh S-T, Miyajima T, Saito K, Nakajima M, Saito N, Yokoyama M. Expression of Fos-like immunoreactivity by yohimbine and clonidine in the rat brain. Eur J Pharmacol. 1992;226:69–78. doi: 10.1016/0922-4106(92)90084-9. [DOI] [PubMed] [Google Scholar]
- Watson RE, Jr, Wiegand SJ, Clough RW, Hoffman GE. Use of cryoprotectant to maintain long-term peptide immunoreactivity and tissue morphology. Peptides. 1986;7:155–159. doi: 10.1016/0196-9781(86)90076-8. [DOI] [PubMed] [Google Scholar]
- Winsky-Sommerer R, Yamanaka A, Diano S, Borok E, Roberts AJ, Sakurai T, Kilduff TS, Horvath TL, Lecea LD. Interaction between the corticotropin-releasing factor system and hypocretins (orexins): a novel circuit mediating stress response. J Neurosci. 2004;24:11439–11448. doi: 10.1523/JNEUROSCI.3459-04.2004. [DOI] [PMC free article] [PubMed] [Google Scholar]
- Woulfe JM, Flumerfelt BA, Hrycyshyn AW. Efferent connections of the A1 noradrenergic cell group: a DBH immunohistochemical and PHA-L anterograde tracing study. Exp Neurol. 1990;109:308–322. doi: 10.1016/s0014-4886(05)80022-6. [DOI] [PubMed] [Google Scholar]
- Wozniak M, Schramm NL, Limbird LE. The noradrenergic receptor subtypes. In: Bloom FE, Kupfer DJ, editors. Psychopharmacology: the fourth generation of progress. New York: Raven; 2000. [Google Scholar]
- Wrenn CC, Picklo MJ, Lappi DA, Robertson D, Wiley RG. Central noradrenergic lesioning using anti-DBH-saporin: anatomical findings. Brain Res. 1996;740:175–184. doi: 10.1016/s0006-8993(96)00855-4. [DOI] [PubMed] [Google Scholar]


