

Abstract
In mammals, each olfactory bulb contains two mirror-symmetric glomerular maps. Isofunctional glomeruli within each bulb are specifically linked through a set of reciprocal intrabulbar projections (IBPs) to form an intrabulbar map. We injected neural tracers into the glomerular layer on one side of the bulb and examined the resulting projection on the opposite side. In adult mice, the size of the projection tuft is directly proportional to the size of the injected region. Using this ratio as a measure of IBP maturity, we find an immature 5:1 projection to injection ratio at 1 week of age that gradually refines to a mature 1:1 by 7 weeks. Moreover, whereas the glomerular map is able to form despite the elimination of odorant-induced activity, the intrabulbar map shows clear activity dependence for its precise formation. Here we show through experiments with both naris-occluded and anosmic mice that odorant-induced activity is not required to establish IBPs but is crucial for projection refinement. In contrast, increased glomerular activation through exposure to distinct odorants during map development can accelerate the refinement of projections associated with the activated glomeruli. These findings illustrate a clear role for odorant-induced activity in shaping the internal circuitry of the bulb. Interestingly, activity deprivation can alter the organization of both the developing and the mature map to the same degree, demonstrating that intrabulbar map plasticity is maintained into adulthood with no discernible critical period.
Keywords: external tufted cell, olfactory bulb, development, neural tracer, axon targeting, mouse
Introduction
The vertebrate olfactory system, like most other sensory systems, is composed of a series of maps that organize the primary input into spatial patterns. Because subsequent processing occurs in higher-order brain regions, the patterns are often preserved, suggesting that the relationship between neighboring neural circuits is essential for their proper function (Chklovskii and Koulakov, 2004). This organization is less clear in the olfactory system in which olfactory sensory neurons (OSNs) that express a common odorant receptor are broadly scattered throughout the nasal turbinates but coalesce to form glomerular maps as their axons reach the bulb (Ressler et al., 1994; Vassar et al., 1994). Recent studies have shown that a second-order map also exists that precisely links the glomerular maps within each bulb through a reciprocal projection mediated by external tufted cells (ETCs) (Schoenfeld et al., 1985; Belluscio et al., 2002; Lodovichi et al., 2003).
How does the precision of olfactory maps arise? Although most agree that neural maps likely result from a combination of chemical guidance cues and neuronal activity, it is not clear which aspects of the final map organization are controlled by which component. In some sensory systems, families of guidance molecules, such as ephrins, ephs, semaphorins, netrins, slits, robos, and neurotrophins, have been clearly associated with the formation of maps (McLaughlin and O'Leary, 2005). Although many of these molecules are expressed in the olfactory bulb, their role in patterning the circuitry of the bulb is not yet understood. Interestingly, attempts to alter the glomerular map through disruption of some of these guidance molecules have produced rather modest effects (Cloutier et al., 2002; Walz et al., 2002; Cutforth et al., 2003).
Neural activity has also been shown to play an important role both in establishing and shaping the connections within neural maps. In the visual system, sensory input can dramatically alter specific cortical connections associated with right and left eye dominance as well as with orientation selectivity (Wiesel and Hubel, 1965; Katz and Shatz, 1996; White et al., 2001). In the olfactory system, however, the function of odorant-induced activity in organizing and maintaining the olfactory maps is unclear. Studies using anosmic knock-out mice, in which key components of the odorant signaling cascade are disrupted, indicate that the glomerular map remains remarkably intact with only minor alterations (Brunet et al., 1996; Belluscio et al., 1998; Wong et al., 2000; Zheng et al., 2000).
In this study, we sought to determine how the intrabulbar map forms and what factors are involved in achieving its specificity. We were first able to detect the map postnatally and established a developmental profile. We uncovered that the map is diffuse shortly after birth and refines to its adult precision during the first 7 weeks of life. Through naris occlusion experiments, we showed that maturation of the intrabulbar projections (IBPs) is clearly activity dependent, requiring olfactory sensory input to achieve refinement. In contrast, activation of the olfactory bulb through odorant exposure accelerates map refinement. Perhaps most notably, the intrabulbar map maintains its activity dependence well into adulthood, demonstrating a form of neural plasticity that is not constrained by a developmental critical window.
Materials and Methods
Mouse lines.
Experiments were performed using four different lines of mice, one wild-type C57BL/6 and three transgenic lines: rI7→M71, YFP-G, and OCNC1-KO. The rI7→M71 is a genetically altered mouse strain in which the mouse M71 odorant receptor coding sequence has been replaced with the rat I7 odorant receptor coding sequence and engineered to coexpress both green fluorescent protein (GFP) and β-galactosidase as markers using tandem internal ribosomal entry site (IRES) sequences (Bozza et al., 2002). YFP-G is a transgenic line that expresses yellow fluorescent protein (YFP) in mitral cells, the major class of output neurons in the olfactory bulb (Feng et al., 2000). OCNC1-KO are a line in which the α subunit of the olfactory cyclic nucleotide-gated channel has been deleted through targeted disruption, rendering the mice anosmic (Brunet et al., 1996; Baker et al., 1999). All mice were bred in-house. All animal procedures conformed to National Institutes of Health guidelines and were approved by the National Institute of Neurological Disorders and Stroke/National Institute on Deafness and Other Communication Disorders Animal Care and Use Committee.
Naris occlusion.
Wild-type mice at 4 and 10 weeks of age were anesthetized via intraperitoneal injection of a mixture of 80 mg/kg ketamine hydrochloride and 8 mg/kg xylazine hydrochloride and maintained with 100% oxygen supplemented with 1.0–3.0% isofluorane gas inhalant. Mice were then positioned in a small stereotaxic apparatus on their back without ear bars and placed under a low-magnification 10× Leica (Nussloch, Germany) microscope. Visualizing the naris region, a small 3% agar filled polyethylene tube (Becton Dickinson, Mountain View, CA) ∼3–5 mm in length, coated with sterile ocular lubricant (Puralube Ointment; Fougera, Melville, NY), was inserted into the right nostril and sealed in place with quick dry adhesive (Instant Adhesive Loctite 404; Small Parts, Logansport, IN) to block odorants from entering the right naris. Animals were maintained in this unilateral anosmic state for either 3 weeks, when occluded at 4 weeks of age, or for 4 weeks, when occluded at 10 weeks of age. Each block was checked biweekly and new adhesive was reapplied if necessary. Immediately before performing tracer injections, blocks were checked one last time by placing a drop of water over the occluded naris. The block was determined to have persisted when there was an absence of bubbles. Only mice with complete blocks were used for tracer injections.
Odorant exposure.
The rI7→M71 mice were raised in the presence of octanal, an odorant shown to activate rI7→M71 glomeruli. Octanal was applied daily to the walls of the home cage using a 1:100 (v/v) concentration, in which 50 μl of octanal was diluted in 5 ml of mineral oil, as described previously (Kerr and Belluscio, 2006). All treatments began at postnatal day 0 (PND-0) and continued until the animals were killed at the experimental time points of 2, 4, and 7 weeks of age.
Neural tracer injections.
Neural tracer injections were performed as described previously (Lodovichi et al., 2003). Briefly, for in vivo injections, mice were anesthetized with an intraperitoneal injection of 100 mg/kg ketamine hydrochloride and 10 mg/kg xylazine hydrochloride and maintained with 100% oxygen supplemented with a 1.0–3.0% isofluorane gas inhalant. Animals were then placed in a stereotaxic apparatus and all surgical procedures were performed under a Leica MZFL3 microscope. The scalp was retracted over the dorsal surface of the olfactory bulbs, and the bone was removed to allow access for tracer injections. A single microinjection of 10% dextran-tetramethylrhodamine (TMR) of 3000 molecular weight (Invitrogen, Carlsbad, CA) was iontophoresed (+10 μA, duration of 200 ms, interval of 2500 ms, 120 pulses, for 5 min) into each olfactory bulb through a quartz micropipette (5–10 μm tip diameter). Eight to 12 hours after injection, mice were killed with an overdose injection of 200 mg/kg ketamine hydrochloride and 20 mg/kg xylazine hydrochloride intraperitoneally and transcardially perfused with 1× PBS, followed by 4% paraformaldehyde (PFA). Olfactory bulbs were removed and postfixed in 4% PFA for 3 d, cryoprotected in 30% sucrose for 1 d, horizontally sectioned on a freezing microtome at 60 μm, placed onto Superfrost slides (Fisher Scientific, Houston, TX), and mounted with Vectashield containing 4′,6′-diamidino-2-phenylindole (Vector Laboratories, Burlingame, CA). For in vitro injections, mice were anesthetized with isofluorane, decapitated, and rapidly dissected in low Ca+2 artificial CSF (ACSF) (McQuiston and Katz, 2001) bubbled with 95% O2/5% CO2. Medial and lateral sides were then exposed and injected using the same parameters described above. After injection, the tissue was bubbled in oxygenated ACSF for 4–6 h, then fixed, and processed as described above.
Immunohistochemistry and in situ hybridization.
Cholecystokinin (CCK) immunohistochemistry was performed on 40 μm coronal floating sections using the rabbit anti-cholecystokinin octapeptide (CCK-8) polyclonal antibody at a 1:500 dilution (Sigma, St. Louis, MO) incubated overnight at 4°C, followed by a biotin-conjugated anti-rabbit secondary at a 1:1000 dilution (Jackson ImmunoResearch, West Grove, PA) and a Cy-3-conjugated streptavidin reporter (Jackson ImmunoResearch) at a 1:500 dilution, each for 3 h at 23°C. In situ hybridization to visualize the expression of CCK mRNA was performed with a digoxigenin-labeled riboprobe (Schaeren-Wiemers and Gerfin-Moser, 1993) specific for the mouse cDNA sequence of CCK as described in GenBank.
Cell counts and quantification.
All slides were coded so that the experimenter was blind to the identity of each animal and experimental condition. CCK profiles were counted on a Zeiss (Oberkochen, Germany) Axiovert 200 fluorescent microscope (Zeiss) under bright-field illumination. Coronal sample sections were taken from the beginning rostral 30%, middle 30%, and end caudal 30% of the olfactory bulbs along the anteroposterior plane. These segments of the bulb were separated by ∼200 μm making up the remaining 10% of the bulb. CCK-positive cells were counted under an Achroplan 20×/0.45 objective with a Klarman Ruling 400 Series Grid with an area totaling 500 μm2. The grid was positioned on each section so that the top of the grid was in line with the outer surface of the glomerular layer and the bottom of the grid incorporated the base of the mitral cell layer. For each animal (n = 4 per age group), three sample sections were counted one from the beginning, middle, and end of the bulb, in equivalent locations for both dorsal and medial regions. Means ± SEM reported reflect the combined averages of both medial and dorsal regions.
Image acquisition.
Images were collected using a laser scanning confocal microscope Zeiss LSM 510 Meta attached to a Zeiss Axioskop 2. Horizontal olfactory bulb sections of the intrabulbar injection and projection sites were imaged with both a Plan-Neofluar 10×/0.30 objective and an Achroplan 20×/0.45 objective, as were coronal olfactory bulb sections antibody stained for CCK. Z-series stacks were acquired for all of these experiments using Zeiss LSM software. For each tracer experiment, Z-series stacks were collected in every section containing the injection site and the projection site. The stacks were then collapsed to reconstruct the full extent of each injection and projection site. Fluorophores used were as follows: GFP, excitation 488, emission 507; YFP, excitation 488, emission 519; TMR, excitation 554, emission 580. Bright-field whole-mount images were collected using a Leica MZFL3 microscope equipped with a Spot-RT cooled CCD camera (Diagnostic Instruments, Sterling Heights, MI). CCK in situ images were collected under an Achroplan 20×/0.45 objective on a Zeiss Axiovert 200 fluorescent microscope under bright-field illumination with a Q-COLOR 5 cooled RTV digital camera (Olympus Optical, Tokyo, Japan). Data were imported into Adobe Photoshop (Adobe Systems, San Jose, CA) for display.
Image measurement and analysis.
After reconstruction of intrabulbar injection and projection sites, images were analyzed and measured using NIH ImageJ software. Quantitative analysis to determine the extent of the labeled regions representing the injection and projection sites was performed by the following: (1) converting the reconstructed image into a binary image; (2) creating a test threshold within each image by clicking on an unlabeled background or white area; (3) thresholding each image into an object and background; (4) using the particle analysis function that scans the object, eliminates the background, and highlights sharp changes in intensity to detect the borders of each object; and (5) measuring the longest distance (diameter) between the defined borders of each object. A ratio was then calculated between the diameters of each projection site and the diameters of its corresponding injection site. Ratios within each age group were averaged and reported ± SD. Offset angle measurements were used to assess the accuracy with which intrabulbar projections targeted the isofunctional glomeruli. To measure offset angles, the diameter of the intrabulbar projection sites were first measured parallel to the mitral cell layer in each animal at each developmental time point. A line was drawn from the calculated center of the projection to the center of the GFP-labeled glomerulus. A perpendicular axis was drawn from the same projection center, and the angle between these two lines represented the offset angle. Offset angles within each age group were then averaged and reported in degrees ± SEM.
Statistics.
All comparisons of ratios and CCK cell counts were performed using the t test. p values of <0.001 were considered statistically significant and are noted in each figure legend. All statistical data were analyzed using Statview software (SAS Institute, Cary, NC).
Results
Previous studies using neural tracers determined that, in adult mice, the intrabulbar map consists of projections that precisely link regions on one side of the bulb to corresponding regions on the opposite side of the same bulb in a spatially conserved manner (Schoenfeld et al., 1985; Belluscio et al., 2002; Lodovichi et al., 2003) (Fig. 1). These studies also established that intrabulbar projections of adult mice display a precise 1:1 ratio between the size of a given tracer injection and the size of its corresponding projection.
Figure 1.

Olfactory intrabulbar projections and map. A, Schematic representation of the intrabulbar pathway connecting isofunctional glomeruli in the two halves of the bulb. The large oval represents a single olfactory bulb, and the dashed lined is the line of symmetry separating the two mirror-symmetric glomerular maps. Colored spheres represent glomeruli receiving input from different odorant receptors, and colored arrows depict the intrabulbar projections that reciprocally link isofunctional glomeruli. B, Schematic representation of the intrabulbar map that is generated as axon terminals from external tufted cells ramify into tufts as illustrated by colored bars. The resulting intrabulbar map mirrors the glomerular map at its surface. D, Dorsal; L, lateral.
The intrabulbar map undergoes developmental refinement
To determine when intrabulbar projections are first established, we performed a series of targeted tracer injections from early postnatal life through adulthood. Using a fluorescent dextran tracer, we were able to distinguish clear intrabulbar projections as early as PND-7. However, these early projections targeted a much broader area on the opposite side of the bulb than in adult mice, suggesting less specificity. We quantified this specificity by calculating the ratio between the diameter of the labeled projection site compared with the diameter of the labeled injection region (see Materials and Methods). This revealed a developmental profile for intrabulbar projections in which there is a dramatic refinement between PND-7 and 7 weeks of age (Fig. 2). At 1 week of age, the average projection to injection ratio is 5:1 (5.3 ± 0.8; mean ± SD; n = 5), which progressively reduces to a mature 1:1 ratio (1.1 ± 0.1; mean ± SD; n = 7) by 7 weeks and then is maintained into adulthood (Table 1). Although our injection site sizes remained fairly constant across most age groups, there was some variability possibly attributable in part to the morphological changes associated with glomerular development during this postnatal period. Nevertheless, the ratios reveal an unmistakable refinement, in the intrabulbar map from an immature to a mature state, clearly demonstrating that there is a developmental evolution to the projections that are observed in the adult.
Figure 2.
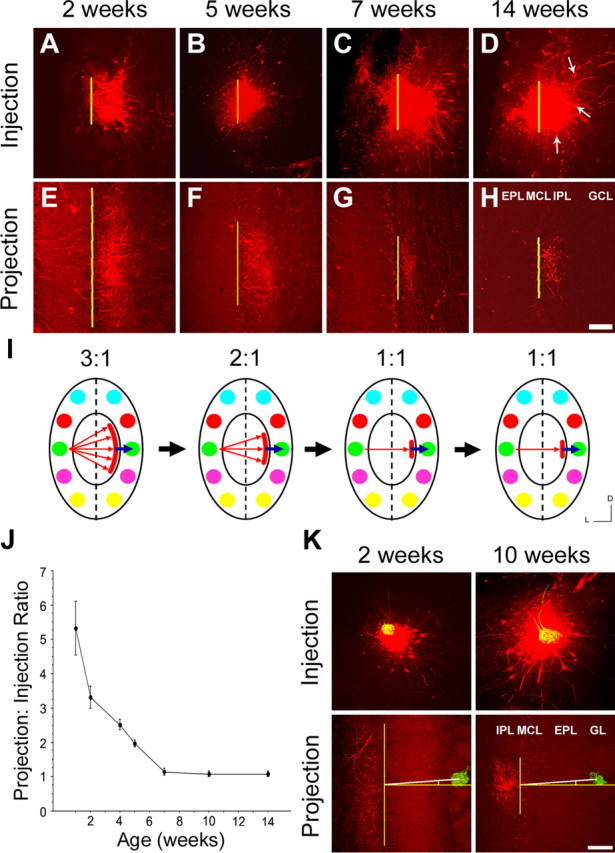
Developmental refinement of the intrabulbar map and projection specificity. A–D, Horizontal tangential sections through the glomerular layer show tracer injections in the lateral olfactory bulb of wild-type mice at four time points during postnatal development (yellow lines represent diameter measurements, and white arrows show external tufted cells). E–H, Corresponding intrabulbar projection sites from A–D, respectively, demonstrating developmental refinement. Scale bar, 100 μm. I, Schematic depicting the developmental profile of the intrabulbar projections in E–H, illustrating the initial broad distribution of axon terminals and their refinement to a specific glomerular locus as indicated by blue arrows. Ratios compare diameters of projection tuft with injection site. J, Graph illustrating the progression of intrabulbar projections from an immature state, with a 5:1 ratio (5.3 ± 0.8; mean ± SD; n = 5) at 1 week of age, to full maturity by 7 weeks with a 1:1 ratio (1.1 ± 0.1; mean ± SD; n = 7), and maintenance of this ratio into adulthood. Error bars represent ± SD. K, Top panels show tracer injections performed on rI7→M71 mice targeting the lateral glomerulus at 2 and 10 weeks of age. Bottom panels show corresponding projections sites illustrating the center point of each projection with respect to the isofunctional glomerulus. Vertical yellow lines mark the size of the projection tuft. Horizontal yellow lines extend perpendicular from the midpoint of each projection. White lines mark the degree off center of the isofunctional rI7→M71 glomerulus. GL, Glomerular layer; MCL, mitral cell layer; GCL, granule cell layer. Scale bar, 100 μm. D, Dorsal; L, lateral.
Table 1.
Developmental refinement of intrabulbar projections
| Age | 1 week | 2 weeks | 4 weeks | 5 weeks | 7 weeks | 10 weeks | 14 weeks |
|---|---|---|---|---|---|---|---|
| n | 5 | 4 | 6 | 5 | 7 | 8 | 5 |
| Ave INJ size (μm) | 98 ± 19 | 214 ± 63 | 171 ± 46 | 155 ± 31 | 199 ± 91 | 163 ± 41 | 195 ± 36 |
| Ave PRO size (μm) | 521 ± 87 | 711 ± 255 | 433 ± 128 | 308 ± 72 | 221 ± 86 | 175 ± 48 | 212 ± 52 |
| Ratio (PRO/INJ) | 5.3 ± 0.8 | 3.3 ± 0.3 | 2.5 ± 0.2 | 2.0 ± 0.1 | 1.1 ± 0.1 | 1.1 ± 0.1 | 1.1 ± 0.1 |
Neural tracer injections performed on wild-type mice at 1, 2, 4, 5, 7, 10, and 14 weeks of age. The diameter of the projection (PRO) sites and the injection (INJ) sites were measured for each animal within each developmental age group. Average INJ and PRO site sizes are shown ± SD. The PRO to INJ ratio was calculated for each animal and then averaged for each age group, shown as ± SD. Number of animals in each age group is indicated by n value.
Specificity of immature IBPs
Although the immature projections were broadly distributed, they appeared to display regional specificity. Thus, we sought to determine the degree of accuracy in the targeting of early intrabulbar projections. We used the rI7→M71 line of mice in which a single odorant receptor and the corresponding glomeruli are labeled with GFP (Bozza et al., 2002). These mice enabled us to target tracer injections to a defined glomerulus and measure the extent to which the projection site centered beneath the GFP-labeled isofunctional glomerulus on the opposite side (Belluscio et al., 2002; Bozza et al., 2002; Lodovichi et al., 2003). To quantify the spatial precision of the projections, we found the center of the projection tuft and calculated the angle at which the isofunctional glomerulus was offset from a perpendicular drawn from that center. Our data demonstrate that, although the immature intrabulbar projections broadly target the opposite bulbar hemisphere, they are accurately centered beneath the isofunctional glomerulus with a mean offset angle of 5 ± 1° (mean ± SEM; n = 4) in 2-week-old mice (Fig. 2 K, Table 2). This variance is similar to the normal range for a mitral cell primary dendrite targeting a specific glomerulus in adults (Buonviso et al., 1991), suggesting that both glomeruli and IBPs may be accurately drawn to common regions of the bulb to establish specific communication between glomerular pairs.
Table 2.
Accuracy of intrabulbar projections in targeting isofunctional glomeruli
| Age | 1 week | 2 weeks | 4 weeks | 5 weeks | 7 weeks | 10 weeks | 14 weeks |
|---|---|---|---|---|---|---|---|
| n | 4 | 4 | 5 | 3 | 7 | 4 | 4 |
| Offset Angle | 10.3 ± 2.0o | 4.9 ± 1.0o | 5.8 ± 1.4o | 5.6 ± 1.2o | 5.2 ± 1.1o | 3.8 ± 0.8o | 3.0 ± 0.6o |
Targeted tracer injections performed on rI7→M71 mice at 1, 2, 4, 5, 7, 10, and 14 weeks of age. The offset angle is used to assess the accuracy of the intrabulbar projections in targeting isofunctional glomeruli. This is the angle between a line drawn from the measured center of the projection to the center of the GFP-labeled glomerulus and a perpendicular axis drawn from the same projection center. Mean offset angles are shown in degrees ± SEM. Number of animals in each age group is indicated by n value.
Activity-independent formation of the IBPs
We next evaluated whether odorant-induced activity is involved in either the formation or maturation of the intrabulbar map. We used an anosmic line of mice in which the α-subunit of the olfactory cyclic nucleotide-gated channel has been disrupted (OCNC1-KO) (Brunet et al., 1996; Baker et al., 1999). In these mice, olfactory bulb development is significantly altered, resulting in smaller bulbs and compressed layers with a specific reduction in the apical sublamina of the external plexiform layer (EPL) (Brunet et al., 1996; Baker et al., 1999; Lin et al., 2000). Given the low survival rate among homozygous mutants (<10%), we sought to maximize our results by injecting 7-week-old mice. This allowed us to determine whether intrabulbar projections were present at maturity and simultaneously examine the effect of anosmia on the maturation of the map. Our results show that, although these animals are anosmic from birth, the intrabulbar projections are able to form and target the opposite side of the bulb (Fig. 3). However, the projections are dramatically broader (4.0 ± 0.4 projection to injection ratio; mean ± SD; n = 4) than one would expect for a 7-week-old wild-type mouse (1.1 ± 0.1 ratio; mean ± SD; n = 7), indicating a significant difference in the maturation state of the intrabulbar map (p < 0.001; t = 19.0).
Figure 3.
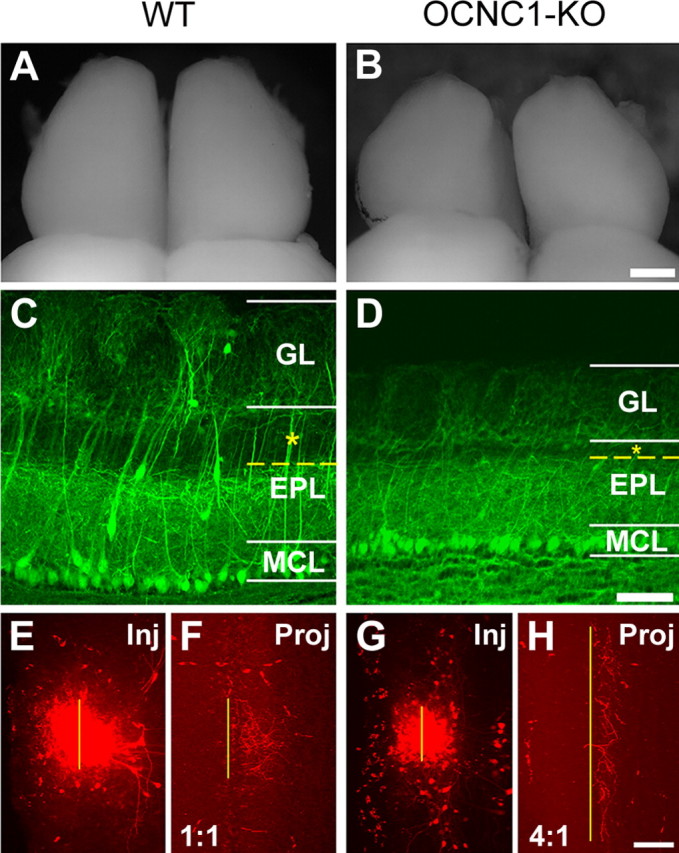
Activity-independent formation of intrabulbar projections. Comparison of olfactory bulbs from 7-week-old wild-type and OCNC1-KO mice. Whole-mount view of the dorsal surface of the olfactory bulbs from wild-type (A) and OCNC1-KO (B) mice showing the reduced size of the bulbs in OCNC1-KO mice. Scale bar, 400 μm. Histological sections from a transgenic mouse containing YFP-labeled mitral cells (YFP-G, a marker line for mitral cells; C) and a YFP-G mouse in an OCNC1-KO background (YFP-G/OCNC1-KO; D), highlighting the compression of olfactory bulb layers typical of OCNC1-KO mice and demonstrating the dramatic reduction in the superficial EPL layer (asterisk) in which ETCs are typically located. GL, Glomerular layer; MCL, mitral cell layer. Scale bar, 100 μm. Injection (Inj) and projection (Proj) sites from 7-week-old wild-type (E, F) and OCNC1-KO (G, H) mice demonstrate that intrabulbar projections are present in OCNC1-KO mice (H) but are not refined compared with wild-type mice (F). Scale bar, 100 μm.
Activity is necessary for intrabulbar map refinement
To better understand how odorant-induced activity affects intrabulbar map refinement, we performed a series of naris occlusion experiments that allowed us to create discrete periods of odorant deprivation (see Materials and Methods). Because our experiments with OCNC1-KO mice demonstrated that anosmia throughout development significantly impaired map refinement, we postulated that, if activity were necessary, refinement would be disrupted even with a brief period of naris closure. We performed unilateral naris occlusions on mice at 4 weeks of age, when the intrabulbar map is only partially refined (Fig. 4). Given that the two nasal cavities are anatomically separate and that the sensory neurons project ipsilaterally to their respective olfactory bulb, a unilateral naris block drastically reduces odorant-induced activity in one-half of the olfactory system (Brunjes, 1994) (see Materials and Methods). Animals were then raised for 3 weeks with the naris block in place. We then performed tracer injections on the ipsilateral bulb at postnatal week 7 (PNW-7), at which time a control map would have reached maturity. Our data revealed that the intrabulbar map did not continue to refine after naris occlusion but instead regressed to an even less mature state with an average projection to injection ratio of 6:1 (5.9 ± 1.1; mean ± SD; n = 5) (Fig. 4). This ratio is similar to that of a 1-week-old mouse, suggesting that, when activity is lost, there is actually a regrowth of axons and apparent increase in branching.
Figure 4.
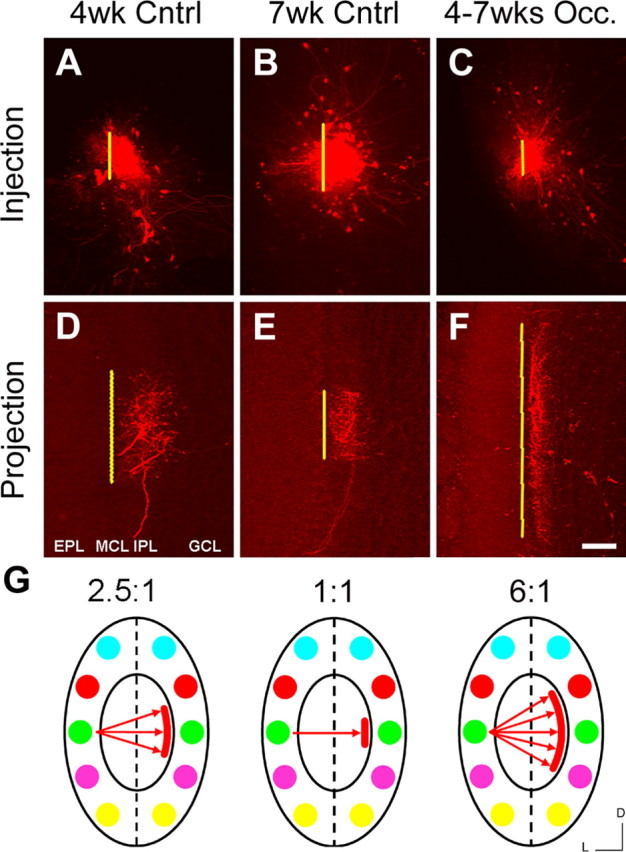
Activity-dependent refinement of the intrabulbar map. Comparing the effect of odorant deprivation on intrabulbar map development with control mice. A–C, Olfactory bulb tracer injections performed on 7-week-old mice occluded (Occ.) from PNW-4 to PNW-7 (C) compared with 4-week-old (A) and 7-week-old (B) controls (Cntrl). D–F, Corresponding intrabulbar projection sites from A–C, respectively, reveal a clear broadening of projections in the occluded mice compared with controls, demonstrating plasticity during intrabulbar map maturation. MCL, Mitral cell layer; GCL, granule cell layer. Scale bar, 100 μm. G, Schematics depicting the maturation state of the map based on projection to injection ratios showing a partially refined mean ratio of 2.5:1 at 4 weeks (left schematic) corresponding to the initiation of the naris occlusion period, a fully refined map (middle schematic) showing a 1:1 ratio at 7 weeks, and an altered map (right schematic) after activity deprivation with a 6:1 ratio reminiscent of a completely immature map. D, Dorsal; L, lateral.
Intrabulbar map plasticity shows no critical period
To determine whether the map plasticity observed at PNW-4 is maintained into adulthood, we performed unilateral naris occlusions at PNW-10. The blocks were left in place until PNW-14 when ipsilateral tracer injections were performed. Interestingly, these projections also broadened to produce an average projection to injection ratio of 5:1 (4.7 ± 0.6; mean ± SD; n = 4), similar to the results from the occlusion experiments during map development at PNW-4 (Fig. 5). These data clearly demonstrate that the activity-dependent plasticity of the intrabulbar projections is not confined to a critical period existing before map maturation (i.e., before PNW-7). Instead, the plasticity of the intrabulbar map and its dependence on odorant-induced activity continues into adulthood.
Figure 5.
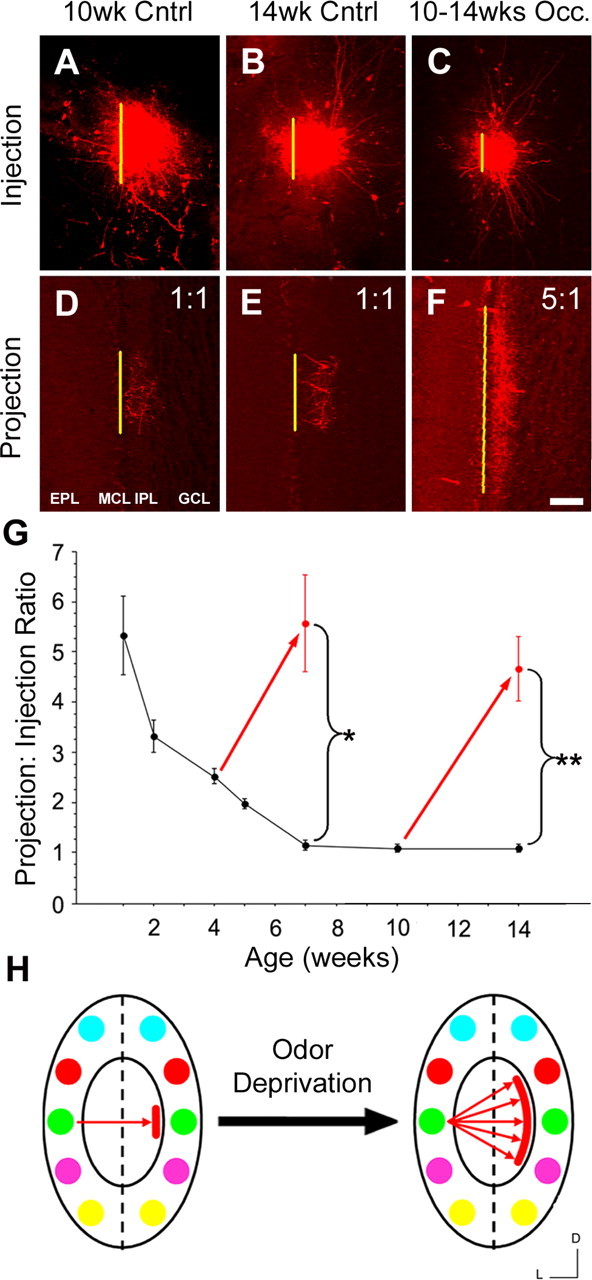
Activity is required to maintain the intrabulbar map. Testing the effect of odorant-deprivation on the mature map. A–C, Olfactory bulb tracer injections performed on olfactory bulbs of mature mice at 10 weeks (A) and 14 weeks (B) of age and animals occluded (Occ.) from PNW-10 to PNW-14 (C). D–F, Projection sites corresponding to A–C, respectively, indicate a clear broadening of projections in the occluded mice (F) compared with projections from either control mice (D, E), demonstrating intrabulbar map plasticity after maturity. MCL, Mitral cell layer; GCL, granule cell layer. Scale bar, 100 μm. G, Graph showing the effect of odorant deprivation on the development and maintenance of the intrabulbar map. Red arrows represent the effect of naris occlusion in two experimental groups: mice blocked from PNW-4 to PNW-7 (5.9 ± 1.1; n = 5) and PNW-10 to PNW-14 (4.7 ± 0.6; n = 4). Error bars represent ± SD. Graph illustrates that both groups show a significant increase in their average projection to injection ratio (*p < 0.001, t = 24.89; **p < 0.001, t = 33.48), demonstrating clear activity-dependent plasticity with no critical period. H, Schematic shows that blocking odorant-induced activity results in dramatic broadening of the projection site regardless of the initial maturation state of the map when odorant deprivation begins. D, Dorsal; L, lateral.
Odorant-induced activity accelerates map refinement
A recent study showed that increased sensory stimulation via odorant-induced activity can accelerate glomerular refinement, suggesting the presence of activity-dependent plasticity within the glomerular circuitry (Kerr and Belluscio, 2006). Given that IBPs exhibit plasticity in response to odorant deprivation, we sought to determine whether increased odorant-induced activation is also capable of influencing intrabulbar map refinement. Using the rI7→M71 line of mice, we exposed groups of animals to the odorant octanal, which is known to activate the rI7→M71 glomerulus (Zhao et al., 1998; Belluscio et al., 2002; Bozza et al., 2002), and compared them with unexposed mice. Animals were presented with daily application of odorant (1:100 v/v dilution) into their cage environment from birth until tracer injections targeting the rI7→M71 glomeruli were performed at 2, 4, and 7 weeks of age. Results reveal a significantly more refined projection at both 2 weeks (2.1 ± 0.1; n = 5) and 4 weeks (1.1 ± 0.1; n = 7) of age compared with age-matched controls (2 weeks, p < 0.001, t = 7.83; 4 weeks, p < 0.001, t = 16.24). At 7 weeks of age, there was no significant difference in IBP ratios between odorant-exposed (1.1 ± 0.1; n = 7) and control (p = 0.650; t = 0.47) animals with both groups showing complete refinement (Fig. 6). Interestingly, when injections in 4-week-old odorant-exposed mice were shifted (200–600 μm) posterior, away from the rI7→M71 glomerulus, targeting areas of the bulb that do not typically respond to octanal (Rubin and Katz, 1999; Uchida et al., 2000; Belluscio and Katz, 2001; Meister and Bonhoeffer, 2001; Wachowiak and Cohen, 2001; Belluscio et al., 2002; Lodovichi et al., 2003), the projection refinement ratios were indistinguishable from age-matched non-odorant-exposed controls (2.5 ± 0.2; n = 5) but significantly different from 4-week-old odorant-exposed mice in which we targeted the rI7→M71 glomerulus (p < 0.001; t = 13.73) (Fig. 6 G,H). Thus, these data suggest that odorant-induced activity can accelerate intrabulbar map refinement between isofunctional regions in a glomerular-specific manner.
Figure 6.
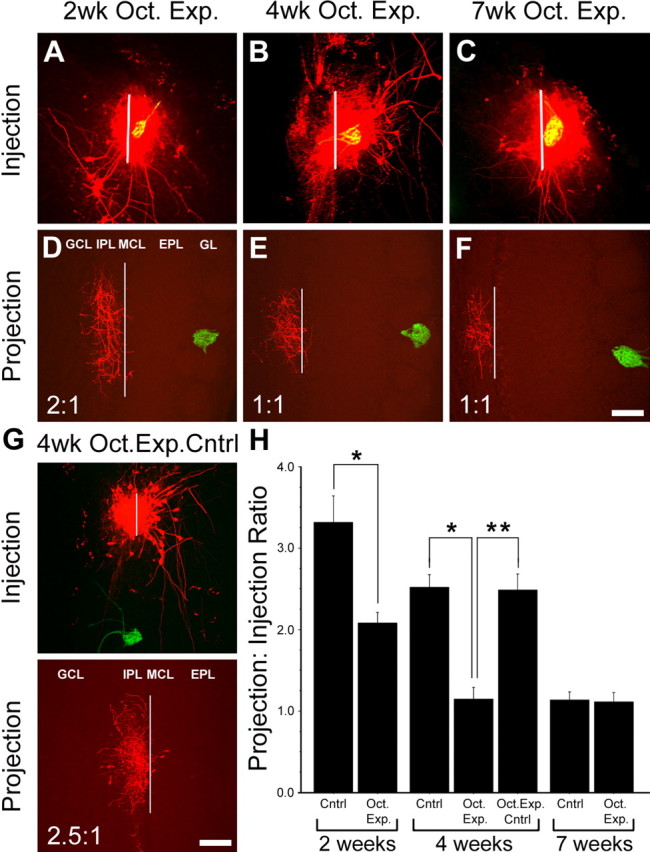
Odorant-induced activity accelerates intrabulbar map refinement in a spatially specific manner. Olfactory bulbs of rI7→M71 mice exposed to octanal (Oct. Exp.) from birth until injections targeting the rI7→M71glomeruli were performed at 2 weeks (A), 4 weeks (B), and 7 weeks (C) of age. D–F, Corresponding intrabulbar projection sites from A–C, respectively, centered beneath isofunctional glomeruli demonstrating accelerated developmental refinement of the intrabulbar projections (white lines represents diameter measurements). Scale bar, 100 μm. G, Tracer injection in 4-week-old rI7→M71 mice exposed to octanal (4wk Oct. Exp. Cntrl) targeting a region of the bulb not activated by octanal produces a projection to injection ratio similar to non-odorant-exposed control mice at 4 weeks of age. GL, Glomerular layer; MCL, mitral cell layer; GCL, granule cell layer. Scale bar, 100 μm. H, Bar graph comparing the mean projection to injection ratios of octanal-exposed mice at 2 weeks (2.1 ± 0.1; n = 5), 4 weeks (1.1 ± 0.1; n = 7), and 7 weeks (1.1 ± 0.1; n = 7) to age-matched controls (2 weeks, 3.3 ± 0.3, n = 4; 4 weeks, 2.5 ± 0.2, n = 6; and 7 weeks, 1.1 ± 0.1, n = 7), revealing significant differences at 2 weeks (*p < 0.001; t = 7.83) and 4 weeks (*p < 0.001; t = 16.24) of age but not at 7 weeks (p = 0.650; t = 0.47), demonstrating that odorant-induced activity can accelerate maturation of the intrabulbar map to full maturity by 4 weeks of age. By comparison, ratio measurements in 4-week-old odorant-exposed mice in which tracers were targeted to bulb regions not activated by octanal (Oct. Exp. Cntrl) were indistinguishable from age-matched non-odorant-exposed mice (Cntrl) but significantly different from 4-week-old odorant-exposed mice targeting the rI7→M71 glomerulus (**p < 0.001; t = 13.73), suggesting that accelerated maturation is specific to odorant-activated regions. Error bars represent ± SD.
Effect of odorant deprivation on ETC density
Because the olfactory bulb is one of the few regions of the brain that undergoes continuous neuronal repopulation (Altman, 1969), we explored the possibility that a change in the number of external tufted cells accounted for the expansion of intrabulbar projections after elimination or reduction of odorant-induced activity. Using both antibodies and cRNA probes to CCK, a marker of external tufted cells, we performed immunohistochemical and in situ hybridization assays, respectively, to quantify the density of ETCs in the bulb. We first evaluated the developmental change in ETC number within the olfactory bulbs of wild-type mice between 1 and 14 weeks of age. We show an average ± SEM of 33.2 ± 3.3 (n = 4) CCK-positive cells per 500 μm2 at 1 week of age and 75.7 ± 5.6 (mean ± SEM; n = 4) CCK-positive cells per 500 μm2 at 7 weeks, indicating a 2.3-fold increase in the density of external tufted cells during early postnatal development (Fig. 7). We then assayed the olfactory bulbs in mice after naris occlusion from PNW-10 to PNW-14 (71.0 ± 3.2; mean ± SEM; n = 4) and compared them with bulbs of age-matched wild-type mice (73.6 ± 3.9; mean ± SEM; n = 4). There was no significant difference in the density of external tufted cells in occluded mice (p = 0.525; t = 0.602). This suggests that broadening of IBPs in the absence of odorant-induced activity is not attributable to a change in ETC number. Indeed, it is more probable that the activity-dependent plasticity we observe in the IBPs is the direct result of local subcellular reorganization occurring at the axonal level of the existing neurons.
Figure 7.

External tufted cell density is unaltered by activity deprivation in mature mice. A, Coronal section of a mouse olfactory bulb immunohistochemically stained for CCK. This reveals neuropeptide expression in intrabulbar projections (arrowheads) located in the IPL. Low levels of CCK neuropeptide are also detectible in scattered cells located in the EPL and mitral cell layer (MCL). GL, Glomerular layer. Scale bar, 100 μm. B, Higher magnification of boxed region in A shows CCK expression in ETCs (arrows). Scale bar, 100 μm. C, In situ hybridization for CCK mRNA shows equal distribution of CCK-positive cells throughout the bulb. Scale bar, 400 μm. Higher-magnification views of dorsal (D) and medial (H) boxed regions in C show similar ETC density. Scale bar, 100 μm. E–H, CCK mRNA in situ images of the medial olfactory bulb at 1, 4, 7, and 14 weeks of age, respectively. Scale bar, 100 μm. I, Graph showing the average density of ETCs within the bulb during its development, demonstrating a clear increase in ETCs from PNW-1 to PNW-7 coinciding with the development of the intrabulbar map. Error bars represent ± SEM. K, CCK mRNA expression in the medial olfactory bulb of a 14-week-old mouse after naris occlusion from week 10 to 14 shows a noticeable decrease in CCK mRNA levels compared with 14 week wild type, suggesting that CCK expression may be activity dependent. Scale bar, 100 μm. J, Graph comparing the average ETC density in mice occluded from PNW-10 to PNW-14 to wild-type controls at 7 and 14 weeks of age (n = 4 each) showing no significant difference. Error bars represent ± SEM.
Discussion
Most sensory systems feature maps in which neurons are organized into groups sharing common functions. In the mammalian olfactory bulb, the glomerulus is the functional unit around which much of the circuitry is organized. Axons of sensory neurons in the olfactory epithelium that express the same odorant receptor converge to form a pair of glomeruli within each bulb, conferring a unique molecular identity on the glomeruli and in large part determining their functional properties. Given that glomeruli are stereotyped in their location, the resulting glomerular map offers an organizational framework for studying functionally defined neural pathways within the CNS. A column of neurons, or “odor column,” is organized beneath each glomerulus and processes its output. External tufted cells residing in the EPL receive input within a glomerulus directly from OSNs and project their axons to the internal plexiform layer (IPL) on the opposite side of the bulb where they arborize into small axonal tufts (Schoenfeld et al., 1985; Liu and Shipley, 1994; Belluscio et al., 2002; Lodovichi et al., 2003). Within the IPL, external tufted cells make synaptic connections with granule cells, which in turn send dendritic projections toward the apical surface to synapse with the lateral dendrites of mitral and tufted cells (Liu and Shipley, 1994; Shipley and Ennis, 1996). Based on the columnar structure of the bulb, the intrabulbar projections are believed to modulate the output of the glomeruli they target. Given that intrabulbar projections are both specific and reciprocal, this circuitry provides a means by which isofunctional odor columns may influence one another's output. Because ETCs are glutamatergic and synapse onto GABAergic granule cells (Liu and Shipley, 1994), the intrabulbar projections most likely introduce an inhibitory influence on the circuitry of the targeted odor column. The precise functional consequence of this granule cell-mediated inhibition remains unclear. Our goal was to understand the development of the intrabulbar connections within the context of the glomerular map and as part of the odor column.
The olfactory intrabulbar projections are first detectable by postnatal day 7, appearing as broadly targeted axonal fibers terminating in tufts with regional specificity on the opposite side of the bulb. Our data reveal that the initial formation of the intrabulbar map is independent of odorant-induced activity as demonstrated by the presence of intrabulbar projections in OCNC1-KO mice. It is unclear how the early map is established, but it is likely based on molecular cues functioning as guidance molecules that are present in the olfactory bulb (St. John et al., 2002). Once established, the intrabulbar map is highly dependent on odorant-induced activity for proper developmental refinement during the first 7 weeks of life. Loss of odorant-induced activity results in regression of the map to its immature state. Interestingly, enhanced activation of specific glomeruli with known odorant ligands accelerates the refinement of IBPs associated with the activated glomeruli, suggesting that odorant-induced activity can prematurely refine the map. Last, the plasticity observed within the intrabulbar projections, which allows the map to reorganize based on specific odorant-induced activity, is maintained into adulthood with no apparent critical window (Fig. 8).
Figure 8.
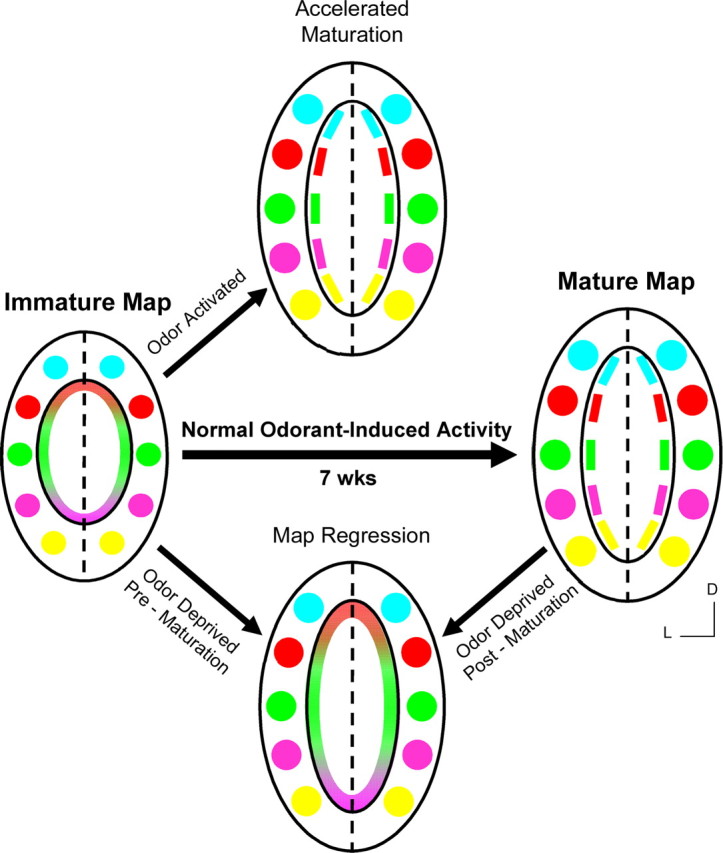
Activity-dependent plasticity in the intrabulbar map. The immature intrabulbar map links isofunctional regions between the two hemispheres of an olfactory bulb, with broadly targeted intrabulbar projections depicted by similarly colored regions in the schematics. As the projections mature during the first 7 postnatal weeks, they refine to target specific isofunctional odor columns centered beneath isofunctional pairs of glomeruli producing a mature and fully refined intrabulbar map. Reduced odorant-induced activity resulting from odor deprivation, either during map refinement (Pre-maturation) or after map refinement (Post-maturation), produces a dramatic expansion of intrabulbar projections or regression of the intrabulbar map to an immature-like state. Conversely, enhanced activity through odorant exposure during map maturation results in accelerated refinement of projections associated with the activated regions. D, Dorsal; L, lateral.
Plasticity in the intrabulbar map
Most sensory systems maintain an ability to reorganize when challenged with abrupt changes in stimulus-induced activity. Typically, regions that experience a reduction in activity lose connections and spatial territory to adjacent areas that either maintain or have increased activity through a competition-based mechanism. Such is the case in the visual system. Classic studies on ocular dominance column formation using monocular deprivation techniques clearly demonstrate the ability of the visual cortex to reorganize by allowing the dominant (nondeprived) eye to expand its territory into regions served by the deprived eye (Wiesel and Hubel, 1965; Katz and Crowley, 2002). A similar capacity is observed in the auditory system such that damage to restricted regions of the cochlea induces reorganization of the tonotopic map in the contralateral auditory cortex (Rajan et al., 1993; Nakahara et al., 2004). In the somatosensory barrel cortex, loss of sensory input after removal of whiskers results in selective shrinkage of the corresponding barrel fields. In contrast, if a single whisker is overstimulated, the corresponding cortical receptive field grows disproportionately large (Glazewski and Fox, 1996; Erzurumlu and Kind, 2001).
Here we demonstrate that, in the olfactory system, intrabulbar projections show clear reorganization when odorant-induced activity is lost. Interestingly, in contrast to other sensory systems, the projections appear to broaden when faced with anosmic conditions. Tracer injections in OCNC1-KO mice show the presence of broadly targeted projections. Naris occlusion during the development of the intrabulbar map, from PNW-4 to PNW-7, results in regression of the map to a state resembling a 1-week-old mouse. Furthermore, initiating odorant deprivation in 10-week-old mice, after the intrabulbar map has matured, produces a similar broadening of projections by 14 weeks (Fig. 5 G). These data reveal that even brief periods of odorant deprivation are capable of altering the wiring of the intrabulbar map regardless of age.
One mechanism we considered to explain the broadening of projections is that the number of ETCs changes during activity deprivation, leading to an increase in the number of axonal fibers targeting a specific region. However, this hypothesis was proven to be untrue because we see no significant change in ETC number after naris occlusion (Fig. 7 J). Thus, a more likely explanation is that the activity-dependent plasticity we observe in the IBPs is attributable to the growth and reorganization of existing axonal fibers. Indeed, this plasticity may involve many of the same mechanisms responsible for the initial formation and refinement of the intrabulbar map at both the molecular and functional level. One possibility is that, under conditions of normal odorant activity, axonal growth is inhibited either actively, through the release of molecular repulsive cues, or passively, attributable to a lack of growth-promoting factors. Alternatively, axons may not be competent or may be incapable of growth when associated with stable synaptic connections and thus remain targeted to a specific location until the connections are destabilized by the absence of odorant-induced activity.
The role of activity in the intrabulbar map
We demonstrate that activity deprivation resulting from naris occlusion not only blocks the progression of intrabulbar map refinement but actually reverses the maturation state of the map and causes a broadening of projections. In contrast, enhanced glomerular activity through odorant exposure accelerates the refinement process, suggesting that coordinated activation of glomerular pairs may be the underlying mechanism for sharpening the map. Thus, refinement of the intrabulbar map is a continuously active process tuned by activity in discrete glomeruli such that both upregulation and downregulation of odorant-induced activity produce compensatory changes in the projection size and specificity. Interestingly, activity is necessary to maintain a refined map, suggesting that mature projections are also constantly being remodeled. Perhaps as the odorant environment changes and neurons are regenerated in the glomerular and granular layers of the bulb, the associated connections also become reorganized. Thus, the intrabulbar map may need to maintain its plasticity to compensate for the functional changes to the odor column that result from the continuous regeneration of neurons in the bulb, also suggesting that odorant-induced plasticity may be present in other portions of the odor column.
Mechanistically, it is unclear how odorant-induced activity refines the intrabulbar map. Given that the glomerular map is established before the intrabulbar map, one possibility is that activation of distinct glomeruli by odorants provides spatial information necessary to allow sets of IBPs to focus on a specific odor column. It is likely that pairs of isofunctional glomeruli respond to odorants with similar tuning curves. Thus, broadly targeted immature ETCs originating from one glomerulus may be able to recognize the distinct activity patterns of the specific partner glomerulus through the odorant-induced activation of the target odor column. For example, simultaneous activation of glomerular pairs may result in the coordinated release of growth factors and axonal guidance cues within their associated columns necessary for synapse formation. As the map matures, those synaptic connections associated with the isofunctional glomerulus would then be stabilized, while connections lacking simultaneous activation would be eliminated. This correlated spiking of both presynaptic and postsynaptic neurons as the basis for refinement and maintenance of the intrabulbar map is consistent with the Hebbian model of plasticity (Bi and Poo, 2001). It would be important to investigate not only the functional aspects of this interaction but also to elucidate the molecular mechanisms underlying this activity-dependent plasticity.
Conclusion
We have demonstrated that odorant-induced activity can greatly influence the maturation state of the intrabulbar map both during and after map refinement. The elimination of odorant-induced activity results in robust broadening of intrabulbar projections. In contrast, enhanced odorant activation results in accelerated refinement of the associated ETC projections. This suggests that the intrabulbar map is both refined and maintained through the precise activation patterns that occur as an animal is exposed to normal environmental odorants. The activity-dependent developmental pruning of axonal projections is also clear anatomical evidence of experience-dependent plasticity in the central circuitry of the olfactory bulb. Moreover, the fact that the map retains its capacity to reorganize even after it has matured demonstrates the importance of plasticity in a system that must maintain its ability to adapt to any odorant environment.
Footnotes
This research was supported by the Intramural Research Program of the National Institutes of Health–National Institute of Neurological Disorders and Stroke. We thank R. Reed for the OCNC1-KO mice, P. Mombaerts for the rI7→M71-IRES-GFP-IRES-taulacZ mice, and G. Feng for the YFP-G mice. We are also grateful to M. Stopfer, N. Ryba, B. Belluscio, and members of the Belluscio laboratory for helpful discussions and critical review of this manuscript.
References
- Altman J. Autoradiographic and histological studies of postnatal neurogenesis. IV. Cell proliferation and migration in the anterior forebrain, with special reference to persisting neurogenesis in the olfactory bulb. J Comp Neurol. 1969;137:433–457. doi: 10.1002/cne.901370404. [DOI] [PubMed] [Google Scholar]
- Baker H, Cummings DM, Munger SD, Margolis JW, Franzen L, Reed RR, Margolis FL. Targeted deletion of a cyclic nucleotide-gated channel subunit (OCNC1): biochemical and morphological consequences in adult mice. J Neurosci. 1999;19:9313–9321. doi: 10.1523/JNEUROSCI.19-21-09313.1999. [DOI] [PMC free article] [PubMed] [Google Scholar]
- Belluscio L, Katz LC. Symmetry, stereotypy, and topography of odorant representations in mouse olfactory bulbs. J Neurosci. 2001;21:2113–2122. doi: 10.1523/JNEUROSCI.21-06-02113.2001. [DOI] [PMC free article] [PubMed] [Google Scholar]
- Belluscio L, Gold GH, Nemes A, Axel R. Mice deficient in G(olf) are anosmic. Neuron. 1998;20:69–81. doi: 10.1016/s0896-6273(00)80435-3. [DOI] [PubMed] [Google Scholar]
- Belluscio L, Lodovichi C, Feinstein P, Mombaerts P, Katz LC. Odorant receptors instruct functional circuitry in the mouse olfactory bulb. Nature. 2002;419:296–300. doi: 10.1038/nature01001. [DOI] [PubMed] [Google Scholar]
- Bi G, Poo M. Synaptic modification by correlated activity: Hebb's postulate revisited. Annu Rev Neurosci. 2001;24:139–166. doi: 10.1146/annurev.neuro.24.1.139. [DOI] [PubMed] [Google Scholar]
- Bozza T, Feinstein P, Zheng C, Mombaerts P. Odorant receptor expression defines functional units in the mouse olfactory system. J Neurosci. 2002;22:3033–3043. doi: 10.1523/JNEUROSCI.22-08-03033.2002. [DOI] [PMC free article] [PubMed] [Google Scholar]
- Brunet LJ, Gold GH, Ngai J. General anosmia caused by a targeted disruption of the mouse olfactory cyclic nucleotide-gated cation channel. Neuron. 1996;17:681–693. doi: 10.1016/s0896-6273(00)80200-7. [DOI] [PubMed] [Google Scholar]
- Brunjes PC. Unilateral naris closure and olfactory system development. Brain Res Brain Res Rev. 1994;19:146–160. doi: 10.1016/0165-0173(94)90007-8. [DOI] [PubMed] [Google Scholar]
- Buonviso N, Chaput MA, Scott JW. Mitral cell-to-glomerulus connectivity: an HRP study of the orientation of mitral cell apical dendrites. J Comp Neurol. 1991;307:57–64. doi: 10.1002/cne.903070106. [DOI] [PubMed] [Google Scholar]
- Chklovskii DB, Koulakov AA. Maps in the brain: what can we learn from them? Annu Rev Neurosci. 2004;27:369–392. doi: 10.1146/annurev.neuro.27.070203.144226. [DOI] [PubMed] [Google Scholar]
- Cloutier JF, Giger RJ, Koentges G, Dulac C, Kolodkin AL, Ginty DD. Neuropilin-2 mediates axonal fasciculation, zonal segregation, but not axonal convergence, of primary accessory olfactory neurons. Neuron. 2002;33:877–892. doi: 10.1016/s0896-6273(02)00635-9. [DOI] [PubMed] [Google Scholar]
- Cutforth T, Moring L, Mendelsohn M, Nemes A, Shah NM, Kim MM, Frisen J, Axel R. Axonal ephrin-As and odorant receptors: coordinate determination of the olfactory sensory map. Cell. 2003;114:311–322. doi: 10.1016/s0092-8674(03)00568-3. [DOI] [PubMed] [Google Scholar]
- Erzurumlu RS, Kind PC. Neural activity: sculptor of “barrels” in the neocortex. Trends Neurosci. 2001;24:589–595. doi: 10.1016/s0166-2236(00)01958-5. [DOI] [PMC free article] [PubMed] [Google Scholar]
- Feng G, Mellor RH, Bernstein M, Keller-Peck C, Nguyen QT, Wallace M, Nerbonne JM, Lichtman JW, Sanes JR. Imaging neuronal subsets in transgenic mice expressing multiple spectral variants of GFP. Neuron. 2000;28:41–51. doi: 10.1016/s0896-6273(00)00084-2. [DOI] [PubMed] [Google Scholar]
- Glazewski S, Fox K. Time course of experience-dependent synaptic potentiation and depression in barrel cortex of adolescent rats. J Neurophysiol. 1996;75:1714–1729. doi: 10.1152/jn.1996.75.4.1714. [DOI] [PubMed] [Google Scholar]
- Katz LC, Crowley JC. Development of cortical circuits: lessons from ocular dominance columns. Nat Rev Neurosci. 2002;3:34–42. doi: 10.1038/nrn703. [DOI] [PubMed] [Google Scholar]
- Katz LC, Shatz CJ. Synaptic activity and the construction of cortical circuits. Science. 1996;274:1133–1138. doi: 10.1126/science.274.5290.1133. [DOI] [PubMed] [Google Scholar]
- Kerr MA, Belluscio L. Olfactory experience accelerates glomerular refinement in the mammalian olfactory bulb. Nat Neurosci. 2006;9:484–486. doi: 10.1038/nn1673. [DOI] [PubMed] [Google Scholar]
- Lin DM, Wang F, Lowe G, Gold GH, Axel R, Ngai J, Brunet L. Formation of precise connections in the olfactory bulb occurs in the absence of odorant-evoked neuronal activity. Neuron. 2000;26:69–80. doi: 10.1016/s0896-6273(00)81139-3. [DOI] [PubMed] [Google Scholar]
- Liu WL, Shipley MT. Intrabulbar associational system in the rat olfactory bulb comprises cholecystokinin-containing tufted cells that synapse onto the dendrites of GABAergic granule cells. J Comp Neurol. 1994;346:541–558. doi: 10.1002/cne.903460407. [DOI] [PubMed] [Google Scholar]
- Lodovichi C, Belluscio L, Katz LC. Functional topography of connections linking mirror-symmetric maps in the mouse olfactory bulb. Neuron. 2003;38:265–276. doi: 10.1016/s0896-6273(03)00194-6. [DOI] [PubMed] [Google Scholar]
- McLaughlin T, O'Leary DD. Molecular gradients and development of retinotopic maps. Annu Rev Neurosci. 2005;28:327–355. doi: 10.1146/annurev.neuro.28.061604.135714. [DOI] [PubMed] [Google Scholar]
- McQuiston AR, Katz LC. Electrophysiology of interneurons in the glomerular layer of the rat olfactory bulb. J Neurophysiol. 2001;86:1899–1907. doi: 10.1152/jn.2001.86.4.1899. [DOI] [PubMed] [Google Scholar]
- Meister M, Bonhoeffer T. Tuning and topography in an odor map on the rat olfactory bulb. J Neurosci. 2001;21:1351–1360. doi: 10.1523/JNEUROSCI.21-04-01351.2001. [DOI] [PMC free article] [PubMed] [Google Scholar]
- Nakahara H, Zhang LI, Merzenich MM. Specialization of primary auditory cortex processing by sound exposure in the “critical period.”. Proc Natl Acad Sci USA. 2004;101:7170–7174. doi: 10.1073/pnas.0401196101. [DOI] [PMC free article] [PubMed] [Google Scholar]
- Rajan R, Irvine DR, Wise LZ, Heil P. Effect of unilateral partial cochlear lesions in adult cats on the representation of lesioned and unlesioned cochleas in primary auditory cortex. J Comp Neurol. 1993;338:17–49. doi: 10.1002/cne.903380104. [DOI] [PubMed] [Google Scholar]
- Ressler KJ, Sullivan SL, Buck LB. Information coding in the olfactory system: evidence for a stereotyped and highly organized epitope map in the olfactory bulb. Cell. 1994;79:1245–1255. doi: 10.1016/0092-8674(94)90015-9. [DOI] [PubMed] [Google Scholar]
- Rubin BD, Katz LC. Optical imaging of odorant representations in the mammalian olfactory bulb. Neuron. 1999;23:499–511. doi: 10.1016/s0896-6273(00)80803-x. [DOI] [PubMed] [Google Scholar]
- Schaeren-Wiemers N, Gerfin-Moser A. A single protocol to detect transcripts of various types and expression levels in neural tissue and cultured cells: in situ hybridization using digoxigenin-labelled cRNA probes. Histochemistry. 1993;100:431–440. doi: 10.1007/BF00267823. [DOI] [PubMed] [Google Scholar]
- Schoenfeld TA, Marchand JE, Macrides F. Topographic organization of tufted cell axonal projections in the hamster main olfactory bulb: an intrabulbar associational system. J Comp Neurol. 1985;235:503–518. doi: 10.1002/cne.902350408. [DOI] [PubMed] [Google Scholar]
- Shipley MT, Ennis M. Functional organization of olfactory system. J Neurobiol. 1996;30:123–176. doi: 10.1002/(SICI)1097-4695(199605)30:1<123::AID-NEU11>3.0.CO;2-N. [DOI] [PubMed] [Google Scholar]
- St. John JA, Clarris HJ, Key B. Multiple axon guidance cues establish the olfactory topographic map: how do these cues interact? Int J Dev Biol. 2002;46:639–647. [PubMed] [Google Scholar]
- Uchida N, Takahashi YK, Tanifuji M, Mori K. Odor maps in the mammalian olfactory bulb: domain organization and odorant structural features. Nat Neurosci. 2000;3:1035–1043. doi: 10.1038/79857. [DOI] [PubMed] [Google Scholar]
- Vassar R, Chao SK, Sitcheran R, Nunez JM, Vosshall LB, Axel R. Topographic organization of sensory projections to the olfactory bulb. Cell. 1994;79:981–991. doi: 10.1016/0092-8674(94)90029-9. [DOI] [PubMed] [Google Scholar]
- Wachowiak M, Cohen LB. Representation of odorants by receptor neuron input to the mouse olfactory bulb. Neuron. 2001;32:723–735. doi: 10.1016/s0896-6273(01)00506-2. [DOI] [PubMed] [Google Scholar]
- Walz A, Rodriguez I, Mombaerts P. Aberrant sensory innervation of the olfactory bulb in neuropilin-2 mutant mice. J Neurosci. 2002;22:4025–4035. doi: 10.1523/JNEUROSCI.22-10-04025.2002. [DOI] [PMC free article] [PubMed] [Google Scholar]
- White LE, Coppola DM, Fitzpatrick D. The contribution of sensory experience to the maturation of orientation selectivity in ferret visual cortex. Nature. 2001;411:1049–1052. doi: 10.1038/35082568. [DOI] [PubMed] [Google Scholar]
- Wiesel TN, Hubel DH. Comparison of the effects of unilateral and bilateral eye closure on cortical unit responses in kittens. J Neurophysiol. 1965;28:1029–1040. doi: 10.1152/jn.1965.28.6.1029. [DOI] [PubMed] [Google Scholar]
- Wong ST, Trinh K, Hacker B, Chan GC, Lowe G, Gaggar A, Xia Z, Gold GH, Storm DR. Disruption of the type III adenylyl cyclase gene leads to peripheral and behavioral anosmia in transgenic mice. Neuron. 2000;27:487–497. doi: 10.1016/s0896-6273(00)00060-x. [DOI] [PubMed] [Google Scholar]
- Zhao H, Ivic L, Otaki JM, Hashimoto M, Mikoshiba K, Firestein S. Functional expression of a mammalian odorant receptor. Science. 1998;279:237–242. doi: 10.1126/science.279.5348.237. [DOI] [PubMed] [Google Scholar]
- Zheng C, Feinstein P, Bozza T, Rodriguez I, Mombaerts P. Peripheral olfactory projections are differentially affected in mice deficient in a cyclic nucleotide-gated channel subunit. Neuron. 2000;26:81–91. doi: 10.1016/s0896-6273(00)81140-x. [DOI] [PubMed] [Google Scholar]