

Abstract
Neuronal activity in posterior cingulate cortex (CGp) is modulated by visual stimulation, saccades, and eye position, suggesting a role for this area in visuospatial transformations. The goal of this study was to determine whether neuronal responses in CGp are anchored to the eyes, head, or outside the body (allocentrically). To discriminate retinocentric from nonretinocentric spatial referencing, the activity of single CGp neurons was recorded while monkeys (Macaca mulatta) performed delayed-saccade trials initiated randomly from three different starting positions to a linear array of targets passing through the neuronal response field. For most neurons, tuning curves, segregated by fixation point, aligned more closely when plotted with respect to the display than when plotted with respect to the eye, suggesting a nonretinocentric frame of reference. A second experiment differentiated between spatial referencing in coordinates anchored to the head or body and allocentric spatial referencing. Monkeys shifted gaze from a central fixation point to the array of previously used targets both before and after whole-body rotation with respect to the display. For most neurons, tuning curves, segregated by fixation position, aligned more closely when plotted as a function of target position in the room than when plotted as a function of target position with respect to the monkey. These data indicate that a population of CGp neurons encodes visuospatial events in allocentric coordinates.
Keywords: coordinate frame, saccade, visuospatial, neurophysiology, eye movement, monkey
Introduction
Spatially accurate behavior requires the transformation of inputs referenced to the sensory epithelium into coordinates appropriate for preparing and generating movement (Andersen et al., 1993; Andersen, 1997; Cohen and Andersen, 2002). No transformation is required for visually guided gaze shifts, because the retinocentric location of the target and the vector of the eye movement are aligned. Other spatial coordinate transformations are more complex. For example, to reach for an object, its position relative to the retina must be translated into its position relative to the arm and body. Similarly, navigating to an object requires the translation of retinocentric visual inputs into body/head-centered coordinates. To navigate independent of changes in observer position, objects must be mapped with respect to anchor objects or surroundings.
Visuospatial coordinate transformations are thought to occur by combining inputs encoding the retinocentric locations of objects with information about the positions of the eyes, head, arm, or body (Andersen et al., 1993). Parietal cortex has been implicated in the integration of retinocentric visual information with eye position and head position to generate egocentrically referenced spatial information useful for guiding coordinated gaze shifts, reaching, and grasping (Andersen et al., 1993). In contrast, the hippocampus and surrounding cortex appear to encode locations with respect to other objects in the environment, implicating these areas in spatial representations guiding navigation (Matsumura et al., 1999; Robertson et al., 1999; Rolls, 1999).
Vogt et al. (1992) posited that posterior cingulate cortex (CGp) participates in the transformation of egocentrically referenced visuospatial representations in parietal cortex into allocentrically referenced spatial representations in the hippocampus and surrounding cortex. Neuroanatomical, neurophysiological, and neuropsychological evidence support this hypothesis: CGp is reciprocally connected with both parietal and parahippocampal cortices (Cavada and Goldman-Rakic, 1989); CGp neurons respond after the illumination of contralateral targets (Musil and Olson, 1993; Dean et al., 2004) and after contraversive gaze shifts (Olson et al., 1996; Dean et al., 2004); these responses are modulated by eye position (Olson et al., 1996); and lesions of this area disrupt both navigation and orienting (Maguire, 2001).
Despite these observations, it remains unclear whether CGp neurons signal spatial information with respect to the head, body, or world, or encode spatial information in an intermediate format. To address this issue, we studied the activity of CGp neurons in macaques performing delayed saccade trials in two experiments. First, monkeys shifted gaze from three different fixation points to an array of targets passing through the response field of each neuron, thus dissociating retinocentric and nonretinocentric target position. Second, monkeys shifted gaze from a central point to an array of targets while facing the stimulus screen and then after whole-body rotation to the left or right, thus dissociating egocentric and allocentric target position. We found that neuronal responses after saccade onset aligned better as a function of absolute target position in space than as a function of target position relative to the subject, thus implicating CGp in the allocentric representation of visual space.
Materials and Methods
Subjects
Data were collected from neurons in both hemispheres of two adult male rhesus macaques (Macaca mulatta) in these experiments. All animal procedures were developed in association with Duke University Medical Center veterinarians, approved by the Duke University Institutional Animal Care and Use Committee, and designed and conducted in compliance with the Public Health Service Guide for the Care and Use of Animals.
Surgical procedures
As described in detail previously (Platt and Glimcher, 1997; Dean et al., 2004), a head-restraint prosthesis and scleral search coil were implanted in an initial sterile surgical procedure. Animals received postoperative analgesics for a minimum of 3 d and antibiotic prophylaxis 7–10 d after every surgery. Animals were given a 4–6 week recovery period after surgery. A second aseptic surgical procedure was performed once animals could reliably execute all of the behavioral tasks used in the study. A stainless steel recording chamber (Crist Instrument Company, Hagerstown, MD) was positioned stereotaxically perpendicular to the horizontal plane over a 15 mm craniotomy centered stereotaxically at position (0, 0), the intersection of the midsagittal and interaural planes (cf. Olson et al., 1996; McCoy et al., 2003; Dean et al., 2004). The recording chamber was cleaned regularly with antibiotic washes and sealed with replaceable sterile Cilux caps. Single-cell recording experiments began after a 1 week postoperative period.
Behavioral techniques
Visual stimuli were light-emitting diodes (LEDs) (LEDtronics, Torrance, CA), fixed on a tangent screen placed 144.78 cm (57 inches) from the eyes of the animal and forming a grid of points, separated by 1°, spanning 49° horizontally and 41° vertically, although only a subset of the LEDs were used in this experiment. These LEDs were illuminated to appear yellow to normal human observers and could be illuminated within 1 ms and extinguished within 7 ms by the computer system controlling the experiments. Horizontal and vertical eye position were sampled at 500 Hz (Riverbend Instruments, Birmingham, AL) and recorded by computer. Access to water was controlled during training and testing, and animals were habituated to head restraint and trained to perform oculomotor tasks for a fruit-juice reward using a custom-built software interface (Ryklin Software, New York, NY).
Standard delayed saccade trials (Fig. 1a) were used to assess the firing patterns and spatial tuning of physiologically identified neurons in CGp. A tone presented along with the illumination of the central yellow LED, which subjects were required to fixate within 1000 ms, signaled the beginning of the trial. Gaze was aligned within 2° of the fixation stimulus, and, after a delay of 200–800 ms, a single eccentric yellow LED was illuminated. Monkeys were required to maintain fixation an additional 200–800 ms after the illumination of the target until the fixation stimulus was extinguished, cuing the monkey to shift gaze to the eccentric target (±3°) within 350 ms. Fixation of the target for 500 ms was followed by the delivery of liquid reinforcement. A brief noise preceding juice delivery served as a secondary reinforcer on all correct trials.
Figure 1.
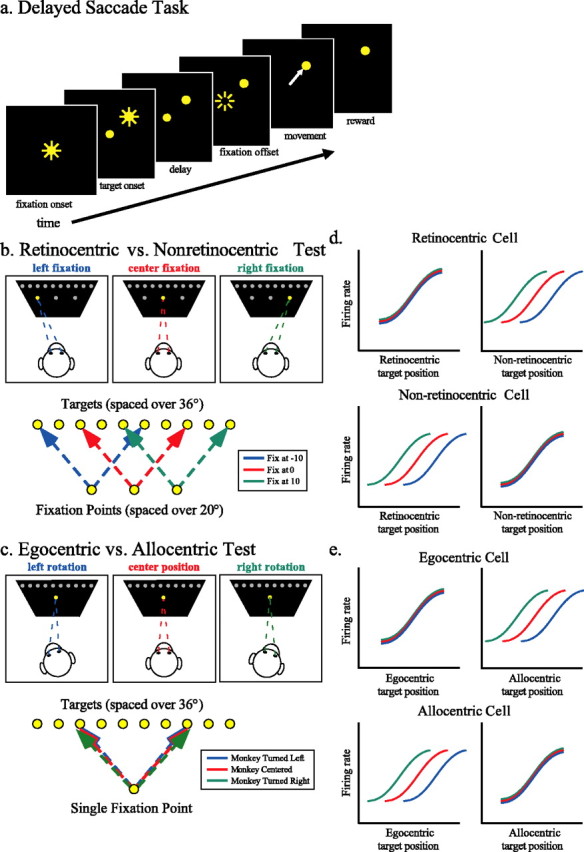
Tasks. a, Delayed saccade trials. Subjects fixated (±2°) a centrally located yellow LED. After a delay, a target LED was illuminated; subjects were required to maintain fixation until the central light was extinguished (200–600 ms) and then shift gaze to the target (2–3°) and maintain fixation of it for 500 ms to receive a juice reward. b, Retinocentric versus nonretinocentric test. The fixation LED appeared at either the center of the LED panel or 10° to the left or right of the center. Targets were drawn from an array of 10 LEDs, spaced 4° apart from −18 to 18° and typically 10° above or below the array of fixation points. c, Egocentric versus allocentric test. Subjects performed delayed saccades from the central fixation point to the array of 10 targets after passive whole-body rotation 20° in either direction around the vertical axis. d, Expected tuning curves in the retinocentric versus nonretinocentric test. Tuning curves, separated by fixation point, are expected to align when plotted as a function of retinocentric target position if these neurons encode only information about the saccade vector/retinal vector. If these neurons encode information with respect to the subject but not the eye, tuning curves will align when plotted as a function of the nonretinocentric target position. e, Expected tuning curves in the egocentric versus allocentric test. Tuning curves, separated by rotation, are expected to align when plotted as a function of target position with respect to the subject if these neurons encode spatial information in egocentric coordinates. If these neurons encode spatial information allocentrically, the tuning curves will align when plotted as a function of the target position in the room.
Microelectrode recording techniques
Recordings were made as described previously (Dean et al., 2004). Neuronal activity was first recorded during 100–200 delayed saccade mapping trials to assess visual and saccade-related spatial sensitivity. During these mapping trials, the fixation stimulus was located at the center of the stimulus panel, whereas the location of the eccentric target varied randomly from trial to trial within a 36 × 36° grid of 100 LEDs spaced at 4° intervals. After mapping, a horizontal array of 10 targets passing through the response field of the neuron was selected, typically 10° above or below the center of the LED display. In experiment 1, which dissociated retinocentric and nonretinocentric coordinates (which thus could be body/head centered or allocentric), subjects were required on each trial to shift gaze to one of these 10 targets from one of three fixation points located at the origin of the LED display (central fixation) or 10° left (left fixation) or 10° right (right fixation) of the origin (Fig. 1b). Fixation points and targets were chosen randomly on each trial, and all conditions were interleaved. In this experiment, a hypothetical neuron encoding spatial information retinocentrically would respond equivalently to a target presented 4° right of fixation whether the fixation stimulus was central, left, or right. A hypothetical nonretinocentric neuron would respond differently to a target 4° right of each fixation stimulus, because each target would be located at a different location relative to the subject or the room. However, a nonretinocentric neuron would respond in the same manner to a target located 4° right of the central fixation stimulus whether the subject fixated centrally, left, or right, despite the fact that the target would be in a different position (4°, 14°, or −6°) relative to each fixation (Fig. 1d).
In experiment 2, which dissociated head/body and world/eye coordinates, the subject’s head and body were passively rotated 20° in either direction around the vertical axis, and subjects were again required to shift gaze from the central fixation stimulus to one of the 10 targets chosen randomly in each trial (Fig. 1c). The subject and monkey chair were rotated around a central post below the chair that attached to the floor (Crist Instrument Company). Rotations were made both left and right of center for some cells but in only one direction for others, depending on how long the neuron remained isolated. For analysis, tuning curves collected from the rotated condition(s) were compared with tuning curves generated by gaze shifts originating at the central fixation position with the body and head facing straight ahead in experiment 1. Because only one initial fixation position was used, experiment 2 alone cannot distinguish between allocentric and retinocentric frames of reference. By comparing the data generated after rotation in experiment 2 with data generated from the central fixation position in experiment 1, however, we can effectively distinguish egocentric from allocentric coordinates.
Data for experiment 2 were collected in blocks during which the subject was in one rotation position or another. Collecting data in blocks introduces some potential confounds. Neuronal isolation or satiety could change over time. Therefore, when possible, data in each rotation position were collected in several interleaved blocks to mitigate any effects of changes in isolation or neuronal responsiveness over time. Neuronal isolation after rotation appeared to be very well maintained in every case, based on consistency in waveform size and shape as well as baseline firing rate.
We recorded from neurons lying within grid penetrations 1–3 mm lateral and 0–2 mm rostral to the intersection of the interaural and midsagittal planes, at depths 8–12 mm from the cortical surface. These recordings appear to have been in area 31 in the ventral bank of the cingulate sulcus and area 23 in the cingulate gyrus, based on the fact that most had visual and/or saccade-associated activity with spatial and temporal properties similar to neurons in previous studies (Olson et al., 1996; Dean et al., 2004). Electrodes first passed through tissue containing neurons with somatosensory-related activity before reaching these neurons. We confirmed the location of the electrode in these areas using a hand-held digital ultrasound device (Sonosite 180; SonoSite, Bothell, WA) placed against the recording chamber after some recording sessions, as described previously (Dean et al., 2004). Ultrasound images indicated that the cingulate sulcus lay ∼8–10 mm below the cortical surface for these penetrations, in good agreement with travel indicated on the micropositioner for neurons with task-related activity.
Analysis
Quantification of spatial sensitivity and temporal response profile for CGp neurons.
Eye position was recorded throughout each trial for off-line analysis. The number of action potentials was computed on each trial during 12 200-ms epochs, each aligned on at a trial event: (1) immediately after the start of fixation on the central target; (2) after the illumination of the eccentric target; (3) preceding the onset of the required eye movement; (4) immediately after onset of the movement; (5) 200–400 ms after the onset of the required eye movement (after movement); (6) preceding the onset of the noise burst before juice reward (before reward); (7) immediately after the noise burst; (8) immediately preceding juice reward delivery; (9) immediately after the onset of juice reward; (10) after the offset of juice reward; (11) 200–400 ms after the offset of juice reward; and (12) 400–600 ms after the offset of juice reward. For each cell, a database was constructed from these measurements.
To assess spatial sensitivity of recorded neurons, multiple regression analysis was used to analyze the relationship between firing rate and horizontal target position (Matlab; MathWorks, Natick, MA) for each measured epoch of time for mapping trials. Multiple regression was used because the spatial sensitivity of most CGp neurons is generally quite broad (Olson et al., 1996; Dean et al., 2004). Those neurons with significant relationships between firing rate and target position in any of the following epochs were considered to be tuned spatially: after target, before movement, immediately after movement, 200–400 ms after movement, or before reward. To compare results in experiment 1 and experiment 2, neurons in our analysis were further limited to include only those for which data were collected in both experiments.
To examine the temporal pattern of responsiveness, a contralateral bias measure (contrabias) was computed for each epoch in spatially tuned neurons studied in both experiments (Dean et al., 2004). Contrabias was defined as the difference between the firing rate associated with contraversive movements and that associated with ipsiversive movements for each neuron for the subset of saccades initiated from the central fixation LED (0°). Contrabias was then averaged across the population and plotted as a function of time (see Fig. 2). For the same sets of trials, a linear function was fit to the firing rate in each epoch as a function of target position, and the average slope was plotted as a function of time (as by Dean et al., 2004).
Figure 2.
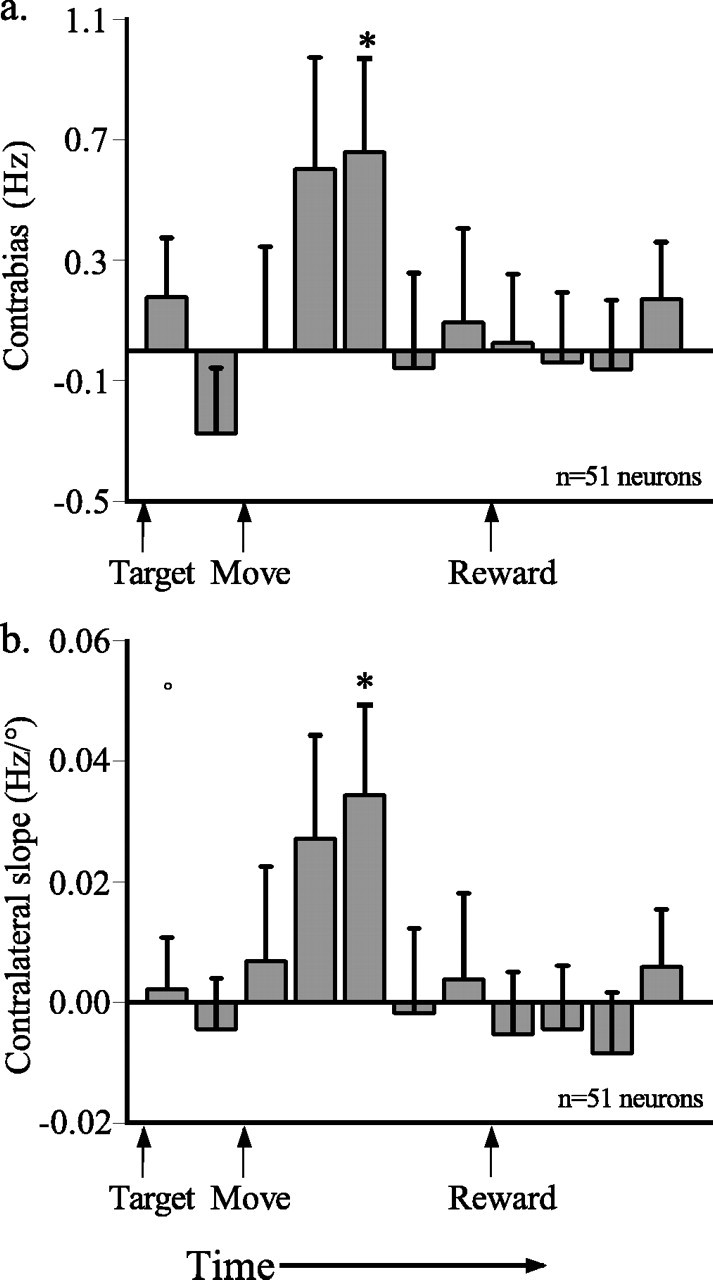
Spatial and temporal properties of responses to saccades initiated from the central fixation stimulus. a, Average differences in firing rate for trials with contralateral and ipsilateral targets (contrabias) plotted as a function of time for 11 200-ms epochs aligned on trial events. b, Mean ± SE slopes of lines fit to response versus target position plot for the same 200 ms epochs. Positive slopes indicate a greater neuronal response on trials in which the target appeared in the hemifield contralateral to the recording site. Significant differences between firing rates for each fixation are indicated by t test at *p < 0.05.
Analytical dissociation of retinocentric and nonretinocentric coordinates.
For each spatially tuned neuron in experiment 1 that was also studied in experiment 2, firing rate on each trial was first segregated by initial fixation position and then plotted as a function of either the horizontal distance between the current fixation stimulus (−10°, 0°, or 10°) and the target (retinocentric target position) or the horizontal distance between the central fixation stimulus (0°) and the target (nonretinocentric target position) (Fig. 1d). Note that this experiment does not distinguish between head- or body-centered coordinates and allocentric coordinates.
To examine the degree to which retinocentric or nonretinocentric coordinates characterized tuning functions across the studied population of CGp neurons, we first analyzed firing rate data for each spatially tuned neuron (as defined above) studied in both experiments using a two-factor ANOVA (Matlab) with retinocentric and nonretinocentric target position as factors. Because the total range of retinocentric targets (−28° to 8° when fixating right and −8° to 28° when fixating left) was larger than that of nonretinocentric targets (−18° to 18°), only data for trials in which the retinocentric targets lay between −18° and 18° were used in this analysis. Thus, the range of data analyzed in retinocentric and nonretinocentric coordinates was the same. The percentage of neurons in the population with responses that varied significantly with nonretinocentric target position or with retinocentric target position was then computed and plotted as a function of time (see Fig. 4).
Figure 4.

Nonretinocentric bias in the CGp population as a function of time. The percentage of cells with a significant effect of either the nonretinocentric (black) or retinocentric (gray) position of the target on firing rate in an ANOVA in each of 11 200-ms epochs.
In a second analysis, a one-dimensional Gaussian model was fit to firing rate in each epoch plotted as a function of target position for those trials in which saccades were made from the central fixation stimulus (Platt and Glimcher, 1998). We used Gaussian functions to accommodate those neurons with both very narrow spatial selectivity (as shown in our example in Fig. 3b) and very broad spatial selectivity. A custom program (Matlab) used a Nelder-Meade simplex iterative fit to minimize the squared Cartesian distance between the Gaussian model and the firing rate using four free parameters. These parameters were the position of the center, the SD (σ), baseline (or tonic) firing rate (F0), and the amplitude of the Gaussian (Fmax):
 |
where y is the firing rate in the measured epoch during a single trial, and x is the horizontal target position.
Figure 3.

Tuning curves from two example cells in experiment 1 for the epochs after movement onset (a) (number of trials for each fixation position: left, n = 107; center, n = 81; right, n = 88) and preceding reward presentation (b) (left, n = 154; center, n = 144; right, n = 152). Firing rate is plotted against either retinocentric or nonretinocentric target position for each cell. Blue curves represent movements that began 10° left of center, red curves represent those beginning at the central fixation point, and green curves represent those beginning the point 10° right of center.
The fitting routine was run for 20, 000 iterations on 10 sets of random initial seed parameters. These initial parameters were as follows: the median target position for the center; 10 for σ; half of the maximum firing rate in the epoch for the amplitude (Fmax); and the median firing rate in the epoch for the baseline (F0). The center of the Gaussian was constrained to lie within 28° of the plot origin. σ values were limited to a range of 4° to 36°, the peak firing rate to a range of 0 to twice the maximum recorded firing rate in that epoch, and the base to a range of 0 to the maximum firing rate recorded in that epoch.
The resulting Gaussian model was then applied to plots of firing rate as a function of target position in either retinocentric or nonretinocentric coordinates for those trials in which saccades began at the left and right fixations. Error was computed as the sum squared Cartesian distance between the data and the model, and variance was calculated as the sum squared firing rate. Explained error was defined as the difference between error and variance divided by the variance. Average explained error across the population for each coordinate system was then compared. We predicted that the fit for the Gaussian model derived from trials initiated from the center fixation position to the tuning functions derived from trials initiated from the peripheral fixation positions would be better when data were plotted in the native coordinate system (i.e., retinocentric or nonretinocentric) for each neuron.
Analytical dissociation of egocentric and allocentric coordinates.
For each spatially tuned neuron in experiment 2, firing rate on each trial was first segregated by rotation position and then plotted as a function of target position with respect to either the subject (egocentric coordinates) or the stimulus panel (allocentric coordinates) (Fig. 1e). We predicted that tuning curves would overlap when plotted in egocentric coordinates if these neurons encode spatial information in a head- or body-centered framework (Fig. 1e, top row). Tuning curves would be expected to overlap when plotted as a function of the position of the target in the room if neurons encode the position of the target in non-egocentric, or allocentric, coordinates (Fig. 1e, bottom row). Note that the tuning curves generated in experiment 2 would also overlap if CGp neurons encode target position in retinocentric coordinates. To address this possibility, we compared these tuning curves with tuning curves generated from gaze shifts initiated from the central fixation position in Experiment 1.
To examine the degree to which egocentric or allocentric coordinates characterized tuning functions across the studied population of CGp neurons, we first analyzed firing rate data for each spatially tuned neuron (as defined above) using a two-factor ANOVA (Matlab) with egocentric and allocentric target position as factors. Because egocentric target positions could vary from −38° to 38° depending on rotation position, only trials in which the egocentric target position lay between −18° and 18° were used in this analysis. Thus, the range of data analyzed in egocentric and allocentric coordinates was the same. The percentage of neurons in the population with responses that varied significantly with egocentric target position or with allocentric target position by ANOVA was then computed and plotted as a function of time (see Fig. 6).
Figure 6.

Allocentric bias in the CGp population as a function of time. The percentage of cells with a significant effect of either the allocentric (black) or egocentric (gray) position of the target on firing rate in an ANOVA in each of 11 200-ms epochs.
Again, a one-dimensional Gaussian was fit to firing rate versus target position for the central rotation position as described above. The resulting Gaussian was then checked for fit to data collected for trials initiated when the monkey was rotated with respect to the stimulus panel. For those neurons for which the subject was rotated in both directions, the explained error for each rotation was averaged. The average explained error across the population for each coordinate frame was then compared. We predicted that the fit for the Gaussian model derived from trials initiated when the monkey faced the stimulus panel to the tuning functions derived from trials when the monkey was rotated with respect to the stimulus panel would be better when data were plotted in the native coordinate system (i.e., egocentric or allocentric) for each neuron.
Comparison of experiments.
Gaussians fit to the tuning curves collected when the monkey faced the center of the screen and fixated on the central fixation point in experiment 1 were analyzed for alignment with tuning curves collected from eccentric fixation points in experiment 1 as well as tuning curves collected when the subject was rotated in experiment 2, as described above. To compare the results of both experiments on a neuron-by-neuron basis, the error explained by the Gaussians fit to data plotted in nonretinocentric coordinates in experiment 1 were regressed against the error explained by the same Gaussian fits to data plotted in allocentric coordinates in experiment 2. A significant correlation suggested that the tuning curves collected from both experiments were best aligned when plotted in the same coordinates.
Analysis of aggregate population response.
To examine the alignment of spatial tuning functions in the aggregate population response, all trials from spatially tuned neurons studied in both experiment 1 and experiment 2 were combined into a single database for each experiment. To account for differences in the responsiveness of each neuron, firing rate in each epoch on each trial was first normalized by dividing by the average firing rate during the fixation epoch for that neuron. In experiment 1, firing rate was segregated by initial fixation position relative to the recording site (ipsilateral, central, or contralateral) and plotted as a function of either the horizontal distance between the current fixation stimulus (−10°, 0°, or 10°) and the target (retinocentric target position) or the horizontal distance between the central fixation stimulus (0°) and the target (nonretinocentric target position). For display, targets were plotted in 8° bins.
In experiment 2, firing rate in each epoch was normalized by the average firing rate during the fixation epoch in that rotation position, segregated by fixation position relative to the head and body (ipsilateral, central, or contralateral to the recording site), and plotted in 8° bins as a function of the target position with respect to either the subject (egocentric coordinates) or stimulus panel (allocentric coordinates). Note that, because data were collected in blocks in experiment 2, data were normalized by block, whereas in experiment 1, all data were normalized by the average fixation rate for all trials. Thus, the center curve for each experiment looks slightly different, despite the fact that the same data contribute to each plot. Regression lines were fit to each of the population tuning curves for both experiments. We computed the y = 1 intercepts for each tuning curve to estimate the horizontal position in each coordinate system at which neuronal responses increased from the average activity during the initial fixation period.
Analysis of fixation data.
We also analyzed neuronal activity during initial fixation to determine whether neuronal responses before the illumination of the target varied with egocentric or allocentric fixation position. In experiment 1, for all spatially tuned neurons that were also studied in experiment 2, firing rate during the initial fixation period was segregated by fixation point, averaged, and plotted. In experiment 2, only those spatially tuned neurons for which data were collected with the monkey rotated in both directions were analyzed. Firing rate was separated by rotation position, averaged, and plotted. An ANOVA was used to determine whether the firing rates varied significantly as a function of fixation position in each experiment, and post hoc unequal N honestly significant difference (HSD) tests were used to test for statistically significant differences.
Results
Experiment 1: retinocentric versus nonretinocentric test
Single neuron data
In experiment 1, 96 task-related neurons were analyzed. Mapping trials were used to assess the spatial sensitivity of each CGp neuron. A portion of the neuronal population had a significant relationship between firing rate and horizontal target position in the following epochs: after target (n = 11; 11%), before movement (15; 16%), immediately after movement (19; 20%), 200 ms after movement (33; 34%), and before reward (63; 66%). Neurons with a significant relationship between firing rate and horizontal target position during mapping trials for any of the five epochs (n = 70; 73%) were considered spatially tuned. We limited our study to the 51 of these 70 spatially selective neurons that were also studied in experiment 2 to compare the results of the two experiments. On average, monkeys completed 493 ± 19 (SE) trials in this task, averaging 164 trials initiated from each of the three fixation positions for spatially tuned neurons defined in this manner.
The neurons studied here demonstrated temporal response patterns similar to those reported previously for neurons in CGp (Dean et al., 2004). To confirm that the neurons were indeed similar, we computed a measure of contralateral bias based on the difference in firing rate associated with contraversive and ipsiversive movements for saccades initiated from the central fixation position (Fig. 2a). Additionally, the average slope of the linear regression for firing rate versus target position for the same trials was computed across the population and plotted for each epoch (Fig. 2b). As reported previously (Dean et al., 2004), both contrabias and the slope of the regression line fit to the data increased after the saccade. Overall, the spatial and temporal response properties of these neurons were similar to the responses of CGp neurons from previous reports (Olson et al., 1996; Dean et al., 2004).
Several single neurons had responses that appeared more closely aligned in nonretinocentric coordinates than in retinocentric coordinates in experiment 1. Two examples are shown in Figure 3. To visualize tuning curve alignment in each coordinate system, firing rate was segregated by initial fixation point and plotted as a function of either retinocentric target position or target position relative to the room (or subject, who was stationary in the room). The first example shows firing rate during the epoch beginning 200 ms after saccade onset (Fig. 3a). As was typical of many neurons in CGp, this example cell responded preferentially to contralateral targets. An ANOVA indicated that tuning curves aligned better as a function of nonretinocentric target position (F(5, 275) = 4.025; p < 0.01) than retinocentric target position (F(20, 275) = 0.737; p > 0.7). Figure 3b plots tuning curves for a second neuron, measured during the 200 ms epoch preceding reward presentation. Again, tuning curves aligned- closely when plotted as a function of nonretinocentric target position (F(5, 450) = 4.557; p ≪ 0.01) but not when plotted as a function of retinocentric target position (F(20, 450) = 1.072; p > 0.3). These data suggest that, for at least some CGp neurons, responses after saccades were not anchored to the retinocentric location of the target.
Population data
We next assessed the prevalence of retinocentric and nonretinocentric spatial referencing of neuronal activity in the CGp population. We first used a model-free approach based on factorial ANOVAs. An ANOVA was performed for each tuned neuron on firing rate data measured in 11 sequential 200 ms epochs. Firing rate was the dependent variable, and nonretinocentric and retinocentric target position were independent variables. We did not include the fixation epoch in this analysis because no target was present at this time. Because nonretinocentric target positions ranged between −18° and 18°, only trials with retinocentric target positions between −18° and 18° were used in this analysis; thus, the target ranges for analysis of firing rate in each coordinate system were identical. In the epochs after saccade onset, the proportion of neurons with a significant effect of nonretinocentric target position increased well above the proportion showing an effect of retinocentric position (Fig. 4) (ANOVA, time, F(10, 1100) = 2.884, p < 0.01; coordinate, F(1, 1100) = 10.94, p < 0.0001; interaction, F(10, 1100) = 0.5957, p > 0.8).
We next examined the data using a one-dimensional Gaussian model fit to firing rate as a function of horizontal target position for trials initiated from the central fixation position. Overall, the Gaussian models provided good fits to these data (average error explained by model, 57 ± 1.7%). The variance explained by the resulting Gaussian fit to firing rate as a function of either retinocentric or nonretinocentric target position was examined for trials initiated from each eccentric fixation. For each neuron, the error explained by the Gaussian model was calculated and averaged for the two eccentric fixations. Across the population, an ANOVA of explained error with time and coordinate system (retinocentric or nonretinocentric) as factors indicated a significant effect of coordinate system (F(1, 1100) = 20.29; p ≪ 0.001) but no effect of time (F(10, 1100) = 1.348; p > 0.1) and no interaction (F(10, 1100) = 0.501; p > 0.8). On average, Gaussian fits derived from data on trials initiated from the central fixation stimulus provided a significantly better fit (Student’s t test, p ≪ 0.001) to data from trials initiated eccentrically when plotted in nonretinocentric coordinates (explained error, 0.545 ± 0.008) than when the same data were plotted in retinocentric coordinates (explained error, 0.371 ± 0.038). These data strongly suggest that CGp neurons encode visuospatial events in a nonretinocentric manner.
Experiment 2: craniocentic versus allocentric test
Single neuron data
Experiment 1 indicated that the responses of many CGp neurons after visual target onset and saccade onset were not referenced spatially to the eyes. That experiment, however, could not distinguish whether CGp neurons referenced spatial information with respect to the subject’s head and body (egocentric coordinates) or the room and objects within it (allocentric coordinates). To determine whether neuronal responses in CGp are anchored in egocentric or allocentric coordinates, monkeys were passively rotated with respect to the stimulus display between blocks of delayed saccade trials in experiment 2. A total of 62 task-related neurons in two monkeys were studied. On average, subjects completed 267 ± 12 (SE) trials in the center condition in this task and 195 ± 8 (SE) trials when rotated in either direction. Moreover, only data collected from neurons with significant spatial tuning in any of the five epochs during mapping trials and also studied in experiment 1 (51; 80%) were included in subsequent analyses. Twenty-four neurons had data collected after rotations in both directions.
Many individual neurons had tuning curves that aligned better when plotted as a function of allocentric target position. Tuning curves for two example neurons are shown in Figure 5. Both responded preferentially for targets presented contralaterally to the recording site, in this case the right hemisphere in both examples. For the first example neuron (Fig. 5a), tuning curves plotting firing rate in the epoch beginning 200 ms after movement onset aligned better when plotted in allocentric coordinates (F(5, 655) = 3.100; p < 0.01) than when plotted in egocentric coordinates (F(15, 655) = 1.281; p > 0.2). Figure 5b shows tuning curves plotted for a second example neuron during the 200 ms epoch preceding reward presentation. Like many neurons in CGp, this cell had broad spatial selectivity, and firing rate increased for contralateral saccades. Again, tuning curves aligned more closely when plotted as a function of the location of the target with respect to the room (F(5, 632) = 5.449; p ≪ 0.001) than when plotted as a function of the target with respect to the subject (F(15, 632) = 2.315; p < 0.01), although both ANOVAs were significant. There was no interaction between the effects (F(2, 632) = 0.5059; p > 0.06). Collectively, these data indicate that at least some CGp neurons responded to visuospatial events in a viewpoint-independent manner, suggestive of an allocentric frame of reference.
Figure 5.
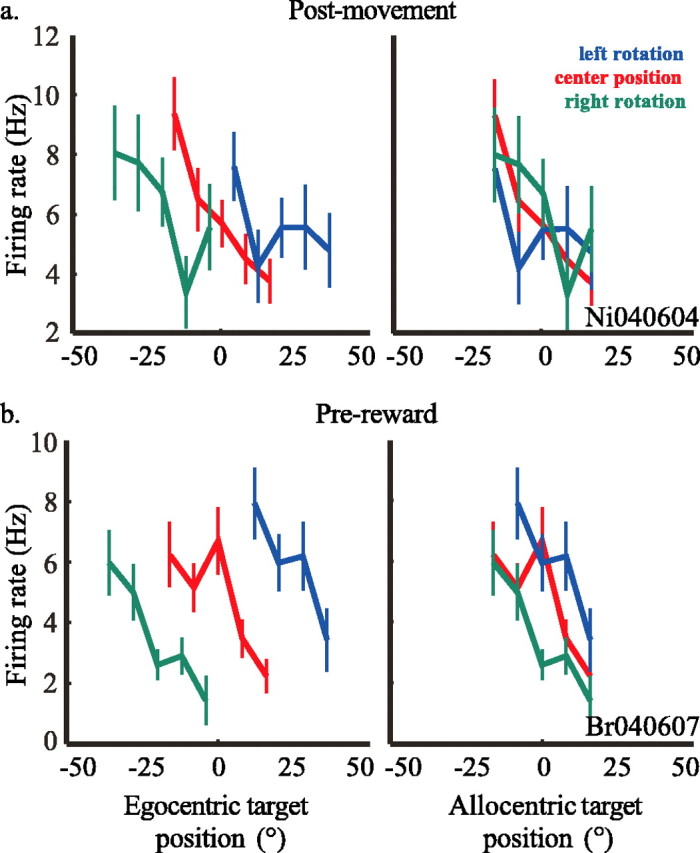
Tuning curves from two example cells in experiment 2 for the epochs after movement onset (a) (number of trials for each rotation position: left, n = 183; center, n = 322; right, n = 151) and preceding reward presentation (b) (left, n = 153; center, n = 278; right, n = 202). Firing rate is plotted against either target position with respect to the subject or target position in the room for each cell. Blue curves represent trials during which the subject was rotated 20° to the left, red curves represent those during which the subject was centered, and green curves represent those during which the subject was rotated 20° to the right. For each neuron, the number of trials beginning at each rotation position (−20°, 0°, 20°) is indicated by the blue, red, and green numbers, respectively.
Population data
We assessed the prevalence of allocentric spatial referencing in the CGp population as in experiment 1. An ANOVA was performed on firing rate data for each tuned neuron in 11 sequential 200 ms epochs, with firing rate as the dependent variable and egocentric and allocentric target position as independent variables. Because allocentric target positions ranged between −18° and 18°, only trials with egocentric target positions between −18° and 18° were used in this analysis. In the epochs after movement onset, the proportion of neurons with a significant effect of allocentric target position increased well above the proportion showing an effect of egocentric position (Fig. 6) (ANOVA, time, F(10, 1100) = 1.459, p = 0.14932, p > 0.1; coordinate, F(1, 1100) = 10.43, p < 0.01; interaction, F(10, 1100) = 0.4613, p > 0.9).
We next examined the data using a one-dimensional Gaussian model fit to firing rate as a function of horizontal target position for trials in which data were collected with the subject in the central rotation position. Note that these data are the same data collected from the central fixation point in experiment 1. Thus, the Gaussian models used in this analysis are the same. Overall, the Gaussian models provided a good fit to data collected from the center rotation position when plotted in either allocentric or egocentric coordinates (average error explained by model, 56 ± 1.7%). Next, the fit of the resulting Gaussian to firing rate as a function of either egocentric or allocentric target position was examined for trials during which the subject was rotated. For each cell, the explained error was calculated and, if data were collected after rotations in both directions, averaged for the two rotation positions. Across the population, an ANOVA of explained error with time and coordinate as factors showed an effect of coordinate (F(1, 1100) = 9.958; p < 0.01) but no effect of time (F(10, 1100) = 1.218; p > 0.2) and no interaction (F(10, 1100) = 0.716; p > 0.7). On average, Gaussian fits derived from data on trials initiated from the central rotation position provided a significantly better fit (t test, p < 0.01) to data from trials initiated when the monkey was rotated with respect to the stimulus panel when these data were plotted in allocentric coordinates (explained error, 0.378 ± 0.072) than when the same data were plotted in egocentric coordinates (explained error, 0.113 ± 0.043). These data strongly suggest that CGp neurons encode visuospatial events in allocentric coordinates.
Comparison of experiments
In experiment 1, Gaussians fit to the center fixation data explained the data collected from eccentric fixations better when data were plotted in nonretinocentric rather than retinocentric coordinates. Similarly, experiment 2 demonstrated that Gaussians fit to data collected when subjects faced the stimulus screen better explained data collected when subjects were rotated when data were plotted in allocentric coordinates instead of egocentric coordinates. Because the same trials were used in calculating Gaussians fit to the center fixation data in experiment 1 and center rotation data in experiment 2, we can directly compare the results for each neuron in both experiments.
A regression of the variance explained by Gaussians fit to eccentric target position data in experiment 1 and rotated position data in experiment 2 during the epoch 200–400 ms after movement showed that goodness of fit in allocentric coordinates in experiment 2 was significantly correlated with goodness of fit to data plotted in nonretinocentric coordinates in experiment 1 (regression, r = 0.374; p < 0.01). There was no correlation between explained variance plotted in retinocentric and egocentric coordinates in the two experiments (regression, r = 0.0512; p > 0.8). Thus, neurons whose responses aligned with nonretinocentric target position in experiment 1 had responses that aligned with allocentric target position in experiment 2. These results suggest that the same allocentric reference frame characterizes the tuning functions generated in experiments 1 and 2.
Tuning curve alignment in the average population response
Because of the generally broad spatial selectivity of CGp neurons, we next assessed whether the average population response could be characterized as egocentric or allocentric. Because overall responsiveness varied from neuron to neuron, firing rate in each trial for each neuron was first normalized by dividing by the average firing rate during the fixation period for that cell. In experiment 1, data were normalized by the average fixation rate in all trials. Because data in experiment 2 were collected in blocks, data were normalized by average fixation firing rate during that block. Normalized data from all trials were then combined and plotted for the post-movement epoch (Fig. 7).
Figure 7.
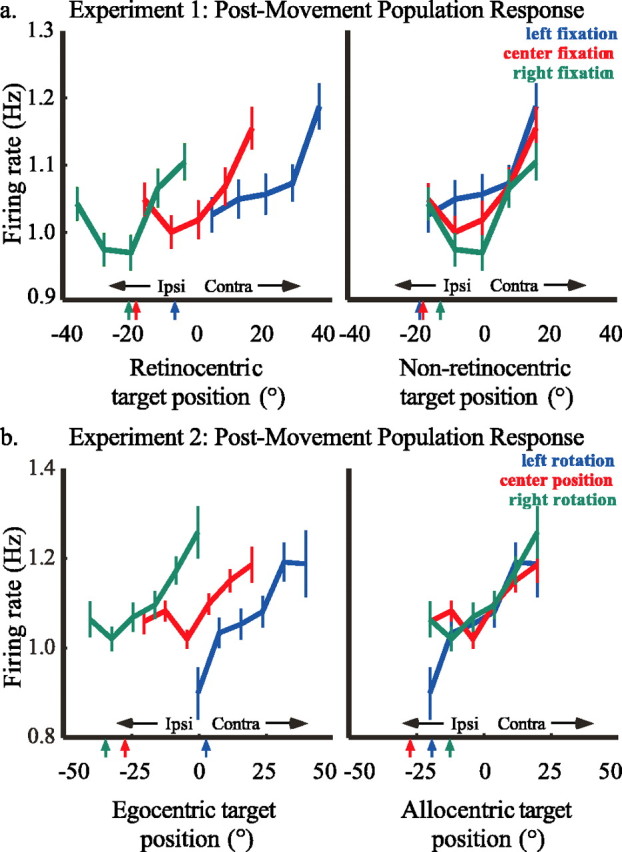
Aggregate population tuning curves for the post-movement epoch in experiment 1 (a) (number of trials for each fixation position: left, n = 8368; center, n = 9090; right, n = 8485) and experiment 2 (b) (number of trials for each rotation position: left, n = 5943; center, n = 13, 400; right, n = 8233). In a, firing rate, normalized for each neuron, rotated so that contralateral targets were positive, and averaged across the population, is plotted against either the retinocentric or nonretinocentric target position. Blue curves represent movements that began 10° left of center, red curves represent those beginning at the central fixation point, and green curves represent those beginning 10° right of center. Colored arrows at the bottom of each plot indicate the y = 1 intercept for each curve. In b, firing rate, normalized for each neuron, rotated so that contralateral targets were positive, and averaged across the population, is plotted against either egocentric or allocentric target position. Blue curves represent trials during which the subject was rotated 20° to the left, red curves represent those during which the subject was centered, and green curves represent those during which the subject was rotated 20° to the right. Colored arrows at the bottom of each frame indicate the y = 1 intercept for each curve.
In experiment 1, the CGp population response was tuned broadly for the hemifield contralateral to the recording site. Tuning curves generally aligned better when plotted in nonretinocentric coordinates than in retinocentric coordinates (Fig. 7a). Regression lines fit to each tuning curve yielded y = 1 intercepts, which were closer when plotted as a function of nonretinocentric target position (−20.2, −18.9, and −13.5) than when they were plotted as a function of retinocentric target position (−7.4, −18.9, and −21.5). These data suggest that the aggregate CGp population response signals visuospatial information in a nonretinocentric manner.
For experiment 2, the population response also increased for contralateral saccades (Fig. 7b). Tuning curves aligned better when plotted as a function of allocentric rather than egocentric target position. Again, regression lines fit to the tuning curves yielded y = 1 intercepts, which were closer when fit to tuning curves plotted in allocentric coordinates (−12.7, −28.5, and −20.0) than when fit to tuning curves plotted in egocentric coordinates (−33.8, −28.5, and 2.9).
Population response during initial fixation
The results of experiment 1 suggest that neuronal responses to the target in CGp are anchored spatially in a nonretinocentric frame of reference. Such a reference frame could be anchored to the head, body, or position of objects in space. To distinguish these possibilities, in experiment 2, tuning curves were compared both before and after monkeys were rotated with respect to the stimulus screen. In that experiment, tuning curves were better aligned when plotted as a function of target position in the room, suggesting that CGp neurons encode spatial information in a viewpoint-independent, or allocentric, frame of reference. If so, then average firing rate during fixation but before the illumination of the saccade target might systematically vary with the position of the fixation target in the room, independent of the viewpoint of the monkey.
To test this hypothesis, we computed average firing rate during fixation before target onset in both experiments 1 and 2 and plotted these data as a function of the position of the fixation LED with respect to the room (experiment 1) or the position of the LED with respect to the subject (experiment 2). Only the 51 neurons that were studied in both experiments were included in the analysis of experiment 1, and only those 24 neurons for which the subject was rotated in both directions were included in the analysis of experiment 2. In experiment 1, the position of the fixation target varied with respect to the subject as well as the room because the subject was fixed in place. In that experiment, neuronal responses before target onset varied significantly with fixation position (regression, r = 0.0315; p ≪ 0.001). Firing rate was significantly higher when subjects fixated the contralateral stimulus (unequal N HSD, p ≪ 0.001) (Fig. 8a).
Figure 8.

Average firing rate in the CGp population during initial fixation across all trials in experiment 1 (a) and experiment 2 (b). In a, all trials for all neurons studied in experiment 2 (n = 51) are included (−10, n = 8368 trials; 0, n = 9090; 10, n = 8485). In b, only neurons in which data were collected after rotation in both directions (n = 23) are included (−20, n = 4402 trials; 0, n = 6315; 20, n = 4886). Significant differences between firing rates for each fixation are indicated by t test at *p < 0.05 and **p < 0.01 level.
These results are not likely to be attributable to uncontrolled visual responses for several reasons. First, experiments were conducted in a darkened room with little visual input other than the LEDs. Second, if neuronal responses were the result of differences in the visual input provided by individual LEDs or visible features in the room, we would expect firing rate to vary with absolute LED position in the room rather than LED position with respect to the hemisphere of recording, but this was not the case (regression, r = 0.0015; p > 0.8).
In experiment 2, the fixation stimulus was always located at the center of the tangent screen, independent of the viewpoint of the subject. In that experiment, we found that average firing rate during fixation did not vary systematically as a function of target position with respect to the subject or room, which were equivalent (regression, r = 0.0013; p > 0.8) (Fig. 8b). Post hoc tests revealed no significant differences between fixation firing rates for the various fixation positions in experiment 2 (unequal N HSD, p > 0.06 for all comparisons). These results are consistent with the hypothesis that CGp encodes visuospatial information, even during maintained fixation in a darkened room, in an allocentric frame of reference.
Discussion
Summary
The spatial location of viewed objects can be encoded egocentrically with respect to the eye, head, or body or in coordinates invariant to the viewer’s movement in a non-egocentric, or allocentric, reference frame. Distinguishing these coordinate systems requires independent manipulation of target position, eye position, and body position. We found that, when retinocentric target position was dissociated from nonretinocentric target position, CGp neurons generally responded in a nonretinocentric manner. Similarly, when we dissociated egocentric from allocentric target position, neuronal responses in CGp aligned better in an allocentric frame of reference.
Relationship to previous electrophysiological studies in CGp
Only one previous study has probed the influence of eye movements and eye position on neuronal activity in primate CGp (Olson et al., 1996). That study reported that most CGp neurons responded after saccade onset and that these responses varied with eye position, saccade direction, and saccade amplitude, suggesting a nonretinocentric frame of reference. However, that paper did not dissociate egocentric and allocentric coordinates. Our results confirm and extend those findings by demonstrating that spatial information in CGp appears to be anchored to the allocentric location of objects in the environment rather than the eyes, head, or body.
Spatial deficits after lesions of posterior cingulate cortex
In humans, lesions or hypofunction in posterior cingulate cortex, particularly right retrosplenial cortex (Brodmann’s areas 29 and 30), have been associated with spatial disorientation (Cammalleri et al., 1996; Takahashi et al., 1997; Katayama et al., 1999; Maguire, 2001). Lesions to retrosplenial cortex (area 29) in rodents disrupts spatial navigation and maze learning (Harker and Whishaw, 2004; Lukoyanov et al., 2005). Although we examined only the responses of cells presumed to lie in areas 23 and 31 of cingulate cortex and not the closely connected areas 29 and 30, disruptions in topographic spatial orientation after retrosplenial lesions are consistent with the allocentric bias in visuospatial representations uncovered in our study.
Neuroimaging evidence for allocentric spatial representations in human posterior cingulate cortex
Posterior cingulate cortex has been implicated in the allocentric representation of space in neuroimaging studies in humans. In several positron emission tomography (PET) studies, subjects asked to mentally navigate a previously learned route showed activation in posterior cingulate cortex (areas 23/30) (Ghaem et al., 1997). Similarly, PET scans of London taxi drivers recalling routes (Maguire et al., 1997) revealed activation of posterior cingulate cortex (areas 30/31), as well as the medial parietal lobe and the right hippocampus. The same group found that CGp was activated in subjects actively learning to navigate a virtual environment (Maguire et al., 1998). Moreover, CGp was selectively activated when subjects were asked to freely explore a virtual environment compared with when movements were cued. Another study demonstrated increased retrosplenial cortex (area 30) activation when subjects localized objects with respect to large landmarks compared with localizing objects relative to other objects or the observer (Committeri et al., 2004). Thus, neuroimaging data also suggest that human posterior cingulate cortex contributes to the allocentric representation of visual space.
Relationship to spatial representations in other areas
Posterior cingulate cortex is strongly interconnected with both parietal cortex (Vogt et al., 1979; Pandya et al., 1981; Cavada and Goldman-Rakic, 1989; Andersen et al., 1990a) and the parahippocampal gyrus (Baleydier and Mauguiere, 1980; Pandya et al., 1981; Vogt and Pandya, 1987), which have been linked to visuospatial representations underlying orienting and navigation, respectively (Posner et al., 1982; Maguire et al., 1996; Karnath, 1997).
Parietal cortex has been implicated in the egocentric representation of spatial information by electrophysiological studies in monkeys (Duhamel et al., 1997; Colby and Goldberg, 1999), neuroimaging studies (Galati et al., 2000), and spatial deficits after lesions in humans (Bisiach, 1997; Vallar, 1997, 1998). Specifically, it has been argued that neurons in the lateral intraparietal area (LIP), the parietal reach region, and area 7a encode spatial information in a common eye-centered frame of reference, which is modulated by eye, head, body, or limb position (Andersen et al., 1985, 1990b, 1997, 1998; Andersen and Buneo, 2002; Cohen and Andersen, 2002) or, for LIP at least, in a mixed frame of reference ranging from eye to head centered (Mullette-Gillman et al., 2005). Spatial information encoded in these areas could then be read out by other brain areas in head-, body-, or object-centered coordinates appropriate for guiding movements by different effectors. An alternative theory suggests that parietal neurons may encode spatial information in several different reference frames by combining visual and eye- or body-position signals in a series of basis functions (Pouget et al., 2002).
Spatial representations in the hippocampus and parahippocampal cortex appear to be allocentric rather than egocentric. Neurons in the hippocampus have been reported to respond to selective head directions (Taube et al., 1990), specific places (O’Keefe and Dostrovsky, 1971) or particular points of view (Rolls, 1999). Neuroimaging studies have demonstrated activation of the hippocampus or hippocampal formation in several topographical spatial orientation and navigation tasks (Aguirre et al., 1996; Maguire, 1997; Maguire et al., 1997; Gron et al., 2000), and damage to these areas leads to deficits in recalling or remembering the location or identity of landmarks (Aguirre and D’Esposito, 1999; Spiers et al., 2001).
The anatomical interposition of posterior cingulate cortex between parietal cortex and the parahippocampal gyrus led Vogt et al. (1992) to posit that CGp serves to transform egocentric visuospatial representations arising in parietal cortex into allocentric representations found in the hippocampus. Our data are consistent with this hypothesis. Although we found a strong bias toward alignment of neuronal tuning functions in allocentric coordinates in CGp, this bias did not appear to be absolute, because some neurons appeared to encode spatial information in retinocentric (experiment 1) or egocentric (experiment 2) coordinates. This suggests that transformation from egocentric visuospatial representations in parietal cortex to allocentric visuospatial representations in the hippocampus and surrounding areas may be incomplete (cf. Mullette-Gillman et al., 2005). The broad spatial tuning of some CGp neurons might also have contributed to difficulty in discriminating which coordinate framework best characterized neuronal responses. Allocentric encoding of visuospatial information in CGp should therefore be viewed as a bias until it can be confirmed using complementary techniques, such as microstimulation or reversible inactivation.
Allocentric representation of visuospatial salience in CGp
Together, several independent lines of evidence suggest that posterior cingulate cortex may signal the salience of objects or locations in the world. In monkeys, CGp neurons respond after target onset when monkeys must withhold gaze shifts during an unpredictable delay (Dean et al., 2004) but do not respond when the same target reflexively triggers a gaze shift (Olson et al., 1996; Dean et al., 2004). Moreover, CGp neurons respond to large checkerboard patterns in monkeys fixating the center of the stimulus screen but do not respond to irrelevant spots of light (Olson et al., 1993). In addition, neuronal activity in CGp decreases when more than one stimulus (fixation target and saccade target) is present during delay, suggesting split attention or competing salience (Dean et al., 2004). Recent studies also indicate that neuronal activity in CGp varies with reward size and reward uncertainty (McCoy et al., 2003; McCoy and Platt, 2005).
Our results demonstrate that the responses of CGp neurons are more closely linked to the locations of objects in space rather than relative to the subject. These results help to explain why CGp neurons respond after target onset as well as after shifting gaze to the target: these two salient events draw attention to the same location in space but not to the same location on the retina. Similarly, rewards delivered or omitted while monkeys fixate a particular location in space activate these neurons because they enhance the salience of that location and draw attention to it. If CGp does serve to signal the current salience of a particular location in the world or the amount of attention devoted to that position, neuronal response magnitude should correlate with measures of visuospatial performance. Although single CGp neurons have yet to be studied in monkeys performing an attentionally demanding visual discrimination task at psychophysical threshold, we recently reported that the magnitude of CGp responses after target onset on delayed saccade trials predicts saccade accuracy: the distance between the endpoint of the movement and the target (Dean et al., 2004). This observation is consistent with the hypothesis that CGp signals the salience of, or amount of attention devoted to, objects or locations in the world.
Conclusions
We report an allocentric bias in the representation of visuospatial events by neurons in posterior cingulate cortex. Allocentric encoding of visuospatial events by CGp neurons is consistent with spatial deficits observed after damage to portions of posterior cingulate cortex and recent neuroimaging results implicating this area in topographic spatial navigation. A number of observations suggest that CGp may encode the current salience of objects or locations in the world. Such information could be used to assign meaning or value to orienting and navigating to important objects and events in a behaviorally adaptive manner.
Footnotes
This work was supported by National Institutes of Health Grants EY013496 and NS046193, the McDonnell-Pew Program in Cognitive Neuroscience, the Whitehall Foundation, and the EJLB Foundation. We thank Sheila Roberts for expert technical assistance and Michael Bendiksby, Stephen Shepherd, Ben Hayden, Arwen Long, Jeff Klein, and Jamie Roitman for helpful comments on this manuscript.
References
- Aguirre GK, D’Esposito M (1999). Topographical disorientation: a synthesis and taxonomy. Brain 122:1613–1628. [DOI] [PubMed] [Google Scholar]
- Aguirre GK, Detre JA, Alsop DC, D’Esposito M (1996). The parahippocampus subserves topographical learning in man. Cereb Cortex 6:823–829. [DOI] [PubMed] [Google Scholar]
- Andersen RA (1997). Multimodal integration for the representation of space in the posterior parietal cortex. Philos Trans R Soc Lond B Biol Sci 352:1421–1428. [DOI] [PMC free article] [PubMed] [Google Scholar]
- Andersen RA, Buneo CA (2002). Intentional maps in posterior parietal cortex. Annu Rev Neurosci 25:189–220. [DOI] [PubMed] [Google Scholar]
- Andersen RA, Essick GK, Siegel RM (1985). Encoding of spatial location by posterior parietal neurons. Science 230:456–458. [DOI] [PubMed] [Google Scholar]
- Andersen RA, Asanuma C, Essick G, Siegel RM (1990a). Corticocortical connections of anatomically and physiologically defined subdivisions within the inferior parietal lobule. J Comp Neurol 296:65–113. [DOI] [PubMed] [Google Scholar]
- Andersen RA, Bracewell RM, Barash S, Gnadt JW, Fogassi L (1990b). Eye position effects on visual, memory, and saccade-related activity in areas LIP and 7a of macaque. J Neurosci 10:1176–1196. [DOI] [PMC free article] [PubMed] [Google Scholar]
- Andersen RA, Snyder LH, Li CS, Stricanne B (1993). Coordinate transformations in the representation of spatial information. Curr Opin Neurobiol 3:171–176. [DOI] [PubMed] [Google Scholar]
- Andersen RA, Snyder LH, Bradley DC, Xing J (1997). Multimodal representation of space in the posterior parietal cortex and its use in planning movements. Annu Rev Neurosci 20:303–330. [DOI] [PubMed] [Google Scholar]
- Andersen RA, Snyder LH, Batista AP, Buneo CA, Cohen YE (1998). Posterior parietal areas specialized for eye movements (LIP) and reach (PRR) using a common coordinate frame. Novartis Found Symp 218:109–122. [DOI] [PubMed] [Google Scholar]
- Baleydier C, Mauguiere F (1980). The duality of the cingulate gyrus in monkey. Neuroanatomical study and functional hypothesis. Brain 103:525–554. [DOI] [PubMed] [Google Scholar]
- Bisiach E (1997). The spatial features of unilateral neglect. Parietal lobe contributions to orientation in 3D space. 465–495. Heidelberg: Springer.
- Cammalleri R, Gangitano M, D’Amelio M, Raieli V, Raimondo D, Camarda R (1996). Transient topographical amnesia and cingulate cortex damage: a case report. Neuropsychologia 34:321–326. [DOI] [PubMed] [Google Scholar]
- Cavada C, Goldman-Rakic PS (1989). Posterior parietal cortex in rhesus monkey. I. Parcellation of areas based on distinctive limbic and sensory corticocortical connections. J Comp Neurol 287:393–421. [DOI] [PubMed] [Google Scholar]
- Cohen YE, Andersen RA (2002). A common reference frame for movement plans in the posterior parietal cortex. Nat Rev Neurosci 3:553–562. [DOI] [PubMed] [Google Scholar]
- Colby CL, Goldberg ME (1999). Space and attention in parietal cortex. Annu Rev Neurosci 22:319–349. [DOI] [PubMed] [Google Scholar]
- Committeri G, Galati G, Paradis A, Pizzamiglio L, Berthoz A, LeBihan D (2004). Reference frames for spatial cognition: different brain areas are involved in viewer-, object-, and landmark-centered judgments about object location. J Cogn Neurosci 16:1517–1535. [DOI] [PubMed] [Google Scholar]
- Dean HL, Crowley JC, Platt ML (2004). Visual and saccade related activity in macaque posterior cingulate cortex. J Neurophysiol 92:3056–3068. [DOI] [PubMed] [Google Scholar]
- Duhamel JR, Bremmer F, BenHamed S, Graf W (1997). Spatial invariance of visual receptive fields in parietal cortex neurons. Nature 389:845–848. [DOI] [PubMed] [Google Scholar]
- Galati G, Lobel E, Vallar G, Berthoz A, Pizzamiglio L, Le Bihan D (2000). The neural basis of egocentric and allocentric coding of space in humans: a functional magnetic resonance study. Exp Brain Res 133:156–164. [DOI] [PubMed] [Google Scholar]
- Ghaem O, Mellet E, Crivello F, Tzourio N, Mazoyer B, Berthoz A, Denis M (1997). Mental navigation along memorized routes activates the hippocampus, precuneus, and insula. NeuroReport 8:739–744. [DOI] [PubMed] [Google Scholar]
- Gron G, Wunderlich AP, Spitzer M, Tomczak R, Riepe MW (2000). Brain activation during human navigation: gender-different neural networks as substrate of performance. Nat Neurosci 3:404–408. [DOI] [PubMed] [Google Scholar]
- Harker KT, Whishaw IQ (2004). A reaffirmation of the retrosplenial contribution to rodent navigation: reviewing the influences of lesion, strain, and task. Neurosci Biobehav Rev 28:485–496. [DOI] [PubMed] [Google Scholar]
- Karnath HO (1997). Spatial orientation and the representation of space with parietal lobe lesions. Philos Trans R Soc Lond B Biol Sci 352:1411–1419. [DOI] [PMC free article] [PubMed] [Google Scholar]
- Katayama K, Takahashi N, Ogawara K, Hattori T (1999). Pure topographical disorientation due to right posterior cingulate lesion. Cortex 35:279–282. [DOI] [PubMed] [Google Scholar]
- Lukoyanov NV, Lukoyanova EA, Andrade JP, Paula-Barbosa MM (2005). Impaired water maze navigation of Wistar rats with retrosplenial cortex lesions: effect of nonspatial pretraining. Behav Brain Res 158:175–182. [DOI] [PubMed] [Google Scholar]
- Maguire EA (1997). Hippocampal involvement in human topographical memory: evidence from functional imaging. Philos Trans R Soc Lond B Biol Sci 352:1475–1480. [DOI] [PMC free article] [PubMed] [Google Scholar]
- Maguire EA (2001). The retrosplenial contribution to human navigation: a review of lesion and neuroimaging findings. Scand J Psychol 42:225–238. [DOI] [PubMed] [Google Scholar]
- Maguire EA, Frackowiak RS, Frith CD (1996). Learning to find your way: a role for the human hippocampal formation. Proc Biol Sci 263:1745–1750. [DOI] [PubMed] [Google Scholar]
- Maguire EA, Frackowiak RS, Frith CD (1997). Recalling routes around London: activation of the right hippocampus in taxi drivers. J Neurosci 17:7103–7110. [DOI] [PMC free article] [PubMed] [Google Scholar]
- Maguire EA, Frith CD, Burgess N, Donnett JG, O’Keefe J (1998). Knowing where things are parahippocampal involvement in encoding object locations in virtual large-scale space. J Cogn Neurosci 10:61–76. [DOI] [PubMed] [Google Scholar]
- Matsumura N, Nishijo H, Tamura R, Eifuku S, Endo S, Ono T (1999). Spatial- and task-dependent neuronal responses during real and virtual translocation in the monkey hippocampal formation. J Neurosci 19:2381–2393. [DOI] [PMC free article] [PubMed] [Google Scholar]
- McCoy AN, Platt ML (2005). Risk-sensitive neurons in macaque posterior cingulate cortex. Nat Neurosci 8:1220–1227. [DOI] [PubMed] [Google Scholar]
- McCoy AN, Crowley JC, Haghighian G, Dean HL, Platt ML (2003). Saccade reward signals in posterior cingulate cortex. Neuron 40:1031–1040. [DOI] [PubMed] [Google Scholar]
- Mullette-Gillman OA, Cohen YE, Groh JM (2005). Eye-centered, head-centered, and complex coding of visual and auditory targets in the intraparietal sulcus. J Neurophysiol 94:2331–2352. [DOI] [PubMed] [Google Scholar]
- Musil SY, Olson CR (1993). The role of cat cingulate cortex in sensorimotor integration. Neurobiology of cingulate cortex and limbic thalamus: a comprehensive handbook. 345–365. Boston: Birkhäuser.
- O’Keefe J, Dostrovsky J (1971). The hippocampus as a spatial map. Preliminary evidence from unit activity in the freely-moving rat. Brain Res 34:171–175. [DOI] [PubMed] [Google Scholar]
- Olson CR, Musil SY, Goldberg ME (1993). Posterior cingulate cortex and visuaospatial cognition: properties of single neurons in the behaving monkey. Neurobiology of cingulate cortex and limbic thalamus: a comprehensive handbook. 366–380. Boston: Birkhäuser.
- Olson CR, Musil SY, Goldberg ME (1996). Single neurons in posterior cingulate cortex of behaving macaque: eye movement signals. J Neurophysiol 76:3285–3300. [DOI] [PubMed] [Google Scholar]
- Pandya DN, Van Hoesen GW, Mesulam MM (1981). Efferent connections of the cingulate gyrus in the rhesus monkey. Exp Brain Res 42:319–330. [DOI] [PubMed] [Google Scholar]
- Platt ML, Glimcher PW (1997). Responses of intraparietal neurons to saccadic targets and visual distractors. J Neurophysiol 78:1574–1589. [DOI] [PubMed] [Google Scholar]
- Platt ML, Glimcher PW (1998). Response fields of intraparietal neurons quantified with multiple saccadic targets. Exp Brain Res 121:65–75. [DOI] [PubMed] [Google Scholar]
- Posner MI, Cohen Y, Rafal RD (1982). Neural systems control of spatial orienting. Philos Trans R Soc Lond B Biol Sci 298:187–198. [DOI] [PubMed] [Google Scholar]
- Pouget A, Deneve S, Duhamel JR (2002). A computational perspective on the neural basis of multisensory spatial representations. Nat Rev Neurosci 3:741–747. [DOI] [PubMed] [Google Scholar]
- Robertson RG, Rolls ET, Georges-Francois P, Panzeri S (1999). Head direction cells in the primate pre-subiculum. Hippocampus 9:206–219. [DOI] [PubMed] [Google Scholar]
- Rolls ET (1999). Spatial view cells and the representation of place in the primate hippocampus. Hippocampus 9:467–480. [DOI] [PubMed] [Google Scholar]
- Spiers HJ, Burgess N, Hartley T, Vargha-Khadem F, O’Keefe J (2001). Bilateral hippocampal pathology impairs topographical and episodic memory but not visual pattern matching. Hippocampus 11:715–725. [DOI] [PubMed] [Google Scholar]
- Takahashi N, Kawamura M, Shiota J, Kasahata N, Hirayama K (1997). Pure topographic disorientation due to right retrosplenial lesion. Neurology 49:464–469. [DOI] [PubMed] [Google Scholar]
- Taube JS, Muller RU, Ranck JB Jr (1990). Head-direction cells recorded from the postsubiculum in freely moving rats. II. Effects of environmental manipulations. J Neurosci 10:436–447. [DOI] [PMC free article] [PubMed] [Google Scholar]
- Vallar G (1997). Spatial frames of reference and somatosensory processing: a neuropsychological perspective. Philos Trans R Soc Lond B Biol Sci 352:1401–1409. [DOI] [PMC free article] [PubMed] [Google Scholar]
- Vallar G (1998). Spatial hemineglect in humans. Trends Cogn Sci 2:87–97. [DOI] [PubMed] [Google Scholar]
- Vogt BA, Pandya DN (1987). Cingulate cortex of the rhesus monkey: II. Cortical afferents. J Comp Neurol 262:271–289. [DOI] [PubMed] [Google Scholar]
- Vogt BA, Rosene DL, Pandya DN (1979). Thalamic and cortical afferents differentiate anterior from posterior cingulate cortex in the monkey. Science 204:205–207. [DOI] [PubMed] [Google Scholar]
- Vogt BA, Finch DM, Olson CR (1992). Functional heterogeneity in cingulate cortex: the anterior executive and posterior evaluative regions. Cereb Cortex 2:435–443. [DOI] [PubMed] [Google Scholar]