

Abstract
Subunits of the NMDA receptor (NMDAR) associate with many postsynaptic proteins that substantially broaden its signaling capacity. Although much work has been focused on the signaling of NR2 subunits, little is known about the role of the NR1 subunit. We set out to elucidate the role of the C terminus of the NR1 subunit in NMDAR signaling. By introducing a C-terminal deletion mutant of the NR1 subunit into cultured neurons from NR1−/− mice, we found that the C terminus was essential for NMDAR inactivation, downstream signaling, and gene expression, but not for global increases in intracellular Ca2+. Therefore, whereas NMDARs can increase Ca2+ throughout the neuron, NMDAR-dependent signaling, both local and long range, requires coupling through the NR1 C terminus. Two major NR1 splice variants differ by the presence or absence of a C-terminal domain, C1, which is determined by alternative splicing of exon 21. Analysis of these two variants showed that removal of this domain significantly reduced the efficacy of NMDAR-induced gene expression without affecting receptor inactivation. Thus, the NR1 C terminus couples to multiple downstream signaling pathways that can be modulated selectively by RNA splicing.
Keywords: NMDA receptor, NR1 subunit, alternative splicing, gene expression, calcium, CREB
Introduction
The NMDA receptor (NMDAR) is essential in learning and memory and is implicated in multiple neurological disorders (Petrie et al., 2000; Cull-Candy et al., 2001; Nakazawa et al., 2004). These receptors interact with 185 or more proteins and form signaling complexes in the postsynaptic density (Grant, 2003). These NMDAR complexes localize signaling molecules with Ca2+ influx and may facilitate the activation of second-messenger pathways that effect change in the channel (Lan et al., 2001), the synapse (Lisman, 2001; Malinow and Malenka, 2002), and the nucleus (Deisseroth et al., 1996; Hardingham et al., 2001). They form because cytoplasmic tails of NMDAR subunits (NR1, NR2A–NR2D, and NR3A–NR3B) associate directly and specifically with signaling and structural molecules (Sheng and Kim, 2002). In mice in which the C terminus of NR2A, NR2B, or NR2C subunits is truncated, NMDARs flux Ca2+ in response to glutamate, but the mice exhibit a phenotype similar to mice that lack the subunit altogether (Sprengel et al., 1998). Clearly, the C termini of NR2 subunits are important for downstream signaling of NMDARs. What about the NR1 subunit?
The NR1 subunit is required for the assembly of functional NMDARs and has the most highly regulated C terminus of all NMDAR subunits (Zukin and Bennett, 1995). The C0 domain is common to all splice variants, whereas alternative splicing of exons 21 and 22 defines C1 and C2, respectively. Regulation of these domains affects the association of the subunit with signaling and structural molecules, including calmodulin (CaM) (Ehlers et al., 1996), Ca2+/CaM-dependent protein kinase IIα (CaMKIIα) (Leonard et al., 2002), yotiao (Lin et al., 1998), and neurofilament-L (Ehlers et al., 1998). Furthermore, expression of NR1 splice variants varies by developmental stage (Monyer et al., 1994; Sheng et al., 1994) and location (Laurie and Seeburg, 1994) and can be regulated by activity (Xie and Black, 2001; Mu et al., 2003). Therefore, the composition of NMDAR signaling complexes may be dynamically regulated through the splicing of NR1.
The effects of splicing on downstream signaling pathways are poorly understood for several reasons. First, assembly of complexes and recruitment of signaling pathways require many molecules that may not be present in heterologous cells or oocytes, the systems commonly used for electrophysiological analysis (Dingledine et al., 1999). Second, complete control over the subunit of interest is essential. Studies in which modified Ca2+ channel subunits are overexpressed in wild-type neurons must be interpreted with caution because endogenous subunits may confound the results (Okabe et al., 1999; Dolmetsch et al., 2001; Weick et al., 2003).
To overcome these problems and to study the role of the NR1 C terminus in coupling to downstream signaling pathways, we reconstituted NMDARs by introducing different NR1 subunits into cortical neurons from NR1 knock-out (NR1−/−) mice. We used neurons [5–8 d in vitro (DIV)] that contained predominantly NR2B subunits so that we could attribute any observed differences among reconstituted NMDARs to the different NR1 subunits we introduced. Our findings show that NR1 C-terminal domains are modular in coupling to downstream signaling pathways and that removal of the C1 domain by RNA splicing regulates NMDAR-induced gene expression without affecting receptor inactivation.
Materials and Methods
Plasmids and chemicals.
Plasmids for CRE (pCRE Luc) and SRE (pSRE Luc) firefly luciferase were from Stratagene (La Jolla, CA). The EF1α Renilla luciferase plasmid was generated by removing Renilla from pRL-SV40 (Promega, Madison, WI) as a PstI-XbaI fragment and inserting it into the backbone of PstI-XbaI-digested pEF-myc-nuc (Invitrogen, Carlsbad, CA). The pRL0_Renilla plasmid was generated by removing the cytomegalovirus (CMV) enhancer/promoter from the pRL-CMV (Promega) as a BglII-PstI fragment, followed by Klenow treatment and religation. The different NR1 subunit constructs and the green fluorescent protein (GFP)-CaMKIIα fusion construct have been described previously (Ehlers et al., 1996; Shen and Meyer, 1999). pcDNA3-CaM1234 (Peterson et al., 1999) was subcloned as an Xmn1-XbaI fragment into pGW1-CMV (Vernalis/British Biotechnology, Cambridge, UK) for higher expression in neurons. Phospho-cAMP response element-binding protein (CREB), phospho-extracellular signal-regulated kinase (ERK), panCREB, and panERK primary antibodies were from Cell Signaling Technology (Beverly, MA). Cyanine 2 (Cy2)- and horseradish peroxidase (HRP)-labeled secondary antibodies were from Jackson ImmunoResearch (West Grove, PA). PanNR1 antibody (MAB363) was from Chemicon (Temecula, CA). Tetrodotoxin (TTX) was from Biomol (Plymouth Meeting, PA). Cyano-3, 3-dihydro-7-nitroquinoxaline (CNQX), NMDA, ifenprodil, and 2-amino-5-phosphonovalerate (APV) were from Tocris Cookson (Ellisville, MO), and nimodipine, forskolin, and kynurenic acid were from Sigma (St. Louis, MO). Recombinant human BDNF was from Peprotech (Rocky Hill, NJ), and fura-2 AM was from Invitrogen. All cell-culture media and LipofectAMINE 2000 were from Invitrogen. Bovine calf serum was from Hyclone (Logan, UT), and normal goat serum was from Vector Laboratories (Burlingame, CA). Papain was from Worthington Biochemical (Lakewood, NJ).
NR1 genotyping, neuronal culture, and transfection.
NR1+/− mice were maintained and genotyped as reported previously (Forrest et al., 1994) using the following primer pairs: the 5′ primer was common to both alleles, 5′-CCAGCCTGCACACTTTAGGTCACATTG-3′; the 3′ primer for the NR1 gene was 5′-CCAACGCCATACAGATGGCCCTGT-3′; and the 3′ primer for the neomycin cassette was 5′-GTGCCAGCGGGGCTGCTAAAG-3′. Cortical neurons from embryonic days 18–21 mouse embryos of NR1+/− parents were dissociated and cultured using a modified version of a published protocol (Xia et al., 1996). Briefly, cortices from individual embryos were placed in ice-cold HEPES-buffered dissociation medium (DM) (pH 7.4, 81.8 mm Na2SO4, 30 mm K2SO4, 15.2 mm MgCl2, 0.25 mm CaCl2, 1.0 mm HEPES, 20 mm glucose, and 0.001% phenol red) supplemented with kynurenic acid (1 mm). Cortices were digested with papain (4 U/ml) in DM for 30 min and then incubated with trypsin inhibitor (20 mg/ml) in DM for an additional 30 min. Suspensions of isolated neurons were obtained by trituration in OptiMEM supplemented with glucose (20 mm) and plated to 0.42 × 10⁶ cells/cm2 on poly-d-lysine-coated plastic culture dishes or to 0.9 × 10⁶ cells/cm2 on 13 mm glass coverslips. Neurons were transferred to basal medium Eagle’s-based neuronal growth medium 2 h after isolation.
To determine the genotypes of the neurons, we retained the brainstem from each embryo for PCR genotyping and did not pool neurons from different embryos. In addition, a small sample of neurons from each embryo was plated into one well of a 24-well plate; after 4 DIV, Ca2+ imaging was performed, and the absence of an NMDA-induced Ca2+ increase confirmed the NR1−/−genotype. Approximately 25% of embryos were NR1−/−, as expected.
After 5–7 DIV, cortical neurons were transfected by one of two methods. For survival and luciferase assays, neurons were transfected by calcium phosphate precipitation as described previously (Finkbeiner et al., 1997). For Ca2+ imaging and immunocytochemistry, neurons were transfected using LipofectAMINE 2000 (Invitrogen). Experiments were performed 24–48 h after transfection.
Single-cell Ca2+ imaging.
Cortical neurons were loaded for 45 min at 37°C in HEPES-buffered saline (in mm: pH 7.4, 119 NaCl, 2.5 KCl, 2 MgCl2, 2 CaCl2, 25 HEPES, and 30 glucose) containing fura-2 AM (4 μm) and pluronic acid (0.01% w/v). Coverslips of neurons were placed in a laminar flow chamber (Warner Instruments, Hamden, CT) and mounted on an inverted epifluorescence microscope (TE300; Nikon, Tokyo, Japan) equipped with a cooled CCD digital camera (Orca II; Hamamatsu, Shizouka, Japan). Neurons were perfused by gravity flow (15 ml/min), and precise switching was achieved using solenoid valves (Warner Instruments). MetaFluor software (Universal Imaging, Downingtown, PA) controlled an excitation filter wheel for alternate excitation at 340 and 380 nm, and emitted light was collected through a custom dichroic block for fura-2 (Chroma, Rockingham, VT). Appropriate bandpass filters [enhanced yellow fluorescent protein (EYFP)] or dichroic blocks [FITC for EGFP or rhodamine for monomeric ref fluorescent protein (mRFP)] were used to detect transfected neurons. Regions of interest for individual neurons were applied to pairs of 340/380 nm images, and ratios of average intensities were calculated with MetaFluor. For calculation of integrated Ca2+ responses, data were imported into Microsoft (Seattle, WA) Excel. For each neuron, a least-squares fit was applied to eight points of the baseline and used to extrapolate a “predicted” baseline for the next eight points. The Ca2+ response was calculated as the sum of trapezoids at each time interval between the predicted baseline and the ratio values. A peak Ca2+ response was also determined as the highest ratio after the addition of agonist.
Measurement of CaMKIIα puncta formation.
Neurons were cotransfected with mRFP and GFP-CaMKIIα (1:2 ratio). After 24 h, mRFP fluorescence was used to locate transfected neurons. Images of GFP-CaMKIIα were collected before and 2 min after the addition of glutamate (30 μm). To ensure that the soma and all neurites of the selected neuron were in focus, sets of four to eight images were collected at different z-planes with a 20× objective (14 bit images, 4 s exposure per image). Analysis of mRFP images captured 2 h after the above protocol revealed that neuronal morphology was not adversely affected by either UV or glutamate exposure. Image analysis was performed blind, and GFP-CaMKIIα puncta formation was quantified as follows: a series of contiguous regions of interest 0.5 × 1.5 μm was placed along a neurite in the mRFP image. These regions were then transferred to the prestimulus and poststimulus images, and the average intensity value for each region was calculated. Prestimulus and poststimulus images were selected from sets of images acquired at different z-positions such that the region of neurite was in focus in both cases. A “difference” value (poststimulus − prestimulus) was calculated for each region along the neurite, and SEM for all difference values was used as an index of GFP-CaMKIIα puncta formation.
Electrophysiological recording.
EYFP expression was used to detect transfected neurons with an upright epifluorescence microscope (Axioskop 2FS; Zeiss, Oberkochen, Germany). Whole-cell recordings were performed at room temperature (20–23°C) as described previously (Wang et al., 2003), with neurons voltage clamped at −60 mV using a Multiclamp 700A amplifier (Axon Instruments, Union City, CA) controlled by pClamp 9 software (Axon Instruments). Recording electrodes were filled with intracellular solution (pH 7.3, 285 mOsm, 115 mm K-gluconate, 20 mm KCl, 10 mm EGTA, 10 mm HEPES, 2 mm MgCl2, 4 mm Na2ATP, and 0.3 mm TrisGTP) and had a typical resistance of 2–4 MΩ when measured in extracellular solution (pH 7.3, 310 mOsm, 135 mm NaCl, 5.4 mm KCl, 1.8 mm CaCl2, 15 mm HEPES, 15 mm glucose, and 1 μm TTX). A manifold system (tip length, 1 cm; tip inner diameter, 100 μm; positioned ∼150 μm from the patched neuron; ALA Scientific Instruments, Westbury, NY) was used to deliver extracellular solution. Solenoid valves (Warner Instruments) allowed switching to a stimulation solution (100 μm NMDA and 10 μm glycine in extracellular solution), which was applied for 5 s every minute for at least 10 min. Whole-cell currents were low-pass filtered at 200 Hz and digitized at 1 kHz. Multiclamp 700A software was used to automatically measure and compensate for membrane capacitance. Series resistance was 60% compensated.
Immunocytochemistry and Western blotting.
Neurons on glass coverslips were pretreated for 30 min with basal medium Eagle’s containing antagonists to suppress spontaneous activity (40 μm CNQX and 1 μm TTX) and then stimulated with either NMDA (30 μm) and glycine (10 μm) or with KCl (55 mm) for 10 min. All solutions for immunostaining of phosphoCREB contained NaF (1 mm) and orthovanadate (2 mm). Neurons were fixed in 4% paraformaldehyde in PBS for 10 min and permeabilized in PBS with 0.1% Triton X-100 for 20 min. Neurons were then treated with PBS containing 1 m glycine and then with blocking solution (PBS containing 0.1% Triton X-100, 2% normal goat serum, and 3% bovine serum albumin) for 2 h. Neurons were incubated overnight at 4°C with anti-phosphoCREB (1:200) in blocking solution, and primary antibody was detected with Cy2-labeled secondary antibody (1:200). Nuclei were identified with Hoechst 33258 (2.5 μg/ml, 5 min). Images were quantified blind as follows: regions around the nuclei (from Hoechst image) of transfected neurons (from mRFP image) were selected together with a non-neuronal background region. Using phase-contrast and Hoechst images, nuclear and background regions were also randomly selected for an equal number of nontransfected neurons. All regions were applied to the image of phosphoCREB staining (Cy2), average intensities for each region were recorded, and backgrounds were subtracted.
For Western blot analysis, neurons were stimulated as above and then lysed with 300 μl of Laemmli’s sample buffer (LSB) (2× LSB, 10% β-mercaptoethanol) per well (4 × 10⁶ cells). Samples were boiled for 10 min, and then each sample was loaded on one of two sister 10% SDS-PAGE gels, one for blotting with the phospho-specific antibody and the other for blotting with the pan antibody. Protein was transferred to Immobilon-P membranes (Millipore, Billerica, MA), which were incubated for 1 h in blocking solution [Tris-buffered saline with Triton X-100 (TBST) containing 4% milk powder] and then incubated with primary antibody for phosphoCREB, phosphoERK, panCREB, or panERK in blocking solution overnight at 4°C. Immunoblots were washed thrice in TBST, incubated with HRP secondary antibody in blocking solution for 1 h at room temperature, and developed with HRP chemiluminescence (Amersham Biosciences, Piscataway, NJ).
Survival analysis.
An automated microscope was used to follow cohorts of EGFP-positive neurons over many days in culture, providing a very sensitive measure of survival with minimal user bias (Arrasate et al., 2004; Arrasate and Finkbeiner, 2005). For each embryo, cortical neurons were plated in 12 wells of a 24-well plate and transfected at 6 DIV with EGFP together with either empty vector (pRK5) or NR1–1a. After 48 h, the 12 wells were automatically scanned, and nine non-overlapping images were captured for each well (12 bit, 500 ms exposure, 4× objective). At 24 h intervals for 6 d, a fiduciary mark on the 24-well plate was aligned to a reference image of the same mark captured at the first time point; this allowed precise capture of exactly the same nine fields of neurons per well at each time point. The number of neurons in each image was automatically counted as follows: groups of pixels were defined as objects with a threshold value that was calculated from the minimum pixel value and the variance of pixel values for each image. Morphometric analysis was then used to select and count objects that fell within the appropriate size for GFP-positive neurons (as determined with a learning paradigm). Having counted the number of EGFP-positive neurons at each time point, we calculated by subtraction the loss of neurons between time points. For survival analysis, the survival time for cohorts of neurons was defined as the time from transfection to the interval at which they disappeared; nonparametric Kaplan–Meier analysis was used to estimate the underlying survival function for each group of neurons by commercially available software (Statview; SAS, Cary, NC). From the survival function, the hazard function was determined (Statview).
Reporter gene assays.
Neurons were cotransfected with one form of the NR1 subunit or empty vector (pRK5) together with CRE firefly luciferase and EF1α or pRL0 Renilla luciferase. EF1α Renilla luciferase was used to normalize for differences in transfection efficiency and sample handling because the EF1α promoter is less sensitive to Ca2+-induced gene expression than other constitutive expression vectors containing promoters such as CMV, Simian virus 40, or Rous sarcoma virus (J.B. and S.F., unpublished observation). To normalize for transfection efficiency and sample handling in experiments with BDNF, pRL0 Renilla luciferase was used. The levels of expression of EF1α and pRL0 Renilla luciferase were not significantly changed by the stimuli used in this study. Luciferase activity was assayed after 8 h of stimulation with a dual luciferase kit (Promega).
Results
NR1 subunit reconstitution system
To study the role of the NR1 subunit C terminus in NMDAR-dependent signal transduction, we introduced NR1 subunits into cultured cortical neurons from NR1−/− mice (Forrest et al., 1994). The reconstitution of NMDARs in primary neurons provides an appropriate physiological context for the assembly of signaling complexes. In addition, this system takes advantage of several properties of NMDAR assembly. First, because the NR1 subunit is essential for the assembly and function of NMDARs, we expect no NMDA responses in NR1−/− neurons, except in those cells that have incorporated exogenous NR1 subunits. Second, NR1 subunits cannot, by themselves, form functional NMDARs. Thus, any responses we measure must necessarily arise from NMDARs reconstituted with endogenous NR2 subunits and the defined NR1 subunit that we supply. Finally, the number of available endogenous NR2 subunits evidently determines the number of functional NMDARs that form in neurons, because NR1 subunits are normally present in 10-fold excess (Dingledine et al., 1999; Wenthold et al., 2003). Therefore, we anticipate that our reconstitution strategy will result in physiological numbers of functional NMDARs, provided that sufficient exogenous NR1 subunits are supplied.
However, certain criteria must be satisfied for the study of the NR1 C terminus with neurons of NR1−/− mice. (1) Neurons cultured from NR1−/− embryos must be insensitive to NMDA stimulation. (2) The absence of NMDARs must not disturb downstream signaling pathways. (3) Introducing exogenous NR1 subunits must restore NMDAR-dependent function. (4) The viability of NR1−/− neurons transfected with the NR1 subunit must be no different than wild-type neurons. (5) The isoforms of endogenous NR2 subunits should be defined and homogeneous within the NR1−/− neurons so that effects can be attributed specifically to the exogenous NR1 subunits that are introduced.
Neurons cultured from NR1−/−, NR1+/+, and NR1+/− embryos were morphologically similar (data not shown), as expected (Okabe et al., 1998). Because we sought to investigate Ca2+-dependent signaling with different versions of the NR1 subunit, we assessed Ca2+ homeostasis in NR1−/− neurons. Selective activation of NMDARs did not produce Ca2+ responses in NR1−/− neurons but reproducibly increased [Ca2+]i in NR1+/+ and NR1+/− neurons (Fig. 1a, left). However, activation of voltage-sensitive Ca2+ channels (VSCCs) by K+ depolarization increased [Ca2+]i in neurons of all NR1 genotypes (Fig. 1a, right). There was no difference in the peak or integrated areas of Ca2+ response to NMDA in NR1+/+ and NR1+/− neurons (supplemental Fig. 1a, available at www.jneurosci.org as supplemental material). The only difference between NR1−/− neurons and NR1+/+ and NR1+/− neurons was a slightly lower basal [Ca2+]i (supplemental Fig. 1b, available at www.jneurosci.org as supplemental material).
Figure 1.
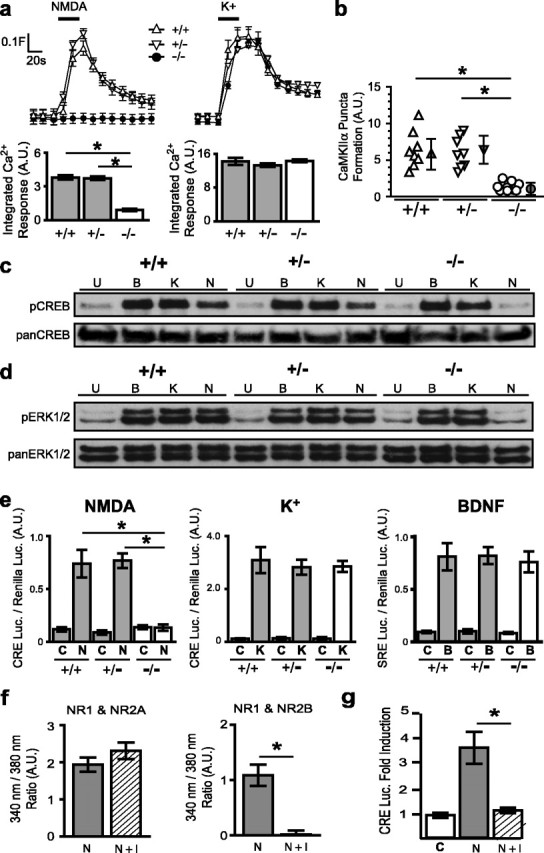
NMDAR signaling is selectively abolished in NR1−/− cortical neurons. a, Measurement of [Ca2+]i with fura-2 in NR1+/+, NR1+/−, and NR1−/− neurons. Neurons were stimulated (black bar) with NMDA (30 μm, 30 s) (left) or K+ (55 mm, 30 s) (right). Traces show mean± SEM fura-2 ratio (340/380 nm) for 25 neurons per experiment aligned at the timestamp of agonist addition. In this and subsequent figures, the baseline is cropped for presentation. Column graphs show integrated area of [Ca2+]i response to NMDA (left) and K+ (right) for each NR1 genotype; each condition represents the mean ± SEM for at least 75 neurons from at least four embryos (see Materials and Methods). b, CaMKIIα puncta formation in neurites of cortical neurons of different NR1 genotypes (see Materials and Methods). *p < 0.05 by ANOVA for at least eight neurites from four different neurons per condition. c, d, Western blot analysis using anti-phosphoCREB (Ser-133) and anti-phosphoERK (Thr-183, Tyr-185). NMDA (N; 30 μm) induced phosphorylation of both CREB and ERK in NR1+/+ and NR1+/− neurons but not in NR1−/− neurons. The extent of K+-induced (K; 55 mm) and BDNF-induced (B; 50 ng/ml) CREB and ERK phosphorylation was similar in all NR1 genotypes. Neurons were stimulated for 15 min (pCREB) or for 5 min (pERK); U represents unstimulated/wash control. The blots are representative of data from three independent cell preparations. e, Gene expression in different NR1 genotypes as measured by luciferase reporter assays. NMDA (30 μm, 8 h) did not induce CRE-luciferase expression in NR1−/− neurons but significantly increased CRE-luciferase expression in NR1+/+ and NR1+/− neurons (n = 4). The induction of CRE-luciferase to K+ was not significantly different among NR1 genotypes (n = 5), and the induction of SRE-luciferase to BDNF was not significantly different across NR1 genotypes (n = 3). *p < 0.01, unpaired t test. f, Ifenprodil (I; 10 μm) did not inhibit NMDA-induced [Ca2+]i responses in HEK293T cells transfected with NR1–1a and NR2A (left) but completely inhibited NMDA-induced [Ca2+]i responses in HEK293T cells transfected with NR1–1a and NR2B. g, In NR1+/− neurons, 10 μm ifenprodil blocked NMDA-induced CRE-dependent luciferase expression. *p < 0.01, unpaired t test. A.U., Arbitrary units; C, control.
As a functional “readout” of increased [Ca2+]i in neurites, we measured Ca2+-dependent puncta formation by CaMKIIα. Increased cytoplasmic [Ca2+]i leads to recruitment of CaMKIIα to the plasma membrane (Shen and Meyer, 1999). Using a GFP-CaMKIIα fusion protein, we found that NMDA produced rapid (<2 min), reversible, and APV-sensitive puncta formation by CaMKIIα in neurites of NR1+/+ and NR1+/− (Fig. 1b; data not shown) but not NR1−/− neurons (Fig. 1b). These data confirm that the NR1 subunit is essential for the assembly of functional NMDARs and for NMDAR-mediated Ca2+ signaling in dendrites.
To determine whether the absence of NMDARs affects signaling through other cell-surface receptors, we compared the activation of CREB and ERK. NMDA did not induce phosphorylation of CREB or ERK1/2 in NR1−/− neurons but produced comparable phosphorylation in NR1+/+ and NR1+/− neurons. In response to K+ and BDNF, CREB and ERK1/2 phosphorylation did not differ across NR1 genotypes (Fig. 1c, d).
Because CREB and CREB family members bind constitutively to cAMP response elements (CREs), we used a luciferase reporter construct driven by upstream CREs to compare gene expression in different NR1 genotypes. NMDA-dependent gene expression was absent in NR1−/− neurons but increased sixfold in NR1+/+ and NR1+/− neurons (Fig. 1e, left). K+-induced CRE luciferase expression (∼20-fold induction) did not differ across NR1 genotypes (Fig. 1e, middle). Furthermore, signaling to the serum response element (SRE), which is also a target of NMDAR signaling (Bading et al., 1993), was not affected by the absence of NMDARs. BDNF-induced SRE luciferase expression (approximate sixfold induction) was not significantly different across NR1 genotypes (Fig. 1e, right). Thus, signaling by different stimuli to well characterized downstream targets of the NMDAR was not compromised by the absence of the NMDAR.
Because our reconstitution system depends on incorporation of endogenous NR2 subunits, the heterogeneity of these subunits might confound our interpretations of the differences between NR1 splice variants. In cultured cortical neurons, two principal NR2 subunits are present, NR2A and NR2B, which have distinct developmental and signaling profiles (Monyer et al., 1994; Sheng et al., 1994; Krapivinsky et al., 2003). By using cultures at a certain developmental stage (5–8 d in vitro), we sought a homogeneous NR2B subunit population. To determine whether the NMDARs in our neurons primarily contained NR2B subunits, we tested NMDA-induced responses in the presence of ifenprodil, an NR2B-selective antagonist (Williams, 1993). First, using a heterologous expression system, we established a dose of ifenprodil (10 μm) that abolished Ca2+ signaling through NMDARs composed of NR1/NR2B without affecting those of NR1/NR2A (Fig. 1f). This dose completely abolished NMDAR-mediated CRE-dependent gene expression in NR1+/− neurons (Fig. 1g). Therefore, downstream signaling in our cultures is mediated only by NR2B-containing NMDARs, and any differences in signaling can be attributed to differences in NR1 subunits. Thus, NR1−/− neurons at this age are suitable for studying the effect of different versions of the NR1 subunit on NMDAR function.
Transfection with NR1–1a reconstitutes NMDA-dependent signaling in NR1−/− neurons
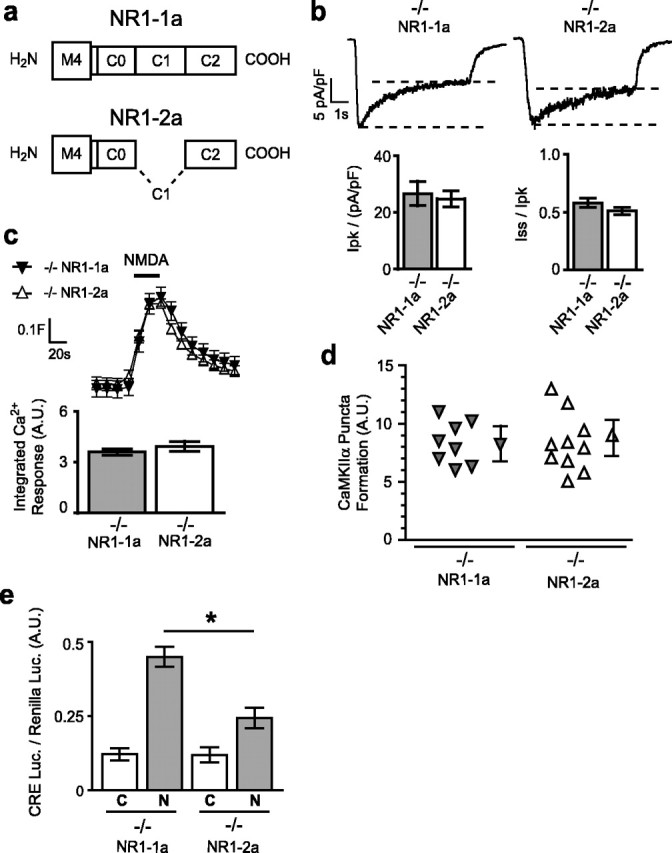
To restore NMDAR function, NR1−/− neurons were transfected with the NR1–1a subunit (Fig. 2). This major splice variant contains all three C-terminal domains. First, we measured whole-cell currents in transfected neurons voltage clamped at −60 mV and stimulated with NMDA (100 μm, 5 s pulses every minute for at least 10 min). NMDA elicited peak whole-cell currents and receptor inactivation similar to those in NR1+/− neurons (Fig. 2a). We next determined whether reconstitution extended to NMDAR-dependent signaling pathways. NMDA increased [Ca2+]i in NR1−/− neurons transfected with NR1–1a, and the integrated areas and peak Ca2+ responses were comparable with those in NR1+/+ and NR1+/− neurons (Fig. 2b and data not shown). Furthermore, induction of CaMKIIα puncta formation during NMDA (30 μm) stimulation was not significantly different in the neurites of NR1−/− neurons transfected with NR1–1a and those of NR1+/+ and NR1+/− neurons (Fig. 2c). Introducing NR1–1a into NR1−/− neurons did not affect K+-induced Ca2+ responses (supplemental Fig. 1c, available at www.jneurosci.org as supplemental material), suggesting that our reconstitution approach did not perturb signaling by VSCCs.
Figure 2.

Reconstitution of NMDAR signaling in NR1−/− neurons. a, Sample traces of whole-cell currents induced by NMDA (100 μm for 5 s); the sample traces here and in subsequent figures are the average of at least 10 responses over 10 min. Quantification of the normalized peak [Ipk/(pA/pF)] or steady-state (Iss/Ipk) current revealed no significant difference between NR1−/− neurons transfected with NR1–1a and NR1+/− neurons. b, Transfection of NR1−/− neurons with the NR1–1a subunit reconstituted [Ca2+]i responses to NMDA with profiles comparable with NMDA-induced [Ca2+]i responses in NR1+/+ and NR1+/− neurons. Quantification of integrated area of [Ca2+]i response revealed no significant difference between NR1−/− neurons transfected with NR1–1a and NR1+/+ and NR1+/− neurons; each condition represents the mean ± SEM for at least 18 neurons from at least four embryos. c, NMDA (30 μm) did not induce CaMKIIα puncta formation in NR1−/− neurons, but formation of GFP-CaMKIIα puncta during stimulation with NMDA was reproducibly observed in the neurites of NR1−/− neurons transfected with NR1–1a and was comparable with NR1−/+ neurons. d, Reconstitution of NMDA-induced CREB phosphorylation in NR1−/− neurons, as measured by immunocytochemistry. Mean ± SEM for at least 44 neurons from four independent experiments. e, NMDA (30 μm, 8 h) did not induce CRE-luciferase expression in NR1−/− neurons but produced a 3.6-fold induction of CRE-luciferase expression in NR1−/− neurons transfected with NR1–1a. Mean ± SEM for six independent experiments. f, Survival analysis in which cortical neurons of NR1+/− mice (triangles; 10, 080 neurons) and NR1−/− mice (inverted triangles; 13, 123 neurons) were transfected with EGFP and counted at 24 h intervals for 6 d. The hazard or risk of death among neurons from NR1−/− mice transfected with NR1–1a and EGFP (filled circles; 11, 574) was comparable with that observed with neurons from NR1+/− mice and above the suppressed levels in untransfected NR1−/− neurons. *p < 0.05, log-rank test. A.U., Arbitrary units; C, control; N, NMDA.
We next focused on NMDAR-dependent signaling to the nucleus. NMDA (30 μm for 10 min) induced CREB phosphorylation (Ser-133) in NR1−/− neurons transfected with NR1–1a (Fig. 2d) to a similar extent as NR1+/− neurons (data not shown). NMDA-induced CRE-luciferase expression was also reconstituted in the transfected NR1−/− neurons (approximately threefold) (Fig. 2e).
To investigate the long-term effect of NR1–1a in NR1−/− neurons, we used an automated microscope to monitor the survival of thousands of individual GFP-positive neurons at 24 h intervals for 6 d (Arrasate et al., 2004; Arrasate and Finkbeiner, 2005). By calculating the decrease in the number of neurons from identical microscope fields at subsequent time points, we determined the survival time for cohorts of neurons. Kaplan–Meier analysis was used to estimate the underlying survival function, from which a hazard function was derived. The hazard function provides an exquisitely sensitive measure of the instantaneous risk of death, which is independent of population size; factors that promote survival suppress the cumulative hazard. The cumulative hazard was significantly less for NR1−/− than NR1+/− neurons, consistent with reports of improved survival of NR1−/− neurons in culture (Okabe et al., 1998). However, in NR1−/− neurons transfected with NR1–1a, the cumulative hazard was restored so that the risk of death at all time points was similar to that of NR1+/− neurons (Fig. 2f). Thus, although transfection of NR1–1a into NR1−/− neurons increases the risk of death, it does so only to the level observed in wild-type neurons and does not result in adverse effects on neuronal health, even over many days in culture.
Overall, introduction of NR1–1a into NR1−/− cortical neurons restored NMDAR-dependent signaling at all levels of signal transduction from membrane currents to gene expression without any deleterious effect on cell health or disturbance of other signaling pathways.
NR1 C terminus in NMDAR-dependent signaling
Next, we set out to determine the role of the NR1 C terminus in coupling Ca2+ influx to downstream signaling pathways. However, because NMDARs flux monovalent cations as well as Ca2+, downstream pathways might be activated indirectly by depolarization-induced Ca2+ influx through VSCCs rather than by a local increase in Ca2+ through the NMDAR. Furthermore, NMDARs may signal independently of Ca2+ influx (Vissel et al., 2001). We, therefore, determined whether Ca2+ influx through the NMDAR per se was necessary for signaling by introducing into NR1−/− neurons a pore mutant of the NR1 subunit, NR1–1a(N616R) (Rameau et al., 2000). The pore mutant is identical to NR1–1a except that asparagine-616 in the M2 segment lining the channel is changed to arginine. This mutation almost completely prevents Ca2+ flux through the channel but does not affect the flux of monovalent cations (Sakurada et al., 1993). We could not detect [Ca2+]i responses, CaMKIIα puncta formation, or CRE-dependent gene expression during NMDA stimulation of NR1−/− neurons transfected with the pore mutant (Fig. 3). Thus, reconstituted NMDAR-dependent signaling in NR1−/− neurons requires Ca2+ influx through reconstituted NMDARs.
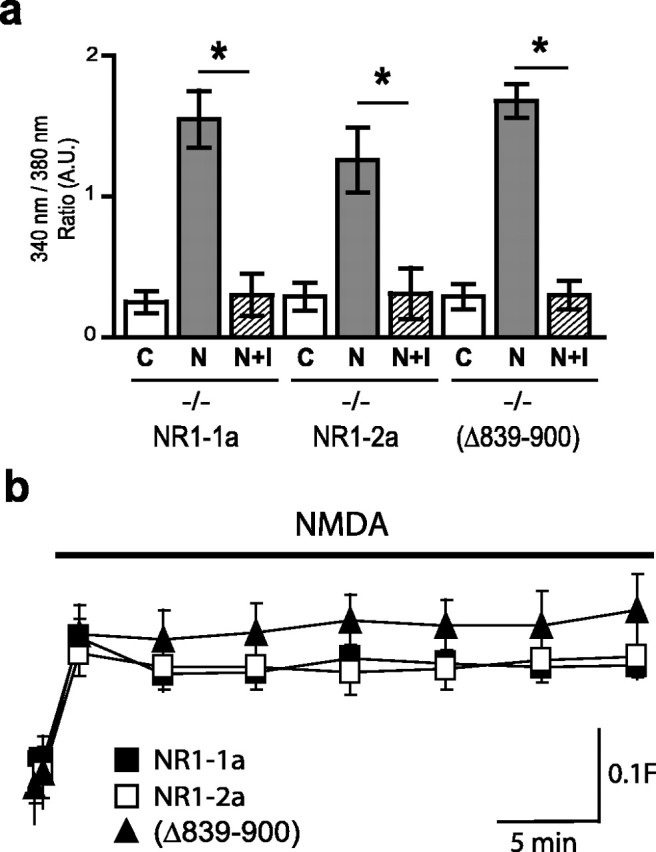
Figure 3.

The NR1 C terminus is required for gene expression. a, Domains of the C terminus of the NR1–1a subunit and a C-terminal deletion mutant, NR1–1aΔ839–900; M4 refers to the most C-terminal transmembrane domain. b, Sample traces of whole-cell currents induced by NMDA (100 μm for 5 s) for NR1–1a and NR1–1aΔ839–900. Quantification of the normalized peak current [bottom left; Ipk/(pA/pF)] revealed no significant difference between NR1−/− neurons transfected with NR1–1a and NR1–1aΔ839–900. In contrast, steady-state currents (Iss/Ipk) were significantly higher in NR1−/− neurons transfected with NR1–1aΔ839–900 than those with NR1–1a, consistent with reduced inactivation. c, Reconstituted [Ca2+]i responses to NMDA have similar profiles in NR1−/− neurons transfected with NR1–1aΔ839–900 or with NR1–1a, but the pore mutant (NR1–1aN616R) does not reconstitute [Ca2+]i responses (mean ± SEM fura-2 ratio for at least 8 neurons). The column graphs show the quantified integrated area of [Ca2+]i responses to NMDA; each condition represents the mean ± SEM for at least 50 neurons from at least four embryos. d, No significant difference was observed in NMDA-induced puncta formation by GFP-CaMKIIα in neurons transfected with NR1–1aΔ839–900 or with NR1–1a, but no GFP-CaMKIIα puncta formation was observed in neurons transfected with the pore mutant NR1–1aN616R. e, CRE-dependent luciferase gene expression is abolished in NR1−/− neurons transfected with NR1–1aΔ839–900 and with NR1–1aN616R. Mean ± SEM for at least four independent experiments. *p < 0.01, unpaired t test. A.U., Arbitrary units; C, control; N, NMDA.
We then introduced a mutant lacking the C0 and C1 regions of the NR1 C terminus, NR1–1aΔ839–900 (Fig. 3a). The absence of most of the NR1 C terminus did not affect normalized peak whole-cell currents in response to NMDA stimulation. However, removal of C0 and C1 abolished NMDAR inactivation (Fig. 3b). These data support previous observations of a role for the NR1 C terminus in inactivation of reconstituted NMDARs in heterologous cells (Ehlers et al., 1996; Zhang et al., 1998). Furthermore, deletion of C0 and C1 did not affect NMDAR-induced global Ca2+ responses or CaMKIIα puncta formation (Fig. 3c, d). Thus, despite differences in microscopic channel inactivation rates, removing most of the NR1 C terminus did not affect the steady-state bulk Ca2+ levels produced by those channels. Because steady-state Ca2+ levels correlate closely with gene expression in many cell types, we were surprised that deleting the C0 and C1 regions abolished NMDA-induced CRE-dependent gene expression (Fig. 3e). Therefore, the NR1 C terminus is dispensable for global increases in Ca2+ but essential for receptor inactivation and gene expression.
C-terminal splice variants of the NR1 subunit differentially induce gene expression
To determine whether two major C-terminal NR1 splice variants, NR1–1a and NR1–2a (Fig. 4), which differ by the presence or absence of the C1 domain, form NMDARs with different signaling properties, we transfected each into NR1−/− neurons. We found no differences in the extent of NMDA-induced receptor inactivation or in the peak or steady-state whole-cell currents in NR1−/− neurons transfected with either NR1–1a or NR1–2a (Fig. 4b). Because deletion of both C0 and C1 abolished inactivation, these data suggest that the C1 domain is not required to mediate NMDAR inactivation. Removing only the C1 domain of the NR1 subunit did not affect NMDA-induced increases of global Ca2+ or puncta formation by CaMKIIα (Fig. 4c, d). However, NMDA-induced gene expression in NR1−/− neurons transfected with NR1–2a was only approximately half that observed with NR1–1a (Fig. 4e).
Figure 4.
Splice variants NR1–1a and NR1–2a differentially induce gene expression. a, Domains of the NR1 C terminus for NR1–1a and NR1–2a. b, Sample traces of whole-cell currents induced by NMDA (100 μm for 5 s) for NR1–1a and NR1–2a; quantification of the normalized peak [Ipk/(pA/pF)] and steady-state (Iss/Ipk) currents revealed no significant difference between NR1−/− neurons transfected with NR1–1a and NR1–2a. c, Reconstituted [Ca2+]i responses to NMDA have similar profiles in NR1−/− neurons transfected with NR1–1a or with NR1–2a (traces, mean ± SEM fura-2 ratio at least 14 neurons). Column graphs show the quantification of integrated area of [Ca2+]i responses; each condition represents the mean ± SEM for at least 14 neurons from at least four embryos. d, No significant difference was observed in NMDA-induced puncta formation by GFP-CaMKIIα in neurons transfected with NR1–1a or NR1–2a. Mean ± SEM for at least four experiments. e, CRE-dependent luciferase gene expression was significantly less in NR1−/− neurons transfected with NR1–2a than with NR1–1a. Mean ± SEM for at least four independent experiments. A.U., Arbitrary units; C, control; N, NMDA.
We considered other factors that may contribute to observed differences in gene expression. We found that these differences are not explained by measurable variation in expression levels or subcellular distribution of transfected NR1 subunits (data not shown). Also, Ca2+ imaging revealed that these NR1 subunits did not differ in their sensitivity to ifenprodil, indicating further that they do not preferentially associate with different NR2 subunits (Fig. 5a). Steady-state Ca2+ imaging showed that these subunits mediate similar steady-state Ca2+ elevations in neurons (Fig. 5b), ruling out the possibility that gene expression is governed solely by bulk Ca2+ levels. Therefore, removal of the C1 domain by alternative splicing reduces the efficacy of coupling NMDARs to gene expression without measurable changes in channel inactivation or calcium influx, indicating that these properties of NMDARs can be dissociated.
Figure 5.
Differences in gene expression are not explained by NR2 subunits or by steady-state Ca2+ levels. a, NMDA-induced [Ca2+]i responses in NR1−/− neurons transfected with NR1–1a, NR1–2a, and NR1–1aΔ839–900 were all inhibited to a similar extent by ifenprodil. Mean ± SEM for at least three independent experiments. *p < 0.01, unpaired t test. b, NMDA-induced steady-state Ca2+ levels among NR1 subunits show no significant differences after 30 min (mean ± SEM fura-2 ratio for at least 14 neurons). C, Control; N, NMDA.
Domains of the NR1 C terminus are modular in coupling to gene expression
By comparing the data from the NR1 splice variants NR1–1a and NR1–2a and from the deletion mutant NR1–1aΔ839–900, we reasoned that the C0 domain must not only be necessary for NMDAR inactivation but must also contribute to NMDAR-induced gene expression. We, therefore, evaluated NMDAR signaling with a mutant NR1 subunit lacking the C0 domain, NR1–1aΔ839–863 (Fig. 6a). As anticipated, NMDARs formed with this mutant did not exhibit receptor inactivation during NMDA stimulation but produced peak whole-cell currents, global increases in [Ca2+]i, and CaMKIIα puncta formation no different from the NR1–1a subunit (Fig. 6b–d). However, NMDA-induced gene expression was significantly reduced in NR1−/− neurons transfected with the C0-domain mutant (Fig. 6e). Thus, the C0 and C1 domains can contribute independently to coupling the NR1 subunit to downstream signaling pathways. Furthermore, the contributions of the C0 and C1 domains to NMDAR-dependent gene expression appear to be additive, suggesting a model for coupling in which these cassettes are modular.
Figure 6.
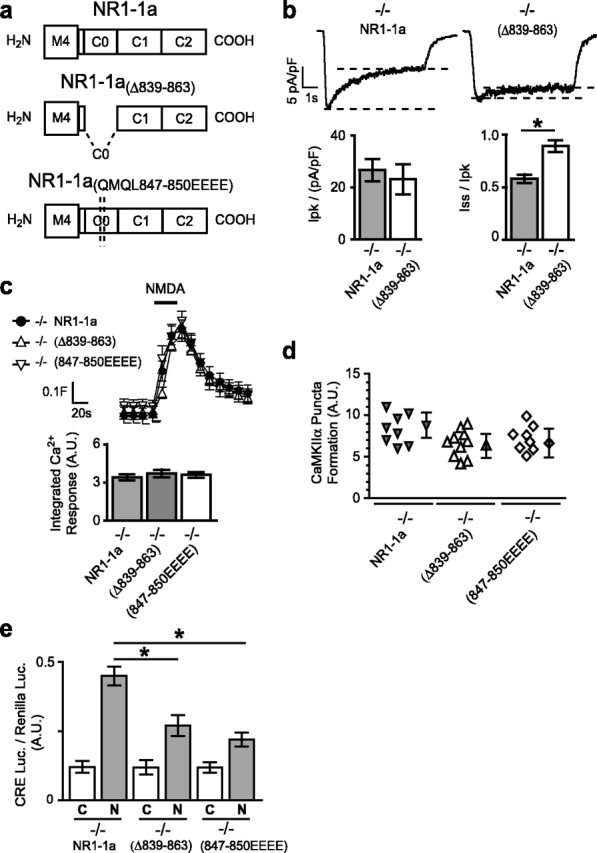
Deletion of the C0 domain or mutation of a single CaM-binding site significantly reduces gene expression. a, C-terminal domains of NR1–1a, NR1–1aΔ839–863, and NR1–1a(QMQL847–850EEEE). b, Sample traces of whole-cell currents induced by NMDA (100 μm for 5 s) for neurons transfected with NR1–1a or NR1–1aΔ839–863. Quantification of the normalized peak current revealed no significant difference between NR1−/− neurons transfected with NR1–1a or NR1–1aΔ839–863; steady-state currents were higher for NR1–1aΔ839–863 than for NR1–1a because of reduced inactivation. c, Reconstituted [Ca2+]i responses to NMDA have similar profiles in NR1−/− neurons transfected with NR1–1aΔ839–863, NR1–1a(QMQL847–850EEEE), or NR1–1a (mean ± SEM fura-2 ratio for 12 neurons). The column graphs show the quantification of integrated area of [Ca2+]i responses; each condition represents the mean ± SEM for at least 12 neurons from at least four embryos. d, No significant difference was observed in NMDA-induced puncta formation by GFP-CaMKIIα in neurons transfected with NR1–1a, NR1–1aΔ839–863, or NR1–1a(QMQL847–850EEEE). e, NMDA-induced CRE-dependent luciferase gene expression is significantly reduced in NR1−/− neurons transfected with NR1–1aΔ839–863 or NR1–1a(QMQL847–850EEEE). Mean ± SEM for at least four independent experiments. *p < 0.01, unpaired t test. A.U., Arbitrary units; C, control; N, NMDA.
We next considered what signaling molecules couple the NR1 C terminus to gene expression. A short sequence within the C0 domain contains a region that binds CaM, CaMKIIα, and the cytoskeletal protein α-actinin (Leonard et al., 2002). To determine whether this region contributes to NMDA-dependent gene expression, we assessed the effects of changing four amino acids in this region to glutamates (NR1–1a(QMQL847–850EEEE)). These changes reduced NMDAR-dependent gene expression to levels observed when the entire C0 domain was deleted (Fig. 6e), while maintaining NMDA-induced increases in global Ca2+ levels and CaMKIIα puncta formation (Fig. 6c, d).
To determine which of these interacting proteins is responsible for coupling NMDARs to gene expression, we attempted to test the role of CaM in this signaling. A dominant-interfering form of CaM, CaM1234, in which all four Ca2+ binding sites are mutated, has been used to implicate CaM in L-type VSCC signaling (Peterson et al., 1999; Dolmetsch et al., 2001). However, we found that CaM1234 transfected into NR1+/− neurons suppressed gene expression in neurons under basal conditions and in response to a variety of extracellular stimuli (supplemental Fig. 2, available at www.jneurosci.org as supplemental material). Thus, CaM may play a broad role in regulating nuclear responses. Using the CaM1234 construct, we could not determine an effect of CaM specific to NMDAR signaling.
NR1 subunit C terminus controls CREB (Ser-133) phosphorylation
The CRE binds the transcription factor CREB and closely related family members. Phosphorylation of Ser-133 on CREB is required for recruiting CREB-binding protein (CBP) and initiating transcription. Furthermore, the duration of CREB phosphorylation correlates with transcription (Lonze and Ginty, 2002). Our data suggest that domains within the C terminus are additive for the induction of CRE-dependent gene expression. Therefore, the composition of the NR1 C terminus might control gene expression by affecting the duration of CREB phosphorylation. We determined the temporal profile of CREB phosphorylation in neurons transfected with different versions of the NR1 subunit. NMDA-induced CREB phosphorylation was restored in NR1−/− neurons transfected with NR1–1a (Fig. 7a), and the distribution of phosphoCREB intensities was comparable with that in NR1+/− neurons (data not shown). CREB phosphorylation was also induced in NR1−/− neurons transfected with NR1 mutants that lacked the C0 domain (NR1–1aΔ839–863), the C1 domain (NR1–2a), or both (NR1–1aΔ839–900), but the extent of induction at 10 min was significantly less than that observed in NR1−/− neurons transfected with NR1–1a (Figs. 7b–e). The extent of CREB phosphorylation did not differ between any of the NR1 subunits at 30 min (Fig. 7e). Therefore, the C0 and C1 domains are essential for coupling the NMDAR to CREB phosphorylation, and this coupling could partly determine NMDAR-dependent gene expression. However, differences in the kinetic profile of CREB phosphorylation among NR1 splice variants cannot fully account for the observed differences in CRE-dependent gene expression.
Figure 7.
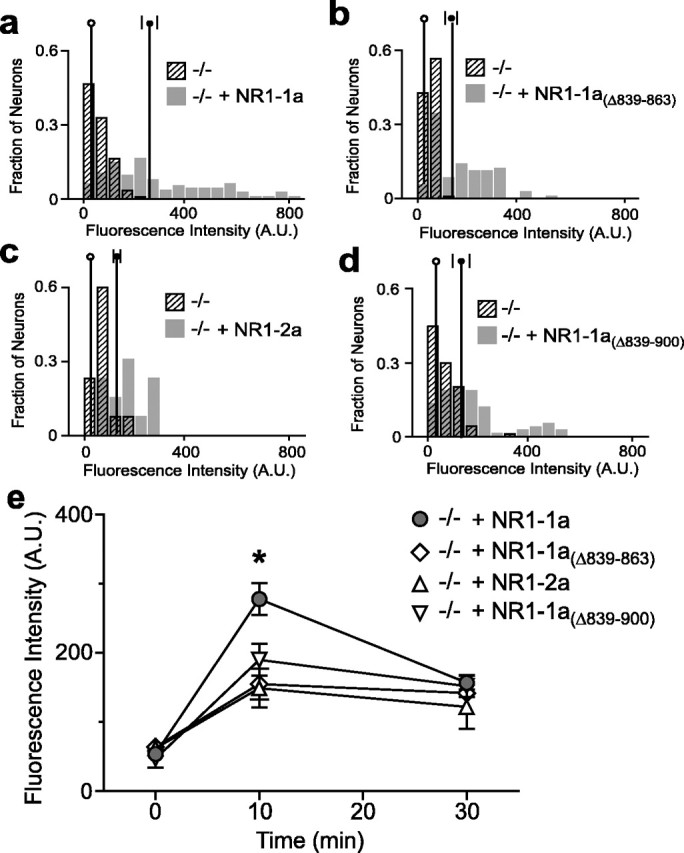
Domains in the NR1 C terminus control CREB phosphorylation (Ser-133). NR1−/− neurons were transfected with mRFP and NR1–1a (a), NR1–1aΔ839–863 (b), NR1–2a (c), or NR1–1aΔ839–900 (d) and stimulated for 10 min with NMDA (30 μm). pCREB-133 levels were measured blind as the average intensity of phosphoCREB staining in the nucleus (identified by Hoechst stain) of transfected neurons (mRFP) and corrected for background with an acellular region (see Materials and Methods). Average intensity values for at least 60 neurons per condition from at least four NR1−/− embryos are plotted as normalized frequency histograms. The vertical lines are the mean ± SEM for each population (open circle, empty vector; filled circle, NR1 construct). e, Time course reveals that NR1−/− neurons transfected with NR1–1a show significantly more NMDA-induced CREB phosphorylation at 10 min than those transfected with NR1–1aΔ839–863, NR1–2a, or NR1–1aΔ839–900. At 30 min, levels of CREB phosphorylation are similar. *p < 0.05, ANOVA. A.U., Arbitrary units; C, control; N, NMDA.
Discussion
Using a reconstitution system that allows the study of NMDARs formed from specific NR1 subunits in cultured cortical neurons, we show that domains of the C-terminal cytoplasmic tail of the NR1 subunit contribute differentially to downstream signaling of the NMDAR. As a consequence, RNA splicing of a single domain selectively modifies NMDAR-induced gene expression but not receptor inactivation. Therefore, developmental, spatial, and activity-dependent RNA splicing of the NR1 subunit may modulate the capacity of the NMDAR signaling complex to induce long-term adaptive changes without affecting channel gating.
NR1/NR2B reconstitution system
We transfected neurons from NR1−/− embryos with different versions of the NR1 subunit to gain control over the C terminus. Although loss of functional NMDARs has a dramatic effect at the system level [NR1−/− mice die within hours of birth (Forrest et al., 1994)], cultured NR1−/− neurons maintained many of the structural and functional properties of wild-type neurons (Okabe et al., 1998; Maskos et al., 2001; Maskos and McKay, 2003). Indeed, NR1−/− neurons survive longer in culture than wild-type neurons (Okabe et al., 1998). Transfection of the NR1 subunit into cultured NR1−/− neurons did not adversely affect neuronal viability or function. In addition, we found that the introduction of NR1 subunits, which we believe results in NR1 overexpression, results in physiological levels of NMDAR-mediated whole-cell currents, Ca2+ transients, CaMKIIα translocation, CREB phosphorylation, and CRE-dependent gene expression. That we achieve levels of signaling similar to wild-type neurons is consistent with observations from other laboratories, indicating that the number of NR2 subunits is the major determinant of the number of functional NMDARs within neurons (Wenthold et al., 2003).
By selecting a developmental window for culturing cortical neurons in which the NR2 subunit was defined and homogeneous, we were able to selectively study the effects of the C terminus of NR1 on NMDAR function and avoid potentially confounding effects of different NR2 subunits. We chose a developmental stage at which the NR2B subunit was expressed because NR2B-containing NMDARs play a central role in plasticity. NR1/NR2B but not NR1/NR2A heteromers are responsible for signaling to ERK (Krapivinski et al., 2003), which is critical for long-term synaptic change (Sweatt, 2004). Older animals with fewer NR1/NR2B heteromers and more NR1/NR2A heteromers (Monyer et al., 1994; Sheng et al., 1994) display less synaptic plasticity (Carmignoto and Vicini, 1992; Crair and Malenka, 1995). Conversely, transgenic animals engineered to overexpress the NR2B subunit in the forebrain learn memory tasks more quickly and exhibit greater activity-dependent synaptic potentiation (Tang et al., 1999). Our reconstitution system allowed us to study the role of the NR1 C terminus in the downstream signaling of these important receptors with unprecedented control.
The NR1 subunit C terminus in Ca2+ inactivation and influx
The mechanism by which NMDARs and VSCCs undergo Ca2+-dependent inactivation has been extensively studied in heterologous cells (Ehlers et al., 1996; Zhang et al., 1998; Krupp et al., 1999). Association of CaM with the C-terminal tail places a Ca2+ sensor very close to the site of Ca2+ influx, allowing the channel to respond rapidly and prevent excessive Ca2+ entry. This mechanism likely occurs in neurons; we found that the C0 domain, which is responsible for CaM-dependent inactivation in heterologous cells (Zhang et al., 1998; Krupp et al., 1999), was necessary for inactivation of reconstituted NMDARs in NR1−/− neurons.
A surprising result was the dissociation of receptor inactivation and global increases in [Ca2+]i. We found that, although the C0 domain was responsible for NMDAR inactivation, global increases in [Ca2+]i in response to NMDA were independent of the C terminus of NR1 (Figs. 3b, c, 5, 6b, c). One possible explanation for this discrepancy is that high-capacity Ca2+ buffers, pumps, and stores throughout the neuron dominate the spatiotemporal profile of global Ca2+ responses (Berridge, 1998). As such, the primary effect of channel inactivation on downstream signaling would be a difference in the amount of Ca2+ available locally at the mouth of the NMDAR rather than a difference in the levels of Ca2+ in the soma or nucleus.
NR1 C-terminal domains in downstream signaling
Using a deletion mutant lacking the C0 and the C1 domains, we found that the C terminus of the NR1 subunit is required for downstream signaling to CRE-dependent gene expression. Because increases in [Ca2+]i were not affected by the absence of C0 and C1, we conclude that NMDAR-induced increases in global [Ca2+]i are not sufficient for gene expression. A role for local coupling of Ca2+ channels to signaling pathways was proposed after experiments in which EGTA suppressed elevation of Ca2+ throughout the neuron except for a region very close to the site of Ca2+ influx (Deisseroth et al., 1996; Hardingham et al., 2001). Under these conditions, Ca2+ channel activation still induced CREB phosphorylation without an increase of Ca2+ in the nucleus. Our observations that deletion of the C0 and C1 domains of the NR1 subunit abolishes gene expression and that deletion of either domain reduces gene expression provide evidence that these C-terminal domains are directly responsible for local coupling of NMDARs to gene expression. A similar mechanism was proposed for L-type VSCCs in which deletion of defined C-terminal protein-interaction domains abolished gene expression without affecting global increases in [Ca2+]i (Dolmetsch et al., 2001; Weick et al., 2003).
CREB undoubtedly plays a role in the downstream signaling of the NR1 subunit to CRE-dependent gene expression. We found that NMDARs containing NR1–1a subunits produced more CRE-dependent gene expression and phosphorylated CREB than those containing deletions of either or both the C1 and C0 domains. This result is consistent with the observation that phosphorylation of CREB on Ser-133 is required for CREB-dependent gene expression. Conversely, deletion of either or both of the C0 and C1 domains of NR1 results in similar levels of NMDA-induced CREB phosphorylation but different levels of CRE-dependent gene expression. Furthermore, at 30 min, all NR1 constructs showed similar levels of phosphorylated CREB. Therefore, although phosphorylation of Ser-133 of CREB may be required, it is not sufficient for CRE-dependent gene expression. This result could indicate that other pathways that contribute to this gene expression, possibly affecting other phosphorylation sites on CREB itself (Kornhauser et al., 2002) or recruitment of CBP (Nakajima et al., 1997), are regulated by the C terminus of the NR1 subunit. Indeed, in the case of the L-type VSCC, preventing the interaction between the C-terminal PDZ (postsynaptic density-95/Discs large/zona occludens-1) domain and PDZ proteins reduced CRE-dependent gene expression by decreasing CBP recruitment to CREB (Weick et al., 2003).
CaM is an attractive candidate for coupling NMDARs to nuclear signaling pathways, because it reportedly translocates to the nucleus during neuronal stimulation (Deisseroth et al., 1996). Also, apo-CaM preassociates with the NR1 subunit (Akyol et al., 2004) and with L-type VSCCs, in which this preassociation may couple the channel to gene expression (Dolmetsch et al., 2001). Consistent with this model, we found that deletion of the four amino acids in the NR1 subunit C0 domain that bind CaM reduce gene expression as much as deletion of the entire C0 domain (Fig. 6e), indicating that this binding site may be responsible for coupling the NR1 subunit to downstream signaling. However, these four amino acids also bind to α-actinin and to CaMKII (Leonard et al., 2002), and it remains possible that other NR1 binding proteins bound to this site contribute to NMDA-dependent gene expression responses. In addition, we were unable to ascertain a selective effect of CaM on the downstream signaling of NMDARs using the previously reported CaM1234 construct (Peterson et al., 1999; Dolmetsch et al., 2001) (supplemental Fig. 2, available at www.jneurosci.org as supplemental material). Although it is possible that CaM is responsible for the observed effect on gene expression, other proteins cannot be excluded.
Interestingly, we found that the C0 cassette of the NR1 subunit is not necessary for CaMKII clustering (Figs. 3d, 6d). Thus, the CaMKII binding site in the C0 cassette (Leonard et al., 2002) is not required for CaMKII puncta formation, and other sites in the postsynaptic density, such as NR2B (Shen and Meyer, 1999), may be responsible for binding and targeting CaMKII in response to NMDAR stimulation (Colbran, 2004).
Functional consequences of RNA splicing of the NR1 C terminus
The C1 domain of the NR1 C terminus is encoded by exon 21 and undergoes alternative splicing (Zukin and Bennett, 1995). NR1 splicing varies during development, across brain regions, and among subtypes of neuron (Laurie and Seeburg, 1994). Synaptic activity and environmental conditions also rapidly regulate splicing to create NR1–1a or NR1–2a versions of the NR1 subunit (Hoffmann et al., 2000). A motif in the C1 cassette retains the NR1–1a splice variant within the endoplasmic reticulum (Ehlers et al., 1995; Standley et al., 2000; Scott et al., 2001), possibly ensuring that only functional NMDARs are sent to the cell surface (Wenthold et al., 2003).
However, our results indicate that splicing of NR1 may regulate the function as well as the number of NMDARs. Removal of the C1 domain from NR1 reduced NMDAR-induced CRE-dependent gene expression without affecting receptor inactivation or global [Ca2+]i responses, suggesting that alternative splicing may generate NMDARs with distinct abilities to mediate local and long-range adaptive responses.
Footnotes
S.F. is supported by National Institute of Neurological Disease and Stroke Grant R01 NS39074, a Klingenstein Award, and the J. David Gladstone Institutes. S.R.C is supported by a Graduate Research Fellowship from the National Science Foundation. V.R.R. is supported by the National Institutes of Health–National Institute of General Medical Sciences University of California, San Francisco Medical Scientist Training Program and a fellowship from the Epilepsy Foundation of America. We are grateful for the gift of NR1−/− mice from Dr. T. Curran (St. Jude Children’s Research Hospital, Memphis, TN). All NR1 subunit constructs were gifts from Drs. M. Ehlers (Duke University Medical Center, Durham, NC) and R. Huganir (Johns Hopkins University School of Medicine, Baltimore, MD), except the NR1 subunit pore mutant, which was a gift from Dr. E. Ziff (Howard Hughes Medical Institute, New York University Medical Center, New York, NY). GFP-CaMKIIa was a gift from Dr. T. Meyer (Stanford University School of Medicine, Stanford, CA), and the plasmids for enhanced GFP, enhanced YFP, and monomeric RFP were gifts from Dr. R. Y. Tsien (Howard Hughes Medical Institute, University of California, San Diego, CA). The CaM1234 construct was a gift from Dr. D. Yue (Johns Hopkins University School of Medicine). We thank Shyamal Kapadia and other members of the Finkbeiner laboratory for useful discussions, Kelley Nelson for administrative assistance, and Stephen Ordway and Gary Howard for editorial assistance.
References
- Akyol Z, Bartos JA, Merrill MA, Faga LA, Jaren OR, Shea MA, Hell JW (2004). Apo-calmodulin binds with its C-terminal domain to the N-methyl-d-aspartate receptor NR1 C0 region. J Biol Chem 279:2166–2175. [DOI] [PubMed] [Google Scholar]
- Arrasate M, Finkbeiner S (2005). An automated microscope system for determining factors that predict neuronal fate. Proc Natl Acad Sci USA 102:3840–3845. [DOI] [PMC free article] [PubMed] [Google Scholar]
- Arrasate M, Mitra S, Schweitzer ES, Segal MR, Finkbeiner S (2004). Inclusion body formation reduces levels of mutant huntingtin and the risk of neuronal death. Nature 431:805–810. [DOI] [PubMed] [Google Scholar]
- Bading H, Ginty DD, Greenberg ME (1993). Regulation of gene expression in hippocampal neurons by distinct calcium signaling pathways. Science 260:181–186. [DOI] [PubMed] [Google Scholar]
- Berridge MJ (1998). Neuronal calcium signaling. Neuron 21:13–26. [DOI] [PubMed] [Google Scholar]
- Carmignoto C, Vicini S (1992). Activity-dependent decrease in NMDA receptor responses during development of the visual cortex. Science 258:1007–1011. [DOI] [PubMed] [Google Scholar]
- Colbran RJ (2004). Targeting of calcium/calmodulin-dependent protein kinase II. Biochem J 378:1–16. [DOI] [PMC free article] [PubMed] [Google Scholar]
- Crair MC, Malenka RC (1995). A critical period for long-term potentiation at thalamocortical synapses. Nature 375:325–328. [DOI] [PubMed] [Google Scholar]
- Cull-Candy S, Brickley S, Farrant M (2001). NMDA receptor subunits: diversity, development and disease. Curr Opin Neurobiol 11:327–335. [DOI] [PubMed] [Google Scholar]
- Deisseroth K, Bito H, Tsien RW (1996). Signaling from synapse to nucleus: postsynaptic CREB phosphorylation during multiple forms of hippocampal synaptic plasticity. Neuron 16:89–101. [DOI] [PubMed] [Google Scholar]
- Dingledine R, Borges K, Bowie D, Traynelis SF (1999). The glutamate receptor ion channels. Pharmacol Rev 51:7–61. [PubMed] [Google Scholar]
- Dolmetsch RE, Pajvani U, Fife K, Spotts JM, Greenberg ME (2001). Signaling to the nucleus by an L-type calcium channel-calmodulin complex through the MAP kinase pathway. Science 294:333–339. [DOI] [PubMed] [Google Scholar]
- Ehlers MD, Tingley WG, Huganir RL (1995). Regulated subcellular distribution of the NR1 subunit of the NMDA receptor. Science 269:1734–1737. [DOI] [PubMed] [Google Scholar]
- Ehlers MD, Zhang S, Bernhadt JP, Huganir RL (1996). Inactivation of NMDA receptors by direct interaction of calmodulin with the NR1 subunit. Cell 84:745–755. [DOI] [PubMed] [Google Scholar]
- Ehlers MD, Fung ET, O’Brien RJ, Huganir RL (1998). Splice variant-specific interaction of the NMDA receptor subunit NR1 with neuronal intermediate filaments. J Neurosci 18:720–730. [DOI] [PMC free article] [PubMed] [Google Scholar]
- Finkbeiner S, Tavazoie SF, Maloratsky A, Jacobs KM, Harris KM, Greenberg ME (1997). CREB: a major mediator of neuronal neurotrophin responses. Neuron 19:1031–1047. [DOI] [PubMed] [Google Scholar]
- Forrest D, Yuzaki M, Soares HD, Ng L, Luk DC, Sheng M, Stewart CL, Morgan JI, Connor JA, Curran T (1994). Targeted disruption of NMDA receptor 1 gene abolishes NMDA response and results in neonatal death. Neuron 13:325–338. [DOI] [PubMed] [Google Scholar]
- Grant SGN (2003). Synapse signaling complexes and networks: machines underlying cognition. BioEssays 25:1229–1235. [DOI] [PubMed] [Google Scholar]
- Hardingham GE, Arnold FJL, Bading H (2001). A calcium microdomain near NMDA receptors: on switch for ERK-dependent synapse-to-nucleus communication. Nat Neurosci 4:565–566. [DOI] [PubMed] [Google Scholar]
- Hoffmann H, Gremme T, Hatt H, Gottmann K (2000). Synaptic activity-dependent developmental regulation of NMDA receptor subunit expression in cultured neocortical neurons. J Neurochem 75:1590–1599. [DOI] [PubMed] [Google Scholar]
- Kornhauser JM, Cowan CW, Shaywitz AJ, Dolmetsch RE, Griffith EC, Hu LS, Haddad C, Xia Z, Greenberg ME (2002). CREB transcriptional activity in neurons is regulated by multiple, calcium-specific phosphorylation events. Neuron 34:221–233. [DOI] [PubMed] [Google Scholar]
- Krapivinsky G, Krapivinsky L, Manasian Y, Ivanov A, Tyzio R, Pellegrino C, Ben-Ari Y, Clapham DE, Medina I (2003). The NMDA receptor is coupled to the ERK pathway by a direct interaction between NR2B and RasGRF1. Neuron 40:775–784. [DOI] [PubMed] [Google Scholar]
- Krupp JJ, Vissel B, Thomas CG, Heinemann SF, Westbrook GL (1999). Interactions of calmodulin and α-actinin with the NR1 subunit modulate Ca2+-dependent inactivation of NMDA receptors. J Neurosci 19:1165–1178. [DOI] [PMC free article] [PubMed] [Google Scholar]
- Lan J-Y, Skeberdis VA, Jover T, Grooms SY, Lin Y, Araneda RC, Zheng X, Bennett MV, Zukin RS (2001). Protein kinase C modulates NMDA receptor trafficking and gating. Nat Neurosci 4:382–390. [DOI] [PubMed] [Google Scholar]
- Laurie DJ, Seeburg PH (1994). Regional and developmental heterogeneity in splicing of the rat brain NMDAR1 mRNA. J Neurosci 14:3180–3194. [DOI] [PMC free article] [PubMed] [Google Scholar]
- Leonard AS, Bayer KU, Merrill MA, Lim IA, Shea MA, Schulman H, Hell JW (2002). Regulation of calcium/calmodulin-dependent protein kinase II docking to N-methyl-d-aspartate receptors by calcium/calmodulin and α-actinin. J Biol Chem 277:48441–48448. [DOI] [PubMed] [Google Scholar]
- Lin JW, Wyszynski M, Madhavan R, Sealock R, Kim JU, Sheng M (1998). Yotiao, a novel protein of neuromuscular junction and brain that interacts with specific splice variants of NMDA receptor subunit NR1. J Neurosci 18:2017–2027. [DOI] [PMC free article] [PubMed] [Google Scholar]
- Lisman JE (2001). Three Ca2+ levels affect plasticity differently: the LTP zone, the LTD zone and no man’s land. J Physiol (Lond) 532:285. [DOI] [PMC free article] [PubMed] [Google Scholar]
- Lonze BE, Ginty DD (2002). Function and regulation of CREB family transcription factors in the nervous system. Neuron 35:605–623. [DOI] [PubMed] [Google Scholar]
- Malinow R, Malenka RC (2002). AMPA receptor trafficking and synaptic plasticity. Annu Rev Neurosci 25:103–126. [DOI] [PubMed] [Google Scholar]
- Maskos U, McKay RDG (2003). Neural cells without functional N-methyl-d-aspartate (NMDA) receptors contribute extensively to normal postnatal brain development in efficiently generated chimaeric NMDA R1 −/− ↔ +/+ mice. Dev Biol 262:119–136. [DOI] [PubMed] [Google Scholar]
- Maskos U, Brustle O, McKay RDG (2001). Long-term survival, migration, and differentiation of neural cells without functional NMDA receptors in vivo. Dev Biol 231:103–112. [DOI] [PubMed] [Google Scholar]
- Monyer H, Burnashev N, Laurie DJ, Sakmann B, Seeburg PH (1994). Developmental and regional expression in rat brain and functional properties of four NMDA receptors. Neuron 12:528–540. [DOI] [PubMed] [Google Scholar]
- Mu Y, Otsuka T, Horton AC, Scott DB, Ehlers MD (2003). Activity-dependent mRNA splicing controls ER export and synaptic delivery of NMDA receptors. Neuron 40:581–594. [DOI] [PubMed] [Google Scholar]
- Nakajima T, Fukamizu A, Takahashi J, Gage FH, Fisher T, Blenis J, Montminy MR (1997). The signal-dependent coactivator CBP is a nuclear target for PP90 RSK. Cell 86:465–474. [DOI] [PubMed] [Google Scholar]
- Nakazawa K, McHugh TJ, Wilson MA, Tonegawa S (2004). NMDA receptors, place cells and hippocampal spatial memory. Nat Rev Neurosci 5:361–372. [DOI] [PubMed] [Google Scholar]
- Okabe S, Vicario-Abejon C, Segal M, McKay RD (1998). Survival and synaptogenesis of hippocampal neurons without NMDA receptor function in culture. Eur J Neurosci 10:2192–2198. [DOI] [PubMed] [Google Scholar]
- Okabe S, Miwa A, Okado H (1999). Alternative splicing of the C-terminal domain regulates cell surface expression of the NMDA receptor NR1 subunit. J Neurosci 19:7781–7792. [DOI] [PMC free article] [PubMed] [Google Scholar]
- Peterson BZ, DeMaria CD, Adelman JP, Yue DT (1999). Calmodulin is the Ca2+ sensor for Ca2+ -dependent inactivation of L-type calcium channels. Neuron 22:549–558. [DOI] [PubMed] [Google Scholar]
- Petrie RXA, Reid IC, Stewart CA (2000). The N-methyl-d-aspartate receptor, synaptic plasticity, and depressive disorder. A critical review. Pharmacol Ther 87:11–25. [DOI] [PubMed] [Google Scholar]
- Rameau GA, Akaneya Y, Chiu L, Ziff EB (2000). Role of NMDA receptor functional domains in excitatory cell death. Neuropharmacology 39:2255–2266. [DOI] [PubMed] [Google Scholar]
- Sakurada K, Masu M, Nakanishi S (1993). Alteration of Ca2+ permeability and sensitivity to Mg2+ and channel blockers by a single amino acid substitution in the N-methyl-d-aspartate receptor. J Biol Chem 268:410–415. [PubMed] [Google Scholar]
- Scott DB, Blanpied TA, Swanson GT, Zhang C, Ehlers MD (2001). An NMDA receptor ER retention signal regulated by phosphorylation and alternative splicing. J Neurosci 21:3063–3072. [DOI] [PMC free article] [PubMed] [Google Scholar]
- Shen K, Meyer T (1999). Dynamic control of CaMKII translocation and localization in hippocampal neurons by NMDA receptor stimulation. Science 284:162–166. [DOI] [PubMed] [Google Scholar]
- Sheng M, Kim MJ (2002). Postsynaptic signaling and plasticity mechanisms. Science 298:776–780. [DOI] [PubMed] [Google Scholar]
- Sheng M, Cummings J, Roldan LA, Jan YN, Jan LY (1994). Changing subunit composition of heteromeric NMDA receptors during development of rat cortex. Nature 368:144–147. [DOI] [PubMed] [Google Scholar]
- Sprengel R, Suchanek B, Amico C, Brusa R, Burnashev N, Rozov A, Hvalby O, Jensen V, Paulsen O, Andersen P, Kim JJ, Thompson RF, Sun W, Webster LC, Grant SGN, Eilers J, Konnerth A, Li J, McNamara JO, Seeburg PH (1998). Importance of the intracellular domain of NR2 subunits for NMDA receptor function in vivo. Cell 92:279–289. [DOI] [PubMed] [Google Scholar]
- Standley S, Roche KW, McCallum J, Sans N, Wenthold RJ (2000). PDZ domain suppression of an ER retention signal in NMDA receptor NR1 splice variants. Neuron 28:887–898. [DOI] [PubMed] [Google Scholar]
- Sweatt JD (2004). Mitogen-activated protein kinases in synaptic plasticity and memory. Curr Opin Neurobiol 14:311–317. [DOI] [PubMed] [Google Scholar]
- Tang YP, Shimizu E, Dube GR, Rampon C, Kerchner GA, Zhuo M, Liu G, Tsien JZ (1999). Genetic enhancement of learning and memory in mice. Nature 401:63–69. [DOI] [PubMed] [Google Scholar]
- Vissel B, Krupp JJ, Heinemann SF, Westbrook GL (2001). A use-dependent tyrosine dephosphorylation of NMDA receptors is independent of ion flux. Nat Neurosci 4:587–596. [DOI] [PubMed] [Google Scholar]
- Wang J, Chen G, Lu B, Wu CP (2003). GDNF acutely potentiates Ca2+ channels and excitatory synaptic transmission in midbrain dopaminergic neurons. Neurosignals 12:78–88. [DOI] [PubMed] [Google Scholar]
- Weick JP, Groth RD, Isaksen AL, Mermelstein PG (2003). Interactions with PDZ proteins are required for L-type calcium channels to activate cAMP response element-binding protein-dependent gene expression. J Neurosci 23:3446–3456. [DOI] [PMC free article] [PubMed] [Google Scholar]
- Wenthold RJ, Prybylowski K, Standley S, Sans N, Petralia RS (2003). Trafficking of NMDA receptors. Annu Rev Pharmacol Toxicol 43:335–358. [DOI] [PubMed] [Google Scholar]
- Williams K (1993). Ifenprodil discriminates subtypes of the N-methyl-d-aspartate receptor: selectivity and mechanisms at recombinant heteromeric receptors. Mol Pharmacol 44:851–859. [PubMed] [Google Scholar]
- Xia Z, Dudek H, Miranti CK, Greenberg ME (1996). Calcium influx via the NMDA receptor induces immediate early gene transcription by a MAP kinase/ERK-dependent mechanism. J Neurosci 16:5425–5436. [DOI] [PMC free article] [PubMed] [Google Scholar]
- Xie J, Black DL (2001). A CaMK IV responsive RNA element mediates depolarization-induced alternative splicing of ion channels. Nature 410:936–939. [DOI] [PubMed] [Google Scholar]
- Zhang S, Ehlers MD, Bernhardt JP, Su C-T, Huganir RL (1998). Calmodulin mediates calcium-dependent inactivation of N-methyl-d-aspartate receptors. Neuron 21:443–453. [DOI] [PubMed] [Google Scholar]
- Zukin RS, Bennett MVL (1995). Alternatively spliced isoforms of the NMDAR1 receptor subunit. Trends Neurosci 18:306–313. [DOI] [PubMed] [Google Scholar]