

Abstract
We report a thorough analysis of neurotransmission in cultured hippocampal neurons lacking synaptic vesicle protein 2 (SV2), a membrane glycoprotein present in all vesicles that undergo regulated secretion. We found that SV2 selectively enhances low-frequency neurotransmission by priming morphologically docked vesicles. Loss of SV2 reduced initial release probability during a train of action potentials but had no effect on steady-state responses. The amount and decay rate of asynchronous release, two measures sensitive to presynaptic calcium concentrations, are not altered in SV2 knock-outs, suggesting that SV2 does not act by modulating presynaptic calcium. Normal neurotransmission could be temporarily recovered by delivering an exhaustive stimulus train. Our results indicate that SV2 primes vesicles in quiescent neurons and that SV2 function can be bypassed by an activity-dependent priming mechanism. We propose that SV2 action modulates synaptic networks by ensuring that low-frequency neurotransmission is faithfully conveyed.
Keywords: SV2, exocytosis, levetiracetam, synaptic transmission, synaptic vesicle release, neurosecretion, neurotransmission
Introduction
The regulated secretion of neurotransmitters is a highly specialized version of eukaryotic membrane trafficking. In addition to the generic trafficking machinery, synapses use unique regulators that ensure temporal precision, sustain release during periods of repetitive firing, and provide mechanisms for rapidly changing responses.
Synaptic vesicle protein 2 (SV2) is a membrane glycoprotein found only in the secretory vesicles of neural and endocrine cells. It appears to be unique to vertebrates, suggesting that it evolved as a part of complex signaling systems. In mammals, there are three SV2 genes denoted A, B, and C. The molecular mechanism by which these proteins regulate secretion is not clear. Based on predicted structure and amino acid sequences, the SV2 proteins belong to the major facilitator superfamily of transporter proteins, although no transport substrate has been identified despite substantial effort.
Recently, SV2A was shown to be the binding site for the antiepileptic drug levetiracetam (Lynch et al., 2004), suggesting that it plays a role in modulating neuronal excitability. Indeed, gene disruption studies indicate that SV2 is essential for normal neurotransmission. Mice lacking SV2A develop severe seizures (Crowder et al., 1999; Janz et al., 1999). Heterozygotes, although viable and fertile, are 10 times more likely to have seizures than wild-type (WT) animals (Crowder et al., 1999), indicating that even a reduction in SV2A expression affects neurotransmission. Loss of SV2B, however, does not affect viability or fecundity, and the gross phenotype of an SV2A/B double knock-out (KO) is no more severe than loss of SV2A alone, suggesting that SV2A might perform functions not supplied by SV2B.
Studies of regulated secretion in SV2 knock-outs have produced somewhat disparate findings. Most suggest reduced secretion in the absence of SV2. For example, the frequency of spontaneous action potential-dependent IPSCs was reduced in hippocampal slices from SV2A knock-outs (Crowder et al., 1999). A similar decrease in the frequency of EPSCs was observed in cultured neocortical neurons from SV2A or SV2A/B knock-out mice (V. E. Lopantsev and S. M. Bajjalieh, unpublished observation). Likewise, granule fusion triggered by releasing caged calcium was reduced in adrenal chromaffin cells from SV2A knock-outs (Xu and Bajjalieh, 2001). In contrast, another study suggested increased excitatory neurotransmission in SV2 knock-outs (Janz et al., 1999). This study found that neurons derived from SV2A/B double knock-outs exhibited reduced synaptic depression in response to repetitive stimulation and that normal depression was recovered during application of the membrane-permeant calcium chelator EGTA-AM. This led to the hypothesis that SV2 regulates presynaptic calcium and that, without SV2, excessive calcium accumulates, causing abnormal increases in neurotransmitter release.
Here we report an extensive characterization of neurotransmitter release in hippocampal neurons cultured from SV2 knock-out mice. Histological and electrophysiological analyses of this preparation, in which release parameters are well defined (Bekkers and Stevens, 1991; Rosenmund and Stevens, 1996; Augustin et al., 1999; Reim et al., 2001), suggest a model in which SV2 selectively enhances initial release probability by priming morphologically docked vesicles during quiescent periods.
Materials and Methods
SV2 knock-out mice.
The generation of SV2A knock-out mice was reported previously (Crowder et al., 1999). The generation of SV2B knock-outs will be reported elsewhere. These animals were used to obtain two lines of breeders that were SV2A+/−B+/+ or SV2A+/−B−/−. Littermate SV2A+/+B+/+ and SV2A−/−B+/+ mice were obtained by breeding SV2A+/−B+/+ animals. Similarly, SV2A+/+B−/− and SV2A−/−B−/− littermates were obtained by breeding SV2A+/−B−/− animals. All animals were 99.99% C57BL/6. Cultures were generated from mice at postnatal day 0–1. SV2A genotype was determined by PCR before culturing neurons and verified later by Southern blotting.
Cell culture.
Primary cultures of hippocampal neurons were prepared using a modification of the protocol of Bekkers and Stevens (1991). Briefly, hippocampi were isolated, and the dentate gyrus was removed to minimize inhibitory neurons in the cultures. The hippocampi were then incubated in papain, mechanically dissociated, and plated at a density of 2000–3000 cells/cm2 on coverslips containing microislands of astrocytes. Astrocyte cultures were derived from SV2A wild-type littermates and grown until confluence before plating on glass coverslips sprayed with a collagen/poly-d-lysine mixture. Neuronal plating medium consisted of Eagle’s minimal essential medium supplemented with 10% horse serum, 1:100 N2 supplement, 20 mm glucose, 2 mm glutamax, 25 mm HEPES, 50 U/ml penicillin, and 50 μg/ml streptomycin. Most media components were from Invitrogen (Carlsbad, CA). Electrophysiological recordings were performed 10–19 d after plating.
Western analysis of protein expression.
Protein samples were obtained by treating neurons cultured on microislands with 2 U of DNase I for 30 s and then harvesting cells in SDS sample loading buffer. Samples from two coverslips were pooled and then separated by SDS-PAGE, transferred to nitrocellulose, and probed with a monoclonal pan-SV2 antibody (Buckley and Kelly, 1985) or an anti-synaptophysin antibody (Chemicon, Temecula, CA). Antibody binding was detected with horseradish peroxidase-conjugated secondary antibodies reacted with enhanced chemiluminescence reagents (Pierce, Rockford, IL).
Electrophysiology.
Whole-cell voltage-clamp recordings were obtained from neurons on single-neuron islands. Data were acquired using an EPC-9 amplifier (HEKA Elektronik, Lambrecht, Germany). Recording electrodes were typically 3–4 MΩ, and series resistance was compensated up to 70% with a 10 μs speed of feedback compensation. Cells with series resistance >20 MΩ before series resistance compensation or leak current >250 pA were excluded from analyses. All experiments were performed at room temperature. For recordings, cells were constantly perfused with a standard external solution containing the following (in mm): 119 NaCl, 5 KCl, 2.5 CaCl2, 1.5 MgCl2, 20 HEPES, 30 glucose, and 0.01 glycine, pH 7.3 (312 mOsm). For some experiments, CaCl2 concentrations were altered as indicated. The pipette solution contained the following (in mm): 131 K-gluconate, 17.5 KCl, 9 NaCl, 1 MgCl2, 10 HEPES, and 0.2 EGTA, pH 7.2 (328 mOsm). Cells were held at −60 mV and stimulated with a 1 ms depolarization to +20 mV to evoke neurotransmitter release. For readily releasable pool (RRP) measurements, 500 mm sucrose in external solution was applied to islands with a puffer pipette connected to a picospritzer (Parker Hannifin, Mayfield Heights, OH) and removed with a suction pipette. Data were acquired with the Pulse software (HEKA Elektronik).
Data analysis and statistics.
Action potential-evoked EPSCs and sucrose-evoked events were analyzed with custom software written in Visual C# (Microsoft, Redmond, WA). EPSC amplitudes were determined by subtracting a baseline current (obtained by averaging the period 3 ms before the stimulus) from the peak current of the EPSC. The same program was used to estimate synchronous and asynchronous release, which were estimated as follows. For each EPSC, a baseline current and a 50% decay time (measured from the peak of the EPSC) were calculated. Phasic release was defined as the integral with a left bound at the inflection point (beginning) of the EPSC and with a right bound that was 3.5 times the 50% decay time. This region (light region in Fig. 7A) estimated phasic charge reliably for all neurons. Asynchronous release was estimated by subtracting phasic charge from total charge, which was measured as the integral calculated from the inflection point of the EPSC to the point 1 ms before the depolarizing stimulus of the next EPSC. For this calculation, the baseline of the first EPSC of the train was used to account for compounding of asynchronous release throughout the course of the train. Miniature EPSC (mEPSC) recordings were analyzed with the Mini Analysis software (Synaptosoft, Decatur, GA). Statistical analyses were performed with Microsoft Excel. Reported data are mean ± SEM. In all cases, t tests were two-tailed unpaired tests assuming unequal variances.
Figure 7.
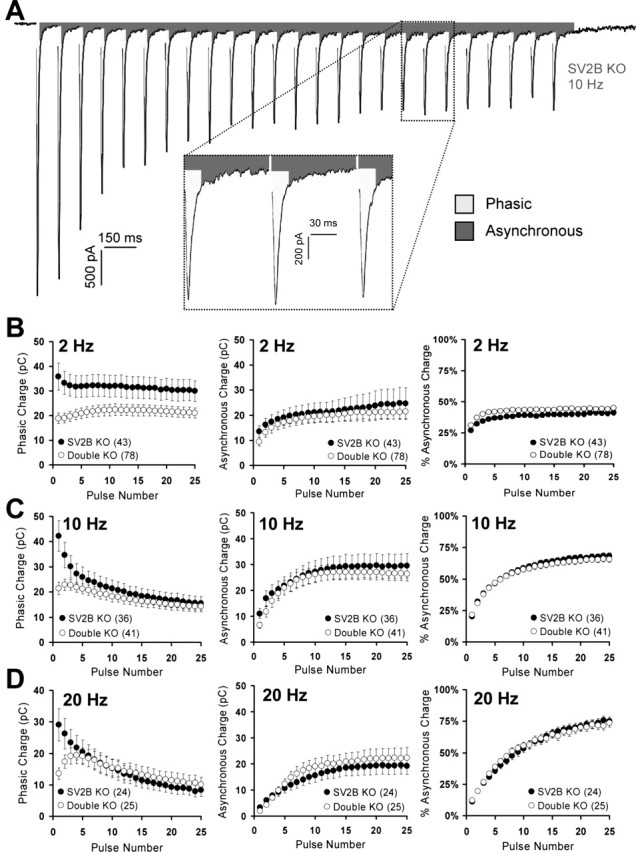
Loss of SV2 does not increase asynchronous release. Trains of 25 stimuli were evoked at 2, 10, and 20 Hz. Phasic and asynchronous components of release were determined as described in Materials and Methods. Data points represent mean ± SEM, with the number of cells analyzed indicated in parentheses. Data represent cultures from six (2 Hz), seven (10 Hz), and seven (20 Hz) sets of littermates. A, Representative trace from an SV2B knock-out neuron stimulated at 10 Hz illustrating the regions that were considered phasic release (light-shaded regions) and asynchronous release (dark-shaded regions). B–D, Left, Phasic release at 2 Hz (B), 10 Hz (C), and 20 Hz (D). Note that, for initial stimuli, phasic release is reduced in SV2A/B double knock-outs, consistent with reduced EPSC amplitudes as shown in Figures 1 and 3. B–D, Middle, Asynchronous release at 2 Hz (B), 10 Hz (C), and 20 Hz (D). Asynchronous release increased throughout the train and was similar in SV2B and SV2A/B knock-outs. Note that asynchronous release in SV2A/B double knock-outs never exceeds that of SV2B knock-outs. B–D, Right, Percentage of asynchronous release at 2 Hz (B), 10 Hz (C), and 20 Hz (D). The proportion of total release that was asynchronous was not altered at 10 and 20 Hz. At 2 Hz, SV2A/B double knock-out neurons demonstrated a small but significant increase in the proportion of asynchronous release in responses 1–8 and 12.
Synaptic density.
Coverslips containing mouse hippocampal neurons [13–14 d in vitro (DIV)] were washed extensively in the external solution used for electrophysiology experiments, fixed with 4% paraformaldehyde, and blocked in blocking solution (PBS, pH 7.4, 3% NGS, 0.4% saponin, and 3% BSA). Coverslips were then incubated with anti-synaptophysin (Synaptic Systems, Goettingen, Germany) and anti-microtubule associated protein-2 (MAP2) (Sigma, St. Louis, MO) diluted 1:500 in blocking solution. Antibody labeling was detected with fluorescent secondary antibodies (Alexa-Flour 488 and Alexa-Fluor 568; Invitrogen). Single-neuron islands were imaged at the W. M. Keck Center for Advanced Studies in Neural Signaling using a DeltaVision microscope (Applied Precision, Issaquah, WA) with a 60× oil immersion objective. A z-series of images was collected at a resolution of 0.113 μm/pixel, deconvolved, and saved as a single projection. Images were processed using Adobe Photoshop (Adobe Systems, San Jose, CA). NIH ImageJ software was used to measure dendritic length and area and as well as to count synaptic puncta larger than four pixels.
FM1-43FX uptake.
Coverslips of DIV 13–14 mouse hippocampal neurons cultured as for physiological analyses were rinsed in external solution containing 2 mm CaCl2 and 4 mm MgCl2. To label active synapses, neurons were challenged by a hyperkalemic solution (in mm: 90 KCl, 39 NaCl, 30 glucose, 25 HEPES, 2 CaCl2, and 4 MgCl2) containing 10 μm FM1-43FX [fixable version of N-(3-triethylammoniumpropyl)-4-(4-(dibutylamino)styryl) pyridinium dibromide] (Invitrogen) for 30–60 s. Excess dye was removed with seven rinses for 1 min each in external solution, two of which contained 1 mm Advasep (CyDex, Lenexa, KS). Immediately after rinses, neurons were fixed in 4% paraformaldehyde, processed for immunocytochemistry, and imaged as described for synapse density experiments. Cells were labeled with anti-synaptophysin, followed by an Alexa-Fluor 647-conjugated secondary antibody (Invitrogen). Images were processed using Adobe Photoshop. Puncta were counted as “active” if they were labeled with both synaptophysin and FM1-43FX or “not active” if labeled only with synaptophysin.
Electron microscopy.
Neurons were cultured on 35 mm Petri dishes containing microislands of astrocytes. At DIV 14, they were fixed in 2% glutaraldehyde, 100 mm sodium cacodylate, and 2% OsO4, pH 7.4. Plates were washed and postfixed on ice in a 1% OsO4, 100 mm sodium cacodylate buffer, pH 7.4. Samples were embedded in Epon, sectioned at 60 nm, stained, and imaged at 40, 000× using a CCD camera. The length of active zones was measured using Adobe Photoshop. Vesicles were considered “morphologically docked” if they were in contact with the presynaptic membrane or “within one vesicle diameter” if any part was of the vesicle was within 40 nm of the presynaptic membrane.
Results
Excitatory responses to isolated stimuli are smaller in neurons lacking SV2A
To characterize the effects of loss of SV2 on neurotransmission in cultured hippocampal neurons, we first compared EPSCs in neurons from wild-type and SV2 knock-outs. To measure EPSC amplitude, we compared the mean amplitude of three autaptic EPSCs evoked by 1 ms depolarizing stimuli separated by a minimum of 10 s. The peak amplitudes of EPSCs recorded from wild-type and SV2B knock-out neurons were indistinguishable (WT, 4.66 ± 0.53 nA; SV2B KO, 4.27 ± 0.25 nA; p = 0.51) (Fig. 1A, B). Loss of either SV2A or SV2A and SV2B resulted in significantly decreased EPSC amplitudes. SV2A knock-out neurons exhibited a 34% decrease in EPSC amplitude compared with wild type (3.06 ± 0.41 nA; p = 0.02) (Fig. 1B). Loss of both SV2A and SV2B resulted in EPSCs that were, on average, 37% smaller than SV2B knock-out responses (2.68 ± 0.16 nA; p < 0.0001) (Fig. 1A, B). The reduced EPSC amplitudes observed in SV2A and SV2A/B double knock-outs did not reflect differences in our ability to adequately voltage clamp cells as revealed in plots of series resistance versus EPSC amplitude (supplemental Fig. S1, available at www.jneurosci.org as supplemental material). Integrating the postsynaptic response to obtain a measure of total charge transfer revealed a significant reduction in EPSC charge in neurons from both SV2A single knock-outs and SV2A/B double knock-outs (WT, 52.6 ± 8.7 pC; SV2A KO, 30.8 ± 6.5 pC, p = 0.049 vs wild type; SV2B KO, 49.5 ± 3.99 pC; double KO, 28.7 ± 2.3 pC, p < 0.0001 vs SV2B KO) (Fig. 1C). The reduced EPSC amplitude and charge in neurons lacking SV2A, but not SV2B, suggests that SV2A could perform a unique function, but immunoblot analysis indicated that SV2A accounts for the majority of total SV2 in hippocampal cultures (Fig. 1E). Therefore, these results cannot speak to isoform-specific functions.
Figure 1.
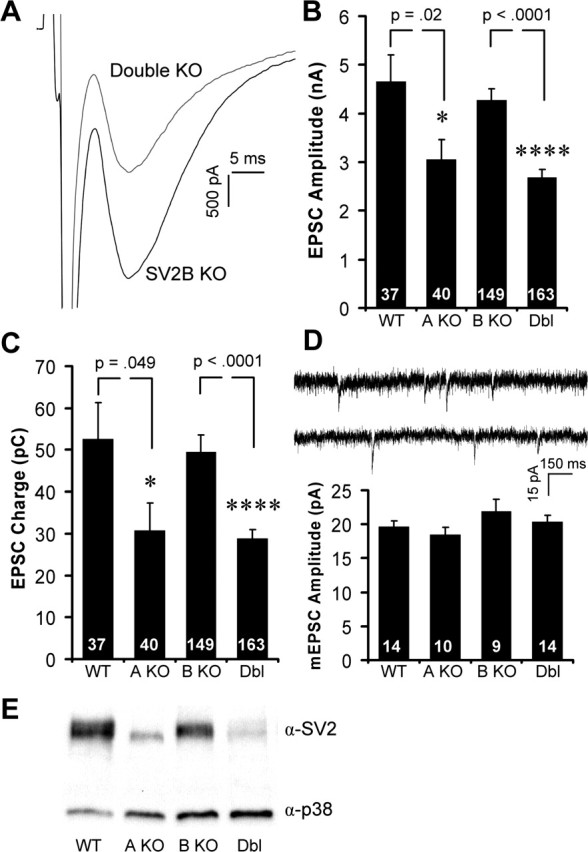
Excitatory responses are smaller in neurons lacking SV2A. Hippocampal neurons cultured from SV2 knock-out mice were analyzed in the whole-cell voltage-clamp configuration. Neurons were held at −60 mV, and single EPSCs were evoked by depolarizing for 1 ms. Graphs show means ± SEM. The number of cells analyzed is indicated within the bars. A, Sample traces from SV2B knock-out and SV2A/B double knock-out neurons. B, C, Average EPSC peak amplitudes (B) and total EPSC charge (C) for wild-type and SV2 knock-out neurons. Data are from littermate cultures of six WT and SV2A KO animals and 23 SV2B KO and double (Dbl) KO animals. D, Top, Representative traces of spontaneous mEPSCs recorded from SV2B and SV2A/B double knock-outs. Bottom, Mean amplitudes of mEPSCs were unchanged in wild-type and knock-out neurons. Data are from four WT, three SV2A KO, three SV2B KO, and three double KO cultures. E, Immunoblot analysis of cultured wild-type and SV2 knock-out cultures probed with anti-synaptophysin (p38) and anti-SV2 reveal that SV2A is the predominant isoform in these cultures.
Based on these findings, we compared SV2A/B double knock-outs to SV2B knock-outs in subsequent studies. As indicated in Figure 1, neurons from SV2B knock-outs had normal electrophysiological responses and near normal levels of SV2. This approach allowed us to compare neurons from littermates.
Quantal size, synapse number, and the percentage of functional synapses are normal in SV2 knock-out neurons
It has been proposed that sugar moieties at the three luminal glycosylation sites in SV2 stabilize neurotransmitter molecules inside synaptic vesicles (Reigada et al., 2003). Although studies in chromaffin cells indicate that loss of SV2 leads to a decrease in vesicle fusion that is independent of vesicle content (Xu and Bajjalieh, 2001), it remained possible that SV2 also plays a role in vesicle filling and, therefore, that the reduced neurotransmission observed in neurons lacking SV2 was attributable to decreased quantal size. To determine whether the reduced EPSC amplitude we observed in neurons lacking SV2 reflected a decrease in vesicle neurotransmitter content, we compared mEPSCs in wild-type and SV2 knock-out neurons. mEPSCs occur spontaneously and typically correspond to single vesicle fusion events. We saw no significant difference in average mEPSC amplitude (WT, 19.73 ± 0.42 pA; SV2A KO, 18.48 ± 1.11 pA, p = 0.38 vs WT; SV2B KO, 21.97 ± 1.72 pA; double KO, 20.39 ± 0.97 pA, p = 0.43 vs SV2B KO) (Fig. 1D) or in mEPSC charge (WT, 55.8 ± 5.6 fC; SV2A KO, 55.3 ± 6.0 fC, p = 0.49 vs WT; SV2B KO, 54.3 ± 10.3 fC; double KO, 56.7 ± 5.7 fC, p = 0.43 vs SV2B KO) across all four neuronal genotypes. The frequency of mEPSCs varied significantly between cells, but we saw no average difference across genotypes (WT, 4.42 ± 2.42 Hz, n = 14; SV2A KO, 2.64 ± 0.71 Hz, n = 10, p = 0.53 vs WT; SV2B KO, 4.18 ± 1.42 Hz, n = 9; double KO, 4.26 ± 1.14 Hz, n = 14, p = 0.95 vs SV2B KO). The amplitude and charge distributions of mEPSCs are shown in supplemental Figure S2 (available at www.jneurosci.org as supplemental material) and revealed no major differences. These results demonstrate that SV2 does not influence the amount of glutamate packaged into vesicles or the frequency of action potential-independent vesicle fusion events and agree with previous results indicating no change in mIPSC frequency or amplitude (Crowder et al., 1999).
The observation that SV2 binds the extracellular matrix protein laminin suggested that SV2 could play a role in synapse formation (Carlson, 1996; Son et al., 2000). To determine whether reduced EPSC amplitude was attributable to reduced synapse formation, we compared synapse number in wild-type and SV2 knock-out neurons. Microisland cultures were fixed and labeled with antibodies recognizing the dendritic protein MAP2 and the synaptic vesicle protein synaptophysin (Fig. 2A). We imaged single-cell islands using deconvolution microscopy and counted the number of synaptophysin-labeled puncta in the proximity of MAP2-labeled dendrites. We then divided the number of synapses by the total dendrite length or area to obtain estimates of synapse density. These studies revealed no significant difference in synapse density [in synapses/μm2: WT, 0.78 ± 0.12; SV2A KO, 0.73 ± 0.08, p = 0.72 vs WT; SV2B KO, 0.91 ± 0.12; double KO, 0.95 ± 0.11, p = 0.84 vs SV2B KO, (Fig. 2B); in synapses/μm: WT, 0.46 ± 0.04; SV2A KO, 0.37 ± 0.03, p = 0.075 vs WT; SV2B KO, 0.45 ± 0.06; double KO, 0.42 ± 0.18, p = 0.73 vs SV2B KO (Fig. 2C)]. These findings are consistent with analyses of synapse density in SV2A knock-out hippocampi (Crowder et al., 1999) and demonstrate that loss of SV2 does not affect synapse formation in hippocampal neurons. Therefore, reduced EPSC amplitudes in SV2A and SV2A/B double knock-out neurons reflect a decrease in synaptic functioning.
Figure 2.

SV2 does not control the number of functional synapses formed in culture. A, Representative SV2B and SV2A/B double knock-out neurons labeled with markers for dendrites (MAP2; green) and synapses [synaptophysin (p38); red]. B, C, Loss of SV2 does not alter the number of synapses formed per unit area (B) or per unit length (C) of dendrite. Numbers of cells analyzed are indicated within the bars. D, E, SV2B and SV2A/B double (Dbl) knock-out neurons were challenged with a hyperkalemic solution containing FM1-43FX, fixed, and processed for immunolabeling with anti-synaptophysin. D, Labeling with anti-synaptophysin (p38) indicates the total number of synapses. E, FM1-43FX labeling indicates functional synapses. F, There is no difference in the percentage of functional synapses in cultured SV2B versus SV2A/B double knock-out hippocampal neurons. The numbers of cells analyzed are indicated within the bars and represent two independent sets of littermate cultures.
Like SV2 knock-outs, neurons from mice lacking the presynaptic cytomatrix protein Bassoon demonstrate reduced EPSC amplitude (Altrock et al., 2003). Reduced neurotransmission in Bassoon knock-out mice was traced to inactivation of approximately half of excitatory synapses, with the remaining synapses functioning normally. To determine whether the reduced neurotransmitter release in SV2 knock-out neurons reflects a similar selective impairment, we measured the percentage of functional synapses by challenging SV2B and SV2A/B double knock-out neurons with a hyperkalemic solution containing FM1-43FX, a fixable version of the dye FM1-43 (Fig. 2E). This lipophilic dye labels active synapses by accumulating in the membrane of synaptic vesicles that have fused and undergone endocytosis (Henkel et al., 1996). After stimulation, the neurons were fixed and counterstained with an antibody against synaptophysin (Fig. 2D). After imaging, we found no significant difference in the percentage of synaptophysin-positive terminals labeled with FM1-43FX (SV2B KO, 63 ± 2%; double KO, 68 ± 3%; p = 0.32) (Fig. 2F). These results indicate that loss of SV2 does not inactivate a subpopulation of synapses, but rather leads to decreased function at all synapses.
Loss of SV2 decreases initial release probability without affecting steady-state responses
The size of a postsynaptic response to a single nerve impulse is equal to the product of the quantal response to a single vesicle, the number of synapses, and the probability that a vesicle will be released at a single synapse (for review, see Stevens, 2003). The normal synapse number and quantal size in SV2 knock-out neurons suggest that their decreased EPSC amplitudes result from reduced release probability. To test this, we compared release probability across genotypes. We first examined synaptic responses to repetitive stimulation at three different frequencies (2, 10, and 20 Hz). Synapses with high release probability depress during stimulus trains, most likely because they use more of their primed vesicles during the initial responses. Conversely, synapses with low release probabilities demonstrate facilitation, thought to be attributable to the effects of residual calcium. SV2B knock-out neurons showed depression in response to stimulus trains of 10 and 20 Hz (Fig. 3C, D, left). At these stimulus frequencies, SV2A/B double knock-outs showed initial facilitation and overall reduced depression relative to SV2B knock-outs. At 2 Hz, SV2B knock-out neurons did not depress, whereas neurons from SV2A/B double knock-outs demonstrated facilitation (Fig. 3B, left). These profiles are indicative of lower synaptic release probability in SV2A/B double knock-out neurons. We also examined responses of wild-type and SV2A knock-out neurons to 10 Hz trains and found that depression in SV2A knock-out neurons was intermediate between wild-type and SV2A/B double knock-outs (supplemental Fig. S3, available at www.jneurosci.org as supplemental material).
Figure 3.

Initial and low-frequency responses are smaller in SV2A/B double knock-outs. A, Representative traces from SV2B and SV2A/B double knock-out neurons in response to trains of 25 stimuli evoked at a frequency of 10 Hz. Stimulus artifacts were removed for clarity. B–D, Left, Synaptic responses of SV2B and SV2A/B double knock-out neurons normalized to the first pulse for 2 Hz (B), 10 Hz (C), and 20 Hz (D) trains. SV2A/B double knock-outs initially exhibit facilitation and show reduced depression over the course of the trains. Shown are means ± SEM. The numbers of cells recorded from are indicated in parentheses and represent cultures from six (2 Hz), seven (10 Hz), and seven (20 Hz) sets of littermates. B–D, Right, Absolute amplitudes of responses to 2 Hz (B), 10 Hz (C), and 20 Hz (D) trains.
Although the normalized responses of SV2B and SV2A/B double knock-out neurons were very different, we noticed that the absolute amplitude of steady-state responses were similar at faster stimulus frequencies. Plotting absolute amplitudes demonstrates that, whereas initial release during a train was significantly decreased in SV2A/B double knock-outs, the amplitude of steady-state response was normal at 10 and 20 Hz (Fig. 3B–D, right). At 2 Hz, however, the responses remained significantly smaller throughout the stimulus train. These results argue against a model in which loss of SV2 leads to abnormally large responses during repetitive stimulation. Rather, they are consistent with a model in which loss of SV2 decreases initial release probability and thus has consequences primarily for low-frequency neurotransmission.
To further examine the role of SV2 in release probability, we measured the rate of response inhibition by MK-801 [(+)-5-methyl-10, 11-dihydro-5H-dibenzo [a, d] cyclohepten-5, 10-imine maleate], an activity-dependent blocker of NMDA-sensitive glutamate receptors. The rate at which MK-801 blocks postsynaptic responses correlates with release probability such that neurons with higher release probability are blocked faster than neurons with lower release probability (Rosenmund et al., 1993). NMDA receptor-mediated responses, evoked every 8 s in the presence of 5 μm MK-801, demonstrated slower blockade in SV2A/B double knock-out neurons (Fig. 4A). This supports the interpretation that loss of SV2 reduces release probability. Using the approach of Fernandez-Chacon et al. (2001), we determined the degree of compression in the x-axis necessary to make the SV2A/B double knock-out data fit those from SV2B knock-outs. We found that a 35% compression of the axis resulted in superimposition of the curves, consistent with the 37% decrease in EPSC amplitude (Fig. 4B).
Figure 4.

Loss of SV2 decreases synaptic release probability. To measure synaptic release probability, NMDA receptor-mediated EPSCs were evoked every 8 s in the presence of 5 μm MK-801, 10 μm CNQX, 2.5 mm calcium, and 0 mm magnesium. Amplitudes are normalized to the first response in the presence of MK-801. Data points represent mean ± SEM. The number of cells analyzed is indicated in parentheses and represent four independent sets of cultures. A, The rate of MK-801 block is reduced in SV2A/B double knock-outs relative to SV2B knock-out littermates. B, Plot of data shown in A in which the x-axis has been expanded by a factor of 35% for SV2B knock-out data. The alignment of the two curves after this manipulation indicates a decrease in the release probability in SV2A/B double knock-outs that is consistent with the decreased EPSC amplitude.
Decreased release probability in SV2 knock-out neurons is not attributable to altered calcium dependence of release
One way SV2 might influence release probability is by altering the calcium dependence of release, perhaps via its interaction with synaptotagmin, a calcium sensor for synaptic vesicle exocytosis (Schivell et al., 1996; Lazzell et al., 2004; Schivell et al., 2005). We therefore analyzed the calcium dependence of release by evoking EPSCs at several calcium concentrations (0.5, 1, 2.5, 5, and 10 mm) with constant magnesium (1.5 mm). We found that relative increases in EPSC amplitude as a function of external calcium were identical in all four genotypes, indicating that calcium sensitivity is unaffected by loss of SV2 (Fig. 5A, B). We also examined short-term plasticity by measuring paired-pulse ratios at different calcium concentrations. Loss of SV2A or SV2A/B increased paired-pulse ratios at 2.5 mm calcium. At 5 and 10 mm calcium, only the SV2A/B double knock-outs were significantly affected (Fig. 5C, D), however, perhaps explaining why Janz et al. (1999) did not see impairment in SV2A knock-outs when recording in 10 mm calcium. This further illustrates that the SV2A knock-out phenotype is intermediate between wild-type and SV2A/B double knock-out. Collectively, these data indicate that release probability is altered without changing the calcium dependence of release. These results are consistent with previous work finding no difference in the calcium dependence of secretory granule fusion in chromaffin cells from SV2 knock-outs (Xu and Bajjalieh, 2001).
Figure 5.

SV2 regulates short-term plasticity but not the calcium dependence of release. Pairs of EPSCs separated by 45 ms were evoked in wild-type and SV2 knock-out neurons at a variety of calcium concentrations with constant magnesium (1.5 mm). Data points represent mean ± SEM. The numbers of cells analyzed are indicated in parentheses. Data are from littermate cultures of three WT and SV2A KO animals and five SV2B KO and double KO animals. Asterisks denote statistically significant differences (p < 0.05). A, Representative pairs of responses in 1, 2.5, and 10 mm external calcium from SV2B and SV2A/B double knock-out cells. B, Mean normalized amplitudes of responses to a single stimulus in varying concentrations of external calcium. For each cell, EPSC amplitudes were normalized to responses in 2.5 mm calcium. Note that synaptic responses increase identically in all four genotypes as calcium is elevated. C, D, Mean paired-pulse ratios at several calcium concentrations for wild-type and SV2A knock-out (C) and SV2B and SV2A/B double knock-out (D) neurons. Paired-pulse ratios in SV2A/B double knock-outs were increased relative to SV2B knock-outs. SV2A knock-outs show an intermediate phenotype.
Decreased release probability in SV2 knock-outs results from a smaller readily releasable pool of vesicles
Synaptic release probability is correlated with the size of the RRP of vesicles, which corresponds to the vesicles that are docked and primed for fusion. Synapses with a larger RRP release vesicles with higher probability than those with a smaller RRP (Dobrunz and Stevens, 1997; Dobrunz, 2002). Previous work characterizing release of catecholamines by chromaffin cells cultured from SV2 knock-outs revealed ∼50% reduction in the size of the exocytotic burst triggered by increased intracellular calcium (Xu and Bajjalieh, 2001). Because the exocytotic burst operationally defines the RRP of secretory granules in that preparation, this result suggested that SV2 modulates the RRP. To determine whether the decreased release probability in SV2 knock-out neurons results from a reduced pool of release-competent synaptic vesicles, we measured the RRP in cultured hippocampal neurons by applying a hypertonic sucrose solution that induces the fusion of release-competent vesicles in a soluble N-ethylmaleimide-sensitive factor attachment protein receptor (SNARE)-dependent and calcium-independent manner (Rosenmund and Stevens, 1996). We used a 5 s application of 500 mm sucrose in standard extracellular solution to evoke release of the RRP and measured the total charge transfer minus an estimate of on-line refilling (Fig. 6A) (see Materials and Methods). On average, the response in neurons from SV2A/B double knock-outs was 39% lower than responses in neurons from SV2B knock-outs (SV2B KO, 1645 ± 239 pC; double KO, 998 ± 189 pC; p = 0.04) (Fig. 6B). This decrease in the size of the RRP is of the same magnitude as the decrease in EPSC amplitude.
Figure 6.
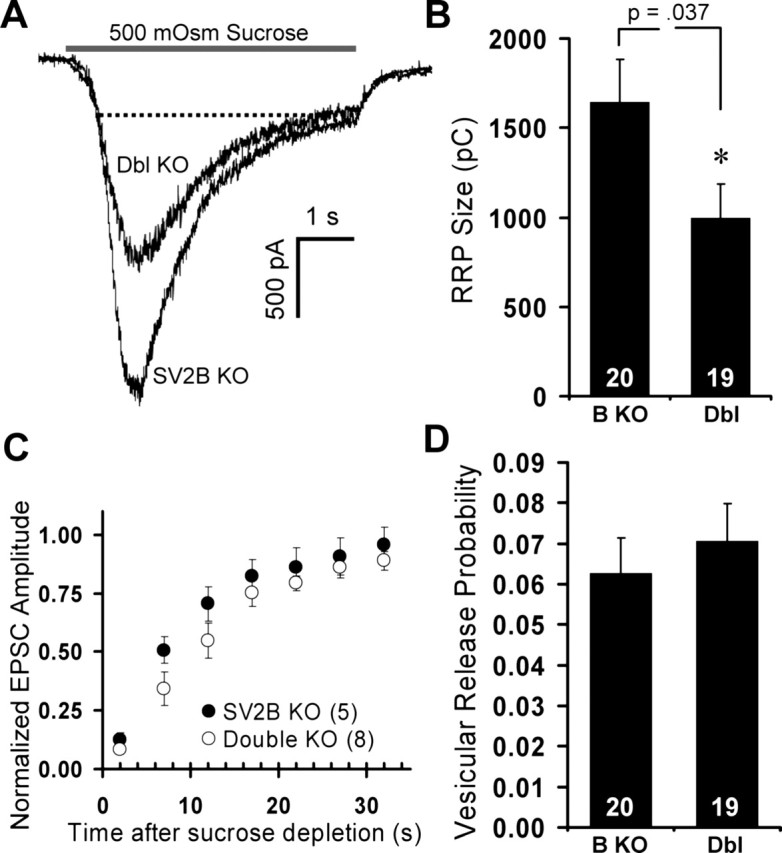
Loss of SV2 decreases the readily releasable pool of vesicles. Neurons cultured from SV2B and SV2A/B double knock-outs were bathed in hypertonic sucrose solutions to estimate the RRP. Graphs are mean ± SEM, and numbers of cells analyzed are indicated. A, Representative sucrose-evoked responses from SV2B knock-out and SV2A/B double (Dbl) knock-out neurons. The dashed lines indicate the level of steady-state release that was subtracted from charge integrals to account for on-line refilling of the RRP during sucrose application. B, Mean RRP sizes for SV2B and SV2A/B double knock-out neurons indicate that the RRP is reduced by 39% in SV2A/B double knock-outs relative to SV2B knock-outs. Data are from six independent sets of littermate cultures. C, Recovery of EPSC amplitudes after sucrose depletion of the RRP. Shown are EPSC amplitudes in response to a 0.2 Hz train initiated 2 s after sucrose application. Amplitudes are normalized to a baseline EPSC obtained before depletion of the RRP. SV2A/B double knock-out neurons show a trend toward slower recovery. Data are from two independent sets of littermate cultures. D, Mean percentage of the RRP released in response to a single action potential. EPSC charges were divided by the sucrose-induced charge to obtain vesicular release probability. To correct for response rundown, multiple EPSCs, evoked both before and 1 min after sucrose application, were averaged. Data are from six independent sets of littermate cultures.
Because SV2 appears to modulate the size of the RRP, we next asked whether loss of SV2 affects the rate at which the RRP is refilled. To measure the rate of RRP refilling, we depleted the pool by sucrose application, waited 2 s, and gave a 0.2 Hz train of stimuli. Figure 6C shows the time course of EPSC amplitude recovery normalized to a baseline EPSC obtained before depletion. We observed no significant difference in the rate of RRP recovery in SV2B and SV2A/B double knock-outs. We next asked whether the vesicular probability of release (PVR) was altered. To estimate the PVR, we calculated the percentage of the RRP released in response to a single action potential. The average integral of two sets of three EPSCs (delivered at 0.1 Hz 10 s before and 1 min after a sucrose pulse) was divided by the integral of the sucrose response. Our analyses revealed no significant difference in PVR between SV2B knock-out and SV2A/B double knock-out neurons (SV2B KO, 0.063 ± 0.012; double KO, 0.071 ± 0.018; p = 0.61) (Fig. 6D). This result indicates that loss of SV2 decreases the number of readily releasable vesicles without altering the probability that an individual release-competent vesicle will fuse in response to an action potential.
Loss of SV2 does not increase asynchronous release
At synapses, there are two distinct kinetic components of neurotransmitter release that occur in response to an action potential: phasic release, which relies on the fast calcium sensor synaptotagmin (Geppert et al., 1994), and asynchronous release, which is stimulated by bulk increases in presynaptic calcium concentrations and occurs after calcium microdomains have collapsed (Hagler and Goda, 2001). Loss of proteins that act late in vesicle fusion selectively decrease synchronous release (Geppert et al., 1994; Reim et al., 2001). To determine whether SV2 functions late in vesicle fusion, we examined phasic and asynchronous release in SV2B and SV2A/B double knock-out neurons. To accomplish this, we measured the phasic and asynchronous components of responses to 2, 10, and 20 Hz stimulus trains as illustrated in Figure 7A (for a detailed explanation of how each component was determined, see Materials and Methods). As with EPSC amplitude, we found that initial phasic neurotransmission was reduced at all frequencies in double SV2A/B knock-outs relative to SV2B knock-outs (Fig. 7B–D, left). We found that the proportion of asynchronous release was not altered at 10 and 20 Hz (Fig. 7B–D, right), suggesting that both components of release were similarly affected. At 2 Hz (Fig. 7B, right) SV2A/B double knock-out neurons demonstrated a small but significant increase in the proportion of asynchronous release (ranging from 2 to 5%) in some of the responses during the first half of the train. Although this suggests a slight preferential decrease of phasic release at lower stimulus frequencies, the magnitude of the difference is not sufficient to explain the ∼40% decrease in EPSC amplitude. Therefore, we conclude that the primary role of SV2 is to increase the resting RRP and that SV2 plays only a minor role, if any, late in the fusion process. We note that the absence of a significant increase in the absolute levels of asynchronous release (Fig. 7B– D, middle) is inconsistent with SV2 increasing presynaptic calcium levels.
SV2 knock-outs show a relative enhancement of responses after stimulus train-induced depletion of the RRP
To further investigate the role of SV2 in filling the RRP, we examined the time course of EPSC amplitude recovery after depletion by a stimulus train. We used a 40 Hz train applied for 2.5 s to completely deplete the RRP in SV2B and SV2A/B double knock-out neurons (Fig. 8A, left). EPSCs were evoked at varying times after the stimulus train (0.25, 0.5, 1, 2, 4, 8, or 16 s), and their amplitude was normalized to the first EPSC of the depleting train to estimate the percentage of pool recovery. In contrast to recovery after sucrose depletion of the RRP, SV2A/B double knock-out neurons recovered faster and to a greater extent than SV2B knock-out neurons (Fig. 8A, right). By 4 s after the train, SV2A/B double knock-out neurons showed a significant, 1.73-fold enhancement of EPSC amplitude (vs 0.97-fold for SV2B knock-outs; p = 0.003). This enhancement disappeared by 16 s. Intriguingly, the enhancement at 4 s produced EPSC amplitudes that were indistinguishable from controls (SV2B knock-out, 3.64 ± 0.60 nA; double KO, 3.80 ± 0.66 nA), suggesting that intense stimulation temporarily rescues the smaller EPSCs observed in SV2A/B double knock-outs.
Figure 8.

The SV2 knock-out phenotype can be transiently rescued by high-frequency stimulation. A, EPSC recovery after a depleting stimulus train. A 2.5 s, 40 Hz stimulus was used to deplete the RRP (left). At various times after depletion, a single EPSC was evoked, and its amplitude was normalized to the initial response of the depleting train (right). Note that, in contrast to EPSC recovery after sucrose depletion of the RRP, SV2A/B double knock-outs recover faster than SV2B knock-outs and exhibit robust enhancement at 4 s after depletion. Data points represent mean ± SEM, with numbers of cells analyzed indicated in parentheses. Data are from three independent sets of littermate cultures. B, Experimental protocol for C–E. The 10 Hz trains were delivered before and 4 s after depletion of the RRP. Shown is a representative response from an SV2A/B double knock-out neuron. C, Decay rates of asynchronous release are similar in SV2B and SV2A/B double knock-outs. The boxed region in B, illustrating asynchronous release after a stimulus train, was rescaled and overlaid with a representative trace from an SV2B knock-out neuron (shown in gray). The graph at the right shows mean times to 50% decay of this asynchronous release. The numbers of cells analyzed are indicated. Data represent three independent sets of littermate cultures. D, Normalized responses to a 10 Hz stimulus train delivered 1 min before 40 Hz stimulation reproduced our previous findings of reduced depression in SV2A/B double knock-out neurons. E, Normalized responses to a 10 Hz stimulus train delivered 4 s after 40 Hz stimulation. SV2A/B double knock-outs exhibit synaptic depression indistinguishable from SV2B knock-outs.
Because the differences in recovery from sucrose depletion versus train depletion are most likely attributable to calcium entry during the train, we wanted to know whether the relative synaptic enhancement of responses we observed after high-frequency stimulation was the result of slower calcium clearance. To determine whether loss of SV2 altered the rate at which presynaptic calcium was cleared after high-frequency stimulation, we took advantage of the fact that the 2.5 s, 40 Hz train generated a substantial amount of asynchronous release (Fig. 8B). This component of release is dependent on residual calcium and is prolonged by pharmacological manipulations that slow calcium clearance (Otsu et al., 2004). We analyzed the rate at which asynchronous release decayed back to baseline (Fig. 8C) and found no significant difference in the time to 50% decay (SV2B KO, 741 ± 110 ms; double KO, 737 ± 101 ms; p = 0.98), indicating that the removal of residual calcium is not grossly different in SV2A/B knock-outs. This suggests that the enhancement of EPSC amplitude observed in SV2A/B double knock-outs after an exhaustive stimulus train is not attributable to higher presynaptic calcium but rather reflects normal concentrations of calcium having a larger effect.
We next asked whether, like EPSC amplitudes, normal short-term plasticity was also recovered in SV2A/B double knock-outs after high-frequency stimulation. To determine this, we examined responses to a 10 Hz train delivered either 1 min before or 4 s after a 40 Hz depleting train (Fig. 8B). Before high-frequency stimulation, the responses of SV2B and SV2A/B double knock-out neurons reproduced our previous findings, with SV2B knock-out neurons exhibiting normal depression and SV2A/B double knock-outs showing initial facilitation and overall reduced depression (Fig. 8D). Four seconds after high-frequency stimulation, the response of SV2B knock-outs was unchanged. SV2A/B double knock-outs, however, now exhibited depression indistinguishable from SV2B knock-outs (Fig. 8E). These data indicate that the SV2 knock-out phenotype can be transiently rescued by high-frequency activity.
Loss of SV2 does not reduce the number of morphologically docked vesicles
To enter the RRP, vesicles must associate with the plasma membrane (a process called docking) and then undergo a series of priming reactions. To determine whether SV2 acts before vesicle docking, we performed an ultrastructural analysis to measure the density of morphologically docked synaptic vesicles. Figure 9A shows representative electron micrographs from both genotypes. We counted vesicles that were directly opposed to the presynaptic density and divided that number by the length of the active zone to obtain a measure of docked vesicle density. There was no significant difference in the number of morphologically docked vesicles per micrometer active zone between the two genotypes (SV2B KO, 5.35 ± 0.46; double KO, 5.26 ± 0.42; p = 0.98) (Fig. 9B). We also looked at the number of vesicles in close proximity to the active zone by counting all vesicles within one vesicle diameter We again saw no difference (SV2B KO, 11.3 ± 0.61; double KO, 12.1 ± 0.72; p = 0.37) (Fig. 9C). The average active zone length was unchanged in SV2A/B double knock-outs (SV2B KO, 0.642 ± 0.038 μm; double KO, 0.637 ± 0.047 μm; p = 0.94) (Fig. 9D). Together our results indicate that SV2 modulates the size of the RRP at a step that occurs after morphological docking, suggesting that it plays a role in vesicle priming.
Figure 9.

Loss of SV2 does not alter the number of morphologically docked vesicles. A, Representative electron micrographs of synapses in SV2B knock-out (top row) and SV2A/B double knock-out (bottom row) neurons. Examples of vesicles judged to be in contact with (docked) and within one vesicle diameter of the membrane are indicated with arrowheads and arrows, respectively. B–D, SV2B and SV2A/B double (Dbl) knock-out synapses have similar numbers of vesicles docked (B) or within one vesicle diameter of the plasma membrane (C). The average active zone length (D) was also similar. Data are from 59 SV2B knock-out synapses and 51 double knock-out synapses.
Discussion
SV2 enhances initial release probability by increasing the resting RRP
Consistent with results in other preparations (Crowder et al., 1999; Xu and Bajjalieh, 2001), we found that stimulus-evoked neurotransmitter release is reduced in hippocampal neurons lacking SV2 despite no change in the number of functional synapses or in quantal size. The finding that neurotransmission is halved in the absence of SV2 demonstrates that it plays a crucial role in preparing vesicles for fusion, but also that it is not essential for fusion. Rather, SV2 acts as a positive modulator of synaptic transmission.
In the absence of SV2, we found a ∼40% reduction in the size of the RRP. This matches the ∼50% reduction in the RRP measured in chromaffin cells from SV2 knock-outs (Xu and Bajjalieh, 2001). The similarity in these findings suggests that the two different approaches to measuring the RRP (measuring postsynaptic EPSCs in response to hypertonic sucrose in neurons and measuring changes in membrane capacitance in response to uncaging intracellular calcium in chromaffin cells) reflect the same physiological construct. The ∼40% decrease in the RRP we observed here matched almost exactly the ∼40% decrease in EPSC size, suggesting that smaller EPSCs in SV2A/B double knock-out neurons are attributable entirely to the decreased RRP. Consistent with this, we found no difference in the calcium dependence of release or in the vesicular release probability. Small effects on the proportion of asynchronous release at low stimulus frequencies suggest that SV2 may play a minor role after vesicles join the RRP. Our results, however, suggest that the predominant function of SV2 is to increase the population of primed, release-competent vesicles and, in doing so, increase synaptic release probability.
Although SV2A/B double knock-outs exhibited synaptic facilitation at the beginning of a stimulus train, at no point did the amplitude of their responses exceed those of SV2B knock-out controls. Interestingly, the amplitude of steady-state responses at higher stimulus frequencies was normal in SV2A/B double knock-outs, suggesting that the action of SV2 in vesicle priming can be provided by something that occurs during synaptic activity. The alternate, non-SV2-mediated pathway to RRP filling appears to be a reversible, calcium-dependent process because depletion of the RRP by long stimulus trains, but not by sucrose, led to a short-lived capacity for normal amplitude responses and normal synaptic depression. The primary difference between these two modes of depleting the RRP is that stimulus trains caused calcium influx into the presynaptic terminal. There is substantial evidence for calcium-dependent regulation of vesicle priming (Neher and Zucker, 1993; Stevens and Wesseling, 1998), and proteins such as protein kinase C (Stevens and Sullivan, 1998) and Munc13 (Rosenmund et al., 2002) have been implicated in this regulation. The temporary nature of SV2-independent priming is demonstrated by the finding that the rescue effect of a stimulus train was reversed within 16 s.
Recently it was reported that the RRP measured with hypertonic sucrose comprises two subpopulations of vesicles. The first subpopulation consists of vesicles that are released during a normal stimulus train, whereas the second subpopulation consists of vesicles that are only released with enhanced calcium influx or during longer stimulus trains (Moulder and Mennerick, 2005). Although this phenomenon may reflect an initial heterogeneity of PVR among vesicles and could suggest that sucrose provides an overestimate of the true readily releasable pool of vesicles, more recent evidence indicates that activity-dependent inactivation of calcium channels occurs during stimulus trains (Xu and Wu, 2005). Therefore, stimulus trains are likely to lead to inaccurate estimates of the RRP (Moulder and Mennerick, 2005). Because sucrose-evoked release of the RRP is not influenced by calcium-dependent processes, we propose that it provides a better estimate of the total population of release competent vesicles. Furthermore, because synaptic activity overrides SV2 function, it was absolutely necessary to use a calcium-independent measurement of the RRP in the studies reported here.
SV2 does not buffer presynaptic calcium
The theory that SV2 proteins regulate presynaptic calcium concentrations was based on two observations: (1) that loss of SV2 decreased synaptic depression without affecting release probability, and (2) that application of the membrane-permeant calcium chelator EGTA-AM restored synaptic depression (Janz et al., 1999). Together these findings suggested that excessive presynaptic calcium accumulates in the absence of SV2, causing larger than normal responses later in a stimulus train. We find, however, that release probability is decreased and that the absolute amplitude of responses in SV2 knock-outs never exceeds that of controls. Rather, the reduced synaptic depression in SV2 knock-outs is the result of smaller initial responses (attributable to reduced initial release probability) coupled with normal subsequent responses (attributable to activity-dependent vesicle priming). The results of Janz et al. likely reflect EGTA-AM-mediated reduction of calcium-dependent priming during stimulus trains. Under these conditions, the smaller-than-normal initial response would depress to a smaller-than-normal steady-state response, producing apparently normal synaptic depression.
Asynchronous release has been shown in other studies of cultured hippocampal neurons to be influenced by intra-terminal calcium (Hagler and Goda, 2001). We saw no major difference between SV2B and SV2A/B double knock-outs in the fraction of release that was asynchronous during 2, 10, and 20 Hz trains. We also saw no difference in the rate at which asynchronous release decays after a stimulus train, a measure that is sensitive to presynaptic calcium clearance (Otsu et al., 2004). These results are inconsistent with the idea that loss of SV2 alters calcium buffering in presynaptic terminals. Furthermore, whereas calcium buffering has been reported to affect initial release probabilities and synaptic depression (Blatow et al., 2003), the phenotype of the SV2 knock-outs is more consistent with increased, rather than decreased, calcium buffering.
SV2 enhances a post-docking priming step
Our finding that loss of SV2 does not alter the number of morphologically docked synaptic vesicles suggests that it acts after vesicles are tethered to the active zone. After tethering, vesicles undergo a series of priming events, including the formation of SNARE complexes. Both biochemical and electrophysiological studies suggest that SNARE complexes form in stages (Bajjalieh, 2001). The first stage is a loose conformation (Fig. 10) that supports slower, asynchronous fusion, whereas the “zippered up, ” tight conformation supports fast, phasic fusion (Xu et al., 1998, 1999). Because we found no major difference in the ratio of phasic to asynchronous release, we conclude that the major action of SV2 is before the formation of both types of SNARE complexes. This is consistent with the previous finding that SDS-resistant SNARE complexes are reduced in the brains of SV2 knock-outs (Xu and Bajjalieh, 2001).
Figure 10.

SV2 modulates a post-docking priming step. Shown is a model of the point of action of SV2 in vesicle priming. After morphological docking, vesicles undergo a series of priming events, including the formation of SNARE complexes. Our data suggest that SV2 modulates a priming step after docking and before formation of SNARE complexes. It may do this by stimulating a priming reaction (k1) or by inhibiting a depriming reaction (k−1). Calcium accumulation during repetitive stimulation can accelerate the forward (k1) reaction, temporarily compensating for loss of SV2.
The molecular mechanism by which SV2 increases the size the RRP is not known. If SV2 acts as a transporter, as its predicted structure suggests, it could modulate the size of the RRP by transporting a molecule that regulates RRP formation. It is also possible that SV2, although structurally related to transporter proteins, no longer possesses any transport activity and modulates RRP formation in another way, for example through protein–protein interactions that facilitate vesicle priming or inhibit vesicle depriming.
In summary, our studies suggest that SV2 enhances low-frequency neurotransmission by increasing the resting RRP and thus release probability in quiescent neurons. Because SV2 appears to be a recent development in evolution, we hypothesize that it emerged to modulate complex synaptic networks, perhaps ensuring that low-frequency spike patterns are faithfully transmitted. In the future, it will be interesting to investigate how the loss of SV2 affects neural signaling in brain networks.
Footnotes
This work was supported by National Institute for Mental Health/National Institutes of Health Grant RO1MH059842 and the University of Washington Royalty Research Fund (S.M.B.) and the University of Washington Neurobiology Training Grant (K.L.C.). We thank Lisa Baldwin for animal husbandry, Amy Nowack for assistance with cell culturing, and Jonathan Ting for reviewing this manuscript.
References
- Altrock WD, tom Dieck S, Sokolov M, Meyer AC, Sigler A, Brakebusch C, Fassler R, Richter K, Boeckers TM, Potschka H, Brandt C, Loscher W, Grimberg D, Dresbach T, Hempelmann A, Hassan H, Balschun D, Frey JU, Brandstatter JH, Garner CC (2003). Functional inactivation of a fraction of excitatory synapses in mice deficient for the active zone protein bassoon. Neuron 37:787–800. [DOI] [PubMed] [Google Scholar]
- Augustin I, Rosenmund C, Sudhof TC, Brose N (1999). Munc13–1 is essential for fusion competence of glutamatergic synaptic vesicles. Nature 400:457–461. [DOI] [PubMed] [Google Scholar]
- Bajjalieh S (2001). SNAREs take the stage: a prime time to trigger neurotransmitter secretion. Trends Neurosci 24:678–680. [DOI] [PubMed] [Google Scholar]
- Bekkers JM, Stevens CF (1991). Excitatory and inhibitory autaptic currents in isolated hippocampal neurons maintained in cell culture. Proc Natl Acad Sci USA 88:7834–7838. [DOI] [PMC free article] [PubMed] [Google Scholar]
- Blatow M, Caputi A, Burnashev N, Monyer H, Rozov A (2003). Ca2+ buffer saturation underlies paired pulse facilitation in calbindin-D28k-containing terminals. Neuron 38:79–88. [DOI] [PubMed] [Google Scholar]
- Buckley K, Kelly RB (1985). Identification of a transmembrane glycoprotein specific for secretory vesicles of neural and endocrine cells. J Cell Biol 100:1284–1294. [DOI] [PMC free article] [PubMed] [Google Scholar]
- Carlson SS (1996). SV2proteoglycan: a potential synaptic vesicle transporter and nerve terminal extracellular matrix receptor. Perspect Dev Neurobiol 3:373–386. [PubMed] [Google Scholar]
- Crowder KM, Gunther JM, Jones TA, Hale BD, Zhang H-Z, Peterson MR, Scheller RH, Chavkin C, Bajjalieh SM (1999). Abnormal neurotransmission in mice lacking synaptic vesicle protein 2A (SV2A). Proc Natl Acad Sci USA 96:115268–115273. [DOI] [PMC free article] [PubMed] [Google Scholar]
- Dobrunz LE (2002). Release probability is regulated by the size of the readily releasable vesicle pool at excitatory synapses in hippocampus. Int J Dev Neurosci 20:225–236. [DOI] [PubMed] [Google Scholar]
- Dobrunz LE, Stevens CF (1997). Heterogeneity of release probability, facilitation, and depletion at central synapses. Neuron 18:995–1008. [DOI] [PubMed] [Google Scholar]
- Fernandez-Chacon R, Konigstorfer A, Gerber SH, Garcia J, Matos MF, Stevens CF, Brose N, Rizo J, Rosenmund C, Sudhof TC (2001). Synaptotagmin I functions as a calcium regulator of release probability. Nature 410:41–49. [DOI] [PubMed] [Google Scholar]
- Geppert M, Goda Y, Hammer RE, Li C, Rosahl TW, Stevens CF, Sudhof TC (1994). Synaptotagmin I: a major calcium sensor for transmitter release at a central synapse. Cell 79:717–727. [DOI] [PubMed] [Google Scholar]
- Hagler DJ Jr, Goda Y (2001). Properties of synchronous and asynchronous release during pulse train depression in cultured hippocampal neurons. J Neurophysiol 85:2324–2334. [DOI] [PubMed] [Google Scholar]
- Henkel AW, Lubke J, Betz WJ (1996). FM1-43 dye ultrastructural localization in and release from frog motor nerve terminals. Proc Natl Acad Sci USA 93:1918–1923. [DOI] [PMC free article] [PubMed] [Google Scholar]
- Janz R, Goda Y, Geppert M, Missler M, Sudhof TC (1999). SV2A and SV2B function as redundant Ca2+ regulators in neurotransmitter release. Neuron 24:1003–1016. [DOI] [PubMed] [Google Scholar]
- Lazzell DR, Belizaire R, Thakur P, Sherry DM, Janz R (2004). SV2B regulates synaptotagmin 1 by direct interaction. J Biol Chem 279:52124–52131. [DOI] [PubMed] [Google Scholar]
- Lynch BA, Lambeng N, Nocka K, Kensel-Hammes P, Bajjalieh SM, Matagne A, Fuks B (2004). The synaptic vesicle protein SV2A is the binding site for the antiepileptic drug levetiracetam. Proc Natl Acad Sci USA 101:9861–9866. [DOI] [PMC free article] [PubMed] [Google Scholar]
- Moulder KL, Mennerick S (2005). Reluctant vesicles contribute to the total readily releasable pool in glutamatergic hippocampal neurons. J Neurosci 25:3842–3850. [DOI] [PMC free article] [PubMed] [Google Scholar]
- Neher E, Zucker RS (1993). Multiple calcium-dependent processes related to secretion in bovine chromaffin cells. Neuron 10:21–30. [DOI] [PubMed] [Google Scholar]
- Otsu Y, Shahrezaei V, Li B, Raymond LA, Delaney KR, Murphy TH (2004). Competition between phasic and asynchronous release for recovered synaptic vesicles at developing hippocampal autaptic synapses. J Neurosci 24:420–433. [DOI] [PMC free article] [PubMed] [Google Scholar]
- Reigada D, Diez-Perez I, Gorostiza P, Verdaguer A, Gomez de Aranda I, Pineda O, Vilarrasa J, Marsal J, Blasi J, Aleu J, Solsona C (2003). Control of neurotransmitter release by an internal gel matrix in synaptic vesicles. Proc Natl Acad Sci USA 100:3485–3490. [DOI] [PMC free article] [PubMed] [Google Scholar]
- Reim K, Mansour M, Varoqueaux F, McMahon HT, Sudhof TC, Brose N, Rosenmund C (2001). Complexins regulate a late step in Ca2+-dependent neurotransmitter release. Cell 104:71–81. [DOI] [PubMed] [Google Scholar]
- Rosenmund C, Stevens CF (1996). Definition of the readily releasable pool of vesicles at hippocampal synapses. Neuron 16:1197–1207. [DOI] [PubMed] [Google Scholar]
- Rosenmund C, Clements JD, Westbrook GL (1993). Nonuniform probability of glutamate release at a hippocampal synapse. Science 262:754–757. [DOI] [PubMed] [Google Scholar]
- Rosenmund C, Sigler A, Augustin I, Reim K, Brose N, Rhee JS (2002). Differential control of vesicle priming and short-term plasticity by Munc13 isoforms. Neuron 33:411–424. [DOI] [PubMed] [Google Scholar]
- Schivell AE, Batchelor RH, Bajjalieh SM (1996). Isoform-specific, calcium-regulated interaction of the synaptic vesicle proteins SV2 and synaptotagmin. J Biol Chem 271:27770–27775. [DOI] [PubMed] [Google Scholar]
- Schivell AE, Mochida S, Kensel-Hammes P, Custer KL, Bajjalieh SM (2005). SV2A and SV2C contain a unique synaptotagmin-binding site. Mol Cell Neurosci 29:56–64. [DOI] [PubMed] [Google Scholar]
- Son YJ, Scranton TW, Sunderland WJ, Baek SJ, Miner JH, Sanes JR, Carlson SS (2000). The synaptic vesicle protein SV2 is complexed with an alpha5-containing laminin on the nerve terminal surface. J Biol Chem 275:451–460. [DOI] [PubMed] [Google Scholar]
- Stevens CF (2003). Neurotransmitter release at central synapses. Neuron 40:381–388. [DOI] [PubMed] [Google Scholar]
- Stevens CF, Sullivan JM (1998). Regulation of the readily releasable vesicle pool by protein kinase C. Neuron 21:885–893. [DOI] [PubMed] [Google Scholar]
- Stevens CF, Wesseling JF (1998). Activity-dependent modulation of the rate at which synaptic vesicles become available to undergo exocytosis. Neuron 21:415–424. [DOI] [PubMed] [Google Scholar]
- Xu J, Wu LG (2005). The decrease in the presynaptic calcium current is a major cause of short-term depression at a calyx-type synapse. Neuron 46:633–645. [DOI] [PubMed] [Google Scholar]
- Xu T, Bajjalieh SM (2001). SV2 modulates the size of the readily releasable pool of secretory vesicles. Nat Cell Biol 3:691–698. [DOI] [PubMed] [Google Scholar]
- Xu T, Binz T, Neimann H, Neher E (1998). Multiple kinetic components of exocytosis distinguished by neurotoxin sensitivity. Nat Neurosci 1:192–200. [DOI] [PubMed] [Google Scholar]
- Xu T, Rammner B, Margittai M, Artalejo AR, Neher E, Jahn R (1999). Inhibition of SNARE complex assembly differentially affects kinetic components of exocytosis. Cell 99:713–722. [DOI] [PubMed] [Google Scholar]