

Abstract
Covertly directing visual attention toward a spatial location in the absence of visual stimulation enhances future visual processing at the attended position. The neuronal correlates of these attention shifts involve modulation of neuronal “baseline” activity in early visual areas, presumably through top-down control from higher-order attentional systems. We used electroencephalography to study the largely unknown relationship between these neuronal modulations and behavioral outcome in an attention orienting paradigm. Covert visuospatial attention shifts to either a left or right peripheral position in the absence of visual stimulation resulted in differential modulations of oscillatory α-band (8–14 Hz) activity over left versus right posterior sites. These changes were driven by varying degrees of α-decreases being maximal contralateral to the attended position. When expressed as a lateralization index, these α-changes differed significantly between attention conditions, with negative values (α_right < α_left) indexing leftward and more positive values (α_left ≤ α_right) indexing rightward attention. Moreover, this index appeared deterministic for processing of forthcoming visual targets. Collapsed over trials, there was an advantage for left target processing in accordance with an overall negative bias in α-index values. Across trials, left targets were detected most rapidly when preceded by negative index values. Detection of right targets was fastest in trials with most positive values. Our data indicate that collateral modulations of posterior α-activity, the momentary bias of visuospatial attention, and imminent visual processing are linked. They suggest that the momentary direction of attention, predicting spatial biases in imminent visual processing, can be estimated from a lateralization index of posterior α-activity.
Keywords: alpha, oscillations, spatial attention, TSE, cueing, lateralization index
Introduction
Human beings can voluntarily deploy their attention toward a visual location without moving their eyes or head. These covert attention shifts improve stimulus detection at the locus of attention, at the cost of stimuli located elsewhere (Posner, 1980; Posner et al., 1980). Shifting attention modulates the sensitivity of early visual areas for incoming visual information, presumably through top-down control from higher-order attention areas (Kastner et al., 1999; Hopfinger et al., 2000; Corbetta and Shulman, 2002), in analogy to the mechanisms of signal gain control of visual neurons in animals (Moore et al., 2003). These sensitivity changes are reflected in neuronal response enhancement to stimuli coinciding with the attended location, relative to stimuli appearing elsewhere, as shown by single-neuron recordings (Luck et al., 1997; McAdams and Maunsell, 1999; Reynolds et al., 2000) as well as visual evoked potentials (Mangun and Hillyard, 1991; Heinze et al., 1994; Martinez et al., 1999; Di Russo et al., 2003) and blood-flow neuroimaging in humans (Gandhi et al., 1999; Martinez et al., 1999; Somers et al., 1999). In addition, voluntary deployment of visuospatial attention modulates ongoing “baseline” activity in early visual areas even in the absence of visual stimulation (Luck et al., 1997; Kastner et al., 1999). These changes are spatially dependent and retinotopically organized both in monkey (Luck et al., 1997; Fries et al., 2001) and man (Kastner et al., 1999; Worden et al., 2000) and may serve to bias neuronal responses and visual processing in favor of stimuli that will appear at the attended location.
Our goal was to further detail the changes in neuronal baseline activity that occur with visuospatial attention orienting in the absence of visual stimulation using electroencephalography (EEG) and to examine possible links to forthcoming visual processing at attended versus unattended positions. Previous EEG studies have shown that attention-related changes in anticipation of forthcoming visual events are reflected in sustained modulations of oscillatory α-band (∼8–14 Hz) activity (Klimesch et al., 1998, Bastiaansen et al., 2001; Babiloni et al., 2004). In the case of visuospatial attention deployment, decreases of α-activity have been observed contralateral to the attended location (Sauseng et al., 2005), interpreted to reflect enhanced cortical excitability to facilitate future visual processing at the attended position. In addition, α increases have been documented contralateral to the unattended location (Worden et al., 2000; Yamagishi et al., 2003; Kelly et al., 2006), potentially reflecting an active “inhibitory” process protecting against visual input from task-irrelevant positions. Based on these results, it may be suggested that the direction of visuospatial attention is determined by two divergent processes that are reflected in differential changes of α activity over the two hemispheres (facilitatory α decrease and inhibitory α increase over areas tuned to the attended vs unattended hemifields). If this is the case, the relative asymmetry of collateral α changes should be predictive of behavioral performance in a lateralized target detection task. We tested this working hypothesis by examining the relationship between posterior α asymmetries (expressed through a lateralization index) and behavioral responses to forthcoming visual stimuli in an attention orienting paradigm.
Materials and Methods
Participants
Ten healthy volunteers participated (five males, 21–36 years old) after giving written informed consent to the study, which had been approved by the Beth Israel Deaconess Medical Center Investigational Review Board. Nine subjects were right-handed and one was ambidextrous (Oldfield, 1971). All had normal or corrected-to-normal vision and no history of neurological or psychiatric disorders.
Experimental paradigm and stimulus presentation
Subjects were asked to perform a spatially cued target detection task. Figure 1 illustrates the experimental paradigm and time course of events. Participants were instructed to keep fixation on a central cross and to avoid eye movements and saccades at any time point throughout the experiment. Together with the fixation cross, two gray squares serving as position markers were continuously displayed in the lower left and right visual fields throughout testing. The beginning of a new trial was indicated by an auditory warning signal of variable length (burst of white noise) followed by a brief auditory cue (sine-wave tone). The warning signal prompted the subjects to discontinue performance in the previous trial, to resume baseline position (attention on central cross), and to prepare for the upcoming cue. The brief auditory cue consisted of a 100 or 800 Hz tone (randomly presented). The 100 or 800 Hz tones prompted the participants to covertly orient leftward or rightward, respectively, and to maintain attention at the corresponding position marker in the left or right visual field. After a delay of 2560 ms, a visual target was presented at perithreshold size in the center of one position marker. The targets appeared more often at cued than uncued positions (probability to appear at cued location, p = 0.66). Subjects were required to report the detection of targets by pressing buttons on a keyboard according to perceived target locations, using the right index finger for left targets and the right ring finger for right targets. Responses were required for targets on both the attended and unattended side.
Figure 1.

Experimental paradigm and sequence of events during each trial. A central fixation cross and two lateralized gray squares serving as position markers for visuospatial attention orienting were continuously displayed. Each trial was initiated by an auditory warning signal (white noise) of variable length. This was followed by a brief (50 ms) auditory cue instructing subjects to covertly direct their attention either to the left (100 Hz tone) or to the right (800 Hz tone) position marker. After a delay of 2560 ms, a target appeared for 40 ms either in the left or right gray square. Targets were more likely to appear at cued positions (p = 0.66). Subjects were asked to respond to a perceived target by a right-hand button press.
Before testing, subjects were explicitly told that targets will be presented at perithreshold size so that the detection task is going to be difficult. They were asked to respond to perception of a target only and to withhold responses or guesses if no target was detected.
Fixation cross and position markers.
The central fixation cross (0.5° visual angle) and two gray squares (3 × 3°) were visible throughout testing, latter serving as position markers to facilitate covert shifting and maintaining of attention. Stable viewing distance was supported by a head and chin rest and eye movements were monitored by electro-oculogram (EOG) recordings.
Auditory warning and cue.
The white noise (warning signal) was presented for 1400–1750 ms and the sine-wave tones (cues) for 50 ms to both ears via earphones. The volume of the sine-wave tones was individually adjusted to a comfortable intensity level and the volume of the white noise was set to 30% thereof. We chose auditory (rather than visual) warning and cue signals because we aimed to eliminate visual input as a possible source of cue-related changes in α activity over posterior recording sites. Accordingly, potential changes in α activity over posterior sites would be voluntarily driven (reflecting endogenous attention processes) rather than exogenously evoked.
Visual targets.
Visual targets consisted of small black rectangles. Their size was individually adjusted to perithreshold levels by target titration before the experiment (see Procedure). The targets were flashed for 40 ms at 8° vertical and 26.5° horizontal eccentricity from the central fixation cross. We chose to place targets in the lower visual field because attentional resolution has been reported to be greater in the lower than the upper visual field (Intriligator and Cavanagh, 2001).
The full paradigm also included neutral, nondirectional cues and targets appearing bilaterally. These additional conditions have been implemented to assess attentional task components other than spatial orienting in a previously published transcranial magnetic stimulation study with independent objectives (Thut et al., 2005) and will not be part of the results and discussion presented here.
Procedure
The experiment was performed over two consecutive days. On the first day, subjects completed a training session that included target titration but no EEG recordings. The actual experimental session took place on the following day.
The training session gave subjects a chance to familiarize themselves with the task, especially with the concept of shifting spatial attention independently of eye movements, and served to determine individual perithreshold target sizes for each subject via target titration. Subjects performed the target detection task in three runs of 120 trials each during which five different target sizes were presented. Target sizes (in pixels) in the initial run were 1 × 2, 2 × 2, 2 × 3, 3 × 3, or 3 × 4 [pixel size, ∼0.2 × 0.2 mm (∼0.05 × 0.05°); longer axis horizontal for rectangular targets]. These sizes were adapted in the following runs in two of the 10 participants because the largest target was not perceived in 85% of trials. Maximum tested target sizes in these two subjects were 4 × 4 and 5 × 5 pixels, respectively. After each run, subjects were given feedback about their performance. Two suitable perithreshold targets (T1, T2) of adjacent sizes were selected for presentation during the following day (mean size T1: 2.1 × 2.4 pixels, ∼0.1 × 0.12°; T2: 2.4 × 3.1 pixels, ∼0.12 × 0.16°). During the experimental session, subjects performed the target detection task in a total of 288 trials. Performance was interspersed with regular 1 min breaks.
Recording
EEG data were sampled at 200 Hz from 45 scalp electrodes placed according to the international 10–10 system (EEG unit designed by Ives EEG solutions, Burlington, Ontario, Canada). Conductive plastic-body electrodes coated with a thin layer of silver epoxy were used. Signals were recorded using a bipolar montage and were recalculated off-line against the average reference. Eye movements were monitored by two additional bipolar horizontal and vertical EOG derivations. Impedance was kept <10 kΩ. Continuous single epochs of 5120 ms duration [precue (warning) period, 1280 ms; cue–target interval, 2560 ms; post-target (response) period, 1280 ms] were included in the analysis if not contaminated by eye movements or artifacts.
Manual responses (reaction times, detection rate, false alarms) were collected using a Power Mac computer (model 9600/200; Apple Computers, Cuppertino, CA), running PsyScope.
Determination of individual α frequency and α band
To account for interindividual differences in the α frequency, we used individual α frequency (IAF) as an anchor point to adjust frequency bands individually. This prevents interactions with other, adjacent frequency bands (Doppelmayr et al., 1998; Klimesch et al., 1998). IAF was defined as the individual frequency peak within the α band and was determined from the fast Fourier transform spectra over posterior leads (parietal, parieto-occipital, and occipital). The spectra were calculated over the precue period (1280 ms; corresponding to the last part of the warning period) for each epoch separately (frequency resolution, 0.781 Hz) and then averaged over all epochs per subject independent of condition using Scan 4.2 software (NeuroScan, Herndon, VA).
The individual α-frequency band was then defined as the window, which reaches from 4 Hz below to 2 Hz above the IAF (Klimesch et al., 1998). On average, IAF of our subjects was 11.8 Hz (±0.36 SE) giving rise to a frequency window of 7.8–13.8 Hz, close to the analyzed frequency bands of 8–14 Hz by Worden et al. (2000), 8–13.5 Hz by Kelly et al. (2006), and 6.89–14.31 by Sauseng et al. (2005).
Because several studies suggest that different frequency bands within the α-frequency range reflect different cognitive processes, we initially analyzed the data by separating the individual α-frequency band in three subranges [lower α 1, IAF minus 4 Hz to IAF minus 2 Hz; lower α 2, IAF minus 2 Hz to IAF; upper α, IAF to IAF plus 2 Hz (Klimesch et al., 1998; Klimesch, 1999; Babiloni et al., 2004)]. Because our results were unaffected by these subdivisions in line with previous studies on modulations of α activity during anticipatory attention (Bastiaansen et al., 2002; Sauseng et al., 2005), we will only report the results obtained within the entire individual α-frequency band.
Analysis
Calculation of α-band power evolution over time.
We computed the time course of α power within the predefined analysis window (see above, Recording) using modified temporal spectral evolution (TSE) (Salmelin and Hari 1994) calculations, related to the event-related desynchronization/synchronization method (Pfurtscheller and Lopes da Silva, 1999). TSE in the α-frequency band was calculated for each subject, electrode, and condition [cue left (L) vs right (R)] with Scan 4.2 software (NeuroScan) and using the following calculation steps: (1) data of each single trial were bandpass-filtered in the individually determined α-frequency range (24 db/octave rolloff), (2) rectified (negative potentials become positive), (3) trimmed left and right of 180 ms (to cut filter warm-up artifacts at the edges of the epoch window, −1280 precue to +1280 post-target), (4) smoothed by averaging over 20 consecutive time points (100 ms), and finally, (5) averaged across all single trials.
Effects of cue on α-band activity in the cue–target interval.
The analyses were performed on two symmetric, posterior regions of interests (ROI; one per hemisphere) that were defined based on grand-mean data (electrode sites that showed maximum cue-related changes in the cue–target interval), and that consisted each of three electrodes (pooled within each ROI for the analyses). In addition, these data were used to calculate a lateralization index of α, incorporating the relative distribution of α activity over both hemispheres in one value. The lateralization index was calculated according to the following formula:
 |
The index is negative when α activity is more prominent over the left hemisphere and lower over the right (α_right < α_left), and positive when the opposite is the case (α_left < α_right). α-Band power and lateralization index changes were analyzed using repeated-measure ANOVAs with the within-subject factors cue (cue L vs R), hemisphere (ROI L vs R), and time interval (4 levels: precue, −1100 to 0 ms before cue; first part of cue–target interval, 0 to +1300 ms after cue; second part of cue–target interval, +1300 to +2600 ms after cue; post-target, 0 to 1100 ms after target).
Pretarget α index versus behavioral outcome: overall left–right asymmetries.
To contrast overall left–right biases in posterior α activity and behavior, we calculated lateralization indices based on the behavioral responses to left- versus right-sided targets. These indices were obtained for reaction times (RT) and detection rates (DR) separately via the following formulas:
 |
 |
The formulas lead to negative values in case of an advantage for processing targets in the left relative to the right hemifield (leftward bias), and to positive values for the opposite pattern (rightward bias).
Pretarget α index versus behavior: trial-by-trial analysis.
In a third step of the analysis, α-lateralization indices were recalculated according to the above formula for each single trial (after calculation of α-band power evolution via steps 1–4) (see above, Calculation of α-band power evolution over time) to investigate the relationship between α index before target onset and forthcoming target processing (speed of target detection, detection rate) on a trial-by-trial basis. The mean α-index value averaged over the second half of the cue–target interval was used for sorting the single-trial data (sorting per subject in an ascending order). After sorting, single epochs were binned into five index groups (of equal number of trials) such that group 1 comprised the 20% of trials with the lowest (most negative) index values and group 5 those 20% of trials with the highest (most positive) index values (bin-width, 20%). The dependence of target processing on pretarget α was then investigated using repeated-measure ANOVAs with the sorted and binned index groups as the independent and the corresponding performance measures to targets (RT; DR) as the dependent variables. Because we expected a linear relationship between pretarget α-index values and the corresponding behavioral measures, polynomial linear contrast analysis were performed where appropriate.
Results
Training session and target titration
Detection rate during the last titration run (reflecting performance after training) varied with target sizes [mean ± SE: T1-2 pixels, 0.02 ± 0.01; T1-1 pixel, 0.03 ± 0.02; T1, 0.3 ± 0.09; T2, 0.68 ± 0.13; T2+1 pixel, 0.88 ± 0.09; T2+2 pixels, 0.96 ± 0.04; data aligned to the two perithreshold targets (T1, T2) for each subject and collapsed over all four conditions]. Thus, detection rate significantly increased with target size from near zero (0.02) for the smallest targets (subthreshold) to almost 100% detection (0.96) for the largest ones (suprathreshold) (F = 745.7; p < 0.0001). This shows that subjects followed the instructions and only responded when they really perceived a target and did not guess target onset and location in subthreshold trials. The constant cue–target interval and the relatively high probability of targets appearing at the cued location (p = 0.66) could have led to guessing of target onset and position, but this would be associated with much higher detection rates for subthreshold targets (at least chance levels, i.e., detection rates equal or bigger than 0.5). In addition, false alarm rates at cued positions in incongruent cue–target trials would be high if guessing occurred with subthreshold targets, which was clearly not the case (cue L/target R: left false alarm rate, 0.03; cue R/target L: right false arm rate, 0).
Analysis of the detection rates showed that participants correctly shifted attention in cued directions (overall 2 × 2 ANOVA, interaction cue by target-side: F(1,9) = 9.36; p = 0.014). Subjects detected right targets more easily after right (0.53 ± 0.07) than left cueing (0.40 ± 0.06; F(1,9) = 5.1; p = 0.05) and showed an advantage for detecting left targets after left (0.60 ± 0.05) compared with right cueing (0.52 ± 0.06; F(1,9) = 4.2; p = 0.07). Collapsed over both cue conditions, detection rates revealed a trend toward facilitated detection of left compared with right targets (0.56 ± 0.05 vs 0.47 ± 0.06; main effect of target-side: F(1,9) = 4.14; p = 0.072).
Detection latencies (reaction times) to left and right targets were also significantly affected by cueing (overall 2 × 2 ANOVA, interaction cue by target-side: F(1,9) = 41.12; p < 0.0001). Subjects responded faster to right targets after right (482 ± 23 ms) than after left cueing (596 ± 38 ms; F(1,9) = 10.62; p = 0.01), and reaction times to left targets were shorter after left (443 ± 17.8 ms) than after right cueing (574 ± 24 ms; F(1,9) = 66.16; p < 0.0001). Again, subjects showed an overall advantage for processing left targets, visible in generally faster reaction times to left compared with right targets (508 ± 18 vs 539 ± 24 ms, main effect of target-side: F(1,9) = 4.56; p = 0.061).
Experimental session
Behavior: effects of cue on detection rate and reaction time
Two targets at perithreshold sizes were presented during the experimental session (identified for each subjects individually based on target titration, see T1 and T2 above). Collapsed over all four conditions (2 cues by 2 target sides), average detection rates were 0.32 for the smaller and 0.69 for the larger of these two targets (mean detection rate, 0.505), close to the values obtained during target titration.
Critically, processing at the different target locations was significantly affected by cueing direction both regarding detection rates (overall 2 × 2 ANOVA, interaction cue by target-side: F(1,9) = 13.3; p = 0.005) and reaction times (interaction cue by target-side: F(1,9) = 20.5; p = 0.001). Subjects showed higher detection rates for left targets after left versus right cueing (0.62 ± 0.06 vs 0.5 ± 0.07; F(1,9) = 6.8; p = 0.028), and for right targets after right versus left cueing (0.51 ± 0.05 vs 0.36 ± 0.07; F(1,9) = 11.1; p = 0.009). In analogy, subjects responded faster to left targets after leftward than rightward cueing (461 ± 16 vs 585 ± 33 ms; F(1,9) = 12.6; p = 0.006), and detection latencies for right targets were reduced after rightward in comparison to leftward cueing (506 ± 25 vs 643 ± 27 ms; F(1,9) = 19.6; p = 0.002). In further reproduction of the results of the training session, false alarm rates to cued positions were very low (left false alarms in right target trials after left cueing, 0.04; right false alarms in left target trials after right cueing, 0.02).
Behavior: overall asymmetry in left versus right visual field processing
As during the titration session, the detection rate tended to be higher for left than for right targets (0.56 ± 0.06 vs 0.44 ± 0.06; main ANOVA effect of target-side: F(1,9) = 3.43; p = 0.097) and reaction times were faster to left than to right targets (523 ± 18 vs 575 ± 21 ms; F(1,9) = 8.4; p = 0.018). This overall advantage for left target processing replicates previous results obtained using an identical target detection task in another study sample (Hilgetag et al., 2001), and might be attributable to “pseudoneglect,” the natural tendency of neurologically normal subjects to attend more easily to the left than to the right visual hemifield (Jewell and McCourt, 2000; Brighina et al., 2002).
This advantage for processing of left- over right-sided targets was amplified in left cue conditions (0.62 ± 0.06 vs 0.36 ± 0.07, F(1,9) = 14.16, p = 0.004 for detection rate; 461 ± 16 vs 643 ± 27 ms, F(1,9) = 48.4, p < 0.001 for reaction time), and neutralized with rightward cueing [0.5 ± 0.07 vs 0.51 ± 0.05, F(1,9) = 0.01, not significant (ns) for detection rate; 585 ± 33 vs 506 ± 25 ms, F(1,9) = 3.7, ns for reaction time]. Note that the absence of any effect in the latter comparison (left vs right hemifield processing after right cueing) cannot be explained by poor task performance (attention shifts), as we observed highly significant differences when performance after leftward versus rightward cueing was compared within either target condition (see above, Behavior: effects of cue on detection rate and reaction time).
Together, these behavioral data thus show that although the subjects were performing the task as instructed, there was a strong performance bias in favor of left hemifield stimuli when attention was directed leftward (performance left better than right), but symmetrical performance and, thus, no left–right bias when subjects were attending rightward (performance left equal right), accounted for by an overall leftward advantage.
EEG: effect of cue on α-band activity
Figure 2 shows the time course of oscillatory α-band (∼8–14 Hz) activity for each cue condition (cue L and R) and electrode site (Fig. 2A) as well as averaged over those electrodes showing maximal modulation with attention deployment (P5, P7, PO7 over the left, and P6, P8, PO8 over the right hemisphere) (Fig. 2B, left vs right panels). α-Band activity was differentially modulated by visuospatial orienting (cue L vs R) over left and right hemispheres as a function of time into a trial (Fig. 2B, left and right panels) (three-way interaction cue by hemisphere by time interval: F(3,27) = 3.7; p = 0.02), with differential modulation of α-band activity being restricted to the cue–target interval (interactions cue by hemisphere: F(1,9) = 5.8/5.5; p = 0.04/0.044 for first and second half of this interval, respectively) and being clearly absent in the precue period (two-way interactions: F(1,9) = 0.43, ns; trend for post-target period: F(1,9) = 3.5; p = 0.095). In the cue–target interval, α-activity was significantly lower over the right compared with the left hemisphere when subjects were attending leftward (Fig. 2B, black lines) (main effects of hemisphere: F(1,9) = 5.1/33.6; p = 0.05/0.0003 for first and second half) but there was no hemispheric difference in α-activity when subjects were attending rightward (Fig. 2B, gray line) (F(1,9) = 0.01/0.4, ns for first and second half). This asymmetric effect for leftward versus rightward orienting was observed despite the fact that α activity in the cue–target interval was significantly reduced relative to baseline (precue period) over the hemisphere contralateral to the attended hemifield for both orienting directions (cue R/ROI L, F(1,9) = 5.3, p = 0.046; cue L/ROI R, F(1,9) = 5.5, p = 0.044) and is explained by the pre-existing bias in α activity over the two hemispheres (Fig. 2B, precue period). There was a trend for baseline α activity to be lower over the right compared with the left hemisphere (precue period: F(1,9) = 3.5; p = 0.09) which was amplified by leftward and reduced by rightward orienting.
Figure 2.

Time course of grand-averaged α-band oscillatory activity as a function of cueing condition shown (A) for all recorded electrodes, and (B) for selected posterior electrode sites (pooled per hemisphere) that showed maximal modulation of α-band activity in the cue–target interval (left and right panels). The middle panel in B represents the time course of the corresponding α-lateralization index over the posterior recording sites. Sustained changes in α-band oscillations are seen in the cue–target interval (A, B, left and right panels), which depended on the cued direction of attention and the side of recording. These attention-related changes were driven by varying degrees of α decreases, being maximal over the hemisphere contralateral to the attended position and significantly different from baseline (precue period). The corresponding α-lateralization indices (B, middle) revealed an overall (negative) bias in the distribution of attention-related α activity (α_right < α_left), suggestive of an overall asymmetric attention bias (in favor of the left hemifield).
To take the pre-existing bias and concurrent changes of α activity over both hemispheres before and during attention orienting into account, we introduced a lateralization index of α incorporating the relative distribution of posterior α-activity in one value (Fig. 2B, middle). This lateralization index significantly differed between cueing conditions (cue L vs R) depending on time into the trial (interaction cue by time interval: F(3,27) = 6.7; p = 0.0016). Although there was no main effect of cue in the precue period (F(1,9) = 0.08, ns), the index differed between left and right cueing in the cue–target interval (F(1,9) = 5.8/12.6; p = 0.039/0.006 for first and second half), as well as the subsequent post-target period (F(1,9) = 5.6; p = 0.042). The maximum difference between attention conditions was observed for the second half of the cue–target interval (directly preceding target onset), further suggesting that this measure is indexing lateralized visuospatial attention deployment. Stronger attention effects would be expected for the second half of the cue–target interval, because participants have more time for preparation to the forthcoming targets. Figure 2B (middle) further reveals an overall negative bias of the α-lateralization index (α_right < α_left) that is present already at baseline (precue period) and becomes amplified in the course of leftward orienting (Fig. 2B, middle, black line) or is evolving toward zero (α_right = α_left) during rightward orienting (Fig. 2B, middle, gray line). The overall negative (never positive) values of the lateralization index would be suggestive of an asymmetric attention bias in favor of the left hemifield, because lower α-activity over the right relative to the left hemisphere (α_right < α_left, negative index) can be interpreted to reflect leftward, and the opposite pattern (α_left < α_right, positive index) to be a sign of rightward directed attention (see Introduction).
Pretarget α-index versus behavioral outcome: overall left-right asymmetries
Figure 3 (left) shows the lateralization index of posterior α for both cueing conditions and its evolution over the precue and cue–target intervals (same data as Fig. 2B, middle, but collapsed into three time windows). This is confronted with the subjects’ corresponding left–right performance bias in target detection, estimated from differences in RT or DR to left versus right visual field stimuli (behavioral lateralization indices) (Fig. 3, right).
Figure 3.

Lateralization index of posterior α (left vs right hemisphere) versus behavioral lateralization index for target processing (left vs right hemifield). The leftmost boxes show the evolution of α-lateralization indices over precue and cue–target intervals (collapsed into 3 time windows). The rightmost boxes illustrate the corresponding left-right bias in target processing (in terms of either RT or DR). For both cueing conditions (light vs dark gray boxes), the α-lateralization index close to target onset (second half of cue–target interval) perfectly matches the left-right bias estimated from the behavioral responses to these targets. Note the different scaling for α and behavioral lateralization indices (left vs right y-axis). Whiskers indicate SE.
The figure shows that the behavioral lateralization indices (RT, DR) are matching the α-lateralization indices directly preceding target onset (cue–target interval, second half) in both cue conditions. The negative behavioral index in the left cueing condition (Fig. 3, dark gray boxes) reveals an advantage for left target over right target processing (see also behavioral analysis above) in accordance with the α-index values of the same condition (index is negative, α_right < α_left). Being close to zero, the behavioral index of the right cueing condition (Fig. 3, light gray boxes) indicates symmetric target processing (no visual field advantage) in line with the corresponding, pretarget α-index values (index close to zero; i.e., α_right = α_left).
This match between α-lateralization before target onset and behavioral outcome is further strengthened by statistics. During the time course of the trial, α-lateralization does not initially differ between left and right cueing conditions (precue, F(1,9) = 0.08; ns) but significantly diverges before target onset between conditions (cue–target interval, second half, F(1,9) = 12.6; p = 0.006), as do the behavioral lateralization indices (RT, F(1,9) = 23.2, p < 0.001; DR, F(1,9) = 20.4, p = 0.001). In terms of deviation from zero (one sample t tests against 0), α-indices initially differ from zero for both left and right cueing conditions (precue interval, t = −3.5/−2.9; p = 0.006/0.01) but then evolve into opposite directions with α-indices further departing from zero (left cueing) or converging to zero (right cueing) in the second half of the cue–target interval (left cue, t = −5.8, p = 0.0003; right cue, t = −0.2, ns). In analogy to the α-indices directly preceding target onset, the behavioral lateralization indices are significantly different from zero after left cueing (RT, t = −7.6, p < 0.0001; DR, t = −3.7, p = 0.005) but not after right cueing (RT, t = +2.0, ns; DR, t = +0.4, ns). This shows that α-lateralization directly before target onset perfectly matches the left–right bias of target processing in both cueing conditions and corroborates the hypothesis that posterior α-lateralization and visuospatial attention biases are tightly linked.
Pretarget α-index versus behavior: trial-by-trial analysis
To further probe the relationship between α-activity before target onset and processing of the forthcoming target, we investigated whether α-lateralization is predictive of target detection (speed, detection rate) on a trial-by-trial basis. Based on the above findings, we expected that trials with most negative indices in the second part of the cue–target interval (α_right < α_left) would be associated with a benefit for processing of forthcoming left-sided targets and that this benefit would gradually decrease over trials with less negative/more positive index values in this interval (α_left ≤ α_right), and vice versa for right-sided targets. We found the lateralization indices of α activity to be related to speed of detection (Fig. 4B) but not to detection rate (A). Reaction times were significantly related to lateralization index of the pretarget period depending on target location (Fig. 4B) (overall 2 × 5 ANOVA, interaction target-side by index group, F(4,36) = 3.64, p = 0.014). Whereas reaction times to left targets overall gradually increased from trials with most negative to those with most positive α index values (Fig. 4B, black line) (linear trend, polynomial linear contrasts, F(1,9) = 6.3, p = 0.03), reaction times for right targets gradually decreased over these five index groups (Fig. 4B, gray line) (polynomial linear contrasts, F(1,9) = 5.0, p = 0.05). Detection rates to left and right targets (Fig. 4A) were not significantly related to the preceding lateralization indices (overall 2 × 5 ANOVA, interaction target-side by index group, F = 0.65, ns).
Figure 4.
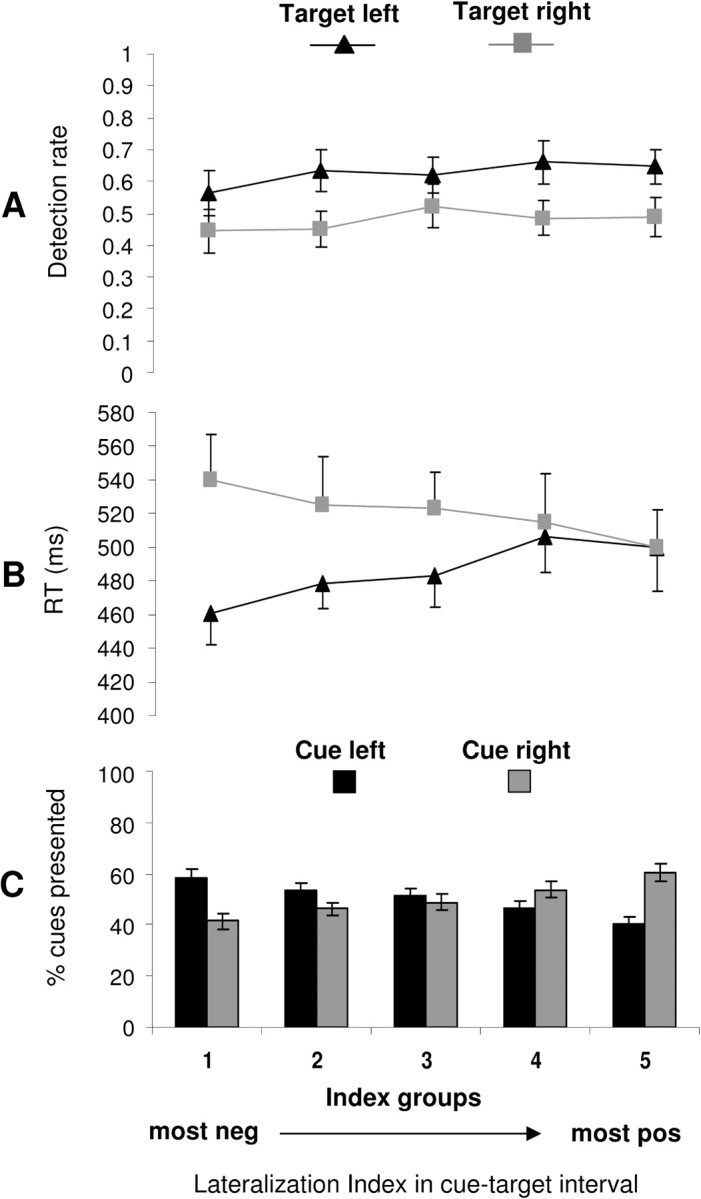
Trial-by-trial variability in pretarget α index versus behavior. A, Average detection rates of left and right targets (±SE). B, Average reaction times to left and right targets (±SE). C, Distribution of left and right cue trials (mean ± SE) are displayed as a function of α-lateralization index before target onset (collapsed over second half of the cue–target interval), subdivided in five index groups. Each index group comprises data of at least 30 trials from each of the 10 subjects. The α-lateralization index is related to reaction time (B) but not detection rate (A) of forthcoming targets. Note the overall advantage for detection of left compared with right targets, both in terms of detection rates and reaction times, which might be attributable to “pseudoneglect,” the natural tendency of neurologically normal subjects to attend more easily to the left than to the right visual hemifield (see Results, Behavior: overall asymmetry in left versus right visual field processing). neg, Negative; pos, positive.
As a final test, we examined the relationship between α-lateralization before target onset and the preceding cue, by calculating the number of left or right cue trials per index group. The corresponding figure (Fig. 4C) illustrates the distribution of left versus right cue trials as a function of pretarget α and therefore also provides information on the accuracy of classifying left versus right cue trials by the α index. It suggests a classification accuracy of ∼60% for the top and bottom one-fifth of all trials (precise numbers, 58.4 ± 3.04% and 60.4 ± 3.15) (Fig. 4C). Overall classification accuracy that was obtained through classifying left and right cue trials by α-index values below or above the median respectively (all trials included) amounted to 55.6 ± 1.28% (left cue trials) and 56.0 ± 1.55% (right cue trials). This is significantly deviating from chance levels (t = 4.58/4.03; p = 0.0026/0.006 for predicting left/right cue trials from α; one-sample t tests against 50%, Bonferroni corrected). This relatively low classification accuracy is in line with our design (i.e., the 66% predictability of forthcoming targets to appear at cued positions). That is, because there is a 33% uncertainty regarding future target positions, participants might not always have shifted their attention in perfect accordance with the instructive cue. The relatively low classification accuracy also fits previous results showing that with maximum spatial target predictability (100%) classification accuracy of left versus right cueing trials by α-measures is ∼73% (Kelly et al., 2005), possibly because of task (cue)-independent fluctuations in the momentary focus of visuospatial attention. Regardless of classification accuracy, Figure 4C provides further information on the relation between α index and cue. If the α index is cue-related and, thus, driven by visuospatial orienting (as also suggested by Fig. 2B and corresponding analysis), trials with most negative indices (indicative of leftward orienting) should most often be preceded by left cues, whereas trials with most positive values (indicative of rightward orienting) should most often be associated with right cues. This is confirmed by our data set revealing a differential distribution of left and right cue trials over the five index groups (overall 2 × 5 ANOVA, interaction cue by index group, F(4,36) = 4.9, p = 0.003). Whereas the number of left-cue trials continuously decreased from the most negative to the most positive index group (Fig. 4C) (linear trend, polynomial linear contrast, F(1,9) = 22.4, p = 0.001), the number of right-cue trials continuously increased over these groups (polynomial linear contrast, F(1,9) = 21.2, p = 0.001). This further confirms that α index before target onset, the preceding cue, and visual processing (in particular speed of target detection) are significantly linked.
Discussion
We explored the neurophysiological correlates of visuospatial attention shifts over posterior recording sites using EEG and their relation to processing of forthcoming lateralized visual targets. Visuospatial attention biases were induced by endogenously cueing attention to either a left or right peripheral visual field position using a variant of Posner’s cue–target paradigm (Posner et al., 1980). Behaviorally, this led to enhanced processing of targets at cued/attended position. In the EEG, we found differential changes in α-band activity over left versus right parieto-occipital sites in correspondence with attentional cueing. The changes were driven by varying degrees of α-decreases (α-desynchronization) that were maximal at sites contralateral to the attended position. In addition, our data reveal a link between the relative asymmetry of α activity over left and right posterior sites (expressed through a lateralization index) and behavioral performance in target detection. Collapsed over all trials, the α-lateralization index directly preceding target onset showed an overall negative bias (α_right ≤ α_left) in accordance with an overall behavioral asymmetry in favor of the left visual field, which was present both in terms of reaction times and detection rates to targets. Across trials, we found that trial-by-trial variability in α-lateralization before target onset can partially explain the variability in behavioral responses to the forthcoming lateralized stimulus, in particular regarding reaction time but not detection rate. Left targets were detected most rapidly when the α index before target onset was most negative (α_right < α_left), and slowest when the index was most positive (α_left ≤ α_right). Conversely, detection of right targets was fastest in trials with most positive index values and slowest in trials with most negative values. Our data suggest that posterior α-lateralization can serve as an indicator for the momentary visuospatial attentional vector, with more negative values (α_right < α_left) indicating a leftward attentional bias and more positive values (α_left < α_right) signaling attention being directed rightward.
Our results replicate previous findings of spatially dependent, posterior α suppression during voluntary visuospatial attention shifts (Sauseng et al., 2005). In comparison to this study, we used auditory instead of visual cues and, thus, show α suppression in the absence of visual stimulation. By presenting auditory cues, we control for the confound of externally evoked α desynchronization, which is systematically induced by visual stimulation (Pfurtscheller et al., 1994) and which may account for part of the α suppression in visually cued attention-orienting paradigms. In further analogy to Sauseng et al. (2005), we found α activity to be significantly suppressed relative to the precue period at sites contralateral to the attended visual hemifield, but did not find any significant increase in the level of oscillatory α activity contralateral to unattended space. This contrasts with previous reports of sustained focal α increases at parieto-occipital sites contralateral to the to-be-ignored position (Worden et al., 2000; Yamagishi et al., 2003; Kelly et al., 2006). However, although divergent, α increases and decreases are not mutually exclusive and might become expressed to different degrees depending on task demand, as suggested previously (Kelly et al., 2006). Decreased α-band activity has been interpreted to represent an electrophysiological correlate of cortical activation or enhanced cortical excitability (Pfurtscheller, 2001) and is likely to correspond to a state of maximum cortical readiness in areas tuned to the attended hemifield. Conversely, increased α-band activity has been associated with cortical deactivation (Pfurtscheller, 2001) or an active decoupling of cortical processing (Vanni et al., 1997; Foxe et al., 1998; Fu et al., 2001). In attention-orienting paradigms, this may protect against visual input from task-irrelevant positions (Worden et al., 2000; Kelly et al., 2006). In keeping with these interpretations, α decreases have been observed when behavioral responses to lateralized targets are given independently of cued directions (i.e., when nothing has to be ignored in the unattended hemifield) (Sauseng et al. 2005; present study). In contrast, α increases have been documented in paradigms that involve suppression of distractor information at unattended locations (Worden et al., 2000; Yamagishi et al., 2003; Kelly et al., 2006).
In addition to showing that the lateralization of posterior α activity is covarying with the direction of lateral attention deployment, our results reveal a link between the pretarget α-lateralization index and the behavioral response to the target. This leads us to conclude that the direction of visuospatial attention along the horizontal dimension and, thus, the efficiency of visual processing at given peripheral positions is defined by the relative activation of two distinct neuronal populations, each tuned to the opposite hemifield. Although on a more macroscopic measurement scale than single-cell recordings, this bears similarity with the principle of population coding for arm movements in the monkey motor cortex where the direction of an arm movement can be predicted by the vector sum of neurons tuned to different directions (Georgopoulos et al., 1986). Our data also suggest a stronger link between α-lateralization index and reaction time than α-lateralization index and detection rate, as only the global α-measure indexing overall left–right attention biases was found to be related to detection rate, whereas trial-by-trial variability in this measure was not. It could be argued that the stronger link to reaction time may suggest that α lateralization is related to response preparation rather than attention deployment. However, as responses were always given with the right hand, EEG changes related to response preparation would be expected to be restricted to the left hemisphere, and not to vary with the attention focus. A more likely explanation is that a link between pretarget α activity and detection rate is simply more difficult to demonstrate, because whether a target will be perceived or not is likely to depend not only on voluntary anticipatory attention mechanisms but also on processes that occur after target onset, such as reflexive reorienting, in particular when targets appear at unattended positions. Thus, despite presentation at unattended positions, targets might reach awareness because of reflexive reorienting. Reaction times to targets, however, are likely to depend on the anticipatory visuospatial attention process, even when followed by reorienting, because the time for reorienting is likely to depend on the anticipatory orienting bias.
The observed topography of our effects (Fig. 2A) implicates posterior areas in its generation. Combined EEG-MEG or EEG-functional magnetic resonance imaging (fMRI) studies have identified areas around the calcarine fissure and in secondary visual and parietal cortex to be involved in the generation of posterior α oscillations (Chapman et al., 1984; Ciulla et al., 1999; Moosmann et al., 2003; Laufs et al., 2003; Feige et al., 2005). Accordingly, the changes in α activity we observed may have been generated within visual areas and reflect preparation for visual events occurring at a predictable position through changes in the baseline activity of neuronal ensembles tuned to these locations. The results of Worden et al. (2000) showing that changes in posterior α-band activity with visuospatial attention shifts are retinotopically mapped at the level of visual quadrants would argue in favor of this interpretation. Yet, it has to be noted that this retinotopy applies to α increases and still awaits replication for α decreases. Also, an early visual origin of our findings would be in line with recent fMRI results showing that covert attention shifts in the absence of visual stimulation engage visual areas that are retinotopically organized (Kastner et al., 1999) and that attention, activity in these early visual areas, and behavioral performance in visual tasks are tightly linked (Ress et al., 2000; Giesbrecht et al., 2006). Another possibility is that the α decreases and increases are of parietal origin. A pattern of parietal activation and deactivation contralaterally and ipsilaterally to the attended position would fit Kinsbourne’s model of spatial attention (Kinsbourne, 1977, 1987). According to this model, each hemisphere is provided with an attentional processor directed toward the opposite hemispace with the two processors reciprocally inhibiting each other through callosal cross talk. In this case, a deactivation in the hemisphere ipsilateral to the attended location could be explained by callosally mediated competitive interactions and would represent a byproduct of attentional control driven by the opposite, activated hemisphere. Because of mutual interactions between hemispheres, the model would also predict that opposite α decreases and increases would necessarily co-occur, which, however, appears not to be the case (Sauseng et al., 2005; Kelly et al., 2006). In addition, differential activation patterns of parietal origin do not fit recent fMRI studies suggesting that the activation of parietal regions during spatial attention deployment before target onset is predominantly bilateral (Kastner et al., 1999; Hopfinger et al., 2000; Corbetta and Shulman, 2002). We thus interpret our findings to reflect the consequence of top-down signals in visual areas, rather than the source of this signal in higher-order, parietal areas implicated in attentional control
In summary, we document a pattern of posterior changes in α-band activity that is modulated by covertly directing attention to a particular location in the absence of visual stimulation and most likely reflects biasing of baseline activity in neuronal visual assemblies tuned to opposite hemifields. Our results indicate that these changes in α-band activity can be used to calculate an index for the momentary bias of visuospatial attention that predicts the processing speed of forthcoming, lateralized visual targets and to some extent detection rate.
Footnotes
This work was supported by Swiss National Science Foundation Grant 3200B0-105867 and National Institutes of Health Grants K24 RR018875, R01-MH069898, and RO1-EY12091. We thank Mark Thivierge for his invaluable administrative support and two anonymous reviewers for comments on a previous draft of this manuscript.
References
- Babiloni et al., 2004.Babiloni C, Miniussi C, Babiloni F, Carducci F, Cincotti F, Del Percio C, Sirello G, Fracassi C, Nobre AC, Rossini PM. Sub-second “temporal attention” modulates alpha rhythms. A high-resolution EEG study. Brain Res Cogn Brain Res. 2004;19:259–268. doi: 10.1016/j.cogbrainres.2003.12.010. [DOI] [PubMed] [Google Scholar]
- Bastiaansen et al., 2001.Bastiaansen MC, Bocker KB, Brunia CH, de Munck JC, Spekreijse H. Event-related desynchronization during anticipatory attention for an upcoming stimulus: a comparative EEG/MEG study. Clin Neurophysiol. 2001;112:393–403. doi: 10.1016/s1388-2457(00)00537-x. [DOI] [PubMed] [Google Scholar]
- Bastiaansen et al., 2002.Bastiaansen MC, Bocker KB, Brunia CH. ERD as an index of anticipatory attention? Effects of stimulus degradation. Psychophysiology. 2002;39:16–28. doi: 10.1017/S0048577202000483. [DOI] [PubMed] [Google Scholar]
- Brighina et al., 2002.Brighina F, Bisiach E, Piazza A, Oliveri M, La Bua V, Daniele O, Fierro B. Perceptual and response bias in visuospatial neglect due to frontal and parietal repetitive transcranial magnetic stimulation in normal subjects. NeuroReport. 2002;13:2571–2575. doi: 10.1097/00001756-200212200-00038. [DOI] [PubMed] [Google Scholar]
- Chapman et al., 1984.Chapman RM, Ilmoniemi RJ, Barbanera S, Romani GL. Selective localization of alpha brain activity with neuromagnetic measurements. Electroencephalogr Clin Neurophysiol. 1984;58:569–572. doi: 10.1016/0013-4694(84)90047-6. [DOI] [PubMed] [Google Scholar]
- Ciulla et al., 1999.Ciulla C, Takeda T, Endo H. MEG characterization of spontaneous alpha rhythm in the human brain. Brain Topogr. 1999;11:211–222. doi: 10.1023/a:1022233828999. [DOI] [PubMed] [Google Scholar]
- Corbetta and Shulman, 2002.Corbetta M, Shulman GL. Control of goal-directed and stimulus-driven attention in the brain. Nat Rev Neurosci. 2002;3:201–215. doi: 10.1038/nrn755. [DOI] [PubMed] [Google Scholar]
- Di Russo et al., 2003.Di Russo F, Martinez A, Hillyard SA. Source analysis of event-related cortical activity during visuo-spatial attention. Cereb Cortex. 2003;13:486–499. doi: 10.1093/cercor/13.5.486. [DOI] [PubMed] [Google Scholar]
- Doppelmayr et al., 1998.Doppelmayr M, Klimesch W, Pachinger T, Ripper B. Individual differences in brain dynamics: important implications for the calculation of event-related band power. Biol Cybern. 1998;79:49–57. doi: 10.1007/s004220050457. [DOI] [PubMed] [Google Scholar]
- Feige et al., 2005.Feige B, Scheffler K, Esposito F, Di Salle F, Hennig J, Seifritz E. Cortical and subcortical correlates of electroencephalographic alpha rhythm modulation. J Neurophysiol. 2005;93:2864–2872. doi: 10.1152/jn.00721.2004. [DOI] [PubMed] [Google Scholar]
- Foxe et al., 1998.Foxe JJ, Simpson GV, Ahlfors SP. Parieto-occipital approximately 10 Hz activity reflects anticipatory state of visual attention mechanisms. NeuroReport. 1998;9:3929–3933. doi: 10.1097/00001756-199812010-00030. [DOI] [PubMed] [Google Scholar]
- Fries et al., 2001.Fries P, Reynolds JH, Rorie AE, Desimone R. Modulation of oscillatory neuronal synchronization by selective visual attention. Science. 2001;291:1560–1563. doi: 10.1126/science.1055465. [DOI] [PubMed] [Google Scholar]
- Fu et al., 2001.Fu KM, Foxe JJ, Murray MM, Higgins BA, Javitt DC, Schroeder CE. Attention-dependent suppression of distracter visual input can be cross-modally cued as indexed by anticipatory parieto-occipital alpha-band oscillations. Brain Res Cogn Brain Res. 2001;12:145–152. doi: 10.1016/s0926-6410(01)00034-9. [DOI] [PubMed] [Google Scholar]
- Gandhi et al., 1999.Gandhi SP, Heeger DJ, Boynton GM. Spatial attention affects brain activity in human primary visual cortex. Proc Natl Acad Sci USA. 1999;96:3314–3319. doi: 10.1073/pnas.96.6.3314. [DOI] [PMC free article] [PubMed] [Google Scholar]
- Georgopoulos et al., 1986.Georgopoulos AP, Schwartz AB, Kettner RE. Neuronal population coding of movement direction. Science. 1986;233:1416–1419. doi: 10.1126/science.3749885. [DOI] [PubMed] [Google Scholar]
- Giesbrecht et al., 2006.Giesbrecht B, Weissman DH, Woldorff MG, Mangun GR. Pre-target activity in visual cortex predicts behavioral performance on spatial and feature attention tasks. Brain Res. 2006;1080:63–72. doi: 10.1016/j.brainres.2005.09.068. [DOI] [PubMed] [Google Scholar]
- Heinze et al., 1994.Heinze HJ, Mangun GR, Burchert W, Hinrichs H, Scholz M, Münte TF, Gös A, Scherg M, Johannes S, Hundeshagen H, Gazzaniga MS, Hillyard SA. Combined spatial and temporal imaging of brain activity during visual selective attention in humans. Nature. 1994;372:543–546. doi: 10.1038/372543a0. [DOI] [PubMed] [Google Scholar]
- Hilgetag et al., 2001.Hilgetag CC, Theoret H, Pascual-Leone A. Enhanced visual spatial attention ipsilateral to rTMS-induced “virtual lesions” of human parietal cortex. Nat Neurosci. 2001;4:953–957. doi: 10.1038/nn0901-953. [DOI] [PubMed] [Google Scholar]
- Hopfinger et al., 2000.Hopfinger JB, Buonocore MH, Mangun GR. The neural mechanisms of top-down attentional control. Nat Neurosci. 2000;3:284–291. doi: 10.1038/72999. [DOI] [PubMed] [Google Scholar]
- Intriligator and Cavanagh, 2001.Intriligator J, Cavanagh P. The spatial resolution of visual attention. Cogn Psychol. 2001;43:171–216. doi: 10.1006/cogp.2001.0755. [DOI] [PubMed] [Google Scholar]
- Jewell and McCourt, 2000.Jewell G, McCourt ME. Pseudoneglect: a review and meta-analysis of performance factors in line bisection tasks. Neuropsychologia. 2000;38:93–110. doi: 10.1016/s0028-3932(99)00045-7. [DOI] [PubMed] [Google Scholar]
- Kastner et al., 1999.Kastner S, Pinsk MA, De Weerd P, Desimone R, Ungerleider LG. Increased activity in human visual cortex during directed attention in the absence of visual stimulation. Neuron. 1999;22:751–761. doi: 10.1016/s0896-6273(00)80734-5. [DOI] [PubMed] [Google Scholar]
- Kelly et al., 2005.Kelly SP, Lalor EC, Reilly RB, Foxe JJ. Visual spatial attention tracking using high-density SSVEP data for independent brain-computer communication. IEEE Trans Neural Syst Rehabil Eng. 2005;13:172–178. doi: 10.1109/TNSRE.2005.847369. [DOI] [PubMed] [Google Scholar]
- Kelly et al., 2006.Kelly SP, Lalor EC, Reilly RB, Foxe JJ. Increases in alpha oscillatory power reflect an active retinotopic mechanism for distracter suppression during sustained visuo-spatial attention. J Neurophysiol. 2006;95:3844–3851. doi: 10.1152/jn.01234.2005. [DOI] [PubMed] [Google Scholar]
- Kinsbourne, 1977.Kinsbourne M. Hemi-neglect and hemisphere rivalry. Adv Neurol. 1977;18:41–49. [PubMed] [Google Scholar]
- Kinsbourne, 1987.Kinsbourne M. Mechanisms of unilateral neglect. In: Jeannerod M, editor. Neurophysiological and neuropsychological aspects of spatial neglect. North-Holland: Amsterdam; 1987. pp. 69–86. [Google Scholar]
- Klimesch, 1999.Klimesch W. EEG alpha and theta oscillations reflect cognitive and memory performance: a review and analysis. Brain Res Brain Res Rev. 1999;29:169–195. doi: 10.1016/s0165-0173(98)00056-3. [DOI] [PubMed] [Google Scholar]
- Klimesch et al., 1998.Klimesch W, Doppelmayr M, Russegger H, Pachinger T, Schwaiger J. Induced alpha band power changes in the human EEG and attention. Neurosci Lett. 1998;244:73–76. doi: 10.1016/s0304-3940(98)00122-0. [DOI] [PubMed] [Google Scholar]
- Laufs et al., 2003.Laufs H, Kleinschmidt A, Beyerle A, Eger E, Salek-Haddadi A, Preibisch C, Krakow K. EEG-correlated fMRI of human alpha activity. NeuroImage. 2003;19:1463–1476. doi: 10.1016/s1053-8119(03)00286-6. [DOI] [PubMed] [Google Scholar]
- Luck et al., 1997.Luck SJ, Chelazzi L, Hillyard SA, Desimone R. Neural mechanisms of spatial selective attention in areas V1, V2, and V4 of macaque visual cortex. J Neurophysiol. 1997;77:24–42. doi: 10.1152/jn.1997.77.1.24. [DOI] [PubMed] [Google Scholar]
- Mangun and Hillyard, 1991.Mangun GR, Hillyard SA. Modulations of sensory-evoked brain potentials indicate changes in perceptual processing during visual-spatial priming. J Exp Psychol Hum Percept Perform. 1991;17:1057–1074. doi: 10.1037//0096-1523.17.4.1057. [DOI] [PubMed] [Google Scholar]
- Martinez et al., 1999.Martinez A, Anllo-Vento L, Sereno MI, Frank LR, Buxton RB, Dubowitz DJ, Wong EC, Hinrichs H, Heinze HJ, Hillyard SA. Involvement of striate and extrastriate visual cortical areas in spatial attention. Nat Neurosci. 1999;2:364–369. doi: 10.1038/7274. [DOI] [PubMed] [Google Scholar]
- McAdams and Maunsell, 1999.McAdams CJ, Maunsell JH. Effects of attention on the reliability of individual neurons in monkey visual cortex. Neuron. 1999;23:765–773. doi: 10.1016/s0896-6273(01)80034-9. [DOI] [PubMed] [Google Scholar]
- Moore et al., 2003.Moore T, Armstrong KM, Fallah M. Visuomotor origins of covert spatial attention. Neuron. 2003;40:671–683. doi: 10.1016/s0896-6273(03)00716-5. [DOI] [PubMed] [Google Scholar]
- Moosmann et al., 2003.Moosmann M, Ritter P, Krastel I, Brink A, Thees S, Blankenburg F, Taskin B, Obrig H, Villringer A. Correlates of alpha rhythm in functional magnetic resonance imaging and near infrared spectroscopy. NeuroImage. 2003;20:145–158. doi: 10.1016/s1053-8119(03)00344-6. [DOI] [PubMed] [Google Scholar]
- Oldfield, 1971.Oldfield RC. The assessment and analysis of handedness: the Edinburgh inventory. Neuropsychologia. 1971;9:97–113. doi: 10.1016/0028-3932(71)90067-4. [DOI] [PubMed] [Google Scholar]
- Pfurtscheller, 2001.Pfurtscheller G. Functional brain imaging based on ERD/ERS. Vision Res. 2001;41:1257–1260. doi: 10.1016/s0042-6989(00)00235-2. [DOI] [PubMed] [Google Scholar]
- Pfurtscheller et al., 1994.Pfurtscheller G, Neuper C, Mohl W. Event-related desynchronization (ERD) during visual processing. Int J Psychophysiol. 1994;16:147–153. doi: 10.1016/0167-8760(89)90041-x. [DOI] [PubMed] [Google Scholar]
- Pfurtscheller and Lopes da Silva, 1999.Pfurtscheller G, Lopes da Silva FH. Event-related EEG/MEG synchronization and desynchronization: basic principles. Clin Neurophysiol. 1999;110:1842–1857. doi: 10.1016/s1388-2457(99)00141-8. [DOI] [PubMed] [Google Scholar]
- Posner, 1980.Posner MI. Orienting of attention. Q J Exp Psychol. 1980;32:3–25. doi: 10.1080/00335558008248231. [DOI] [PubMed] [Google Scholar]
- Posner et al., 1980.Posner MI, Snyder CR, Davidson BJ. Attention and the detection of signals. J Exp Psychol. 1980;109:160–174. [PubMed] [Google Scholar]
- Ress et al., 2000.Ress D, Backus BT, Heeger DJ. Activity in primary visual cortex predicts performance in a visual detection task. Nat Neurosci. 2000;3:940–955. doi: 10.1038/78856. [DOI] [PubMed] [Google Scholar]
- Reynolds et al., 2000.Reynolds JH, Pasternak T, Desimone R. Attention increases sensitivity of V4 neurons. Neuron. 2000;26:703–714. doi: 10.1016/s0896-6273(00)81206-4. [DOI] [PubMed] [Google Scholar]
- Salmelin and Hari, 1994.Salmelin R, Hari R. Characterization of spontaneous MEG rhythms in healthy adults. Electroencephalogr Clin Neurophysiol. 1994;91:237–248. doi: 10.1016/0013-4694(94)90187-2. [DOI] [PubMed] [Google Scholar]
- Sauseng et al., 2005.Sauseng P, Klimesch W, Stadler W, Schabus M, Doppelmayr M, Hanslmayr S, Gruber WR, Birbaumer N. A shift of visual spatial attention is selectively associated with human EEG alpha activity. Eur J Neurosci. 2005;22:2917–2926. doi: 10.1111/j.1460-9568.2005.04482.x. [DOI] [PubMed] [Google Scholar]
- Somers et al., 1999.Somers DC, Dale AM, Seiffert AE, Tootell RB. Functional MRI reveals spatially specific attentional modulation in human primary visual cortex. Proc Natl Acad Sci USA. 1999;96:1663–1668. doi: 10.1073/pnas.96.4.1663. [DOI] [PMC free article] [PubMed] [Google Scholar]
- Thut et al., 2005.Thut G, Nietzel A, Pascual-Leone A. Dorsal posterior parietal rTMS affects voluntary orienting of visuospatial attention. Cereb Cortex. 2005;15:628–638. doi: 10.1093/cercor/bhh164. [DOI] [PubMed] [Google Scholar]
- Vanni et al., 1997.Vanni S, Revonsuo A, Hari R. Modulation of the parieto-occipital α rhythm during object detection. J Neurosci. 1997;17:7141–7147. doi: 10.1523/JNEUROSCI.17-18-07141.1997. [DOI] [PMC free article] [PubMed] [Google Scholar]
- Worden et al., 2000.Worden MS, Foxe JJ, Wang N, Simpson GV. Anticipatory biasing of visuospatial attention indexed by retinotopically specific α-band electroencephalography increases over occipital cortex. J Neurosci. 2000;20:1–6. doi: 10.1523/JNEUROSCI.20-06-j0002.2000. [DOI] [PMC free article] [PubMed] [Google Scholar]
- Yamagishi et al., 2003.Yamagishi N, Callan DE, Goda N, Anderson SJ, Yoshida Y, Kawato M. Attentional modulation of oscillatory activity in human visual cortex. NeuroImage. 2003;20:98–113. doi: 10.1016/s1053-8119(03)00341-0. [DOI] [PubMed] [Google Scholar]