

Abstract
Type I vestibular hair cells have large K+ currents that, like neuronal M currents, activate negative to resting potential and are modulatable. In rodents, these currents are acquired postnatally. In perforated-patch recordings from rat utricular hair cells, immature hair cells [younger than postnatal day 7 (P7)] had a steady-state K+ conductance (g−30) with a half-activation voltage (V1/2) of −30 mV. The size and activation range did not change in maturing type II cells, but, by P16, type I cells had added a K conductance that was on average fourfold larger and activated much more negatively. This conductance may comprise two components: g−60 (V1/2 of −60 mV) and g−80 (V1/2 of −80 mV). g−80 washed out during ruptured patch recordings and was blocked by a protein kinase inhibitor.
M currents can include contributions from KCNQ and ether-a-go-go-related (erg) channels. KCNQ and erg channel blockers both affected the K+ currents of type I cells, with KCNQ blockers being more potent at younger than P7 and erg blockers more potent at older than P16. Single-cell reverse transcription-PCR and immunocytochemistry showed expression of KCNQ and erg subunits. We propose that KCNQ channels contribute to g−30 and g−60 and erg subunits contribute to g−80.
Type I hair cells are contacted by calyceal afferent endings. Recordings from dissociated calyces and afferent endings revealed large K+ conductances, including a KCNQ conductance. Calyx endings were strongly labeled by KCNQ4 and erg1 antisera. Thus, both hair cells and calyx endings have large M-like K+ conductances with the potential to control the gain of transmission.
Keywords: vestibular, KCNQ channels, erg channels, development, hair cells, M current
Introduction
Amniote vestibular epithelia have two hair cell types that are contacted by different kinds of afferent terminal. Primary afferents form bouton endings on type II hair cells opposite presynaptic ribbons. Type I hair cells are contacted by a cup-shaped, continuous, calyx terminal that encloses much of the basolateral membrane. The two hair cell types also differ in their voltage-gated conductances, most strikingly in the properties of outwardly rectifying K channels. In type II hair cells, the channels activate positive to resting potential. Type I cells, in contrast, express a high density of K channels with a very negative activation range that overlaps resting potential (Correia and Lang, 1990; Rennie and Correia, 1994; Ricci et al., 1996; Rüsch and Eatock, 1996; Masetto and Correia, 1997; Chen and Eatock, 2000). As a consequence, type I cells have input resistances (Rin, 10–100 MΩ) far below those of type II cells (>300 MΩ). The negatively activating channels have been described as a single type contributing to a conductance called gKI (Rennie and Correia, 1994) or gK,L (Eatock et al., 1994). In the mouse utricular macula, gK,L is acquired by type I cells during the period from shortly before birth through the first postnatal week (Rüsch et al., 1998; Géléoc et al., 2004), at the same time as calyceal synapses are forming.
Kharkovets et al. (2000) proposed that gK,L channels include KCNQ4 subunits from the KCNQ family of voltage-gated K channels. Several observations support this proposal. First, M channels, which resemble gK,L in being activated at resting potential and sensitive to second messengers (Suh and Hille, 2002; Gamper and Shapiro, 2003; Gamper et al., 2003), include KCNQ channels (Wang et al., 1998; Shah et al., 2002). Second, KCNQ4 antibody labels type I hair cells and calyces in mouse vestibular organs, beginning in the first postnatal week (Kharkovets et al., 2000), the same time as gK,L is acquired in the mouse utricle (Rüsch et al., 1998; Géléoc et al., 2004). Third, a negatively activating conductance in cochlear hair cells (gK,n) (Housley and Ashmore, 1992) is a KCNQ4 conductance (Marcotti and Kros, 1999; Oliver et al., 2003). Fourth, in a preliminary report, immature mouse utricular epithelia transfected with a dominant-negative mutation of KCNQ4 failed to express gK,L (Holt et al., 2004).
gK,L and gK,n differ in key properties, however, including voltage dependence, kinetics, and sensitivity to K channel blockers (Rennie et al., 2001; Wong et al., 2004). These discrepancies, plus evidence that neuronal M currents may flow through a mix of KCNQ and ether-a-go-go-related (erg) K channels (Meves et al., 1999; Selyanko et al., 1999; Saganich et al., 2001), led us to investigate the possible contributions of erg subunits. We report biophysical, pharmacological, reverse transcription (RT)-PCR and immunocytochemical evidence that erg subunits contribute to gK,L. We also report evidence for KCNQ and erg conductances in calyx endings. These large modulatable conductances can influence the pathways for receptor current flow in the epithelium.
Materials and Methods
Preparation
Isolation of hair cells.
All procedures for handling animals were approved by institutional and animal care review committees. Chemicals and reagents are from Sigma-Aldrich (St. Louis, MO) unless otherwise noted. Vestibular hair cells were isolated as described previously (Chen and Eatock, 2000). Briefly, rats [Long–Evans; postnatal day 2 (P2) to P26; P0 is date of birth] were anesthetized with sodium pentobarbital (Nembutal, 50 mg/kg, i.p.) and decapitated. The otic capsule was opened medially in chilled, oxygenated external solution (see below) to expose the utricle. The temporal bone was transferred to external solution containing protease XXVII or XXIV (50 μg/ml) for 10 min at room temperature to loosen the bonds between hair bundles and the overlying otolithic membrane. The otolithic membrane was gently lifted off, and the utricle was excised into external solution containing crude papain (500 μg/ml) and l-cysteine (300 μg/ml) for 40–60 min at 37°C. The utricle was then transferred into external solution containing 500 μg/ml bovine serum albumin for 10 min at room temperature and finally into a recording chamber filled with external solution. The sensory epithelium (macula) was brushed with a fine probe to disperse the hair cells onto the glass floor of the chamber. They were viewed at 600× with Nomarski optics on an inverted microscope.
Cell identification.
As described for rat crista cells by Chen and Eatock (2000), cell shape was used to classify hair cells as type I or type II. Type I cells begin to have necks in the first postnatal week; for an example, see the cell denoted by a white arrowhead in Figure 11A at postnatal day 6.
Figure 11.

Staining with antisera against KCNQ subunits and against herg and erg1 showed changes in both hair cell and afferent immunoreactivity with development. Sections of utricular maculae at P0, P4–P8, and P21 were viewed with confocal microscopy. Each row shows results with a different antiserum; age increases from left to right. Each result is shown as a pair: in the top of each pair is the red label of the ion channel antiserum, and in the bottom, the green calretinin label (Cal) is shown in combination with the ion channel antiserum. Scale bar in top left (10 μm) applies to all panels. White symbols in each panel point to examples of the different cell types or staining patterns. A, KCNQ3-like immunoreactivity was present in hair cells at all ages (filled triangles) and not in calyceal endings (open arrows, P6 and P21). B, KCNQ4-like immunoreactivity was present in hair cells at P0 and P6 (triangles) and in calyceal endings (arrows) from P6 to P21. At P21, type I hair cells showed intense bands cupping their bases (arrows) but no cytoplasmic staining, whereas a few type II hair cells had cytoplasmic staining (filled triangles). Cups were biggest in the striola (s). C, KCNQ5-like immunoreactivity was present in hair cells (triangles) and supporting cells (open triangles) at all ages and in calyceal afferents (arrows). D, herg-like immunoreactivity: punctate staining of hair cells at P0 became more uniform with age (triangles). From P4 on, label was also seen on maturing calyces (arrows; see growing cups around green hair cells in the double-labeled panel at P4 and more extensive staining at P21). By P21, staining was especially strong in the extrastriola (e). E, erg1-like immunoreactivity: staining appeared more concentrated on afferent endings than on hair cells. Even at P0, staining formed cups at the bases of hair cells, which do not overlap with the cytoplasmic calretinin stain of the hair cells. This putative afferent staining increased in intensity with age. There was also some cytoplasmic stain in hair cells, especially at P21 (triangle points to a stained type II cell).
External solution.
The external solution used for all procedures (dissection, dissociation, and standard recording) contained the following (in mm): 144 NaCl, 5.8 KCl, 1.3 CaCl2, 0.9 MgCl2, 10 HEPES, and 5.6 d-glucose. The solution was supplemented with vitamins and amino acids as in Eagle's Minimal Essential Medium. pH and osmolality were adjusted to 7.4 and 320 ± 5 mmol/kg.
Electrophysiology
All recordings were done at room temperature (22–25°C). In almost all experiments, we recorded whole-cell currents with the perforated-patch method (Horn and Marty, 1988; Rae et al., 1991). The pipette solution contained 240 mg/ml amphotericin B and the following (in mm): 135 K2SO4, 35 KCl, 5 MgSO4, 0.1 CaCl2, 5 HEPES, and 5 EGTA. For both, pH was adjusted to 7.4 by adding 15 mm KOH. Osmolality was 280 ± 5 mmol/kg. Recording pipettes were pulled from borosilicate glass and heat polished to a resistance of 1–3.5 MΩ in our standard solutions. A junction potential of 9.1 mV [calculated with JPCalc (Barry, 1994) assuming an intracellular Cl− concentration of 35 mm] was subtracted off-line from command voltages. Donnan potentials may also arise across the perforated patch as a result of differences between the concentrations of impermeant ions in the endogenous solution of the hair cell and the pipette solution. Such potentials are likely to be small based on other experiments on delayed rectifier currents in type II hair cells: half-maximal activation voltages were −29 ± 2.0 mV (mean ±SEM; n = 8 cells) in the ruptured-patch mode and −30 ± 1.0 mV (n = 20 cells) in the perforated-patch mode (K. M. Hurley and R. A. Eatock, unpublished observations). In two experiments (see Figs. 4, 15), we made ruptured-patch recordings with the following pipette solution (in mm): 135 KCl, 3.5 MgCl2, 5 Na2ATP, 5 HEPES, 5 EGTA, 0.1 Na-cAMP, and 0.1 Li-GTP, pH 7.4 (280 ± 5 mmol/kg).
Figure 4.

A very negative component of the total K conductance washed out during ruptured-patch recordings, leaving a more positive component. A, P14 type I cell. Initial activation curve, V1/2, S, and gmax of −70 mV, 7.4 mV, 76 nS. At 10 min later, the curve (not shown) was best fit with the sum of two Boltzmann functions (V1 of −82 mV, S1 of 2 mV; V2 of −58 mV; S2 of 6 mV). At 22 min, the activation curve was well fit by a single more positive Boltzmann function: V1/2, S, gmax of −56 mV, 7 mV, 57 nS. This component was stable for the rest of the recording. For the washed-out component (“difference”), V1/2, S, gmax were −80 mV, 5 mV, 47 nS, and the conductance turned over positive to −70 mV. B, Triangles, Time-dependent shift in V1/2 in 12 type I hair cells plotted against initial V1/2. Shifts were measured over intervals varying from 5 to 32 min. A linear regression of points with initial V1/2 values negative to −60 mV (line) had a slope of −1.1 mV/mV and an x-intercept of −67 mV; for more positive initial V1/2 values, no systematic shift was seen. The influence of initial V1/2 is shown by the two cells marked by black triangles. For each of these cells, the time between recordings was 5 min, but only the cell with the more negative activation curve experienced a shift. No shifts were seen for type II hair cells (open circles). C, In the perforated-patch configuration, the activation range for both type I and type II cells was stable. V1/2 for type I cells varied widely because data from young cells were included (see Fig. 2A).
Figure 15.

Voltage-gated currents in a calyceal afferent stalk included a Na+ current and a probable Ca2+-dependent K+ current. A, The P26 hair cell, calyx, and afferent stalk before recording. After we formed a tight seal on the stalk, it detached from the calyx (dotted line). We recorded in ruptured-patch mode with standard solutions. B, Currents recorded 1 min after breakthrough, 9 min after breakthrough, and the difference. By 9 min, the outward current was smaller (washout) and the fast inward current at the offset of very negative steps (gNa) was larger (wash-in). Bottom, Steady-state I–V relationships from traces in B and other traces. At 1 min, the current declined at high depolarizations. By 9 min, the current was smaller and did not turn over. C, The voltage dependence of inactivation of gNa. Top, Fast transient inward currents (INa) activated by depolarization to −34 mV decreased as prepulses became less hyperpolarized (middle). Bottom, Inactivation curve generated from the data in the top. Boltzmann parameters are as follows: V1/2 of −82 mV, S of 5.7 mV, gmax of 6.4 nS.
Currents were recorded with a patch-clamp amplifier (Axopatch 200A or 200B; Molecular Devices, Sunnyvale, CA). Series resistance (RS) was estimated and compensated 60–90% with the intrinsic circuitry of the amplifier. In a sample of 24 cells, the mean RS after electronic compensation was 10 ± 0.6 MΩ (range, 4.5–16.5 MΩ). Currents were filtered with an eight-pole low-pass Bessel filter with a corner frequency of 2 kHz and sampled at more than twice the filter frequency with a Digidata 1200 board (Molecular Devices), controlled by Clampex software (versions 7–8.2; Molecular Devices).
Pharmacology.
Control and experimental solutions were applied to individual cells via a local perfusion system driven by a multichannel pump. Flow was monitored by placing 0.8 μm latex beads in the perfusate. Stock solutions of the KCNQ channel blockers linopirdine (RPI, Mt. Prospect, IL; and Sigma-Aldrich) and XE991 [10,10-bis(4-pyridinylmethyl)-9(10H)-anthracenone dihydrochloride] (gift from DuPont, Wilmington, DE) were prepared at 10 mm in 0.1 m HCl. Stock solutions for the erg channel blockers WAY-123,398 [N-methyl-N-(2-(methyl(1-methyl-1H-benzimidazol-2-yl)-amino)ethyl)-4-((methylsulfonyl)amino)benzenesulfonamide] (gift from Wyeth-Ayerst, Monmouth Junction, NJ) and E-4031 (N-[4-[1-[2-(6-methylpyridin-2-yl)ethyl]piperidine-4-carbonyl]phenyl]methanesulfonamide) (Alomone Labs, Jerusalem, Israel) were prepared fresh daily at 10 mm in 0.1 m HCl (WAY-123,398) or in external solution (E-4031). Just before experiments, stocks were diluted appropriately in external solution (usually 1000-fold, to make 10 μm), and the pH of the drug-containing (test) solution was checked.
Analysis.
Analyses and fits were done with Origin software (versions 6.1–7; OriginLab Software, Northampton, MA), which uses a Levenberg–Marquardt least-squares fitting algorithm. Voltages in activation curves were corrected off-line for errors introduced by uncompensated series resistance. Results are shown as means ± SEM. Results were compared with the two-tailed Student's t test or two-way ANOVA as implemented by Origin software.
The voltage dependence of steady-state activation was expressed as conductance–voltage (activation) curves. The curves were generated by delivering multiple voltage steps and measuring peak tail current at step offset. The tail potential was usually −39 mV to match the reversal potential of h-current, which is present in these hair cells (Rüsch et al., 1998), and prevent h-current contamination of the activation curve. Sigmoidal curves were fit with the following Boltzmann function:
 |
where I(V) is current at voltage V, Imin and Imax are minimum and maximum currents, V1/2 is voltage corresponding to half-maximal activation, and S is the voltage corresponding to an e-fold increase in I(V). In some cells, activation curves had two sigmoidal components and were fit with a sum of Boltzmann functions:
 |
V1 and V2 are the V1/2 values, S1 and S2 are S values, and I1 and I2 correspond to the maximum currents for each Boltzmann component. Imax values were converted to conductances, gmax, by dividing by the driving force, estimated as the difference between V and the equilibrium potential for K+ (−89 mV).
Activation kinetics were characterized by a delay followed by slower activation and were fit with the following equation to allow comparison with previous estimates of activation time constants (Rüsch and Eatock, 1996):
 |
RT-PCR
Utricular epithelia and vestibular ganglia.
Rat utricles were prepared as described above from animals on P1, P8, P14, and P21. We used protease XXIV or XXVII, as described, to remove the otolithic membrane and thermolysin to free the epithelium from underlying connective tissue (protease X, 500 μg/ml in external solution; at 37°C for 60 min) (Saffer et al., 1996). The epithelial tissue that we collected contained hair cells, support cells, and nerve endings. Vestibular ganglia (both superior and inferior divisions) were collected from the same animals. We spun the tissues down, removed excess fluid, rapidly froze the tissues on dry ice, mechanically disrupted them with an RNase-free mortar and pestle, and lysed them with guanidine isothiocyanate-containing buffer. We homogenized the lysate with a QiaShredder column (Qiagen, Valencia, CA) and spun it down. We applied the supernatant to a silica-gel membrane column (RNAeasy; Qiagen) and added RNase-Free DNase I (Qiagen) at room temperature for 30 min. We washed DNase I off the column and eluted the purified RNA with nuclease-free water.
We did RT and amplification by PCR in a PTC-100 thermocycler (MJ Research, Las Vegas, NV). The utricular mRNA was reverse transcribed with oligo-dT primers and the Moloney murine leukemia virus reverse transcriptase (Advantage RT for PCR kit; Clontech, Mountain View, CA) or Superscript III reverse transcriptase (First-Strand Synthesis System; Invitrogen, Carlsbad, CA). Using the resulting cDNA as a template, we amplified DNA sequences for specific K channel subunits with the primer sets given in Table 1. We combined 20 pmol of each primer, 200 μmol each of dNTPs, and 1 U of TAQ polymerase in 50 μl of reaction mixture and ran the following PCR program: 94°C for 30 s; 40 cycles of 94°C for 30 s, annealing temperature for 40 s (Table 1), 72°C for 30 s; and 72°C for 10 min. The amplified products were separated on a gel of 2% agarose, stained with ethidium bromide, and visualized on a UV transilluminator. To confirm PCR product identity, we excised bands from the gel, extracted the DNA with a spin column (Qiaquick; Qiagen), and sequenced the DNA (SeqWright, Houston, TX).
Table 1.
Primers for RT-PCR
| Primer set | Sequence | TA°C | Nucleotides | Predicted size | Accession number | Reference |
|---|---|---|---|---|---|---|
| KCNQ3 | S-5′CAGCAAAGAACTCATCACCG3′ | 60 | 746–906 | 160 | AF091247 | Shah et al., 2002 |
| A-5′ ATGGTGGCCAGTGTGATCAG3′ | ||||||
| KCNQ4 | S-5′ CCCTCCAAGCAGCATCTG3′ | 55 | 40–420 | 380 | AF249748 | Shah et al., 2002 |
| A-5′ TTGATTCGTCCCAGCATGTCCA3′ | ||||||
| KCNQ5 | S-5′ GGAACCCAGCTGCCAACCTCAT3′ | 60 | 995–1101 | 106 | AF202977 | Shah et al., 2002 |
| A-5′ CTTTCTTGGTAGGGCTGCAG3′ | ||||||
| erg1a | S-5′TCCAGCGGCTGTACTCGGGC3′ | 60 | 1994–2591 | 597 | Z96106 | Emmi et al., 2000 |
| A-5′TAGACCAAAAGTGGTCTGAGAACTC3′ | ||||||
| erg2a | S-5′AGGACCTGGATTGCTGGCATC3′ | 60 | 2356–2756 | 400 | AF016192 | Emmi et al., 2000 |
| A-5′AGGTGAGGCTAGAGGTGACAGG3′ | ||||||
| erg2a | S-5′TCTCCAGTCAACACCCCGAC 3′ | 60 | 2193–2851 | 658 | AF016192 | Papa et al., 2003 |
| A-5′CTCTGGAACTCTAGCTGCTT 3′ | ||||||
| erg3a | S-5′CAGAGAGCTGCCTGGGGCATC3′ | 60 | 3216–3644 | 428 | AF016191 | Emmi et al., 2000 |
| A-5′GTCAAGCTCTGACGATGCATC3′ | ||||||
| Degenerate erg | S-5′TACTGCAA(C/T)GA(C/T)GCTTCT3′ | 55 | ||||
| A-5′ GAGCCAAT(C/G)A(G/A)CATGAC(C/T)GT3′ | ||||||
| erg1 | S-5′GTCACCCAGGTCCTGTCCTT3′ | 58 | 1125–1902 | 777 | Z96106 | |
| A-′GGAGAAGATCTTTTCTGAGTTGGTGTTG3′ | ||||||
| erg2 | S-5′TCACAGCAGGCCGAGTG3′ | 56 | 509–1137 | 628 | AF016192 | |
| A-5′GTAACCCAATCAAGGTGGTGG3′ | ||||||
| erg3 | S-5′GAGAGAGTCAACCCAATATTGCC3′ | 56 | 606–1091 | 485 | AF016191 | |
| A-5′GACATTTCGACCATTGTCTTCAC3′ |
aPrimers used on utricular epithelium and ganglion. Other primers were used for single cells.
TA, Annealing temperature; A, antisense; S, sense.
We controlled for genomic DNA contamination in several ways. (1) For KCNQ subunits, primers were designed to cross intron-exon boundaries based on human KCNQ genes (Shah et al., 2002) so that genomic DNA would have higher molecular weight than the predicted PCR product. No such bands were observed. (2) The protocol that we used to isolate RNA minimizes contamination because genomic DNA is sheared during tissue homogenization. In addition, DNA binds tightly to the silica membranes of the RNeasy columns, eliminating most DNA from the sample. Finally, we digested DNA on the column with RNase-free DNase I for 30 min before eluting the RNA. (3) For each primer set, a set of negative controls was prepared, substituting water for the reverse transcriptase. In these cases, only genomic DNA would be available as a template for amplification. No bands were observed on agarose gels with any primer set tested in these control samples (data not shown).
Single-cell RT-PCR.
We collected 58 individual type I hair cells (14 at P1 and 44 at P8) and 12 type II hair cells (P8) from intact epithelia, prepared as described by Vollrath and Eatock (2003). We also collected 96 isolated type I hair cells (30 at P1, 44 at P8, and 22 at P14) and seven type II hair cells (P8), prepared as described for the electrophysiological experiments described above. We collected each cell into a separate glass micropipette that had been cleaned, treated with RNaseZAP (Ambion, Austin, TX), rinsed with nuclease-free water, and dried overnight. We processed each cell for RT-PCR separately. Each cell was probed for three subunits: either KCNQ3, KCNQ4, and KCNQ5 or erg1, erg2, and erg3. Utricular tissue and water were run as positive and negative controls, respectively, for each set of hair cells, in which a set constitutes the hair cells collected on one day and probed with either KCNQ or erg primers.
The reverse transcription procedure was similar to that described above for utricular maculae with Superscript III as the reverse transcriptase. To amplify KCNQ products, we used primers for KCNQ3, KCNQ4, and KCNQ5 subunits designed by Shah et al. (2002) and followed a modified version of their two-step protocol. (1) We combined 20 pmol of each primer (six total) with dNTPs and TAQ polymerase and ran the following protocol: 94°C for 3 min; 35 cycles of 94°C for 30 s, 55°C for 30 s, 72°C for 40 s; 72°C for 10 min. (2) We used 10 μl of the initial reaction as template for the second set of reactions, this time using primers for just one subunit at a time and the same PCR protocol as just described. We performed the same PCR reactions on cDNA from whole utricular maculae to ensure that simultaneous use of primer sets in the first amplification round did not interfere with subunit detection. Because we got fewer positive results for KCNQ4 than for KCNQ3 and KCNQ5, we also tried a nested primer set from Oliver et al. (2003). This gave similar results to the Shah et al. (2002) primer set, and the data from both primer sets have been pooled.
To amplify PCR products corresponding to erg subunits, we used a nested PCR strategy. For the initial amplification step, we designed a degenerate, pan-erg primer (Table 1, Degenerate erg) and the following protocol: 94°C for 1 min; 40 cycles of 94°C for 30 s, 55°C for 30 s, 72°C for 40 s; 72°C for 10 min. We used 10 μl of initial reaction product as template for subsequent amplification with primers specific for erg1, erg2, or erg3; all primer sets spanned introns and exons (Table 1). The protocol was as follows: 94°C for 1 min; 40 cycles of 94°C for 30 s, primer-specific annealing temperature for 30 s, 72°C for 40 s; 72°C for 10 min. Bands were resolved on 7.5% acrylamide gels, stained with ethidium bromide, and visualized on a UV transilluminator. Bands corresponding to each subunit were excised, and DNA was extracted overnight, precipitated with ethanol, and sequenced to confirm identity (SeqWright).
Immunohistochemistry
All primary K channel antisera were produced in rabbits and affinity purified. Unless otherwise specified, all primary and secondary antisera were bought from Chemicon (Temecula, CA). For each antiserum, we did control staining without the primary antiserum (data not shown).
KCNQ antisera.
For KCNQ4, we used antiserum generated with the peptide sequence CSISRSVSTNMD-COOH from the C terminus (gift from B. Kachar, National Institutes of Health, Bethesda, MD). For KCNQ3, we used antiserum generated with a peptide corresponding to residues 668–686 of rat KCNQ3 (AB5483; Chemicon). For KCNQ5, we used antiserum generated against a fusion protein corresponding to amino acids M1–R88 (AB5599; Chemicon) (Yus-Najera et al., 2003).
herg and erg1 antisera.
We used two antisera: (1) anti-human erg (herg) (AB5908; Chemicon), for which the immunogen was a glutathione S-transferase fusion protein corresponding to amino acids 1106–1159 of herg, a region that is strongly homologous with rat erg1 (50 of 54 amino acids) and ∼50% homologous with erg2 (22 of 54) and erg3 (21 of 54); (2) anti-erg1 (AB5222; Chemicon), made against a purified peptide from rat erg1 (amino acids 1121–1137). This shorter peptide avoids the region of high homology with erg2 and erg3 located closer to the C terminus of the protein.
Calretinin antiserum.
We used goat anti-calretinin polyclonal antibody (AB1550; Chemicon) as a marker of immature hair cells (P0–P6) (Zheng and Gao, 1997), type II cells (P8–P21) (Sans et al., 2001; Desai et al., 2005), and calyx afferents (P4–P21) (Desmadryl and Dechesne, 1992; Leonard and Kevetter, 2002; Desai et al., 2005).
Tissue preparation.
Long–Evans rats of various ages (P0–P21) were deeply anesthetized with Nembutal (80 mg/kg) and then perfused transcardially with 10–100 ml of physiological saline containing heparin (2000 IU), followed by 2 ml/g body weight of an aldehyde fixative [4% paraformaldehyde, 1% acrolein, 1% picric acid, and 5% sucrose in 0.1 m phosphate buffer (PB), pH 7.4]. Vestibular epithelia and ganglia were dissected in PB. Otoconia were dissolved with undiluted Cal-Ex (Fisher Scientific, Pittsburgh, PA) for 1–10 min. Background fluorescence was reduced by incubating the tissues in 1% aqueous solution of sodium borohydride for 10 min.
Confocal microscopy.
Tissues were cryoprotected in 30% sucrose–PB before sectioning on a sliding microtome (35 μm frozen sections). Immunocytochemistry was performed on free-floating sections permeabilized with Triton X-100 in a blocking solution consisting of 0.5% fish gelatin and 1% BSA in PBS. Samples of vestibular tissues were incubated with Triton X-100 at conditions that varied with postnatal age: P0–P1, 0.3% overnight at 4°C; P4, 0.5% for 2 h at room temperature; P6–P8, 2% for 1 h at room temperature; and P12–P21, 4% for 1 h at room temperature. Samples were then incubated in a mixture of two primary antisera diluted in the blocking solution: goat anti-calretinin (1:200) and antisera against KCNQ3, KCNQ4, or KCNQ5 or herg or erg1 (1:200) for 2 d at 4°C with 0.1, 0.3, and 0.5% Triton X-100 for P0–P1, P4, and P6–P21 sections, respectively. Specific labeling was revealed with a mixture of two secondary antibodies: fluorescein-conjugated donkey anti-goat and rhodamine-conjugated donkey anti-rabbit (1:200 in the blocking solution). Sections were rinsed with PBS between and after incubations and mounted on slides in Mowiol (Calbiochem, Darmstadt, Germany). The sections were examined at an optical section thickness of 0.4–1 μm, depending on magnification, on a laser scanning confocal microscope (LSM 510 META; Zeiss, Oberköchen, Germany). Final image processing was done with Adobe Photoshop CS2 version 9.0 software (Adobe Systems, San Jose, CA).
Electron microscopy.
Organs were embedded in chilled gelatin, and 35 μm sections were cut with a Vibratome 2000 (Technical Products International, St. Louis, MO) into 0.1 m PBS. The sections were warmed in a 37°C oven for 5 min to dissolve the gelatin. We use a blocking solution consisting of 0.5% fish gelatin and 1% BSA for 30 min. Sections were incubated in primary antibody [1:50; rabbit anti-herg (AB5908; Chemicon) or rabbit anti-KCNQ4] for 72 h and secondary antibody (1:50; colloidal gold-labeled goat anti-rabbit IgG; Amersham Biosciences, Piscataway, NJ) for 24 h. Colloidal gold staining was silver enhanced (4–8 min; IntenSE M kit; Amersham Biosciences). Sections were dehydrated in a graded series of alcohols and propylene oxide, embedded in Araldite (Fluka Durcupan, Ronkonkoma, NY) on glass slides with plastic coverslips, and polymerized at 55°C for 48 h. The section of interest was cut free from the slide, glued on top of a blank Araldite block, sectioned with a diamond knife (Delaware Diamond Knives, Wilmington, DE), and stained with uranyl acetate and lead citrate. Sections were examined and photographed with a Jeol (Peabody, MA) 1220X transmission electron microscope.
Results
Changes in K+ conductances during the first postnatal month
Because the conductances of type I hair cells change with development in other species (Rüsch et al., 1998; Masetto et al., 2000; Géléoc et al., 2004), we began by characterizing the changes in rat utricular type I hair cells during the first postnatal month. Figure 1 illustrates currents recorded in perforated-patch mode from type I hair cells at selected times from P1 to P18. During the first postnatal week, all hair cells expressed a small delayed rectifier conductance that activated positive to the holding potential, VH, of −69 mV (Fig. 1 A). During the second week, maximal currents in type I hair cells increased dramatically, and an increasing fraction of the current was activated at −69 mV (Fig. 1A).
Figure 1.

Changes in outwardly rectifying K conductances of rat utricular hair cells during the first postnatal month. A, Currents evoked by voltage protocols (bottom) from type I hair cells at the postnatal ages shown. VH of −69 mV. Potential at step offset (tail potential) of −39 mV. Maximal outward currents and onset currents (at the step from VH; see arrow in P18 panel) increased with age. Voltage protocols overlap but are not identical across cells because they were designed to cover most of the voltage activation range for each cell (see B). Voltage commands (in millivolts): P1, −69, −49, −29, −9, 11; P7 and P9, −129, −69, −49, −29, −9; and P18, −129, −69, −59, −49. The trace at −49 mV in each panel has been bolded to allow comparison across cells. B, C, Normalized and non-normalized activation curves for the cells in A, fit with single Boltzmann functions (Eq. 1). For the cells P7–P18, the curves were generated from tail currents after 3 s voltage steps (illustrated in Fig. 3). V1/2, S, and gmax values are as follows: P1, −29 mV, 6.0 mV, 5 nS; P7, −40 mV, 5.3 mV, 68 nS; P9, −62 mV, 6.6 mV, 83 nS; P18, −82 mV, 5.0 mV, 210 nS.
Steady-state activation curves were generated from tail currents after voltage steps that were 1.2–5 s long (see Fig. 3A,B) and fitted with the Boltzmann equation (Eq. 1). In Figure 1, we show normalized (B) and non-normalized (C) activation curves for the cells of A. These plots show that the increase in conductance at VH reflected both a negative shift in the activation range and an increase in maximal conductance.
Figure 3.

Heterogeneous whole-cell currents from type I cells in the third postnatal week are consistent with more than one negatively activating conductance. Currents from a P17 (A) and a P15 (B) cell. Scale bars in A apply to B. Traces on the right show tail currents on an expanded time scale (20 ms). C, Activation curves generated from tail currents (A, B, insets) and additional traces. Tail potentials, −59 mV (A) and −39 mV (B). The P15 cell (B) had a broader activation range that was better fit with the sum of two Boltzmann functions (Eq. 2) than with a single Boltzmann function (Eq. 1). Fit parameters are as follows: A (single Boltzmann function, shown), V1/2 of −87 mV, S of 5.3 mV; B (single Boltzmann function, not shown) V1/2 of −75 mV, S of 11.6 mV; B (double Boltzmann, shown), V1 of −83 mV, S1 of 6.0 mV, fractional amplitude (A1) of 0.65; V2 of −60 mV, S2 of 4.0 mV, A2 of 0.35.
Figure 2A–C plots the Boltzmann parameters for 118 cells as functions of postnatal age. At P < 7, the Boltzmann parameters for type I and type II hair cells were indistinguishable; mean pooled values were V1/2 = −31 ± 1.3 mV, S = 7.8 ± 0.69 mV, and gmax = 28 ± 4.9 nS (19 cells). Over the second week, the mean values changed significantly in type I, but not type II, cells. By P16, systematic changes with age plateaued. For 34 type I cells (15 < P < 26), mean values were V1/2 = −76 ± 2.1 mV, S = 5.6 ± 0.44 mV, and gmax = 124 ± 15.9 nS (p < 0.05 for all three comparisons with P < 7 data).
Figure 2.

Voltage activation parameters of K+ conductances in type I cells, but not type II cells, changed as a function of postnatal day. Data from 86 morphologically identified type I cells, 26 morphologically identified type II cells, and six unclassified cells from the first week. Type II and unclassified cells were pooled (black triangles). Boltzmann parameters V1/2 (A), S (B), and gmax at the tail potential of −39 mV (C) from single Boltzmann fits of activation curves generated from tail currents after 3 s protocols (as shown in Fig. 3). Legend in B applies to A and C also. Gray circles, Morphologically identified type I cells. Red circles and error bars, Mean ± SEM of type I data for each day. A, V1/2 versus age. Mean V1/2 for all 19 cells younger than P7, −31.8 ± 1.27 mV. Type II hair cells did not change systematically with age; mean V1/2 for type II cells at P > 6, −30 ± 1.3 mV (n = 26). V1/2 of type I hair cells got more negative throughout the second postnatal week, stabilizing after P15 (red circles indicate daily means) at a mean value of −76 ± 2.1 mV (n = 34). Gray grid lines mark off P7 and P15 and V1/2 values of −30, −60, and −80 mV, which may be the values for three K outward rectifiers (g−30, g−60, and g−80 mV) in type I cells, as discussed in Results. B, S versus age. Mean S for P < 7, 7.8 ± 0.69 mV (19 cells). Mean S for type II cells (P > 6), 7.4 ± 0.49 mV (26 cells). For P > 18, S values of type I cells settled down to 5.6 ± 0.41 mV (17 cells). C, gmax versus age. Mean gmax for P < 7, 28 ± 4.9 nS (19 cells). Mean gmax for type II cells older than P6, 19 ± 2.9 nS (26 cells). During the second week, the type I conductance began to grow, with some examples exceeding 200 nS; mean gmax for type I cells (P > 15), 124 ± 15.9 nS (34 cells).
After P18, activation curves were relatively narrow (S < 10 mV; mean, 5.6 ± 0.41 mV; 10 type I cells). Between P4 and P18, however, 11 (four type II, seven type I) hair cells had relatively broad activation curves (S > 10 mV) (Fig. 2B). We inspected these curves for indications of multiple conductances. The curves of all four type II cells and one young (P7) type I cell were well fit by a single Boltzmann function with V1/2 values between −22 and −26 mV. The activation curves of the six remaining cells, all type I, were better fit by a sum of two Boltzmann functions. Voltage-gated currents from one of these cells are shown in Figure 3B, and the activation curve is shown in Figure 3C. Double Boltzmann fits of the activation curves for four of the six cells yielded V1/2 values clustered around −60 and −80 mV; in the remaining two cells, one of the two midpoints was approximately −20 mV. Although not strong evidence in themselves for multiple conductances, these values are consistent with other evidence (below) for three K+ conductances (g−30, g−60, and g−80) with activation midpoints at approximately −20 to −40 mV, −60 mV, and −80 mV, respectively. We suggest that g−30 dominates in the first postnatal week, that g−60 and g−80 are added during the second week, and that g−80 dominates by the third week.
Isolation of a modulatable conductance
It has been noted previously that gK,L changes during ruptured-patch recordings (Rüsch and Eatock, 1996; Chen and Eatock, 2000), presumably reflecting washout of intracellular molecules or wash in of ingredients in the pipette solution. Figure 4 A illustrates the changes that we saw during ruptured-patch recordings from type I cells. Early after breaking through, the activation curve was well fit with a single Boltzmann function with a midpoint at −70 mV. After 22 min, the curve had shifted positively (V1/2 of −56 mV), and peak current was 18% smaller. The activation curve of the washed-out current had a V1/2 of −80 mV and S of 5.0 mV. The conductance reached a peak at −65 mV and declined at more positive potentials. This “turnover” of the steady-state activation curve is seen in erg currents, in which it reflects inactivation (Shi et al., 1997; Sturm et al., 2005). Ca2+-dependent K+ conductance–voltage curves also turn over, but this tends to occur at more positive potentials determined by the current–voltage relationship of Ca channels (Hille, 2001).
For 12 type I cells, the activation curve shifted positively only for those cells with initial V1/2 values negative to −65 mV (mean initial V1/2 of −80 ± 3.6 mV; eight cells) (Fig. 4B). Moreover, the shift was largest for the most negative initial V1/2 values (Fig. 4B). Net shifts were not seen for (1) ruptured-patch recordings from type I cells with initial V1/2 positive to −65 mV (Fig. 4B); (2) perforated-patch recordings from type I cells (Fig. 4C), and (3) ruptured- or perforated-patch recordings from type II cells (Fig. 4B,C). Thus, V1/2 shifted only during ruptured-patch recording from type I cells with initial V1/2 negative to −65 mV.
These data are consistent with washout causing either (1) a voltage shift and partial loss of a single conductance (Chen and Eatock, 2000) or (2) loss of a component with V1/2 at approximately −80 mV, unmasking a second component with V1/2 at approximately −60 mV. The latter explanation fits with evidence, already presented and below, for two negatively activating K+ conductances. It may also account for differences between our data and those of other studies, most of which have been performed using the ruptured-patch method (see Discussion).
What might be causing the washout? Changes in phosphorylation were an obvious candidate, especially given a report showing no negatively activating conductance when ATP is omitted from the pipette solution (Lennan et al., 1999). We applied a membrane-permeant, broad-spectrum protein kinase inhibitor [N-[2-(methylamino)ethyl]-5-isoquinolinesulfonamide [H8]; 15 μm; Calbiochem, San Diego, CA] during perforated-patch recording (Fig. 5). The effect resembled that seen during ruptured-patch recording: a positive shift in V1/2 (13 ± 1.7 mV; six type I cells from P7–P19) and a significant reduction in gmax (37 ± 12.9%) (Fig. 5B). The H8 effect was reversible (two cells) (Fig. 5A). The traces of H8-sensitive current recorded at high depolarizations crossed over traces at lower depolarizations (Fig. 5A). Both the turnover of the activation curve and the crossover of the currents are typical of heterologously expressed channels of the erg family (Nie et al., 2005; Sturm et al., 2005). Figure 5C shows a similar crossover in control currents recorded at unusually high voltages.
Figure 5.

A, The broad-spectrum protein kinase inhibitor H8 blocked the more negatively activating component of K+ current. Perforated-patch currents from a P15 type I hair cell. External application of 15 μm H8 reversibly blocked the conductance at the holding potential, gHP of −69 mV (arrows). The H8-sensitive (Control, H8) traces at large depolarizations crossed over those at smaller depolarizations, a pattern typical of erg channels (see C and Results). B, Activation curves from tail currents show that the H8-sensitive conductance was the most negative part of the total conductance and turned over at higher voltages, as seen in erg activation curves. V1/2, S, and gmax values from single Boltzmann fits: Control, −65 mV, 7.6 mV, 49 nS; H8, −51 mV, 7.7 mV, 35 nS; H8-sensitive, −70 mV, 5.9 mV, 28 nS. C, K+ current from a different type I cell; control solutions. The current evoked by a voltage command to +73 mV (black current and voltage traces) inactivates and crosses over current traces at lower depolarizations (gray traces), resembling erg currents.
The H8 effect on voltage dependence, like the washout effect, was specific to type I cells. In type II hair cells (n = 3; two at P10 and one at P20), H8 reduced gmax by almost half (19 ± 6.6 vs 10 ± 3.6 nS) but had no effect on mean V1/2 and S values (−34 ± 1.2 and 6.8 ± 1.57 mV in control vs −35 ± 2.5 and 5.4 ± 0.68 mV in H8).
The data are consistent with the following model for K conductance development in type I cells. Type I cells start out with g−30 and, over the second postnatal week, acquire more negatively activating channels of two varieties distinguished by voltage dependence and sensitivity to washout and H8. For the remainder of Results, we describe investigations into the molecular composition of these conductances.
Candidates for the two components of gK,L
We used pharmacology, RT-PCR, and immunocytochemistry to examine whether KCNQ or erg channel subunits contribute to the type I hair cell conductances. Some reasons for focusing on these two channel families were laid out in Introduction. In addition, the currents that washed out or were blocked by H8 bore some resemblance to erg currents.
Pharmacology
We applied agents that are reputedly KCNQ or erg specific in the first and third postnatal weeks, using concentrations that have been effective at separating KCNQ and erg conductances in neurons: 10 μm of the KCNQ blockers linopirdine and XE991 and of the erg blockers E-4031 or WAY-123,398 (Wang et al., 1998; Meves et al., 1999; Selyanko et al., 1999; Higashida et al., 2000; Brown et al., 2002). Figures 6 and 7 show examples of KCNQ and erg blocker effects, respectively, at different ages. Figure 8 summarizes blocker effects as a function of age.
Figure 6.

Effects of KCNQ channel blockers on the currents in type I cells at different ages. A, The KCNQ blocker linopirdine (10 μm) reversibly reduced gmax of the K current in a P6 type I cell by 43% without affecting V1/2 (V1/2, S, and gmax values: Control, −29 mV, 7.1 mV, 9.1 nS; Linopirdine-sensitive, −29 mV, 6.1 mV, 4.2 nS; Linopirdine-insensitive, −27 mV, 9.0 mV, 5.1 nS). B, The KCNQ blocker XE991 (10 μm) blocked most of the current in a P13 type I hair cell (control V1/2, S, gmax values, −58 mV, 8.8 mV, 47 nS). The residual current appears to be leak, in that the tail current activation curve was completely blocked. We do not show the activation curves because short voltage steps do not produce an accurate activation curve (Wong et al., 2004). C, In a P16 type I cell with a large negative conductance, linopirdine (10 μm) blocked 23% of the current evoked at the onset of steps from the holding potential, −69 mV (23% of gHP).
Figure 7.
Effects of erg channel blockers on the currents in type I cells at different ages. A, In a P2 cell, 10 μm E-4031 blocked gmax 32%, the largest effect seen in young cells. Bottom, Tail current activation curves for the data traces shown above and other traces from the same experiment that were omitted for clarity. V1/2, S, and gmax values are as follows: Control, −31 mV, 5.9 mV, 42 nS; E-4031-sensitive, −34 mV, 6.1 mV, 12 nS; E-4031-insensitive, −27 mV, 7.3 mV, 29 nS. B, In a P16 cell, 10 μm E-4031 blocked gHP 98% and the maximum tail current by 33%. The control activation curve (from tail currents) was best fit with the sum of two Boltzmann functions: V1 of −82 mV, S1 of 5.0 mV, gmax1 of 101 nS, V2 of −64 mV, S2 of 3.0 mV; gmax2 of 48 nS. The tail current activation curves for the E-4031-sensitive and E-4031-insensitive currents were fit with single Boltzmann functions with values similar to those of the two Boltzmann functions summed in the control curve; V1/2, S, and gmax values of −83 mV, 4.3 mV, and 94 nS and −63 mV, 1.9 mV, and 95 nS, respectively. C, In a P18 type I hair cell with a very large negative conductance, 10 μm WAY-123,398 reversibly blocked gHP by 97% (D). E, The WAY-123,398-insensitive current had an activation curve with V1/2, S, and gmax values of −46 mV, 7.1 mV, and 69 nS.
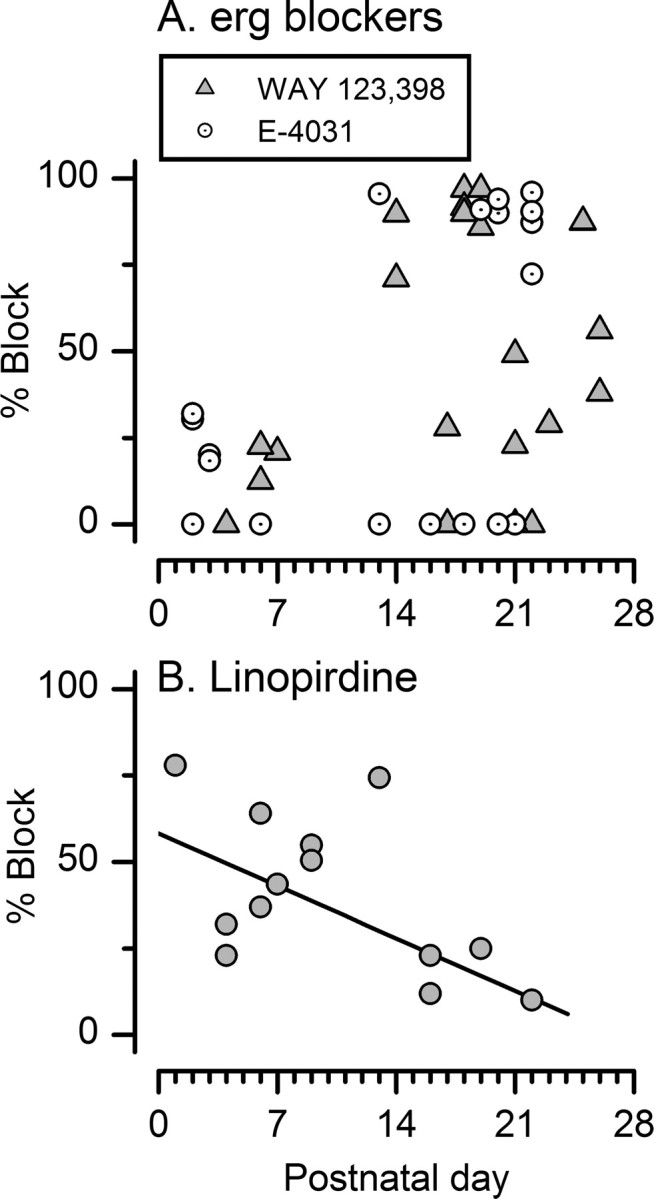
Figure 8.
The effectiveness of erg (A) and KCNQ (B) blockers on type I negatively activating current varied with age. For young cells (P < 10), which lack a significant gHP, we show percentage block of gmax. For older cells with the negative conductance (P > 12), we show percentage block of gHP. A, In the first week, 10 μm WAY-123,398 and 10 μm E-4031 blocked gmax by 0% (3 cells) or 20–30% (7 cells). For P > 12, strong erg blocker effects (74–97%) were seen in more than half of the cells (17 of 31). The percentage showing no effect (26%, 8 of 31) was similar to that in the first week (30%). B, For P < 9, 10 μm linopirdine blocked gmax by 48 ± 6.3% (n = 8). For P > 15, 10 μm linopirdine blocked gHP by 18 ± 3.8% (4 cells).
KCNQ blockers
Figure 6 shows the effects of linopirdine and XE991 on three morphologically identified type I cells. In the first week, 10 μm linopirdine blocked a non-inactivating component of the total current in a voltage-independent manner (Fig. 6A). The mean block of steady-state gmax in seven type I cells (P1–P9) was 48 ± 7.3% (see Fig. 8B). The linopirdine-sensitive conductance activated positive to −60 mV (mean V1/2 of −34 ± 2.6 mV; S of 7.6 ± 1.14 mV; gmax of 13 ± 5.2 nS) and did not inactivate during 300–500 ms depolarizing steps.
In the older cells with large negatively activating conductances, a long recording period is needed to get an accurate activation curve [∼3 min at 14 s per voltage iteration because of long activation and recovery time constants (Wong et al., 2004)], and we were usually unable to record the drug effect on the activation curve (an exception is shown in Fig. 7 B). Instead, we documented the effect of each drug on the conductance at holding potential (gHP), as shown in Figure 6C. When we started these experiments, we thought that we were dealing with a single negatively activating conductance. If there are two negative conductances, however, only the more negative one is strongly activated at −69 mV, with the result that, when both conductances are present, gHP is dominated by g−80. Comparisons of g−80 and g−60 in washout (Fig. 4) and H8 (Fig. 5) experiments indicate that ∼15% of gHP is g−60. Linopirdine at 10 μm reduced gHP by 18 ± 3.8% (n = 4; P > 15) (Fig. 8B), consistent with g−60 being a linopirdine-sensitive KCNQ conductance. More support for this interpretation came from experiments on type I cells from the second postnatal week, when V1/2 values averaged −60 mV (Fig. 2A). XE991 at 10 μm, a selective KCNQ blocker (Wang et al., 1998), blocked such K+ conductances (Fig. 6B).
erg blockers
In the first postnatal week, erg blockers had no effect on 3 of 10 cells (Fig. 8A). In the remaining seven, gmax was blocked 22 ± 2.6% (Figs. 7A, 8A) (shown to be reversible in one cell). At older ages (P13–P26), erg blockers strongly blocked gHP (by 71–97%) in approximately half of the type I cells (17 of 32 cells) (Figs. 7B,C, 8A). For these cells, Hill equation fits of the data at 10 μm (assuming a Hill coefficient of 1) yield estimated KD values of 244 nm (WAY-123,398) and 192 nm (E-4031), consistent with published KD values for heterologously expressed erg channels [100–200 nm for E-4031 (Shi et al., 1997); 300 nm for WAY-123,398 (Selyanko et al., 1999)]. We also applied WAY-123,398 at 100 nm; the mean block (24 ± 1.4%; n = 3 type I cells; P > 18) also fit a KD of ∼250 nm.
Figure 7B illustrates an example in which we were able to document the effect of 10 μm E-4031 on the activation curve. The E-4031-sensitive current had an activation curve similar to the component sensitive to H8 and washout (V1/2 of −83 mV), again showing turnover at positive potentials (compare filled circles in activation curve plots in Figs. 4A, 5B, 7B). Note also that, while we blocked gHP 98%, a substantial current with a more positive activation curve (V1/2 of −63 mV) persisted.
In five cells (all older than P12), strong block of gHP by erg blockers revealed a conductance with similar voltage dependence to the current recorded from young hair cells and from older type II cells: mean V1/2, S, and gmax values for the unblocked current were −30 ± 4.7 mV, 8.9 ± 1.14 mV, and 33 ± 13.1 nS (p > 0.05 for comparisons with P < 7 data). An example is shown in Figure 7, C and E.
erg blockers blocked gHP in six of the older type I cells less strongly but still substantially (23–52%) (Fig. 8A). Thus, 72% (23 of 32) of type I cells (12 < P < 27) had a significant component (23–100%) blocked by erg blockers. The remaining cells were not affected by 10 μm WAY-123,398 (four cells) or 10 μm E-4031 (five cells). Some of these non-effects may reflect known variability in the effectiveness of erg channel blockers (see Discussion). Alternatively, they may reflect true heterogeneity in expression of erg channels by type I cells, for example, of different epithelial zones.
To summarize the whole-cell current data from hair cells, Figure 9 shows that the activation midpoints collected under different conditions fell into three ranges, corresponding well to g−30, g−60, and g−80. The most positive group includes V1/2 values from all young cells (P < 7) (Fig. 9A), and V1/2 values of delayed rectifier currents remaining in older type I cells in the presence of an erg channel blocker (Fig. 9B). The middle group includes V1/2 values of the total current in type I cells in the second postnatal week (P7–P14) (Fig. 9C), the current that did not wash out in ruptured-patch recordings (Fig. 9D), and the current that persisted in H8 (Fig. 9E). The most negative group (g−80) includes V1/2 values from type I cells in the third and fourth weeks (Fig. 9F). The pharmacology suggests that KCNQ subunits contribute to both g−30 and g−60 but that g−80 is an erg conductance.
Figure 9.
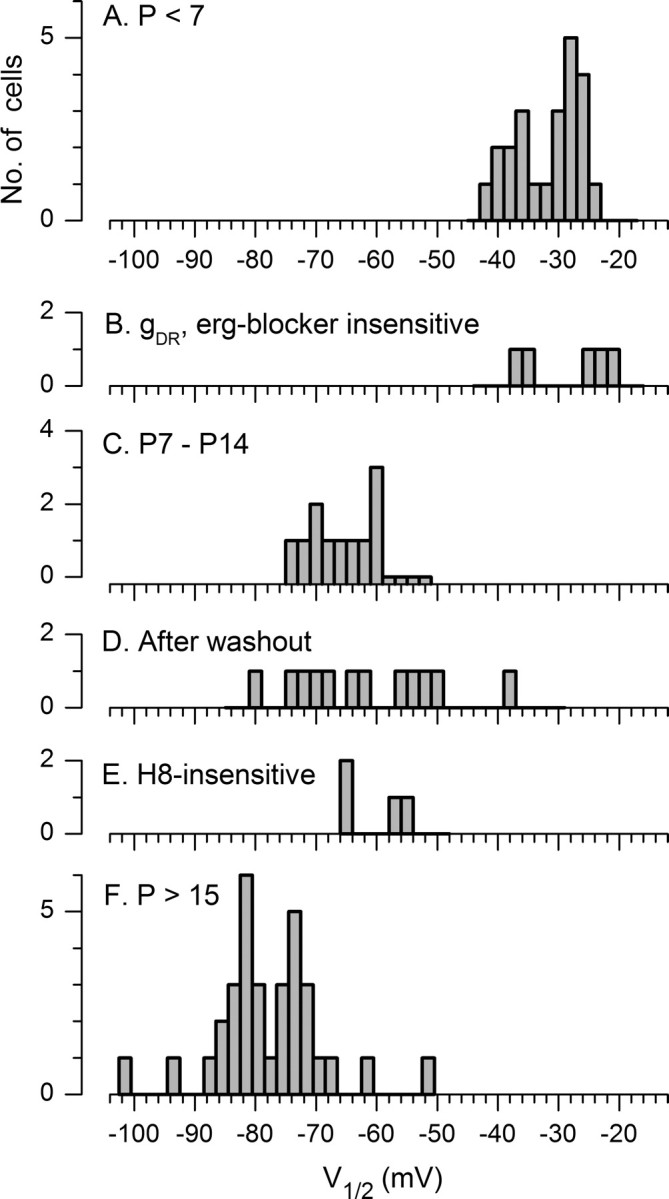
V1/2 values clustered into three bands. For A, the K+ conductance for all cells at P < 7, and, for B, the conductance left behind after strong block of the negative conductance by erg blockers (P > 13), most values were between −20 and −40 mV. For C, the K+ conductance for type I cells in the second week, and the conductance left behind after washout during ruptured-patch recordings (D) or H8 (E), most values were between −50 and −75 mV. For F, the K+ conductance for type I cells older than P15, most values were between −70 and −90 mV.
RT-PCR
To determine which members of the KCNQ and erg families are present in the utricular epithelium, we did RT-PCR on utricular epithelia at P1, P8, P14, and P21. The epithelia were enzymatically removed from the underlying stroma and therefore include hair cells, supporting cells, and nerve endings. Because mRNA in afferent nerve endings might contribute to the results on epithelia, we also did RT-PCR on the vestibular ganglion to learn what the afferent somata express. We obtained PCR products for all three erg subunits (erg1, erg2, and erg3) and for KCNQ3, KCNQ4, and KCNQ5 in both the utricular epithelium and vestibular ganglion at all ages (data not shown). We did not probe for KCNQ1, which is expressed by vestibular dark cells but not hair cells (Casimiro et al., 2001; Nicolas et al., 2001). Kubisch et al. (1999) detected no KCNQ2 message in mouse vestibular organs; we confirmed this finding in the rat utricular macula and did not test further for KCNQ2 message.
We then examined the diversity of mRNA expressed by individual hair cells harvested at different ages from rat utricular maculae and typed according to their morphology. Figure 10A shows results from two experiments at P8. In one experiment, we probed nine type I cells for KCNQ subunits: four were positive for both KCNQ3 and KCNQ5, six were positive for KCNQ3, seven were positive for KCNQ5, and none were positive for KCNQ4. In the other experiment shown, six type I hair cells were probed for erg subunits: one was positive for all three erg subunits, one was positive for erg2 and erg3, and five were positive for erg3.
Figure 10.

RT-PCR on single cells revealed widespread expression of KCNQ and erg subunits. A, Agarose gels showing PCR products from P8 rat utricular hair cells for KCNQ3, KCNQ4, and KCNQ5 (top) and erg1, erg2, and erg3 (bottom). Top, Nine type I hair cells from one macula were probed for KCNQ3–KCNQ5. Six cells (3, 4, 5, 6, 8, 9) were positive for KCNQ3 (160 bp). Seven cells (1, 2, 3, 4, 5, 7, 8) were positive for KCNQ5 (106 bp). The band for cell 1 was faint. The identities of products at other molecular weights are not known. None were positive for KCNQ4 (380 bp). Bottom, Six type I hair cells from another macula were probed for erg1, erg2, and erg3. Cell 2 was positive for all three subunits, cell 4 was positive for erg2 and erg3 (the band corresponding to erg2 is faint), and five of six cells (cells 1–5) were positive for erg3. B, Percentages of positive PCR products for the following: left, single type I hair cells tested with erg1, erg2, erg3, KCNQ3, KCNQ4, and KCNQ5 probes at P1 and P8, and with erg1, erg2, erg 3, and KCNQ4 probes at P14; right, single type II cells tested with KCNQ3 and KCNQ5 probes at P8. We did not test type II cells at other ages, nor did we test them for KCNQ4 at any age. The number of cells tested in each condition is given at the top of the histogram bars.
Single-cell RT-PCR results for all 183 hair cells tested are summarized in Figure 10B. Although KCNQ and erg primer sets were not used together on the same cells, the high incidence of certain subunits argues for the coexpression of KCNQ and erg subunits in type I hair cells in the first postnatal month. For example, at P1, we detected KCNQ5 products in all seven cells tested and erg3 products in 6 of 11 cells tested. At P8, products corresponding to KCNQ3 and KCNQ5 and erg1, erg2, and erg3 mRNA were detected at approximately similar percentages in type I cells (30–60%). At P8, KCNQ3 and KCNQ5 products were detected in a higher proportion of type II cells (60–75%) than type I cells (40–50%).
There is a suggestion of developmental trends for some subunits: erg2 incidence increased from P1 to P14; KCNQ5 incidence decreased from 100% at P1 to 50% at P8; and KCNQ4 expression decreased from 60% at P1 to 0% at P14.
Immunocytochemistry
Figure 11 shows sections of utricular macula labeled with antisera made against KCNQ3 (A), KCNQ4 (B), KCNQ5 (C), herg (D), and erg1 (E) at three ages (P0, P4–P8, and P21). The region of erg1 used to generate the “herg” antiserum has ∼50% homology with the homologous region in rat erg2 and erg3; thus, it is possible that herg antiserum recognizes erg2 and erg3 as well as rat erg1. The region used to generate the “erg1” antiserum, however, has no homology with erg2 or erg3. This difference may account for some differences in immunostaining patterns obtained with the two antisera, although other possibilities exist. We also used calretinin antiserum, which labels immature hair cells, many mature type II cells, and calyx-only afferents in rat vestibular epithelia. Staining of calyx-only afferents is useful because it delineates the striolar zone of the macula (Desai et al., 2005).
P0
Hair cell cytoplasm stained with antisera against KCNQ3, KCNQ4, KCNQ5, and herg, without obvious variation with epithelial location. In each panel in Figure 11, one or two examples of stained hair cells (not necessarily the most intensely stained) are shown by white triangles. KCNQ3-, KCNQ4-, and herg-like immunoreactivity was both punctate and diffuse. KCNQ5 antiserum stained both hair cell and supporting cell cytoplasm (open triangles) diffusely and intensely. erg1-like immunoreactivity appeared in nascent calyces (arrows) but not in hair cells.
P4–P8
At this age, hair cells are beginning to acquire negatively activating conductances (Fig. 2). KCNQ3 and herg antisera stained the cytoplasm of some hair cells more intensely than at P0. For KCNQ4, herg, and erg1 antisera, bright staining appeared to be coincident with nascent calyces (arrows; for herg and erg1, see red outlines around green cell bodies in double-stained panels). The KCNQ5 antiserum stained hair cells, supporting cells and some afferent stalks (filled arrow). In contrast, there was no calyceal staining with the KCNQ3 antiserum (open arrow).
P21
By this stage, the activation parameters of the K+ conductances have settled down to quite negative values (Fig. 2). With KCNQ3 and KCNQ5 antisera, cytoplasmic staining was evident in type I and type II hair cells and in supporting cells. KCNQ5 immunoreactivity in vestibular hair cells was reported by Kharkovets et al. (2006). KCNQ5-like immunoreactivity was also present in calyces and their afferent stalks (arrows). KCNQ3-like immunoreactivity was conspicuously absent from calyces, which appeared as black spaces around type I cells (open arrow). With the herg and erg1 antisera, many hair cells, including type I and type II cells, showed light diffuse staining (Fig. 11D,E, filled triangles). With the KCNQ4 antiserum, some type II cells showed diffuse staining (triangles), but there was little staining of type I cytoplasm.
By P21, the striola (Fig. 11, “s”) is clearly recognizable by the calretinin immunoreactivity of calyx endings and afferent stalks belonging to calyx-only afferents (Desai et al., 2005). herg-like immunoreactivity (Fig. 11D) extended from the base to the apex of type I cells in the extrastriola (“e”) but was patchier in the striola. Some of this staining was in the calyces, as is clear from double-stained calyces in the striola. These impressions were confirmed at the ultrastructural level (Fig. 12A): herg antibody labeled both inner and outer faces of the calyx ending along its entire extent, with sporadic label of the hair cell cytoplasm.
Figure 12.
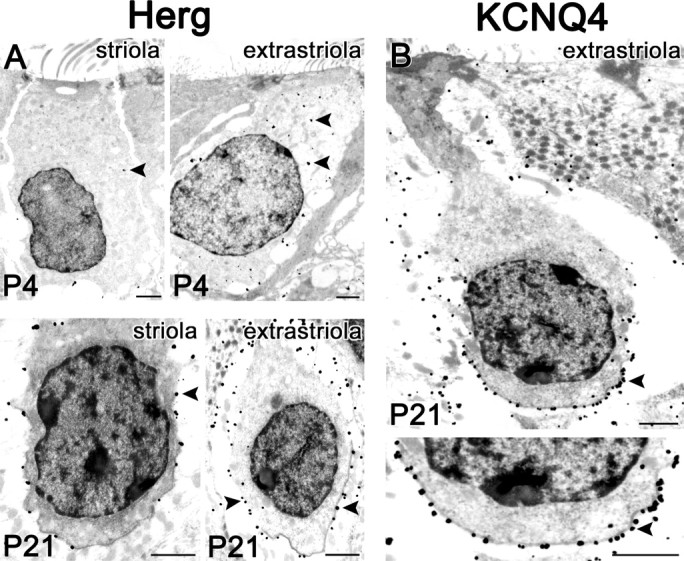
Electron microscopy localizes much of the herg-like and KCNQ4-like immunoreactivity to the calyces. Silver-enhanced immunogold method; black spots are silver grains. Scale bars, 1 μm. A, herg-like-immunoreactivity at P4 and P21. At P4, label within hair cells (arrowheads) is relatively sparse, with more grains in the extrastriolar cell. At P21 (bottom row), calyces are seen as white spaces with mitochondria around the hair cells; mainly the inner face of the calyx is visible around the striolar cell (left). At this age, staining is localized to both inner and outer faces of the calyx (see extrastriolar calyx) and is more abundant in the extrastriola. Arrowhead points to grains on the calyx inner face. B, KCNQ4-like immunoreactivity at P21 in a type I cell in a simple extrastriolar calyx. Silver grains are most abundant on the calyx inner face membrane (see higher magnification below; arrowhead points to grains on the calyx inner face), accounting for the bright lines of stain cupping the basal membrane of the hair cells in confocal fluorescent images (Fig. 11). Relatively few silver grains are in the hair cell side of the synaptic cleft (3 of 41 grains near the inner-face membrane in the high-magnification view).
For KCNQ4, staining at P21 (Fig. 11B) formed strikingly intense bands of label cupping the bases of type I hair cells, which had no cytoplasmic stain. The label extended farther up from the base of the calyx in the striola than in the extrastriola. In double-labeled panels, red KCNQ4 fluorescence and green calretinin label overlapped in calyx afferent endings (arrow). Electron microscopy confirmed that the intense cups reflect staining of the calyx inner-face membrane (Fig. 12B).
In summary, RT-PCR and immunocytochemistry suggest that expression levels of both KCNQ and erg subunits change during the first 3 postnatal weeks. For erg1, the relatively light staining of type I hair cells was consistent with the low yield in single-cell RT-PCR (2 of 18 cells). Both methods showed strong expression of KCNQ3 and KCNQ5 in both type I and type II hair cells during this period. Both methods also suggested that KCNQ4 expression in type I hair cells falls between P0 and P8.
Immunoreactivity for erg1 and KCNQ4 at P21 was particularly strong in calyces, with important differences. erg1-like staining occurred more uniformly on both calyx faces and was strongest in the extrastriola. KCNQ4-like immunoreactivity was concentrated on the calyx inner face and was more intense and extended farther up the calyx in the striola than in the extrastriola. In the next section, we present evidence for KCNQ and erg conductances in the calyx ending and afferent stalk.
Conductances in the calyx ending and afferent stalk
We recorded in perforated-patch mode from isolated hair cells with what appeared to be attached calyces, from isolated calyx endings with afferent stalks, and in one case from a detached stalk.
Figure 13A shows a calyx on an isolated hair cell. The calyx had a very large and slow current (Fig. 13B) that activated with a V1/2 of −63 mV, S of 8.4 mV, and gmax of 428 nS (Fig. 13C). This conductance resembled a conductance in another calyx with V1/2 of −63 mV, S of 8.4 mV, and gmax of 245 nS. In two other calyces (data not shown), the voltage dependence was more negative: V1/2 values were −76 and −80 mV; S values were 6.8 and 5.0 mV; gmax values were 64 and 295 nS. In one attached calyx, 10 μm linopirdine blocked a large negatively activating conductance by 35% in a voltage-independent manner (activation curve not obtained).
Figure 13.

Whole-cell perforated-patch recording from a calyx on an isolated hair cell revealed a huge negatively activating conductance. A, Photomicrograph and drawing showing a P17 hair cell with its calyx still surrounding the hair cell. B, Currents evoked by steps between −80 and −50 mV. C, Activation curve constructed from the tail currents shown in B and, for potentials positive to −60 mV, from a shorter protocol (100 ms voltage steps; not shown). V1/2, S, gmax, −63 mV, 8.4 mV, 428 nS (calculated using the observed reversal potential of −82 mV).
The isolated calyx plus stalk shown in Figure 14A had a relatively fast current with a broad and relatively negative activation range (Fig. 14B). A KCNQ blocker (XE991, 1 μm) blocked much of the outward current. The activation curve of the XE991-blocked component had V1/2 of −51 mV, S of 14.6 mV, and gmax of 24 nS. In its kinetics, the conductance bore a strong resemblance to gK,n in outer hair cells (Wong et al., 2004), which is believed to include KCNQ4 subunits (Kubisch et al., 1999; Marcotti and Kros, 1999).
Figure 14.
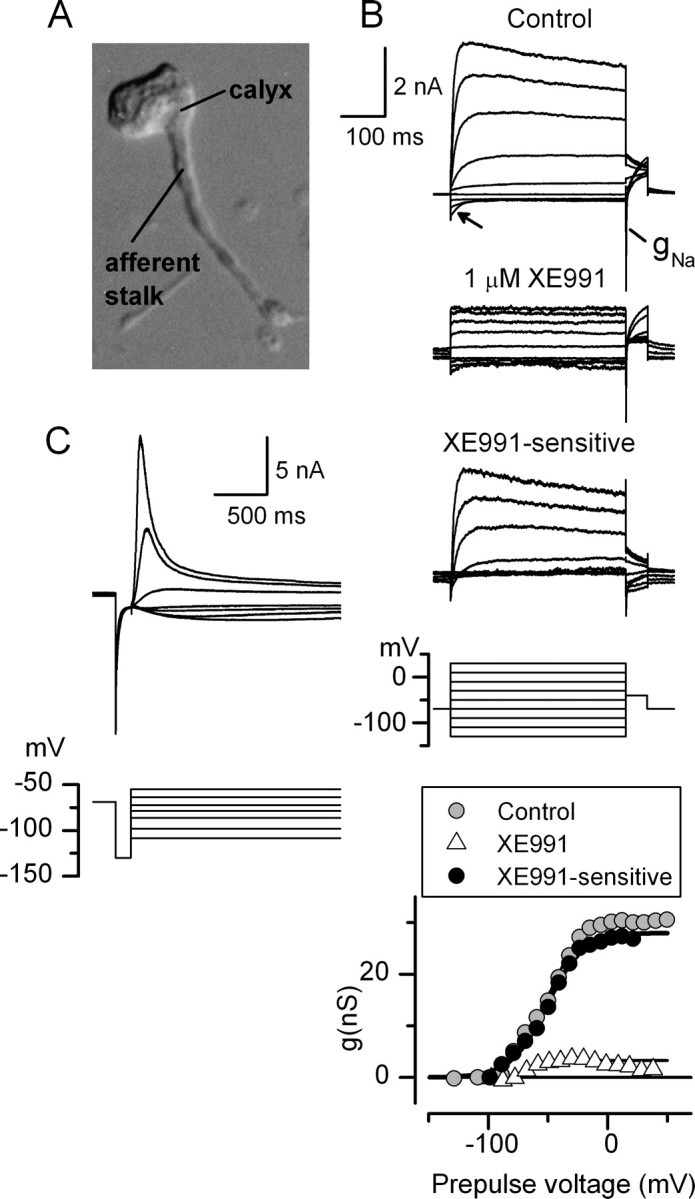
Whole-cell perforated-patch recording from calyces and attached afferent stalks revealed large K+ and Na+ conductances. A, Photomicrograph showing a calyx and attached afferent stalk isolated from its hair cell; P21. B, Whole-cell currents recorded from the calyx in A deactivated during hyperpolarizations (arrow). A transient inward current, presumably through an Na+ conductance, gNa, was evoked by steps from potentials negative to −79 mV to the tail potential of −39 mV. XE991 at 1 μm blocked most of the outward current (see difference current). Bottom, Tail current activation curves fitted with Boltzmann functions. V1/2, S, gmax values are as follows: control current, −52 mV, 15.9 mV, 30 nS; XE991-sensitive component, −51 mV, 14.6 mV, 27 nS; XE991-insensitive component, −64 mV, 5 mV, 4 nS. C, Whole-cell perforated-patch recording from a different calyx and attached stalk, isolated from a crista; P19. This afferent had a very large current that activated positive to −100 mV, reversed at EK (−85 mV), and inactivated strongly for steps positive to −70 mV.
In the second example of a calyx plus stalk recording (Fig. 14C), we saw a large current that activated negatively and inactivated strongly for steps positive to −70 mV, reminiscent of an erg3 conductance (Shi et al., 1997; Sturm et al., 2005).
Figure 15 shows ruptured-patch recordings from a detached afferent stalk. At the outset of recording (Fig. 15B, top), depolarization from the holding potential evoked a fast outwardly rectifying current that declined at high depolarizations (Fig. 15C), consistent with a contribution from a Ca2+-dependent K+ conductance. Some of the outward current washed out with time (Fig. 15B). This suggests that the Ca2+-dependent current was activated by Ca2+ entry through L-type channels, which wash out in ruptured-patch recordings.
In all three recordings that included an afferent stalk, steps from hyperpolarized voltages evoked fast, transient inward currents that were probably voltage-gated Na+ currents (Figs. 14B, 15B,C). Peak inward currents (1–3 nA) substantially exceeded Na+ currents in rat utricular hair cells (223 ± 37.4 pA; n = 12) at the same age (P20–P22) (J. R. A. Wooltorton, unpublished observation). The currents inactivated too fast to be T-type Ca2+ currents. The inactivation midpoint in Figure 15C was −82 mV, similar to that reported in calyces on gerbil type I hair cells by Rennie and Streeter (2006).
In summary, these recordings from the calyx plus stalk provide physiological evidence for a fast negatively activating KCNQ conductance, a voltage-gated Na+ conductance, and a larger, slower outward conductance that might correspond to the herg/erg1 immunoreactivity. In a single isolated stalk, we obtained evidence for a voltage-gated Na+ conductance, a delayed rectifier, and a Ca2+-dependent conductance possibly carried by BK channels, and we inferred the existence of L-type Ca channels.
Discussion
The most remarkable features of vestibular type I hair cells are their postsynaptic calyceal contacts and their large negatively activating K+ conductances. These two features are acquired contemporaneously in development but independently (for review, see Eatock and Hurley, 2003). Our work suggests that, as type I hair cells and calyx endings mature, they both acquire KCNQ and erg channels with the potential to strongly influence afferent synaptic transmission.
Acquisition of two negatively activating K conductances in rat utricular hair cells
In the mouse utricular macula, type I hair cells begin to acquire a negatively activating conductance just before birth (Géléoc et al., 2004). It continues to increase in incidence during the first week (Rüsch et al., 1998). Its acquisition in the rat utricular macula was delayed 1 week or more relative to the mouse (Figs. 1, 2). Before P7, all rat utricular hair cells expressed outwardly rectifying currents that activated positive to resting potential. The effects of a selective dose of linopirdine (Fig. 6A) are consistent with a non-inactivating, linopirdine-sensitive KCNQ current plus an inactivating delayed rectifier or A current.
Over the second week, average gmax and V1/2 changed for type I cells (Fig. 2); by the third week, average gmax was 4.4-fold larger and average V1/2 was 34 mV more negative than in the first week. At issue is whether this change reflects acquisition of just one channel type. Voltage-gated currents had heterogeneous kinetics and steady-state voltage dependence (Fig. 3). Some activation curves in the second week were unusually wide and could be fit by sums of Boltzmann functions (Fig. 3C) with activation midpoints clustered around −30, −60, and −80 mV, similar to conductances isolated by various methods (Fig. 9): erg blockers, washout, and H8 blocked a −80 mV component, leaving behind either a −60 mV component (Figs. 4A, 5B, 7B) or a −30 mV component (Fig. 7E). The activation curve of the −80 mV component turned over with increasing depolarization, similar to erg currents (Shi et al., 1998; Nie et al., 2005; Sturm et al., 2005). Together, these results suggest that the negatively activating conductance comprises an erg conductance with a midpoint of −80 mV and a second, non-erg conductance with a midpoint at approximately −60 mV. Activation curve midpoints average −60 mV in the second week, and KCNQ blockers block a conductance with V1/2 of −60 mV in the second week (Fig. 6B) and ∼20% of gHP in the third postnatal week (Fig. 6C). Together, these results suggest that g−60 develops earlier than g−80 and is a KCNQ conductance. The third conductance or set of conductances (midpoints −20 to −40 mV) was not blocked by erg blockers (Figs. 7C,E, 9B) and was relatively insensitive to external Cd2+ (data not shown).
For the erg component, single-cell RT-PCR results suggested erg2 and erg3 as more likely contributors than erg1 (Fig. 10). erg subunit heteromultimers are plausible (Wimmers et al., 2001). Although herg and erg1 antisera produced strong staining in the vicinity of type I cells (Fig. 11D,E) (see also results by Nie et al., 2005, with a different antiserum on mouse vestibular epithelia), ultrastructural analysis showed that most immunoreactivity was postsynaptic (Fig. 12A).
Even among the older type I cells studied, 28% were not affected by erg blockers (Fig. 8A). Because we usually measured conductance at holding potential with an abbreviated voltage protocol (Figs. 6C, 7C), we have limited information about how erg blocker-insensitive conductances differed from erg blocker-sensitive conductances. The insensitive cells may represent a subset that do not express erg channels, possibly from a specific zone in the epithelium. Alternatively, the variability may have been technical in origin; erg blockers block the channel from the intracellular side, making it more difficult to be confident that block has reached steady state (Brown, 2005).
For the KCNQ conductance(s), single-cell RT-PCR and immunocytochemistry suggest KCNQ3, KCNQ4, and KCNQ5 as candidate subunits. KCNQ4 has been favored (Kharkovets et al., 2000) in part because it contributes to gK,n in cochlear hair cells. Also, the dominant-negative form of KCNQ4 is reported to block the negative conductance in type I hair cells of the mouse utricle (younger than P10) (Holt et al., 2004). Our single-cell RT-PCR and immunocytochemistry, however, showed stronger hair-cell expression of KCNQ3 and KCNQ5 subunits than of KCNQ4 subunits. The dominant-negative KCNQ4 subunit could partner with KCNQ3 and inhibit any KCNQ3-containing conductance. It might even have indirect effects on erg channels: erg and KCNQ subunits may interact through accessory subunits such as Mirp1 (minimal potassium ion channel-related peptide 1) (Anantharam et al., 2003), or directly, as suggested by coimmunoprecipitation studies (Ehrlich et al., 2004).
KCNQ3/5 heteromultimeric channels may contribute to M currents (Schroeder et al., 2000; Shah et al., 2002). The frequent expression of both subunits in both type I and type II cells, however, suggests KCNQ3/5 channels as candidates for a common conductance, one that activates positive to −60 mV, such as the linopirdine-sensitive conductance at P < 7 (Fig. 6A) and in more mature type II cells (Rennie et al., 2001) (K. M. Hurley and R. A. Eatock, unpublished results).
Comparison with other studies of K+ currents in type I hair cells
In some studies, the type I conductance resembles the more positive of the two negatively activating conductances that we have identified, in both activation range and kinetics (Chen and Eatock, 2000; Brichta et al., 2002; Géléoc et al., 2004). We can suggest reasons why we saw the putative erg conductance and others have not. We recorded at older ages than Géléoc et al. (2004); we used the perforated-patch recording configuration to prevent washout of labile conductances; and there may be genuine differences between the type I cells sampled by the various studies [Géléoc et al., (2004) sampled the central utricular macula and Chen and Eatock (2000) and Brichta et al. (2002) recorded from cristae].
Conductances in the calyx
According to both immunocytochemical (Fig. 12B) (Kharkovets et al., 2000; Lysakowski and Price, 2003) and pharmacological (Fig. 14) (Rennie and Streeter, 2006) results, calyx endings express a significant KCNQ conductance. Our recorded current resembled the cochlear gK,n in its kinetics but was more positively activating. KCNQ4-like immunoreactivity on the calyx inner-face membrane was intense and sharply localized (Fig. 12B); the intensity and base-apex extent are greater in the striola (Lysakowski and Price, 2003).
We also recorded large, more negatively activating conductances from calyces on hair cells (Fig. 13) and a calyx plus stalk (Fig. 14D). herg-like and erg1-like immunoreactivity was present in calyx endings and afferent stalks; in contrast to KCNQ4, it was strongest in the extrastriola (Figs. 11D,E, 12A at P21). Thus, differences within our small sample of calyces may have reflected different epithelial origins.
Implications of large negatively activating conductances at the type I-calyx synapse
In both mature type I hair cells and in calyx endings, we recorded extraordinarily large K+ conductances with relatively negative activation ranges. The low resistances should reduce the efficacy of chemical transmission, which depends on voltage changes on either side of the cleft (the receptor potential and the EPSP). So how does transmission at this synapse work?
First, it is clear that, in rodent vestibular organs, type I cells transmit chemically to calyx endings. Evidence includes the 15–20 synaptic ribbons per type I hair cell in the mature chinchilla crista (Lysakowski and Goldberg, 1997) and spontaneous EPSCs recorded from gerbil calyces attached to dissociated hair cells (Rennie and Streeter, 2006). One way to make chemical transmission work is to down-modulate gK,L and postsynaptic conductances. Both KCNQ and erg conductances are sensitive to modulation. One attractive possibility is that they are turned down in intact systems by nitric oxide released by calyces or efferents (Chen and Eatock, 2000; Lysakowski and Singer, 2000). Some efferent actions may be mediated by muscarinic acetylcholine receptors (mAChRs) (Wackym et al., 1996; Drescher et al., 1999), raising the possibility that efferents inhibit calyceal KCNQ conductances via an mAChR-coupled cascade, as demonstrated for neuronal M current (Brown and Adams, 1980). The resting conductance may also be reduced at mammalian temperature (Rüsch and Eatock, 1996).
An alternative possibility is that gK,L is strongly activated at least some of the time and that the synapse uses unconventional, nonquantal transmission. A low-impedance pathway from hair cell to calyx may facilitate the flow of transduction current into the calyx ending, especially if ionic conductances are concentrated at the base of the cleft, as seems to be the case for KCNQ4 channels. In all hair-cell organs, supporting cell pumps elevate K+ apically such that K+ enters apical hair bundles through transduction channels and exits the basolateral membrane through K channels. K+ exiting from the type I cell is dumped into a thin shell (the synaptic cleft). Excess cleft K+ would depolarize both hair cell and calyx in a nonquantal type of transmission that could also stimulate chemical transmission from the hair cell to the calyx (Goldberg, 1996). Although this mechanism does not require large numbers of open K channels, their presence may permit equilibration of K+ across the hair cell and calyx ending (Trussell, 2000).
In summary, erg and KCNQ channels appear to contribute to conductances on both sides of the synaptic cleft, with the erg conductances being larger and more negatively activating. The presynaptic and postsynaptic expression of such modulatable M-like conductances enhances the potential for gain control of this synapse by either transmitters exchanged bidirectionally across the afferent synaptic cleft or efferent synapses on the calyx.
Footnotes
This work was supported by National Institutes of Health Grant DC002290 (R.A.E.), grants from the Deafness Research Foundation and the National Organization for Hearing Research (K.M.H.), and National Space Biomedical Research Institute through NASA Fellowship NCC 9-58 (S.G.). We thank Jasmine Garcia, Elisa Gavia, Donna Himes, Marcin Klapczynski, and Sohera Syeda for technical assistance and Dr. Melissa Vollrath for critical reading of a previous version of this manuscript. We thank Drs. Thomas Jentsch, Bechara Kachar, and Jeanne Nerbonne for gifts of antisera.
References
- Anantharam A, Markowitz SM, Abbott GW. Pharmacogenetic considerations in diseases of cardiac ion channels. J Pharmacol Exp Ther. 2003;307:831–838. doi: 10.1124/jpet.103.054569. [DOI] [PubMed] [Google Scholar]
- Barry PH. JPCalc, a software package for calculating liquid junction potential corrections in patch-clamp, intracellular, epithelial and bilayer measurements and for correcting junction potential measurements. J Neurosci Methods. 1994;51:107–116. doi: 10.1016/0165-0270(94)90031-0. [DOI] [PubMed] [Google Scholar]
- Brichta AM, Aubert A, Eatock RA, Goldberg JM. Regional analysis of whole cell currents from hair cells of the turtle posterior crista. J Neurophysiol. 2002;88:3259–3278. doi: 10.1152/jn.00770.2001. [DOI] [PubMed] [Google Scholar]
- Brown AM. hERG block, QT liability and sudden cardiac death. In: Chadwick DJ, Goode J, editors. The hERG cardiac potassium channel: structure, function and Long QT syndrome. Chichester, UK: Wiley; 2005. pp. 118–135. [Google Scholar]
- Brown DA, Adams PR. Muscarinic suppression of a novel voltage-sensitive K+ current in a vertebrate neurone. Nature. 1980;283:673–676. doi: 10.1038/283673a0. [DOI] [PubMed] [Google Scholar]
- Brown DA, Selyanko AA, Hadley JK, Tatulian L. Some pharmacological properties of neural KCNQ channels. Neurophysiology. 2002;34:91–94. [Google Scholar]
- Casimiro MC, Knollmann BC, Ebert SN, Vary JC, Greene AE, Franz MR, Grinberg A, Huang SP, Pfeifer K. Targeted disruption of the Kcnq1 gene produces a mouse model of Jervell and Lange-Nielsen Syndrome. Proc Natl Acad Sci USA. 2001;98:2526–2531. doi: 10.1073/pnas.041398998. [DOI] [PMC free article] [PubMed] [Google Scholar]
- Chen JW, Eatock RA. Major potassium conductance in type I hair cells from rat semicircular canals: characterization and modulation by nitric oxide. J Neurophysiol. 2000;84:139–151. doi: 10.1152/jn.2000.84.1.139. [DOI] [PubMed] [Google Scholar]
- Correia MJ, Lang DG. An electrophysiological comparison of solitary type I and type II vestibular hair cells. Neurosci Lett. 1990;116:106–111. doi: 10.1016/0304-3940(90)90394-o. [DOI] [PubMed] [Google Scholar]
- Desai SS, Zeh C, Lysakowski A. Comparative morphology of rodent vestibular periphery. I. Saccular and utricular maculae. J Neurophysiol. 2005;93:251–266. doi: 10.1152/jn.00746.2003. [DOI] [PubMed] [Google Scholar]
- Desmadryl G, Dechesne CJ. Calretinin immunoreactivity in chinchilla and guinea pig vestibular end organs characterizes the calyx unit subpopulation. Exp Brain Res. 1992;89:105–108. doi: 10.1007/BF00229006. [DOI] [PubMed] [Google Scholar]
- Drescher DG, Kerr TP, Drescher MJ. Autoradiographic demonstration of quinuclidinyl benzilate binding sites in the vestibular organs of the gerbil. Brain Res. 1999;845:199–207. doi: 10.1016/s0006-8993(99)01939-3. [DOI] [PubMed] [Google Scholar]
- Eatock RA, Hurley KM. Functional development of hair cells. Curr Top Dev Biol. 2003;57:389–448. doi: 10.1016/s0070-2153(03)57013-2. [DOI] [PubMed] [Google Scholar]
- Eatock RA, Chen W-Y, Saeki M. Potassium currents in mammalian vestibular hair cells. Sens Syst. 1994;8:21–28. [Google Scholar]
- Ehrlich JR, Pourrier M, Weerapura M, Ethier N, Marmabachi AM, Hebert TE, Nattel S. KvLQT1 modulates the distribution and biophysical properties of HERG. A novel alpha-subunit interaction between delayed rectifier currents. J Biol Chem. 2004;279:1233–1241. doi: 10.1074/jbc.M309087200. [DOI] [PubMed] [Google Scholar]
- Emmi A, Wenzel HJ, Schwartzkroin PA, Taglialatela M, Castaldo P, Bianchi L, Nerbonne J, Robertson GA, Janigro D. Do glia have heart? Expression and functional role for the ether-a-go-go currents in hippocampal astrocytes. J Neurosci. 2000;20:3915–3925. doi: 10.1523/JNEUROSCI.20-10-03915.2000. [DOI] [PMC free article] [PubMed] [Google Scholar]
- Gamper N, Shapiro MS. Calmodulin mediates Ca2+-dependent modulation of M-type K+ channels. J Gen Physiol. 2003;122:17–31. doi: 10.1085/jgp.200208783. [DOI] [PMC free article] [PubMed] [Google Scholar]
- Gamper N, Stockand JD, Shapiro MS. Subunit-specific modulation of KCNQ potassium channels by Src tyrosine kinase. J Neurosci. 2003;23:84–95. doi: 10.1523/JNEUROSCI.23-01-00084.2003. [DOI] [PMC free article] [PubMed] [Google Scholar]
- Géléoc GS, Risner JR, Holt JR. Developmental acquisition of voltage-dependent conductances and sensory signaling in hair cells of the embryonic mouse inner ear. J Neurosci. 2004;24:11148–11159. doi: 10.1523/JNEUROSCI.2662-04.2004. [DOI] [PMC free article] [PubMed] [Google Scholar]
- Goldberg JM. Theoretical analysis of intercellular communication between the vestibular type I hair cell and its calyx ending. J Neurophysiol. 1996;76:1942–1957. doi: 10.1152/jn.1996.76.3.1942. [DOI] [PubMed] [Google Scholar]
- Higashida H, Brown DA, Robbins J. Both linopirdine- and WAY123,398-sensitive components of I-K(M,I-ng) are modulated by cyclic ADP ribose in NG108–15 cells. Pflügers Arch. 2000;441:228–234. doi: 10.1007/s004240000433. [DOI] [PubMed] [Google Scholar]
- Hille B. Ed 3. Sunderland, MA: Sinaur; 2001. Ion channels of excitable membranes. [Google Scholar]
- Holt JR, Abraham D, Géléoc GS. Adenoviral-mediated dominant-negative suppression of a low-voltage activated potassium conductance in type I vestibular hair cells. Assoc Res Otolaryngol Abstr. 2004;27:1298. [Google Scholar]
- Horn R, Marty A. Muscarinic activation of ionic currents measured by a new whole-cell recording method. J Gen Physiol. 1988;92:145–159. doi: 10.1085/jgp.92.2.145. [DOI] [PMC free article] [PubMed] [Google Scholar]
- Housley GD, Ashmore JF. Ionic currents of outer hair cells isolated from the guinea-pig cochlea. J Physiol (Lond) 1992;448:73–98. doi: 10.1113/jphysiol.1992.sp019030. [DOI] [PMC free article] [PubMed] [Google Scholar]
- Kharkovets T, Hardelin JP, Safieddine S, Schweizer M, El Amraoui A, Petit C, Jentsch TJ. KCNQ4, a K+ channel mutated in a form of dominant deafness, is expressed in the inner ear and the central auditory pathway. Proc Natl Acad Sci USA. 2000;97:4333–4338. doi: 10.1073/pnas.97.8.4333. [DOI] [PMC free article] [PubMed] [Google Scholar]
- Kharkovets T, Dedek K, Maier H, Schweizer M, Khimich D, Nouvian R, Vardanyan V, Leuwer R, Moser T, Jentsch TJ. Mice with altered KCNQ4 K channels implicate sensory outer hair cells in human progressive deafness. EMBO J. 2006;25:642–652. doi: 10.1038/sj.emboj.7600951. [DOI] [PMC free article] [PubMed] [Google Scholar]
- Kubisch C, Schroeder BC, Friedrich T, Lutjohann B, El Amraoui A, Marlin S, Petit C, Jentsch TJ. KCNQ4, a novel potassium channel expressed in sensory outer hair cells, is mutated in dominant deafness. Cell. 1999;96:437–446. doi: 10.1016/s0092-8674(00)80556-5. [DOI] [PubMed] [Google Scholar]
- Lennan GW, Steinacker A, Lehouelleur J, Sans A. Ionic currents and current-clamp depolarisations of type I and type II hair cells from the developing rat utricle. Pflügers Arch. 1999;438:40–46. doi: 10.1007/s004240050877. [DOI] [PubMed] [Google Scholar]
- Leonard RB, Kevetter GA. Molecular probes of the vestibular nerve. I. Peripheral termination patterns of calretinin, calbindin and peripherin containing fibers. Brain Res. 2002;928:8–17. doi: 10.1016/s0006-8993(01)03268-1. [DOI] [PubMed] [Google Scholar]
- Lysakowski A, Goldberg JM. A regional, ultrastructural analysis of the cellular and synaptic architecture in the chinchilla cristae ampullares. J Comp Neurol. 1997;389:419–443. doi: 10.1002/(sici)1096-9861(19971222)389:3<419::aid-cne5>3.0.co;2-3. [DOI] [PMC free article] [PubMed] [Google Scholar]
- Lysakowski A, Price SD. Potassium channel localization in sensory epithelia of the rat inner ear. Assoc Res Otolaryngol Abstr. 2003;26:1534. [Google Scholar]
- Lysakowski A, Singer M. Nitric oxide synthase localized in a subpopulation of vestibular efferents with NADPH diaphorase histochemistry and nitric oxide synthase immunohistochemistry. J Comp Neurol. 2000;427:508–521. doi: 10.1002/1096-9861(20001127)427:4<508::aid-cne2>3.0.co;2-l. [DOI] [PubMed] [Google Scholar]
- Marcotti W, Kros CJ. Developmental expression of the potassium current IK,n contributes to maturation of mouse outer hair cells. J Physiol (Lond) 1999;520:653–660. doi: 10.1111/j.1469-7793.1999.00653.x. [DOI] [PMC free article] [PubMed] [Google Scholar]
- Masetto S, Correia MJ. Electrophysiological properties of vestibular sensory and supporting cells in the labyrinth slice before and during regeneration. J Neurophysiol. 1997;78:1913–1927. doi: 10.1152/jn.1997.78.4.1913. [DOI] [PubMed] [Google Scholar]
- Masetto S, Perin P, Malusa A, Zucca G, Valli P. Membrane properties of chick semicircular canal hair cells in situ during embryonic development. J Neurophysiol. 2000;83:2740–2756. doi: 10.1152/jn.2000.83.5.2740. [DOI] [PubMed] [Google Scholar]
- Meves H, Schwarz JR, Wulfsen I. Separation of M-like current and ERG current in NG108–15 cells. Br J Pharmacol. 1999;127:1213–1223. doi: 10.1038/sj.bjp.0702642. [DOI] [PMC free article] [PubMed] [Google Scholar]
- Nicolas M, Demêmes D, Martin A, Kupershmidt S, Barhanin J. KCNQ1/KCNE1 potassium channels in mammalian vestibular dark cells. Hear Res. 2001;153:132–145. doi: 10.1016/s0378-5955(00)00268-9. [DOI] [PubMed] [Google Scholar]
- Nie L, Gratton MA, Mu KJ, Dinglasan JN, Feng W, Yamoah EN. Expression and functional phenotype of mouse ERG K+ channels in the inner ear: potential role in K+ regulation in the inner ear. J Neurosci. 2005;25:8671–8679. doi: 10.1523/JNEUROSCI.1422-05.2005. [DOI] [PMC free article] [PubMed] [Google Scholar]
- Oliver D, Knipper M, Derst C, Fakler B. Resting potential and submembrane calcium concentration of inner hair cells in the isolated mouse cochlea are set by KCNQ-type potassium channels. J Neurosci. 2003;23:2141–2149. doi: 10.1523/JNEUROSCI.23-06-02141.2003. [DOI] [PMC free article] [PubMed] [Google Scholar]
- Papa M, Boscia F, Canitano A, Castaldo P, Sellitti S, Annunziato L, Taglialatela M. Expression pattern of the ether-a-gogo-related (ERG) K+ channel-encoding genes ERG1, ERG2, and ERG3 in the adult rat central nervous system. J Comp Neurol. 2003;466:119–135. doi: 10.1002/cne.10886. [DOI] [PubMed] [Google Scholar]
- Rae JL, Cooper K, Gates P, Watsky M. Low access resistance perforated patch recordings using amphotericin B. J Neurosci Methods. 1991;37:15–26. doi: 10.1016/0165-0270(91)90017-t. [DOI] [PubMed] [Google Scholar]
- Rennie KJ, Correia MJ. Potassium currents in mammalian and avian isolated type I semicircular canal hair cells. J Neurophysiol. 1994;71:317–329. doi: 10.1152/jn.1994.71.1.317. [DOI] [PubMed] [Google Scholar]
- Rennie KJ, Streeter MA. Voltage-dependent currents in isolated vestibular afferent calyx terminals. J Neurophysiol. 2006;95:26–32. doi: 10.1152/jn.00641.2005. [DOI] [PubMed] [Google Scholar]
- Rennie KJ, Weng T, Correia MJ. Effects of KCNQ channel blockers on K+ currents in vestibular hair cells. Am J Physiol Cell Physiol. 2001;280:C473–C480. doi: 10.1152/ajpcell.2001.280.3.C473. [DOI] [PubMed] [Google Scholar]
- Ricci AJ, Rennie KJ, Correia MJ. The delayed rectifier, IKI, is the major conductance in type I vestibular hair cells across vestibular end organs. Pflügers Arch. 1996;432:34–42. doi: 10.1007/s004240050102. [DOI] [PubMed] [Google Scholar]
- Rüsch A, Eatock RA. A delayed rectifier conductance in type I hair cells of the mouse utricle. J Neurophysiol. 1996;76:995–1004. doi: 10.1152/jn.1996.76.2.995. [DOI] [PubMed] [Google Scholar]
- Rüsch A, Lysakowski A, Eatock RA. Postnatal development of type I and type II hair cells in the mouse utricle: acquisition of voltage-gated conductances and differentiated morphology. J Neurosci. 1998;18:7487–7501. doi: 10.1523/JNEUROSCI.18-18-07487.1998. [DOI] [PMC free article] [PubMed] [Google Scholar]
- Saffer LD, Gu R, Corwin JT. An RT-PCR analysis of mRNA for growth factor receptors in damaged and control sensory epithelia of rat utricles. Hear Res. 1996;94:14–23. doi: 10.1016/0378-5955(95)00228-6. [DOI] [PubMed] [Google Scholar]
- Saganich MJ, Machado E, Rudy B. Differential expression of genes encoding subthreshold-operating voltage-gated K+ channels in brain. J Neurosci. 2001;21:4609–4624. doi: 10.1523/JNEUROSCI.21-13-04609.2001. [DOI] [PMC free article] [PubMed] [Google Scholar]
- Sans A, Dechesne CJ, Dememes D. The mammalian otolithic receptors: a complex morphological and biochemical organization. Adv Otorhinolaryngol. 2001;58:1–14. doi: 10.1159/000059109. [DOI] [PubMed] [Google Scholar]
- Schroeder BC, Hechenberger M, Weinreich F, Kubisch C, Jentsch TJ. KCNQ5, a novel potassium channel broadly expressed in brain, mediates M-type currents. J Biol Chem. 2000;275:24089–24095. doi: 10.1074/jbc.M003245200. [DOI] [PubMed] [Google Scholar]
- Selyanko AA, Hadley JK, Wood IC, Abogadie FC, Delmas P, Buckley NJ, London B, Brown DA. Two types of K+ channel subunit, Erg1 and KCNQ2/3, contribute to the M-like current in a mammalian neuronal cell. J Neurosci. 1999;19:7742–7756. doi: 10.1523/JNEUROSCI.19-18-07742.1999. [DOI] [PMC free article] [PubMed] [Google Scholar]
- Shah MM, Mistry M, Marsh SJ, Brown DA, Delmas P. Molecular correlates of the M-current in cultured rat hippocampal neurons. J Physiol (Lond) 2002;544:29–37. doi: 10.1113/jphysiol.2002.028571. [DOI] [PMC free article] [PubMed] [Google Scholar]
- Shi W, Wymore R, Pan Z, Wang HS, Cohen IS, McKinnon D, Dixon JE. Identification of two nervous system-specific members of the erg potassium channel gene family. J Neurosci. 1997;19:9423–9432. doi: 10.1523/JNEUROSCI.17-24-09423.1997. [DOI] [PMC free article] [PubMed] [Google Scholar]
- Sturm P, Wimmers S, Schwarz JR, Bauer CK. Extracellular potassium effects are conserved within the rat erg K+ channel family. J Physiol (Lond) 2005;564:329–345. doi: 10.1113/jphysiol.2004.078840. [DOI] [PMC free article] [PubMed] [Google Scholar]
- Suh BC, Hille B. Recovery from muscarinic modulation of M current channels requires phosphatidylinositol 4,5-bisphosphate synthesis. Neuron. 2002;35:507–520. doi: 10.1016/s0896-6273(02)00790-0. [DOI] [PubMed] [Google Scholar]
- Trussell L. Mutant ion channel in cochlear hair cells causes deafness. Proc Natl Acad Sci USA. 2000;97:3786–3788. doi: 10.1073/pnas.97.8.3786. [DOI] [PMC free article] [PubMed] [Google Scholar]
- Vollrath MA, Eatock RA. Time course and extent of mechanotransducer adaptation in mouse utricular hair cells: comparison with frog saccular hair cells. J Neurophysiol. 2003;90:2676–2689. doi: 10.1152/jn.00893.2002. [DOI] [PubMed] [Google Scholar]
- Wackym PA, Chen CT, Ishiyama A, Pettis RM, Lopez I, Hoffman L. Muscarinic acetylcholine receptor subtype mRNAs in the human and rat vestibular periphery. Cell Biol Int. 1996;20:187–192. doi: 10.1006/cbir.1996.0023. [DOI] [PubMed] [Google Scholar]
- Wang HS, Pan Z, Shi W, Brown BS, Wymore RS, Cohen IS, Dixon JE, McKinnon D. KCNQ2 and KCNQ3 potassium channel subunits: molecular correlates of the M-channel. Science. 1998;282:1890–1893. doi: 10.1126/science.282.5395.1890. [DOI] [PubMed] [Google Scholar]
- Wimmers S, Wulfsen I, Bauer CK, Schwarz JR. Erg1, erg2 and erg3 K channel subunits are able to form heteromultimers. Pflügers Arch. 2001;441:450–455. doi: 10.1007/s004240000467. [DOI] [PubMed] [Google Scholar]
- Wong WH, Hurley KM, Eatock RA. Differences between the negatively activating potassium conductances of mammalian cochlear and vestibular hair cells. J Assoc Res Otolaryngol. 2004;5:270–284. doi: 10.1007/s10162-004-4051-4. [DOI] [PMC free article] [PubMed] [Google Scholar]
- Yus-Najera E, Munoz A, Salvador N, Jensen BS, Rasmussen HB, Defelipe J, Villarroel A. Localization of KCNQ5 in the normal and epileptic human temporal neocortex and hippocampal formation. Neuroscience. 2003;120:353–364. doi: 10.1016/s0306-4522(03)00321-x. [DOI] [PubMed] [Google Scholar]
- Zheng JL, Gao WQ. Analysis of rat vestibular hair cell development and regeneration using calretinin as an early marker. J Neurosci. 1997;17:8270–8282. doi: 10.1523/JNEUROSCI.17-21-08270.1997. [DOI] [PMC free article] [PubMed] [Google Scholar]