

Abstract
Synchronized firing among neurons in the working brain is inferred to reflect coding by cell assemblies, which dynamically change their sizes and functional connections to encode various information. It therefore follows that, if synchronized firing reflects cell-assembly coding, it should show dynamic changes that depend on the tasks and events being processed and on the distance between the neurons. By using unique spike-sorting and multi-neuronal recording methods, we investigated such dynamics of synchrony in the prefrontal cortex of monkeys while they were successively performing two tasks in which working memory for either stimulus duration or color was required. Forty-eight percent of 1405 neuronal pairs showed firing synchrony during the performance of the tasks. Almost half of such neuronal pairs showed fixed synchrony and constantly fired together in both tasks. However, some neuronal pairs showed task-dependent synchrony that appeared in only one of the tasks. Moreover, the other neuronal pairs showed event-task-dependent synchrony that appeared during stimulus or retention periods in the tasks, but the periods showing synchrony varied between the tasks. Fixed synchrony and task-dependent synchrony were mostly observed among neighboring neurons and showed little variation of spike timings; the event-task-dependent synchrony, in contrast, was more often detected among distant neurons with larger variation of spike timings than the other two types of synchrony. These results suggest that some closely neighboring neurons have dynamic and sharp synchrony to represent certain situations (tasks), whereas some distant neurons show more dynamic and unstable synchronous firing to represent quickly changing events being processed in working memory.
Keywords: cell assembly, cross-correlation, spike sorting, tetrode, temporal information, multiple neuron
Introduction
Synchronized firing among neurons in the working brain was inferred to reflect “cell assembly” (Hebb, 1949) and has now been demonstrated in several brain regions (Abeles et al., 1993; Eichenbaum, 1993; Vaadia et al., 1995; Riehle et al., 1997; Engel et al., 2001; Harris, 2005). The cell assembly is a local and functional population of neurons and dynamically changes its size and functional connections to encode various types of information (Sakurai, 1999). If synchronized firing truly reflects cell-assembly coding, it should show dynamic changes that depend on tasks and events being processed and on the distance among the neurons.
This assumption, however, has not been fully tested yet because of two technical problems. The first is that it is difficult to separate extracellular activities from closely neighboring neurons, because their spike waveforms sometimes overlap on a common electrode when they fire coincidently. Ordinary spike-sorting techniques cannot separate such overlapping spikes (Lewicki, 1994), making it impossible to detect synchrony in a population of neighboring neurons. The second problem is that variability of individual neuronal activities are inevitable in the working brain, and averaging many spikes to reliably show firing correlations among neurons is hard during short periods of stimulus and internal events.
We recently solved the first problem and introduced a unique method of spike sorting using a combination of independent component analysis (ICA) and k-means clustering (Takahashi et al., 2003a,b). This method solves the spike-overlapping problem and the “non-stationary waveform problem” (Fee et al., 1996) and can sort activities of closely neighboring neurons in behaving animals. We also solved the second problem using chronically implanted and movable tetrodes with microdrives (Sakurai, 1993, 1994, 1996a, 2002; Wilson and McNaughton, 1993). This enables long-term recording of multiple neurons, which gives us much spike data to construct reliable averaged correlograms even for short periods of events in tasks.
In the present study, by using the unique methods of spike sorting and multi-neuronal recording, we investigated the dynamic synchronized firing among closely neighboring and distant neurons while monkeys were performing two working-memory tasks. Our previous behavioral study (Sakurai, 2001) has shown that these two tasks are appropriate to compare processes of working memory for different, temporal and nontemporal, information of the stimuli. The recording site was the prefrontal cortex (PFC), because PFC has been suggested to be crucial for higher functions (Miller, 1999, 2000), especially for processes of temporal information (Fuster, 2001; Onoe et al., 2001), and several intriguing studies have reported behavior-dependent synchrony (Abeles et al., 1993; Vaadia et al., 1995; Seidemann et al., 1996) and working-memory related correlations (Constantinidis et al., 2001) of PFC neurons. Although our previous electrophysiological study (Sakurai et al., 2004) showed that the PFC had specific single neurons whose discharges reflected encoding or retention of the temporal information of stimuli in the present working-memory tasks, those task-related single neurons were very few and their differential discharges were low. It is necessary, as Sakurai et al. (2004) suggested, to investigate coding by neuronal assemblies instead of single neurons during the same tasks.
Materials and Methods
Subjects.
Two female rhesus monkeys (Macaca mulatta, Primate Research Institute of Kyoto University, Inuyama, Japan) weighing ∼5.0 kg during the experiment were used. The monkeys were able to obtain their daily requirement of water in the laboratory in the form of supplement water (sports drink) as a reward during training or recording sessions. As necessary, they received supplemental water, sweet potatoes, and fruit in their home cages to keep their weight stable. Water was given ad libitum at least 1 d/week in the cages. All experiments were performed in accordance with the National Institutes of Health Guidelines for Care and Use of Laboratory Animals and Kyoto University Primate Research Institute Guide for Care and Use of Laboratory Primates.
Apparatus.
In a dim, sound-attenuated and electrically shielded room (Dana, Tokyo, Japan), the monkey sat in a primate chair (Nakazawa, Tokyo, Japan) facing a 17-inch color display monitor. A response lever was set just in front of the monkey's arms in the chair. A multichannel amplifier system (Nihon Kohden, Nagoya, Japan) amplified extracellular neuronal activity. The neuronal data were stored in a multichannel data-recording system (TEAC, Nagoya, Japan) for analysis. An infrared high sampling-rate (4 ms) eye-camera system (RMS, Hirosaki, Japan) was used for monitoring and recording the monkey's eye position and movement. The signals from the eye-camera system were stored in the multichannel data-recording system with neuronal data.
Behavioral tasks.
Each of the monkeys was trained on two working-memory tasks, which have been fully described in our previous behavioral study (Sakurai, 2001) (supplemental Fig. 1, available at www.jneurosci.org as supplemental material). The task to assess working memory for stimulus duration, i.e., temporal information, was delayed matching-to-sample of duration (DMS-D). The other task to assess working memory for nontemporal information was delayed matching-to-sample of color (DMS-C). In both tasks, the monkey initiated each trial by pressing the lever. This turned on a white fixation spot (2°) on the center of the display. The monkey needed to continue fixating the fixation spot and to depress the lever to complete the trial. After a variable time interval (0.3–1.5 s) from the fixation spot on, a sample stimulus (a square of 10°) appeared for 0.5 or 2.0 s, then the fixation spot appeared for 3 s (retention interval), and a comparison stimulus (a square of 10°) appeared for 0.5 or 2.0 s. After the end of the comparison stimulus, the fixation spot appeared for a variable time interval (0.3–1.5 s), then it shrank to 0.7° for 1.0 s, and returned to 2° for 1.0 s. The monkey had to release the lever when the fixation spot shrank (go response) to get a reward on a nonmatch trial and had to release the lever when the fixation spot returned to 2° (no-go response) to get a reward on a match trial. The reward was a drop of 0.3 cc sports drink delivered on both correct go and correct no-go responses. The sequence of stimuli and responses were identical between the two tasks, except that the sample and comparison stimuli were always green in the DMS-D task but red or blue, randomly selected on each trial, in the DMS-C task. The to-be-compared attributes of sample and comparison stimuli for match/nonmatch judgments were their durations (0.5 and 2.0 s) in the DMS-D task and their colors (red and blue) in the DMS-C task. That is, in the DMS-D task, the monkeys encoded the duration of the sample stimuli, retained them during the retention intervals, and compared them with the duration of the comparison stimuli. In the DMS-C task, the same monkeys encoded the color of the sample stimuli, retained them during the retention intervals, and compared them with the color of the comparison stimuli in the DMS-C task. The duration of samples and comparisons were not relevant to correct performance.
Eye-movement monitoring and analysis.
Eye positions and movements were monitored and recorded using an infrared high sampling-rate eye-camera system while the monkeys performed the tasks. The system generated analog output signals showing magnitude and directions (horizontal X and vertical Y) of eye movement every 4 ms. The signals were stored in the data-recording system with neuronal activity data. We tested correlations of eye movements and neuronal activity by constructing histograms of spike-triggered averaging of X and Y signals of eye movements.
Electrode construction and implantation.
Neuronal recording was performed with tetrodes (Wilson and McNaughton, 1993), each of which was composed of four tungsten microwires (20 μm in diameter; California Fine Wire, Grover Beach, CA) (supplemental Fig. 2, available at www.jneurosci.org as supplemental material). The four microwires were mounted in a 33 gauge stainless cannula (Small Parts, Miami, FL) with ∼500 μm of tip protruding. The tip was cut at right angles with sharp surgical scissors. The tip impedance was ∼400 KΩat 1 kHz. Six cannulas with tetrodes were attached in a row to construct an array of tetrodes, with a center-to-center spacing between the cannulas of ∼500 μm. The array of tetrodes was mounted on a microdrive assembly (McNaughton et al., 1989; Sakurai, 1993, 1994, 1996a, 2002) designed to allow fine movements of the cannulas with tetrodes and stable recording of multi-neuronal activity for extended periods. After completion of the behavioral training, the monkey was anesthetized with sodium pentobarbital, and the microdrive with an array of tetrodes was chronically implanted over the areas of the principal sulcus of the prefrontal cortex of the left or right hemisphere. After puncturing the exposed dura mater, the tetrode tips were implanted to a depth of ∼500 μm into the cortex. The craniotomy was filled with White Petrolatum to a level just above the exit of the tetrodes from the cannulas. After coating the supports of the microdrive and cannulas with a thin film of White Petrolatum, the entire assembly was embedded in dental cement.
Neuronal recording.
At ∼10 d after the surgery, the implanted tetrodes were lowered into the brain using the microdrive. The tetrodes were lowered in steps of 40 μm, with pauses of ∼1 min between the steps to avoid moving the brain tissue around the tetrodes. The number of steps needed to detect multi-neuronal activity depended on the location of the tetrodes, but the maximum number of steps in 1 d was 10 (400 μm) to minimize the pressure applied to the brain tissue attributable to the lowering of the tetrodes. The detected activity from the tetrodes was judged to be multi-neuronal if its peak amplitude was more than two times greater than the noise (i.e., the signal-to-noise ratio was >2.0). When multi-neuronal activity was detected, the monkey was returned to its home cage, and, if it was still present after 2 or more hours, it was judged to be stable and suitable for recording. Then the multi-neuronal activity was recorded, as well as stored, in the data-recording system at a 10 kHz sampling rate throughout 2 h, during which the monkeys performed ∼300 trials of the DMS-D task for 1 h and then performed ∼300 trials of the DMS-C task for 1 h. There was no rest interval between the two tasks. The trials of the DMS-D and DMS-C tasks were not interleaved because the interleaved trials lowered the monkey's correct performance and they stopped performing the tasks in much shorter periods than 2 h.
Spike-sorting and firing rate histograms.
The multi-neuronal activity recorded in the data-recording system was then stored in computer memory and separated to single neuronal activities by our recently developed automatic sorting method (described in detail by Takahashi et al., 2003a,b). All separated single neuronal activities were included in the analysis. The automatic sorting method combines ICA and the efficiency of the ordinary spike-sorting technique (k-means clustering). First, multi-neuronal activities are sorted into an overly large number of clusters by k-means clustering. Second, the sorted clusters are decomposed by ICA. Third, the decomposed clusters are progressively aggregated into a minimal set of putative single neurons based on similarities of basis vectors estimated by ICA. This method is not a waveform classification technique and can rule out the possibility of spike clustering errors that arise when separating spikes from a single neuron, which generates spike bursts and attenuated waveforms. Our previous studies (Takahashi et al., 2003a,b) have already shown that the method solves the problems of overlapping and nonstationarity of spike waveforms with no limitation on the number of single neurons to be separated. As in those previous studies, all separated clusters of spikes in the present datasets were identified as single neuronal activities if their autocorrelation functions indicate clear refractory periods (1–2 ms) and their waveforms had parameters (spike height, spike width, positive-peak angle, negative-peak valley, etc.) that could be plotted in individual clusters.
Because the shuffle subtraction and Poisson statistics for the following cross-correlation analysis of neuronal pairs could be problematic if the spike rates are not stationary across repeated trials (Brody, 1998), we examined the stationarity of spike rates for all separated single neurons by calculating their coefficients of variation (CVs) (i.e., mean/SD × 100, of firing rates across all trials for the DMS-D and DMS-C tasks). For the short (0.5 s) sample stimuli and comparison stimuli, the total periods of the stimuli were included for the analysis. For the long (2.0 s) sample stimuli and comparison stimuli, only the final 0.5 s periods of the stimuli were included for the analysis to make the length of all trials in which neuronal spikes were counted equal. As a consequence, periods of 4 s for each trial [i.e., sample stimulus (0.5 s) + retention interval (3.0 s) + comparison stimulus (0.5 s)], were analyzed to calculate CVs. The stationarity of each neuron was then statistically tested by calculating the Z-score of the CV for each neuron.
The single neuronal activity was collected from all trials on which correct performance was obtained during ∼2 h per recording session, from which the firing rate histograms of individual neurons were constructed. Types of task-related specific neurons based on the firing rate histograms have been reported in our previous study (Sakurai et al., 2004). Histograms of spike-triggered averaging of X and Y signals of eye movements confirmed that none of the single neurons showed significant (Z score >1.98) activity correlations to eye movements during the tasks.
Cross-correlation analysis and correlograms.
Cross-correlation analysis (Perkel et al., 1967) is one of the most reliable and intelligible methods to detect activity correlations and show synchrony among the neurons in behaving animals (Ahissar et al., 1992; Sakurai, 1993, 1996a, 2002). Correlations in the activity between neurons reveal the number of instances in which the discharge of one neuron is followed by the discharge in another neuron. This analysis was performed on each pair of the simultaneously recorded activities of neurons and gave a set of correlograms by the same procedure as in our previous studies (Sakurai, 1993, 1996a, 2002). Correlograms were separately computed for each of the periods of sample stimulus (0.5 or 2 s), retention (3 s), and comparison stimulus (0.5 or 2 s) in the DMS-D and DMS-C tasks and averaged for all trials on which correct responses were conducted in each session (300 trials) for the DMS-D and DMS-C tasks. Consequently, six correlograms were computed on each pair of neurons by averaging 240–270 trials for each task.
To eliminate the effects of stimulus onset and offset on activity correlations (“stimulus correlation”), shuffled correlograms (Toyama et al., 1981; Hata et al., 1988) were constructed and subtracted from the original correlograms. All results reported here refer to such subtracted cross-correlograms, that is, “difference correlograms” (Ahissar et al., 1992). To test whether the revealed synchrony, appearing as peaks in the center of the difference cross-correlograms, are statistically significant, a band of 99.5% confidence limits (Abeles, 1982) for the equivalent, independent Poisson processes is shown for each difference correlogram. The upper and lower confidence limits of the statistical test are calculated as follows. Under the null hypothesis that the neuron fires at a constant average rate and that this firing rate is independent of the history of the neuron firing and other events, including the firing of other neurons expected to be independent Poisson processes, the average number of spikes in shuffled cross-correlogram in each bin (0.1 ms) is expected to be x = λ/N. λ is the number of whole spikes in the shuffled cross-correlogram, and N is the number of bins in the shuffled cross-correlogram. Under these assumptions, the probability of finding m spikes in the bin is given by the Poisson formula.
 |
Then the lower confidence line is set at one less than the smallest m for
 |
and the upper confidence limit is the smallest m for
 |
The peak in difference correlogram is defined as significant synchrony when more than one bin (1 ms) is above 1.5 times the band between the upper and lower confidence limits.
An additional control of the cross-correlation analysis was done with the interval statistics and cross-correlograms using interspike interval shuffling, not the firing rate shuffling, for the samples of neuronal pairs. This control constructed difference correlograms after interspike interval shuffling was subtracted. Moreover, an additional control was applied to the neuron pairs when the cross-correlation analysis revealed significant zero-lag peaks in the correlograms to exclude the possibility of contamination of spikes from different neurons in the correlograms. The analysis separated spikes contributing to the sharp zero-lag peaks in ±1 ms around the zero from each of the neuronal pairs, then applied the present spike sorting to the spikes from those temporally separated neurons, and determined whether the correlated and uncorrelated spikes exhibited any systematic differences in waveforms.
Histology.
We used standard histological procedures to construct maps of all penetrations in the PFC. The monkeys were killed under deep sodium pentobarbital anesthesia and perfused with saline and 10% Formalin. The brains were removed, and serial (coronary) sections of 0.08 mm thickness were prepared. Penetrations of cannulas with tetrodes were normalized against the arcuate sulcus and principal sulcus. The locations of tetrode tips and tracks in the brain were identified with the aid of a stereotaxic atlas (Paxinos et al., 2000).
Results
Behavior
Median probabilities of correct responses of the monkeys during the recording sessions were 84% (range, 82–87%) in the DMS-D task and 83% (range, 81–89%) in the DMS-C task. Median reaction times were 0.42 s (range, 0.38–0.55 s) for go response (elapsed time until releasing the lever after the fixation spot shrinks) and 0.45 s (range, 0.37–0.58 s) for no-go responses (lapsed time until releasing the lever after the fixation spot returns).
Stability of recording
The distribution of the signal-to-noise ratios of the present datasets is ∼2.0–4.0. Figure 1 is an example of multi-neuronal activities detected by a tetrode (ch. 1–ch. 4) in the start and end periods of the DMS-D and the DMS-C tasks. The peak amplitudes and constituents of spikes showed no change across the periods and the tasks. All multi-neuronal activities analyzed in the present study showed such constancy and had the same independent components representing single neurons in both tasks, which means that the same neurons were recorded and analyzed across the two tasks. The unique recording procedure of the present study ensures such stability of recording (see Materials and Methods).
Figure 1.

An example of multi-neuronal activities detected by a tetrode (ch. 1–ch. 4) in the start and end periods of the DMS-D and the DMS-C tasks.
Performance of the spike sorting method
As in our previous studies (Takahashi et al., 2003a,b), our spike-sorting method was able to separate single neurons from the multi-neuronal activities even when they had overlapping spikes and attenuating waveforms caused by spike bursts. Figure 2 shows a detailed example of the raw data, which includes plots of the raw signals from a single tetrode at both slow (Fig. 2A) and fast (Fig. 2B) timescales. The tetrode data are the same as in Figure 1 and have several single neurons. The box of dotted lines in Figure 2B is a period when spikes from two of the neurons overlap. Figure 2C shows the overlapped and separated waveforms of spikes from the two neurons. This example indicates that the present method can separate the single neuronal spikes even when they sometimes overlap. Figure 3 shows an example of the raw data of a single neuron separated by the present method from the tetrode data shown in Figures 1 and 2. It includes a scatter plot of the spike clusters (Fig. 3A), averaged waveforms recorded from each of the four microwires (ch.) of the tetrode (Fig. 3B), and the autocorrelogram of firing of the neuron (Fig. 3C). The peaks on both sides of zero in the autocorrelogram (Fig. 3C) indicate that the neuron generates spike bursts, and the widely distributed points in the cluster (Fig. 3A) indicate that the spike bursts caused waveform attenuation. Even at the two points of spikes most distant from each other (a, b), which implies large differences in their waveforms, the serial patterns of waveforms on the four microwires of the tetrode are similar (Fig. 3B), and the correlation coefficient between the waveform patterns of the plots for a and b is 0.75. Besides such waveform consistency, the clear refractory period in Figure 3C indicates that the cluster is from a single neuron. This example is a strong indication that the present method can separate single neurons even when they generate spike bursts that cause waveform attenuations.
Figure 2.
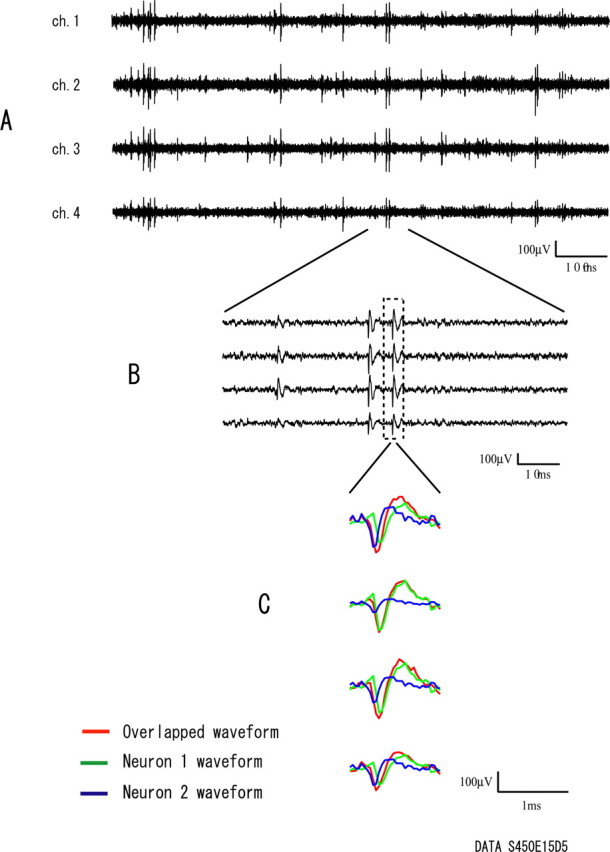
A detailed example of the raw signals from a single tetrode at slow (A) and fast (B) timescales. The tetrode data are the same as in Figure 1. The box of dotted lines (B) is a period when spikes from two of the single cells included in the tetrode data overlap. C, Overlapped and separated waveforms for the overlapping spikes.
Figure 3.

An example of the raw data of a single neuron separated by the present method from the tetrode data shown in Figures 1 and 2. The neuronal activity was recorded across all trials during the tasks. A, Scatter plot of the spike cluster. Each black point in the scatter plot represents a spike. The x- and y-axes represent valley amplitudes of spikes detected by ch. 1 and ch. 4, respectively, of the four tetrode chs. B, Averaged waveforms recorded from each ch. of the tetrode at the two plots of spikes (a, b). C, Autocorrelogram of firing of the single neuron. Bin width is 0.5 ms. The horizontal values indicate time in milliseconds, and the ordinate values are accumulated numbers of spikes per bin.
Samples of single neurons and neuronal pairs
The number of recording sites of the tetrode arrays was 64 in total. Twenty-four was in one monkey and 40 was in the other monkey. On average per recording site, 3.2 tetrodes of an array of six tetrodes simultaneously recorded multiple neurons, and each tetrode recorded 3.8 single neurons. The range of CV of firing rates of the recorded single neurons was 28.1–929.9. Neurons for which spike rates showed a significant lack of stationarity across the trials compared with the other neurons were excluded from the final analysis, i.e., when the Z-score was >1.96 (p < 0.05) in either one of the tasks. As a consequence, the number of samples of single neurons used in the analysis was 514 from the PFC of both hemispheres of the two monkeys.
Only neuronal pairs from one tetrode or two adjacent tetrodes ∼500 μm apart were included in the samples of neuron pairs for analysis because the neurons from two tetrodes >1000 μm apart showed few correlations of activity, as a former study (Constantinidis et al., 2001) investigating effects of electrode distance on cross-correlations has already reported. Like the former study investigating correlated firing of PFC neurons (Constantinidis et al., 2001), neuronal pairs whose combined total numbers of discharges were <1000 in one or more correlograms in a set of the six correlograms (see Material and Methods) were excluded, because constructing reliable averaging correlograms requires large enough numbers of neuronal discharges. Neuronal pairs whose combined total numbers of discharges in three correlograms for one task (DMS-D or DMS-C) were twice or more of those for the other task (DMS-D or DMS-C) were also excluded from the data, because large differences in the numbers of spikes affect the detection of correlations (Brody, 1998) and might make it inaccurate to compare synchrony between the two tasks. Consequently, the total number of neuronal pairs for the final analysis was 1405, in which 787 pairs (56%) were recorded within one tetrode and 618 pairs (44%) were recorded between two adjacent tetrodes.
Types of synchrony in correlograms
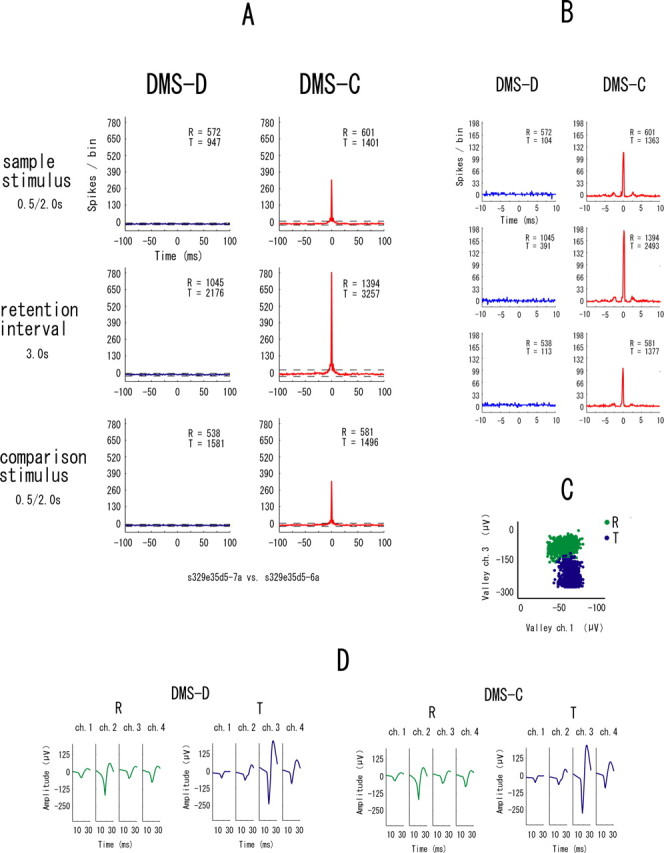
Forty-eight percent of the total 1405 neuronal pairs showed significant synchrony during performance of the tasks. Figure 4A is an example of the correlograms obtained from a neuron pair during the three event periods, i.e., sample stimulus, retention interval, and comparison stimulus, when the monkey was performing the DMS-D and DMS-C tasks. This pair consisting of the reference and target neurons showed clear synchrony in all event periods and in both tasks. This type of synchrony is referred to “fixed synchrony.”
Figure 4.
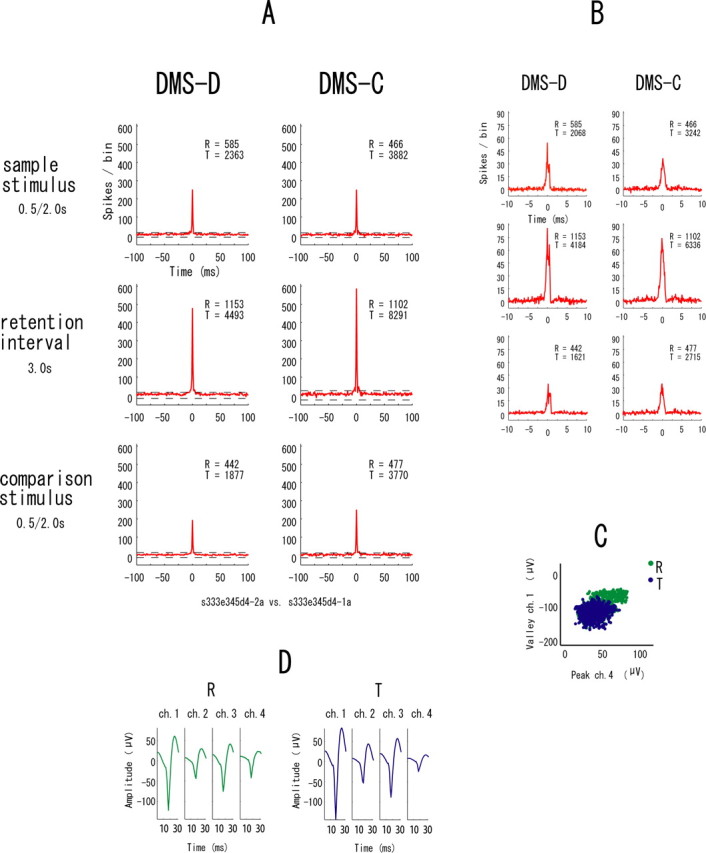
A, An example of difference correlograms from a pair of neurons showing the fixed synchrony. The correlograms were constructed for the three event periods (sample stimulus, retention interval, and comparison stimulus) during the two tasks (DMS-D and DMS-C). Each correlogram represents the number of spikes per bin that occurred in one neuron (target neuron) before and after spikes in another neuron (reference neuron). Bin width is 1 ms. The horizontal values indicate time in milliseconds between −100 and + 100, and the ordinate values are accumulated numbers of spikes per bin. A band of 99.5% confidence limits (Abeles, 1982) is shown by broken lines. Red correlograms mean that they have significant synchrony, defined as those with more than one bin above 1.5 times the band between the upper and lower confidence limits in each correlogram. The right top portion of each correlogram shows the total number of spikes obtained from the reference neuron (R) and target neuron (T) of the pair to calculate the correlograms. The bottom of the figure shows the data identification. The neurons of this pair were recorded from one tetrode. B, Difference correlograms at higher temporal resolution to show detailed structures of the peaks. Bin width is 0.1 ms, and the range of the horizontal values is −10 and + 10 ms. C, An example of scatter plots of spike clusters from the two neurons of the pair. The x- and y-axes represent peak amplitude of spikes detected by ch. 4 and valley amplitude of spikes detected by ch. 1, respectively, of the four tetrode chs. Green and blue points represent the reference (R) and target (T) neurons, respectively. Twenty-eight types of scatter plots of spike clusters (peak amplitude × valley amplitude × 4 chs.) were made for each neuron, and this is one example showing the separated clusters. D, Averaged waveforms of the two neurons recorded from each ch. of the tetrode across all trials of the tasks. Green and blue waveforms represent the reference (R) and target (T) neurons, respectively.
Figure 4B shows higher temporal resolution correlograms to illustrate the detailed structures of the peaks in Figure 4A. They indicate that the synchrony between the neurons has narrow zero-lag peaks and is nearly simultaneous. Figure 4C is a result of the clustering analysis of spike waveforms from the two neurons of the pair. Figure 4D shows averaged waveforms of the two neurons across all trials of the tasks. Figure 4C, indicates that the neurons of the pair had attenuated waveforms and are not clearly separated by these two-dimensional displays. The present spike-sorting method, however, could separate the single neurons despite their attenuation and two-dimensional similarity (see above, Performance of the spike sorting method).
Figure 5 shows spike rasters of each neuron of the pair shown in Figure 4. The data were obtained in one (DMS-D) of the tasks. Because the trial periods were not regular as a result of changes in sample length and comparison stimuli, the rasters are grouped into four periods, i.e., short sample stimulus and the following retention interval [3.5 s (Fig. 5A)], long sample stimulus and the following retention interval [5 s (Fig. 5B)], short comparison stimulus [0.5 s (Fig. 5C)], and long comparison stimulus [2 s (Fig. 5D)], for each task. In both the reference (R) and target (T) neurons, the rasters show no notable changes of spike rates across the trials of the task. The neurons of the other samples of neuronal pairs also showed no clear changes of spike rates during the tasks.
Figure 5.

Spike rasters and averaged histograms of the reference (R) and target (T) neurons of the pair shown in Figure 4. The spike data were collected in the total period of the DMS-D task. The numbers of collected trials for each raster display and histogram are 110–130. The ordinate values of the histograms represent spikes per second. A bin is 100 ms. The thick lines below the histograms represent the periods of the sample stimuli, the retention intervals, and the comparison stimuli, respectively. A, Periods of the short sample stimulus and the following retention interval. B, Periods of long sample stimulus and the following retention interval. C, Periods of short comparison stimulus. D, Periods of long comparison stimulus.
Figure 6, A and B, are the raw and the shuffled correlograms, respectively, before constructing the difference correlograms of the neuronal pair in Figure 4. Because the patterns of correlations in Figure 6A are quite similar to those in Figure 4A and the shuffled correlograms in Figure 6B are almost flat, stimulus onset and offset effects on the synchrony in the difference correlograms are little. The patterns of correlations were similar between the difference correlograms and the raw correlograms for the other samples of neuronal pairs. Figure 6C shows correlograms constructed with interspike interval shuffling (see Materials and Methods) for the neuronal pair in Figure 4. The type of synchrony in Figure 6C is quite similar to that in Figure 4A, and the types of synchrony revealed by the interval statistics were not different from the results obtained from the firing rate statistics for the other samples of neuronal pairs. Figure 6, D and E, is the result of the additional analysis to further exclude the possibility of contamination of spikes from different neurons (see Materials and Methods). In both the reference (R) and target (T) neurons, the waveforms of the spikes that contributed to the sharp zero-lag peaks in the correlograms (Fig. 6D) are almost identical with those that did not contribute to the peaks (Fig. 6E), suggesting that there was no contamination of different neurons in any of the separated neurons. In all samples of neuron pairs that had peaks in their correlograms, the additional analysis showed that the correlated and uncorrelated spikes in each correlogram exhibited no systematic differences in waveforms.
Figure 6.
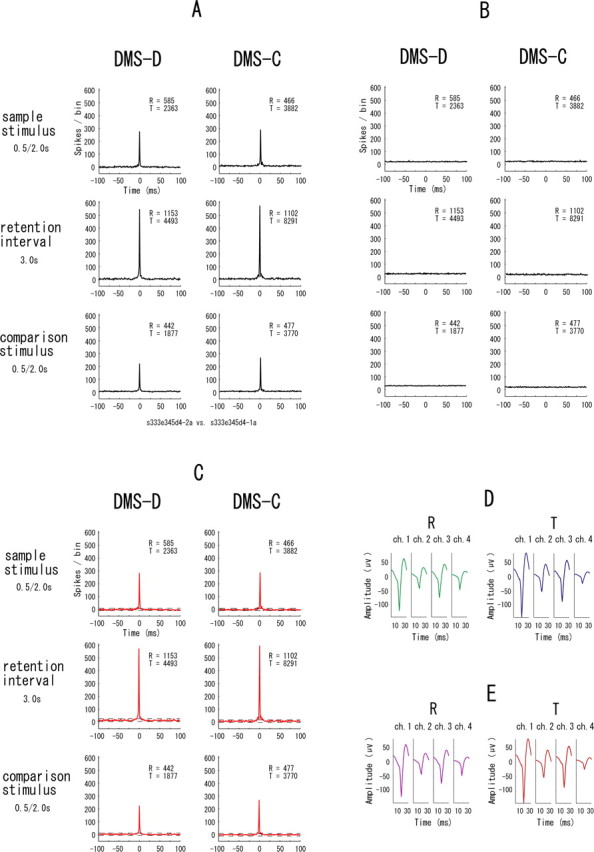
Raw (A) and shuffled (B) correlograms of the neuronal pair before constructing the difference correlograms in Figure 4A. All parameters and symbols are as in Figure 4A. C, Correlograms constructed with interspike interval shuffling for the neuronal pair in Figure 4. Red correlograms mean that they have significant synchrony above the upper confidence limits in each correlogram. D, Averaged waveforms of the spikes from the reference (R) and target (T) neurons that contributed to the zero-lag peaks in ±1 ms around the zero in the correlograms in Figure 4A. E, Averaged waveforms of the spikes from the reference (R) and target (T) neurons that did not contribute to the zero-lag peaks in the correlograms in Figure 4A.
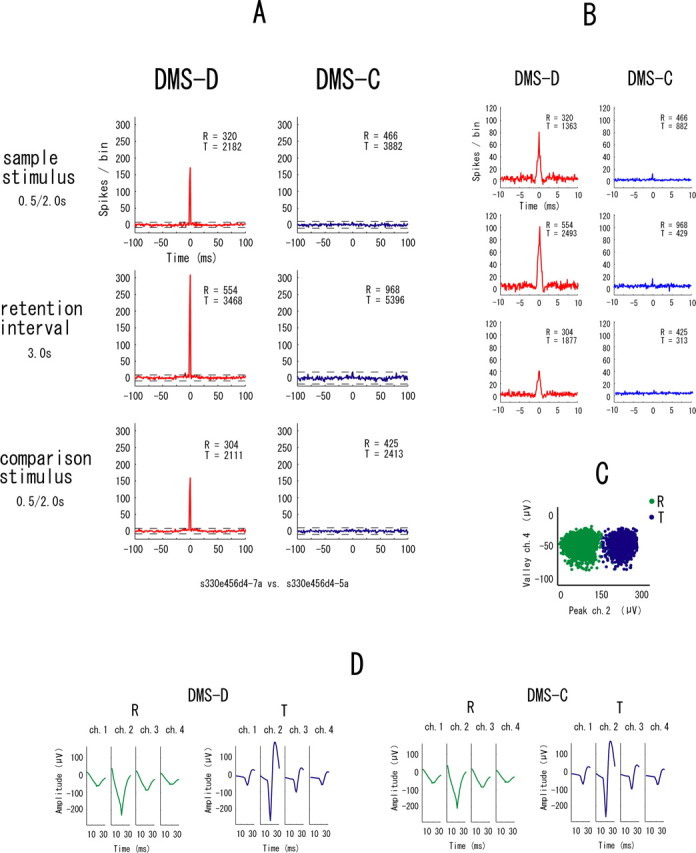
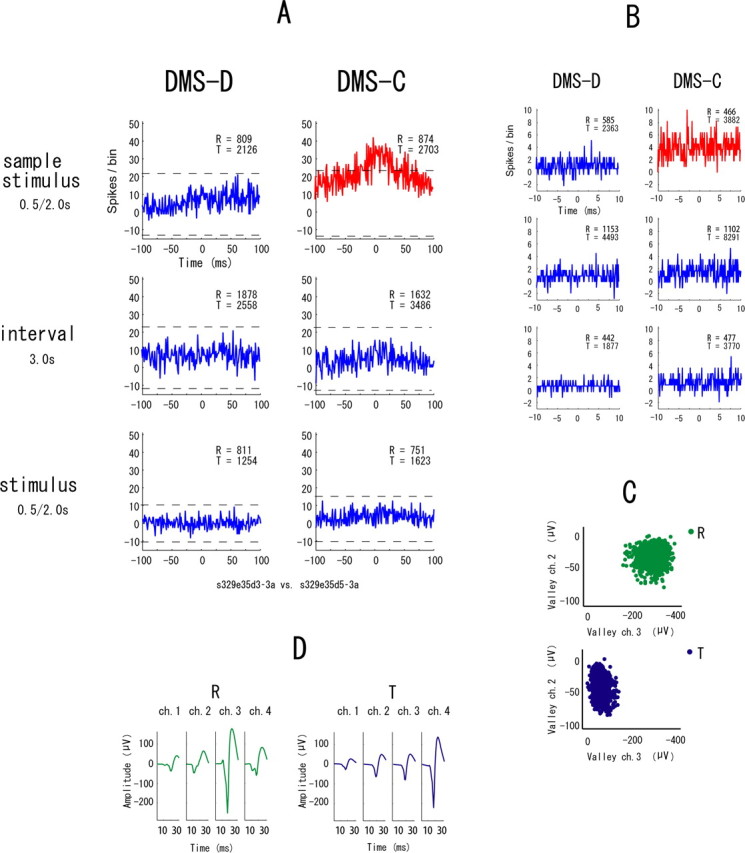
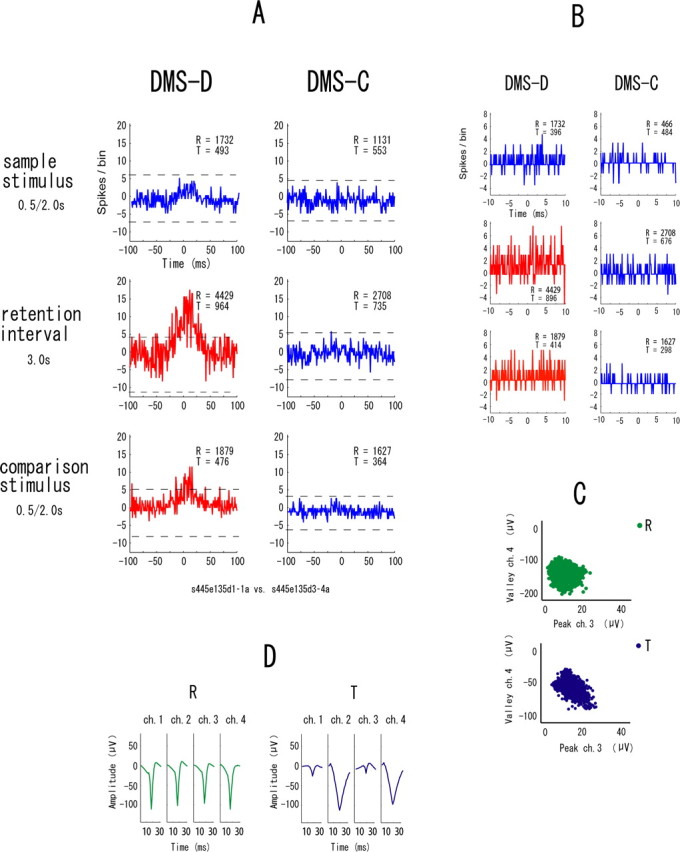
The example in Figure 7 shows synchronization in all event periods in only the DMS-D task. Figure 8 is another example of neuronal pairs showing such synchrony but in only the DMS-C task. These types of synchrony are referred to “task-dependent synchrony.” The higher temporal resolution correlograms in Figures 7B and 8B indicate that the synchrony between these neurons has narrow zero-lag peaks and the neurons fired nearly simultaneously. To make doubly sure that the same neurons were recorded in both tasks, waveforms are shown separately for the two tasks in these examples of task-dependent synchrony (Figs. 7D, 8D). The synchronization in the examples in Figure 9 appears in one of the event periods in either task. These types are referred to “event-task-dependent synchrony,” because the event periods in one of the DMS-D and DMS-C tasks show synchrony. Some neuronal pairs with event-task-dependent synchrony showed synchronized firing in one event period (Fig. 9) and other neuronal pairs showed it in two event periods (Fig. 10), but the event periods were different between the tasks in all neuronal pairs showing the event-task-dependent synchrony. The higher temporal resolution correlograms in Figures 9B and 10B indicate that the event-task-dependent synchrony of these neuronal pairs had broad peaks and fluctuated around the zero peak. Figure 11 shows an example of neuronal pairs between non-adjacent tetrodes that were >1000 μm apart. No synchrony was found in such neuronal pairs. The data from the non-adjacent tetrodes are not included in the sample of neuronal pairs for the analysis described above (see Samples of single neurons and neuronal pairs).
Figure 7.
An example of neuronal pairs showing the task-dependent synchrony in the DMS-D task. A–D, All parameters and symbols are as in Figure 4. The neurons of this pair were recorded from one tetrode. Averaged waveforms (D) are shown separately for the two tasks in this example.
Figure 8.
An example of neuronal pairs showing the task-dependent synchrony in the DMS-C task. A–D, All parameters and symbols are as in Figure 4. The neurons of this pair were recorded from one tetrode. Averaged waveforms (D) are shown separately for the two tasks in this example.
Figure 9.
An example of neuronal pairs showing the event-task-dependent synchrony in one event period. A–D, All parameters and symbols are as in Figure 4. The neurons of this pair were recorded from two different tetrodes, and the spike clusters are plotted in the different scatter plots (C).
Figure 10.
An example of neuronal pairs showing the event-task-dependent synchrony in two event periods. A–D, All parameters and symbols are as in Figure 4. The neurons of this pair were recorded from two tetrodes, and the spike clusters are plotted in the different scatter plots (C).
Figure 11.
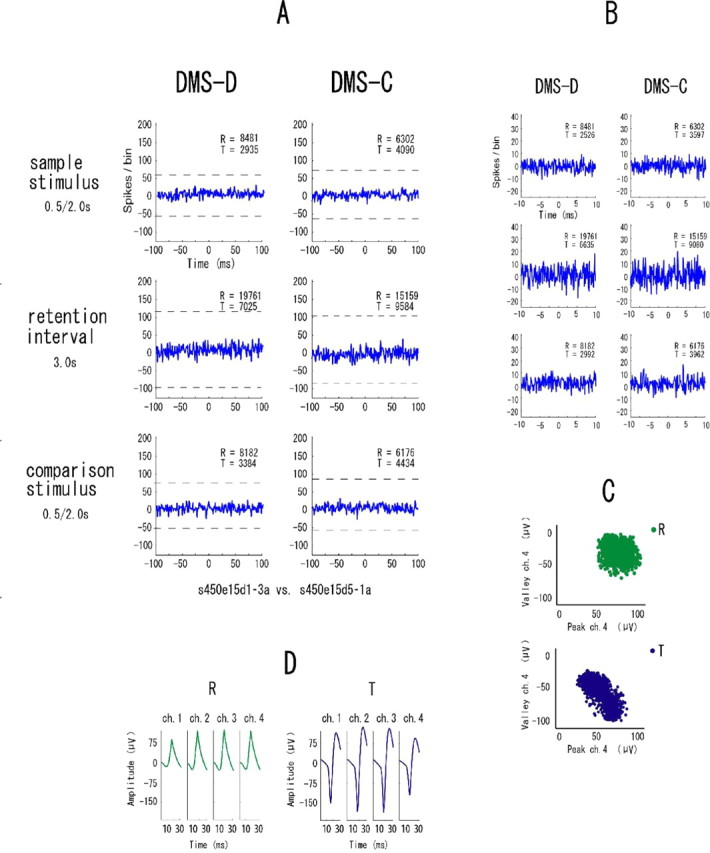
An example of pairs of neurons recorded between non-adjacent tetrodes, separated by >1000 μm. All parameters and symbols are as in Figure 4.
Proportions and properties of synchrony
Figure 12A summarizes the proportions of the neuronal pairs that showed fixed synchrony, task-dependent synchrony, event-task-dependent synchrony, and no synchrony among the total neuronal pairs recorded. Forty-eight percent of the total 1405 neuronal pairs showed some synchrony, and the remaining 52% showed no synchrony.
Figure 12.

A, Proportions of the neuronal pairs showing fixed synchrony, task-dependent synchrony, event-task-dependent synchrony, and no synchrony to the total neuronal pairs (1405) analyzed. The values in parentheses are numbers of neuronal pairs. B, Proportions of the neuronal pairs showing task-dependent synchrony in the DMS-D and DMS-C tasks. C, Proportions of the neuronal pairs showing event-task-dependent synchrony in the three event periods in the DMS-D (left) and DMS-C (right) tasks. An asterisk means significantly different proportions between the event periods.
The task-dependent synchrony appears in either the DMS-D task or the DMS-C task (Figs. 7, 8). Figure 12B shows the proportions of the neuronal pairs showing the task-dependent synchrony in the DMS-D task or the DMS-C task. There is no significant difference between the proportions. The event-task-dependent synchrony appears in one or two event periods in either task. Figure 12C illustrates the proportions of the neuronal pairs that showed event-task-dependent synchrony in each of the three event periods, i.e., sample stimulus, retention interval, and comparison stimulus, in the DMS-D and DMS-C tasks. Because some of those neuronal pairs showed synchrony in two event periods, the total percentages in the panels are >100%. In both DMS-D and DMS-C tasks, there are significant differences among the event periods (Fig. 12C) (DMS-D, x2 = 27.83, df = 2, p < 0.001; DMS-C, x2 = 36.48, df = 2, p < 0.001), and the proportions in the retention interval are higher than in the other event periods (between sample stimulus and retention interval in the DMS-D, x2 = 18.44, df = 1, p < 0.001; between comparison stimulus and retention interval in the DMS-D, x2 = 21.52, df = 1, p < 0.001; between sample stimulus and retention interval in the DMS-C, x2 = 18.81, df = 1, p < 0.001; between comparison stimulus and retention interval in the DMS-C, x2 = 30.44, df = 1, p < 0.001).
Synchrony in a tetrode and between tetrodes
We divided all neuronal pairs showing synchrony into two groups: one is of neuronal pairs recorded from one tetrode, and the other is of neuronal pairs from two adjacent tetrodes. Figure 13 summarizes the proportions of neuronal pairs that showed the fixed, task-dependent, and event-task-dependent synchrony recorded from one tetrode (Fig. 13A) and from two tetrodes (Fig. 13B). By comparing Figure 13, A and B, it is apparent that most of the neuron pairs in all types of synchrony were recorded from one tetrode. The neuronal pairs in Figures 4, 7, and 8 are examples of such neuronal pairs. The type of event-task-dependent synchrony, however, has fewer neuronal pairs recorded from one tetrode (Fig. 13A) (among the types of synchrony, x2 = 34.69, df = 2, p < 0.001; between fixed synchrony and event-task-dependent synchrony, x2 = 30.34, df = 1, p < 0.001; between task-dependent synchrony and event-task-dependent synchrony, x2 = 14.75, df = 1, p < 0.001) and more neuronal pairs recorded from two tetrodes (Fig. 13B) (among the types of synchrony, x2 = 39.66, df = 2, p < 0.001; between fixed synchrony and event-task-dependent synchrony, x2 = 33.65, df = 1, p < 0.001; between task-dependent synchrony and event-task-dependent synchrony, x2 = 16.02, df = 1, p < 0.001) than the other types of synchrony. Figures 9 and 10 are examples of such neuronal pairs.
Figure 13.

A, B, Proportions of the neuronal pairs showing fixed synchrony, task-dependent synchrony, and event-task-dependent synchrony recorded from one tetrode (A) and two tetrodes (B). White bars, Proportions of the neuronal pairs showing sharp synchrony. Gray bars, Proportions of the neuronal pairs showing broad synchrony. The values in parentheses are numbers of neuronal pairs (the denominators are the total neuronal pairs showing each synchrony). An asterisk above the bar means significantly different proportion between the types of synchrony.
Sharp and broad synchrony
The sharpness of the synchrony was various among the neuronal pairs. However, proportions of the distributions of peak widths at the level of the confidence limit in all neuronal pairs showing the synchrony indicated that they could be divided into very narrow or wider peaks (1–9 ms, 81%; 10–49 ms, 1%; 50–99 ms, 11%; 100–149 ms, 5%; 150–200 ms, 2%). Therefore, we classified the synchrony peaks as either sharp or broad. The former is defined as a narrow significant peak (<10 ms width at the level of confidence limit), and the latter is defined as a wide significant peak (≥10 ms width at the level of confidence limit) in the correlograms. We then divided the total neuronal pairs showing synchrony into two groups, sharp synchrony or broad synchrony. Figure 13 also illustrates the proportions of neuronal pairs with the sharp and broad synchrony in the neuronal pairs recorded from one or two tetrodes. In all types of synchrony, it is clear that most of the neuron pairs showing sharp synchrony were recorded from one tetrode (Fig. 13A). Figures 4, 7, and 8 are examples of such neuronal pairs. Conversely, most of the neuronal pairs showing broad synchrony were recorded from two tetrodes (Fig. 13B). Figures 9 and 10 are clear examples of such neuronal pairs.
Relations to task-related single neurons
In the previous study (Sakurai et al., 2004), we analyzed the modification of firing rates of single neurons in the present database and reported several types of task-related specific neurons whose firing rates reflect encoding or retention of the temporal information of stimuli in the present tasks. The proportions, however, of the task-related single neurons in the total number of recorded neurons are very low (2.0–4.9%) (Sakurai et al., 2004, their Table 1). Therefore, in the present study analyzing firing correlations among the single neurons, almost all of the neuronal pairs comprised task-unrelated single neurons, and we found no significant relationship between the types of task-related single neurons and the types of synchrony.
Recorded sites
Figure 14 illustrates the anatomical locations of tracks of the cannula rows of the tetrodes (Fig. 14A) and an example of the stained histological section, which shows one of the tracks (Fig. 14B). The cannula rows were inserted in both hemispheres, but the tracks are combined and drawn on the left hemisphere. The tetrodes were moved a total of 5–8 mm from the cortex surfaces and were left in the cortices for 40–54 d for the entire period of the experiment. These procedures made small tracks of the tetrodes in the brain tissues (Fig. 14B) but did not cause large damage or lead to infection.
Figure 14.

A, Anatomical locations of tracks of the cannula rows of the tetrodes. The cannula rows were inserted in both hemispheres, but the tracks are combined and drawn on the left hemisphere (constructed from Paxinos et al., 2000, reprinted with permission). B, An example of the stained histological section that shows one of the tracks.
Each of the neuronal pairs showing the three types of synchrony was distributed over a wide area in the recorded region of the principal sulcus, i.e., areas 9/46D, 46D, and 46V of the atlas (Paxinos et al., 2000). No neuronal pairs showing specific types of synchrony were localized to any specific region of the principal sulcus.
Discussion
Dynamic synchrony and cell assembly
The present study reports that the monkey PFC has functional populations of neurons with different properties of effective connectivity (Aertsen et al., 1989) revealed by firing correlations. One type of population consists of neurons that usually fire synchronously with each other. Neuronal pairs showing fixed synchrony (Fig. 4) are members of such a population. The other type of population consists of neurons that also fire synchronously with each other, but the synchrony dynamically changes depending on the type of information to be processed, i.e., tasks and events. The neuronal pairs showing the task-dependent synchrony (Figs. 7, 8) and the event-task-dependent synchrony (Figs. 9, 10) are members of such populations. These functional populations comprising neurons with dynamic functional connectivity among them can be called cell assemblies.
The task-dependent synchrony of the neuronal pairs was not dominant in either the DMS-D task or the DMS-C task (Fig. 12B). This indicates that the cell assemblies in the PFC are not biased to process one specific type of information, i.e., temporal (DMS-D) or color (DMS-C) information of the stimuli, for working memory. The event-task-dependent synchrony appears during the sample stimulus, retention intervals, or comparison stimulus in the tasks. This dynamic synchrony could be detected only by the present method of long-term recording, which uses much spike data to construct reliable averaged correlograms even for the short event periods (a few seconds) in the tasks. We found no event-task-dependent synchrony that appeared in any same event periods in both tasks. It appeared in different event periods between the tasks or in one or two event periods in one of the tasks (Figs. 9, 10). This means that the event-task-dependent synchrony depends not on the physical attributes of the events, i.e., stimulus presentation or interstimulus intervals, which are common for both tasks, but on information attributes of the events, i.e., encoding, retention, and/or comparison of valid information, which are different between the tasks. Moreover, the synchrony was more often observed during the retention intervals than during the sample stimulus and the comparison stimulus (Fig. 12C). Therefore, the cell assemblies reflected by the event-task-dependent synchrony among the neurons are suggested to more often underlie retention of information in the retention periods. Such synchronous firings during the retention intervals might represent the reverberating circuits that, according to the cell-assembly concept, retain information in working memory.
Since the pioneering studies of Kubota and Niki (1971) and Fuster (1973), many studies have revealed that PFC neurons retain some stimulus attributes and identity (Fuster, 1997; Watanabe, 1998; Sakagami and Tsutsui, 1999; Funahashi, 2001; Iba and Sawaguchi, 2003) and to-be-conducted-next responses (Matsumoto et al., 2003). Besides those individual neuronal discharges of the PFC, the firing synchrony among the neurons in the present study also supports the above notion. To further clarify the functional significance of the event-task-dependent synchrony, it is desirable to obtain the synchrony separately for the different attributes of stimuli of each event, i.e., for short and long stimuli in the DMS-D task and blue and red stimuli in the DMS-C task. Computing such separate correlograms, however, resulted in constructing more separated correlograms for each pair of neurons for each task, most of which had much fewer spikes and showed no reliable averaging correlations between the neurons. More long-term recordings to obtain more spike data to construct reliable averaged correlations, even for the different attributes of stimuli, will be needed.
Although approximately half of the neuronal pairs with firing synchrony showed the dynamic task-dependent or event-task-dependent synchrony that reflects coding by cell assemblies, the remaining half showed fixed synchrony (Figs. 4, 12A). Almost all of the neuronal pairs showing fixed synchrony were recorded from one tetrode and had sharp peaks of correlation (Fig. 13A). These results suggest that some of the closely neighboring neurons recorded from one tetrode may fire together with highly synchronous timings. These constantly coactive neighboring neurons may be parts of cell assemblies together with neurons that have dynamic functional connectivity and provide functional redundancy and compensation for the cell-assembly coding against death or destruction of the individual neurons. The present study, however, compared only two behavioral tasks, and the fixed synchrony might be unfixed if more behavioral tasks are tested.
Although the neuronal pairs with fixed synchrony always showed significant peaks, the height of the synchrony, i.e., connectivity strength and contribution, varied among the event periods and/or the tasks (Fig. 4). Such changes of the strength of synchrony should be taken into account. Precise comparison of the strength, however, requires that almost equal numbers of spikes between the periods be compared, because variations in the number of spikes could affect the height and shapes of peaks in the correlograms. The present datasets had some variations in the numbers of spikes among the event periods and/or the tasks and did not provide any reliable suggestions concerning the change of the strength of synchrony.
Synchrony and distance among the neurons
The present study used spike sorting with a combination of ICA and k-means clustering and multi-neuronal recording with tetrodes. The spike-sorting method is not a waveform classification technique. It can rule out the possibility of spike clustering errors that arise when the data have waveform attenuation attributable to spike bursts and can make it possible to separate neuronal firings from closely neighboring single neurons that generate overlapping spikes (Takahashi et al., 2003a,b). Therefore, although the former intriguing study (Constantinidis et al., 2001) using an ordinary method of spike sorting has already reported the effects of electrode distance on cross-correlation interactions among monkey PFC neurons, the present study is the first that reports firing synchrony among closely neighboring neurons and its comparison with the synchrony among distant neurons.
Most of the neuron pairs recorded from one tetrode showed firing synchrony of all types (Fig. 13A). According to the simultaneous intracellular and extracellular recordings (Henze et al., 2000), the diameter of the recording area of one tetrode is ∼100 μm. This indicates that the neighboring neurons in an area of ∼100 μm tend to fire synchronously whether or not the synchrony is dynamic. Almost all of the neighboring neurons recorded from one tetrode had sharp peaks of synchrony (Figs. 4, 7, 8, 13). This indicates that spike timings among the neurons comprising a small localized cell assembly are very constant with little variation. A small number of neuronal pairs recorded from two tetrodes 500 μm apart showed firing synchrony (Figs. 9, 10), and the event-task-dependent synchrony was observed in more of the distant neuronal pairs than were the other types of synchrony (Fig. 13). This suggests that some of the cell assemblies reflected by the event-task-dependent synchrony might comprise more distant neurons. The long-distance and multisynaptic connections among the neurons might make it possible to dynamically change the effective connectivity in a time period on the order of 1 s in a trial period of the tasks. The larger variation of spike timings in the broad synchrony between distant neurons (Figs. 9, 10) might contribute to the dynamic changes of the effective connectivity.
Single neurons and synchrony in ensemble coding by cell assemblies
The type of firing synchrony among neurons during behavioral tasks often depends on the type of task-related firing modification of the individual neurons, because cell assemblies can consist of task-related single neurons (Sakurai, 1996b, 1999). This possibility is the “dual-coding” hypothesis proposed in several previous studies (Krüger and Becker, 1991; Arieli et al., 1996; Sakurai, 1996a,b; de Oliveira et al., 1997; Riehle et al., 1997; Sakurai, 2002). This hypothesis suggests that single neurons encode the types of incoming stimuli and cell assemblies encode the types of tasks, situations, contexts, and/or inner cognitive functions, to process the incoming stimuli. The present study showed the task-dependent synchrony among the PFC neurons and supports the notion that cell assemblies encode the types of tasks. Our previous study (Sakurai et al., 2004) examined the modification of firing rates of the individual neurons in the present database and found several types of task-related neurons thought to encode or retain the temporal information of stimuli in the present working-memory tasks. However, the numbers of those task-related single neurons were very small (see Results), which means that almost all of the neuronal pairs in the present study comprised task-unrelated single neurons. We also found no significant relationship between the small numbers of the task-related single neurons and the types of synchrony. These results suggest that pairs of task-unrelated single neurons showed all of the types of firing synchrony in the present study. Dynamic synchrony and fixed synchrony of firing among task-unrelated neurons possibly play a principal role in the ensemble coding by cell assemblies, particularly for working memory in the present study, as Sakurai et al. (2004) already suggested, and very slight modulation of firing rates of the individual neurons generally does not contribute to the ensemble with many neurons.
Many electrophysiological studies, conversely, have consistently revealed high proportions of task-related single neurons in the monkey PFC that is active in several working-memory tasks (Fuster, 1997; Watanabe, 1998; Sakagami and Tsutsui, 1999; Hoshi et al., 2000; Funahashi, 2001; Iba and Sawaguchi, 2003). Notably, Constantinidis et al. (2001) reported not only many task-related PFC neurons during working-memory (oculomotor delayed response) task but also the dependence of correlated firing on the functional properties of those single neurons by means of cross-correlation analysis. As the recording sites, the dorsolateral and principal sulcus areas of the PFC in the present study are not very different from the sites in the former studies, the specific task demand, i.e., working memory for temporal and nontemporal events in the two tasks, could be a reason for the different results. Besides that, the paucity of task-related neurons in the present tasks might have been caused by the fact that the monkeys were not fully trained, because the median probabilities of correct responses were 83–84% (see Results). It is possible that the task performance was already supported by the ensemble activities of many task-unrelated neurons, which, after more training, could later become task-related neurons.
Footnotes
This work was supported by the Research for the Future Program, the Target-Oriented Research Program, the 21st Century Center of Excellence Program, and the Core Research for Evolutional Science and Technology program (Y.S.). We thank Masato Inoue and members of the Primate Research Institute for assistance in surgery and histology.
References
- Abeles M. Quantification smoothing and confidence limits for single-units' histograms. J Neurosci Methods. 1982;5:317–325. doi: 10.1016/0165-0270(82)90002-4. [DOI] [PubMed] [Google Scholar]
- Abeles M, Bergman H, Margalit E, Vaadia E. Spatiotemporal firing patterns in the frontal cortex of behaving monkeys. J Neurophysiol. 1993;70:1629–1638. doi: 10.1152/jn.1993.70.4.1629. [DOI] [PubMed] [Google Scholar]
- Aertsen AM, Gerstein GL, Habib MK, Palm G. Dynamics of neuronal firing correlation: modulation of “effective connectivity”. J Neurophysiol. 1989;61:900–917. doi: 10.1152/jn.1989.61.5.900. [DOI] [PubMed] [Google Scholar]
- Ahissar M, Ahissar E, Bergman H, Vaadia E. Encoding of sound-source location and movement: activity of single neurons and interactions between adjacent neurons in the monkey auditory cortex. J Neurophysiol. 1992;67:203–215. doi: 10.1152/jn.1992.67.1.203. [DOI] [PubMed] [Google Scholar]
- Arieli A, Sterkin A, Grinvald A, Aertsen A. Dynamics of ongoing activity: explanation of the large variability in evoked cortical responses. Science. 1996;273:1868–1871. doi: 10.1126/science.273.5283.1868. [DOI] [PubMed] [Google Scholar]
- Brody CD. Slow covariations in neuronal resting potentials can lead to artefactually fast cross-correlations in their spike trains. J Neurophysiol. 1998;80:3345–3351. doi: 10.1152/jn.1998.80.6.3345. [DOI] [PubMed] [Google Scholar]
- Constantinidis C, Franowicz MN, Goldman-Rakic PS. Coding specificity in cortical microcircuits: a multiple-electrode analysis of primate prefrontal cortex. J Neurosci. 2001;21:3646–3655. doi: 10.1523/JNEUROSCI.21-10-03646.2001. [DOI] [PMC free article] [PubMed] [Google Scholar]
- de Oliveira SC, Thiele A, Hoffmann K. Synchronization of neuronal activity during stimulus expectation in a direction discrimination task. J Neurosci. 1997;17:9248–9260. doi: 10.1523/JNEUROSCI.17-23-09248.1997. [DOI] [PMC free article] [PubMed] [Google Scholar]
- Eichenbaum H. Thinking about brain cell assemblies. Science. 1993;261:993–994. doi: 10.1126/science.8351525. [DOI] [PubMed] [Google Scholar]
- Engel AK, Fiees P, Singer W. Dynamic predictions: oscillations and synchrony in top-down processing. Nat Rev Neurosci. 2001;2:704–716. doi: 10.1038/35094565. [DOI] [PubMed] [Google Scholar]
- Fee M, Mitra P, Kleinfeld D. Variability of extracellular spike waveforms of cortical neurons. J Neurophysiol. 1996;76:3823–3833. doi: 10.1152/jn.1996.76.6.3823. [DOI] [PubMed] [Google Scholar]
- Funahashi S. Neuronal mechanisms of executive control by the prefrontal cortex. Neurosci Res. 2001;39:147–165. doi: 10.1016/s0168-0102(00)00224-8. [DOI] [PubMed] [Google Scholar]
- Fuster JM. Unit activity in prefrontal cortex during delayed-response performance: neuronal correlates of transient memory. J Neurophysiol. 1973;36:61–78. doi: 10.1152/jn.1973.36.1.61. [DOI] [PubMed] [Google Scholar]
- Fuster JM. Ed 3. New York: Raven; 1997. The prefrontal cortex. [Google Scholar]
- Fuster JM. The prefrontal cortex—an update: time is of the essence. Neuron. 2001;30:319–333. doi: 10.1016/s0896-6273(01)00285-9. [DOI] [PubMed] [Google Scholar]
- Harris KD. Neural signatures of cell assembly organization. Nat Rev Neurosci. 2005;6:399–407. doi: 10.1038/nrn1669. [DOI] [PubMed] [Google Scholar]
- Hata Y, Tsumoto T, Sato K, Hagihara K, Tamura H. Inhibition contributes to orientation selectivity in visual cortex of cat. Nature. 1988;335:815–817. doi: 10.1038/335815a0. [DOI] [PubMed] [Google Scholar]
- Hebb DO. New York: Wiley; 1949. The organization of behavior: a neuropsychological theory. [Google Scholar]
- Henze D, Borhegyi Z, Csicsvari J, Mamiya A, Harris K, Buzsaki G. Intracellular features predicted by extracellular recordings in the hippocampus in vivo. J Neurophysiol. 2000;84:390–400. doi: 10.1152/jn.2000.84.1.390. [DOI] [PubMed] [Google Scholar]
- Hoshi E, Shima K, Tanji J. Neuronal activity in the primate prefrontal cortex in the process of motor selection based on two behavioral rules. J Neurophysiol. 2000;83:2355–2373. doi: 10.1152/jn.2000.83.4.2355. [DOI] [PubMed] [Google Scholar]
- Iba M, Sawaguchi T. Involvement of the dorsolateral prefrontal cortex of monkeys in visuospatial target selection. J Neurophysiol. 2003;89:587–599. doi: 10.1152/jn.00148.2002. [DOI] [PubMed] [Google Scholar]
- Krüger J, Becker JD. Recognizing the visual stimulus from neuronal discharges. Trends Neurosci. 1991;14:281–286. doi: 10.1016/0166-2236(91)90138-k. [DOI] [PubMed] [Google Scholar]
- Kubota K, Niki H. Prefrontal cortical unit activity and delayed alternation performance in monkeys. J Neurophysiol. 1971;34:337–347. doi: 10.1152/jn.1971.34.3.337. [DOI] [PubMed] [Google Scholar]
- Lewicki M. Bayesian modelling and classification of neural signals. Neural Comput. 1994;6:1005–1030. [Google Scholar]
- Matsumoto K, Suzuki W, Tanaka K. Neuronal correlates of goal-based motor selection in the prefrontal cortex. Science. 2003;301:229–232. doi: 10.1126/science.1084204. [DOI] [PubMed] [Google Scholar]
- Miller EK. The prefrontal cortex: complex neural properties for complex behavior. Neuron. 1999;22:15–17. doi: 10.1016/s0896-6273(00)80673-x. [DOI] [PubMed] [Google Scholar]
- Miller EK. The prefrontal cortex and cognitive control. Nat Rev Neurosci. 2000;1:59–65. doi: 10.1038/35036228. [DOI] [PubMed] [Google Scholar]
- McNaughton BL, Barnes CA, Meltzer J, Sutherland RJ. Hippocampal granule cells are necessary for normal spatial learning but not for spatially-selective pyramidal cell discharge. Exp Brain Res. 1989;76:485–496. doi: 10.1007/BF00248904. [DOI] [PubMed] [Google Scholar]
- Onoe H, Komori M, Onoe K, Takeuchi H, Tsukada H, Watanabe Y. Cortical networks recruited for time perception: a monkey positron emission tomography (PET) study. NeuroImage. 2001;13:37–45. doi: 10.1006/nimg.2000.0670. [DOI] [PubMed] [Google Scholar]
- Paxinos G, Huang X-F, Toga AW. New York: Academic; 2000. The rhesus monkey brain in stereotaxic coordinates. [Google Scholar]
- Perkel DH, Gerstein GL, Moore GP. Neuronal spike trains and stochastic point processes 2 simultaneous spike trains. Biophys J. 1967;7:419–440. doi: 10.1016/S0006-3495(67)86597-4. [DOI] [PMC free article] [PubMed] [Google Scholar]
- Riehle A, Grün S, Diesmann M, Aertsen A. Spike synchronization and rate modulation differentially involved in motor cortical function. Science. 1997;278:1950–1953. doi: 10.1126/science.278.5345.1950. [DOI] [PubMed] [Google Scholar]
- Sakagami M, Tsutsui K. The hierarchical organization of decision making in the primate prefrontal cortex. Neurosci Res. 1999;34:79–89. doi: 10.1016/s0168-0102(99)00038-3. [DOI] [PubMed] [Google Scholar]
- Sakurai Y. Dependence of functional synaptic connections of hippocampal and neocortical neurons on types of memory. Neurosci Lett. 1993;158:181–184. doi: 10.1016/0304-3940(93)90259-n. [DOI] [PubMed] [Google Scholar]
- Sakurai Y. Involvement of auditory cortical and hippocampal neurons in auditory working memory and reference memory in the rat. J Neurosci. 1994;14:2606–2623. doi: 10.1523/JNEUROSCI.14-05-02606.1994. [DOI] [PMC free article] [PubMed] [Google Scholar]
- Sakurai Y. Hippocampal and neocortical cell assemblies encode memory processes for different types of stimuli in the rat. J Neurosci. 1996a;16:2809–2819. doi: 10.1523/JNEUROSCI.16-08-02809.1996. [DOI] [PMC free article] [PubMed] [Google Scholar]
- Sakurai Y. Population coding by cell assemblies: what it really is in the brain. Neurosci Res. 1996b;26:1–16. doi: 10.1016/0168-0102(96)01075-9. [DOI] [PubMed] [Google Scholar]
- Sakurai Y. How do cell assemblies encode information in the brain? Neurosci Biobehav Rev. 1999;23:785–796. doi: 10.1016/s0149-7634(99)00017-2. [DOI] [PubMed] [Google Scholar]
- Sakurai Y. Working memory for temporal and nontemporal events in monkeys. Learn Mem. 2001;8:309–316. doi: 10.1101/lm.43901. [DOI] [PMC free article] [PubMed] [Google Scholar]
- Sakurai Y. Coding of temporal information by hippocampal individual cells and cell assemblies in the rat. Neuroscience. 2002;115:1153–1163. doi: 10.1016/s0306-4522(02)00509-2. [DOI] [PubMed] [Google Scholar]
- Sakurai Y, Takahashi S, Inoue M. Stimulus duration in working memory is represented by neuronal activity in the monkey prefrontal cortex. Eur J Neurosci. 2004;20:1069–1080. doi: 10.1111/j.1460-9568.2004.03525.x. [DOI] [PubMed] [Google Scholar]
- Seidemann E, Meilijson I, Abeles M, Bergman H, Vaadia E. Simultaneously recorded single units in the frontal cortex go through a sequence of discrete and stable states in monkeys performing a delayed localization task. J Neurosci. 1996;16:752–768. doi: 10.1523/JNEUROSCI.16-02-00752.1996. [DOI] [PMC free article] [PubMed] [Google Scholar]
- Takahashi S, Anzai Y, Sakurai Y. Automatic sorting for multi-neuronal activity recorded with tetrodes in the presence of overlapping spikes. J Neurophysiol. 2003a;89:2245–2258. doi: 10.1152/jn.00827.2002. [DOI] [PubMed] [Google Scholar]
- Takahashi S, Anzai Y, Sakurai Y. A new approach to spike sorting for multi-neuronal activities recorded with a tetrode: how ICA can be practical. Neurosci Res. 2003b;46:265–272. doi: 10.1016/s0168-0102(03)00103-2. [DOI] [PubMed] [Google Scholar]
- Toyama K, Kimura M, Tanaka K. Cross-correlational analysis of interneuronal connectivity in cat visual cortex. J Neurophysiol. 1981;46:191–201. doi: 10.1152/jn.1981.46.2.191. [DOI] [PubMed] [Google Scholar]
- Vaadia E, Haalman I, Abeles M, Bergman H, Prut Y, Slovin H, Aertsen A. Dynamics of neuronal interactions in monkey cortex in relation to behavioural events. Nature. 1995;373:515–518. doi: 10.1038/373515a0. [DOI] [PubMed] [Google Scholar]
- Watanabe M. Cognitive and motivational operations in primate prefrontal neurons. Rev Neurosci. 1998;9:225–241. doi: 10.1515/revneuro.1998.9.4.225. [DOI] [PubMed] [Google Scholar]
- Wilson MA, McNaughton BL. Dynamics of the hippocampal ensemble code for space. Science. 1993;261:1055–1058. doi: 10.1126/science.8351520. [DOI] [PubMed] [Google Scholar]