

Abstract
Although prostaglandin E2 (PGE2) has a broad spectrum of biological activities that have been confirmed by previous studies, the roles of PGE2 in synaptic plasticity such as long-term potentiation (LTP) in the CNS have yet to be characterized in detail. The present results of electrophysiological and biochemical studies indicated that PGE2 is actually produced in acute visual cortex slices in response to theta-bust stimulation (TBS) and is involved postsynaptically in TBS-induced LTP. RNA interference (RNAi) for PGE2 receptor subtypes EP2 and EP3, which are known to upregulate and downregulate the level of cAMP, respectively, induced significant decreases and increases of LTP, respectively. Moreover, analysis of the localization of receptor subtypes at the membrane surface or cytosol showed that stimuli such as TBS regulate the trafficking of EP2 and EP3 between the membrane and cytosol of the postsynapses, rising up to and leaving the membrane, respectively, resulting in increased and decreased expression of EP2 and EP3 at the membrane, respectively. Increased activation of EP2 and decreased activation of EP3 by PGE2 synergistically induce an increase in cAMP level, which may induce LTP. This causes activation of CREB (cAMP response element-binding protein) in the postsynaptic cells, which may be involved in the maintenance of LTP. These observations indicate that in TBS-induced LTP of the visual cortex, PGE2 is released from the postsynaptic cells and then activates PGE2 receptors at the postsynaptic membranes, which is regulated by trafficking of the differential PGE2 receptor subtypes in an activity-dependent bidirectional manner.
Keywords: activity, RNAi, cAMP, PKA, COX-2, synaptic plasticity
Introduction
Long-term potentiation (LTP), defined as the persistent enhancement in synaptic transmission efficacy, is induced by a particular type of stimulus such as theta-burst stimulation (TBS) (Bliss and Collingridge, 1993; Malenka and Nicoll, 1999; Lisman, 2003; Lynch, 2004). In the visual cortex, TBS application to presynaptic cells of layer IV activates the NMDA receptor (NMDAR), a glutamate receptor subtype, in postsynaptic cells of layer II/III, followed by Ca2+ influx into the cytosol (Tsumoto, 1992; Bear and Kirkwood, 1993). This increase in intracellular Ca2+ concentration triggers the activation of multiple signaling cascades including those of Ca2+-dependent protein kinases. In these cascades, cytosolic phospolipase-A2 (cPLA2) is activated, resulting in the production of arachidonic acid (AA) from phospholipids in membranes (Farooqui et al., 1997). In turn, cyclooxygenases, primarily consisting of constitutive cyclooxygenase-1 (COX-1) and inducible cyclooxygenase-2 (COX-2), metabolize AA to an unstable intermediate, prostaglandin H2 (PGH2), which is immediately converted to prostaglandin E2 (PGE2), PGF2α, PGD2, prostacyclin, and thromboxane by corresponding syntheses. Although the activity of COX-1 is invariable, COX-2 is induced in neurons in an activity-dependent manner (Kaufmann et al., 1996) and is involved in LTP (Yamagata et al., 1993). Recently, Bazan and colleagues reported that COX-2 and PGE2 are probably involved in LTP in the hippocampus (Chen et al., 2002; Chen and Bazan, 2005; Sang et al., 2005). However, whether or which prostaglandins are involved, how this lipid signaling downstream of the production of AA participates in LTP of the visual cortex, and whether AA is independently involved in LTP remain to be elucidated.
EP1, EP2, EP3, and EP4 have been identified as subtypes of the PGE2 receptor (Narumiya et al., 1999). Agonist binding to these receptor subtypes induces signal transduction via secondary messengers such as cAMP in a G-protein-coupled manner. The activation of EP1 elevates the levels of intracellular inositol phosphate and Ca2+ (Watabe et al., 1993), whereas the activation of EP2 or EP4 stimulates adenylate cyclase, resulting in increased levels of intracellular cAMP (Jumblatt and Paterson, 1991). Conversely, the activation of EP3 inhibits adenylate cyclase (Sugimoto et al., 1992). Although many studies using gene-knockout mice for EP1–4 have been performed, functions of PGE2 in synaptic plasticity have not yet been reported (Narumiya and FitzGerald, 2001). Genetic manipulation, such as the generation of knock-out mice, is useful in characterizing one gene or a few genes; however, it has some shortcomings. We previously developed a new RNA interference (RNAi) technique using small interfering RNAs (siRNAs) and local electroporation targeting the brain region, termed RNAi-induced gene silencing by local electroporation (RISLE); its advantage is its capability to target several genes without spending much time or labor (Akaneya et al., 2005). In the present study, RISLE was used to knockdown targets such as COX-1, COX-2, and EP1–4.
Here, we examined the involvement of PGE2 in LTP in the visual cortex, and found that two types of PGE2 receptor were translocated in opposite directions to and from membranes in response to TBS, so as to synergistically enhance LTP.
Materials and Methods
Preparation of siRNAs.
Targets for each rat COX-1, COX-2, or EP1–4 siRNA were designed with reference to the National Center for Biotechnology Information (NCBI) library, and the uniqueness of the sequences was ascertained using the NCBI nucleotide BLAST (Basic Local Alignment Search Tool) program. The sense and antisense oligonucleotides used were as follows: iRCOX-1a (antisense), AACCCAGGGTGTCTGTGTCCGCCCTGTCTC; iRCOX-1a (sense), AAGCGGACACAGACACCCTGGCCTGTCTC; iRCOX-1b (antisense), AACTGTACTATCCCTGAGATCCCTGTCTC; iRCOX-1b (sense), AAGATCTCAGGGATAGTACAGCCTGTCTC; iRCOX-2a (antisense), AAGTGTACTACGCCGAGATTCCCTGTCTC; iRCOX-2a (sense), AAGAATCTCGGCGTAGTACACCCTGTCTC; iRCOX-2b (antisense), AACACAGTACACTACATCCTGCCTGTCTC; iRCOX-2b (sense), AACAGGATGTAGTGTACTGTGCCTGTCTC; iREP1a (antisense), AACGGCACATCACCAGCGCTGCCTGTCTC; iREP1a (sense), AACAGCGCTGGTGATGTGCCGCCTGTCTC; iREP1b (antisense), AACGTGCTGGCGCTGGCGCTGCCTGTCTC; iREP1b (sense), AACAGCGCCAGCGCCAGCACGCCTGTCTC; iREP2a (antisense), AACCTCATCGCGCTGGCACTGCCTGTCTC; iREP2a (sense), AACAGTGCCAGCGCGATGAGGCCTGTCTC; iREP2b (antisense), AAGCCCGGTGGTGCTGGCTTCCCTGTCTC; iREP2b (sense), AAGAAGCCAGCACCACCGGGCCCTGTCTC; iREP3a (antisense), AACGCGCTGGCCATGTTGCTTCCTGTCTC; iREP3a (sense), AAAAGCAACATGGCCAGCGCGCCTGTCTC; iREP3b (antisense), AACGCAAAAAGTCTTTCCTGCCTTCCTGTCTC; iREP3b (sense), AAGCAGGAAAGACTTTTTGCGCTTCCTGTCTC; iREP4a (antisense), AAGTCGCGCAAGGAGCAGAAGCCTGTCTC; iREP4a (sense), AACTTCTGCTCCTTGCGCGACCCTGTCTC; iREP4b (antisense), AACGTGCTCTTCTGCGCACTGCCTGTCTC; iREP4b (sense), AACAGTGCGCAGAAGAGCACGCCTGTCTC.
The underlined eight nucleotides indicate the region complementary to the T7 promoter primer. Sense and antisense oligonucleotide pairs were annealed and then filled in with Klenow DNA polymerase using a Silencer siRNA Construction kit in accordance with the manufacturer’s instructions (Ambion, Austin, TX). These double-stranded oligonucleotide templates were transcribed with T7 RNA polymerase and hybridized. After RNase digestion, a mixture of two (a and b) siRNAs was used for transfection. In the experiments in which the introduction of siRNA into neurons was confirmed with immunohistochemical stainings, Cy3-conjugated siRNA (iREP2a antisense) was used.
Animals and anesthesia.
The experimental procedures were performed in accordance with the regulations of the Animal Care Committee of the Osaka University Graduate School of Medicine. Sprague Dawley rats, postnatal day 14–21 (P14–P21), were used in the present study, except for the experiments, in which rat fetuses, embryonic day 18, were used for immunocytochemistry. For the experiments involving siRNA injection at P14–P15 and electrophysiological recordings in vivo at P20–P21, the rats were anesthetized by intraperitoneal injection of pentobarbital sodium (Nembutal; Abbot Laboratories, North Chicago, IL) at 20–30 mg/kg and placed in a stereotaxic frame. Anesthesia was maintained throughout the experiments by injection of a supplemental dose of Nembutal (0.5–1 mg/h) when necessary. The rectal temperature was maintained at 37 ± 0.5°C with a servoheating pad. An appropriate dose of atropine sulfate (0.5 mg/kg) was injected subcutaneously to reduce respiratory secretions, and heart rate was monitored continuously to ensure preparation stability.
siRNA transfer into brain in vivo by RISLE.
The new technique that we developed for RNAi using siRNA and local electroporation targeting the brain region, called RISLE (Akaneya et al., 2005), was used in the present study. For knockdown by RISLE, the rats were examined 6 d after injection of the siRNA as reported previously (Akaneya et al., 2005). Briefly, after the rats were anesthetized, three adjacent perforations of 2 mm diameter were made on the skull using a dental drill; the middle hole was for the injection of siRNA and the others for the insertion of electrodes for electroporation. The stereotaxic coordinates for injections for the visual cortex were 4.8–5.2 mm posterior to the bregma, 1.5–2.0 mm lateral to the midline, and 0.5–0.6 mm in depth. Solutions containing siRNAs were applied to the target region through the middle pore of the skull with RNase-free polyethylene tubes connected to a Hamilton syringe by a microinfusion pump. To prepare stimulation electrodes for electroporation, a pair of parallel stimulating electrodes (CUY567; Nepa Gene, Tokyo, Japan) were used. These electrodes were inserted at 5 mm intervals >1 h after the injection of siRNAs to allow the siRNAs to diffuse from the injection site. Electric pulses were produced with an electric stimulator (SEN-7203; Nihon Koden, Tokyo, Japan) through an isolator (SS-201J; Nihon Koden), followed by visualization through an oscilloscope (VC-11; Nihon Koden). According to a previous study (Sukharev et al. 1992) which showed that the efficacy of entry of extracellular molecules into the cytosol by electroporation depends on the paradigms of electric pulses, the combination of a preceding poring pulse of high voltage and short duration followed in tandem by a driving pulse of low voltage and long duration was used in the present study. It is expected that the poring pulse forms pores in the plasma membrane and the driving pulse facilitates the entry of extracellular molecules into the cytosol. The paradigms of electric pulses used throughout the experiments were as follows: voltage of poring pulse, 100 V/cm; duration of poring pulse, 1 ms; voltage of driving pulse, 2 V/cm; and duration of driving pulse, 2 s. These electric pulses were repeated 10 times every 10 s.
Analyses for Western blot and surface expression of receptors.
Western blot analysis was performed using the RISLE-treated side and the contralateral (control) side of the visual cortex, as described previously (Akaneya et al., 2005). The tissues were homogenized by 15 strokes in lysis buffer containing 25 mm HEPES, 150 mm NaCl, 1 mm EDTA, and 1% Triton X-100, followed by shaking for 30 min at 4°C. To detect cAMP response element-binding protein (CREB) and phosphorylated CREB (pCREB), part of the tissue that included layer II/III but not layer IV was used. One portion of the lysate was used for protein concentration assay. The mid region of the slices was regarded as layer IV (see Fig. 1A, left scheme). One portion of the lysate was used for protein concentration assay. Lysates containing the same amount of protein were analyzed by SDS-PAGE and blotted onto nitrocellulose filters. The primary antibodies used for protein visualization, their dilutions, and their suppliers were as follows: rabbit polyclonal anti-(rpa)-COX-1, 1:500 (Cayman, Ann Arbor, MI); rpa-COX-2, 1:500 (Cayman); rpa-EP1, 1:200 (Cayman); rpa-EP2, 1:200 (Cayman); rpa-EP3, 1:200 (Cayman); rpa-EP4, 1:200 (Cayman); rpa-CREB, 1:1,000 (Cell Signaling, Beverly, MA); mouse monoclonal anti (mma)-pCREB (phosphorylated at Ser133), 1:1,000 (Cell Signaling); mma-α-tubulin, 1:15,000 (Sigma, St. Louis, MO); mma-NR1, 1:1,000 (BD Biosciences, San Jose, CA); rpa-glutamate receptor 1 (GluR1), 1:500 (Chemicon, Temecula, CA), rpa-phosphoGluR1 (S831), 1:200 (Chemicon); and rpa-phosphoGluR1 (S845), 1:200 (Chemicon). Filters were incubated with ECL western blotting detection reagents and exposed to an imaging film. The signals on the film were converted to Adobe Photoshop images using a scanner. The mean intensities of selected areas and the areas of these images were calculated using NIH Image. After subtraction of the intensity of a blank, the intensities were divided by those of contralateral signals derived from the same filter on electrophoretograms.
Figure 1.

Effects of AA on LTP in normal and COX-1- or COX-2-knocked-down visual cortex. A, Schematic diagram of cortical slice used for electrophysiological recordings (left) and example of fEP (right). Left, II/III, IV, and Stim represent layer II/III, layer IV of the cortex, and stimulating electrode, respectively. Right, Double-headed arrow indicates the measured amplitude of the postsynaptic component of fEP. B, Time courses of mean amplitudes of fEPs with (filled circles, n = 8) and without (open circles, n = 7) AA. Error bars indicate SEM. Representative traces of fEPs recorded at 0∼10 min before and 170∼180 min after TBS are shown as a and b, respectively. C, D, Time courses of mean amplitudes of fEPs obtained in slices of COX-2 (red circles)- and COX-1 (blue circles)-knocked-down cortex without (C) and with (D) AA. C, n = 7 for both types of slices. D, n = 7 and 8 for knockdown of COX-1 and COX-2, respectively. Other conventions are the same as those in B. The calibrations in B–D are the same as those in A.
The surface expression of EP1–4 and GluR1 was determined by tissue biotinylation and Western blot analysis, as described previously with some modifications (Osten et al., 2000). Briefly, acute slices were incubated with sulfo-NHS-LC-biotin (Pierce, Rockford, IL) at 1 mg/ml at 4°C for 1 h. For the treatment of the protein kinase inhibitors (all of them from Calbiochem, La Jolla, CA), visual cortical slices were incubated with each inhibitor immediately after TBS. After incubation with glycine at 10 mm, the slices were homogenized in a solution containing 10 mm Tris-HCl, pH 7.4, 150 mm NaCl, 5 mm EDTA, 1% Triton X-100, and an adequate concentration of Complete (Hoffmann-La Roche, Basel, Switzerland) using a glass homogenizer. The homogenates were incubated with immobilized Neutravidin (Pierce) at 4°C for 2 h, and these total homogenates were used to determine the total expression level of EP1–4. After washing and denaturation, supernatants were used to determine the surface expression level of EP1–4.
Primary culture of cortical neurons, immunocytochemistry, and colocalization factor.
The visual cortex was digested with papain for 10 min at 37°C. The dissociated cells were plated on the ploy-l-lysine-coated dish at the density of 1.8 × 10⁴ cells/cm2, followed by incubation at 37°C in the neurobasal medium containing B27 (Invitrogen, Eugene, OR) and 0.5 mm glutamine for 10–11 d until immunocytochemistry. For immunocytochemistry, the cells were fixed with 4% paraformaldehyde for 10 min, followed by permeabilization with 0.2% Triton X-100 for 5 min. After washing with PBS, these cells were incubated with the primary antibodies such as mma-postsynaptic density 95 (PSD-95) (1:100; Millipore, Lake Placid, NY), mma-synaptophysin (1;100; Chemicon), rpa-EP2 (1:100; Cayman), rpa-EP3 (1:100; Cayman), mma-early endosome antigen 1 (EEA1) (1:100; BD Biosciences, Franklin Lakes, NJ) or rpa-microtubule-associated protein 2 (MAP-2) (1:1,000; Chemicon) at 4°C overnight, followed by secondary antibodies such as mouse fluorescein isothiocyanate- or rabbit Texas red-conjugated secondary antibodies (The Jackson Laboratory, Bar Harbor, ME) for 1 h at room temperature.
For immunohistochemistry of the visual cortex, the rat to which Cy3-siRNA was applied was perfused intracardially with 4% paraformaldehyde, followed by slicing of the visual cortex at 80 μm with a freezing microtome, and the slices before or after TBS were fixed with 4% paraformaldehyde at 4°C overnight. These slices were permeabilized with 0.3% Triton X-100, followed by the incubation with the primary antibodies such as mma-neuron-specific nuclear protein (NeuN) (1:50; Chemicon) and secondary antibodies as immunocytochemistry. Images were taken through a laser-scanning confocal microscope (LSM; Axiovert 100M; Zeiss, Oberkochen, Germany). The colocalization factors of EEA1 with EP2 or EP3 in cortical slices, and those of PSD-95 or synaptophysin with EP2 or EP3 in primary cultures of cortical neurons were calculated using LSM-510 software (Zeiss) as follows: 2ab/(a2 + b2), where a is green signal intensity and b is red signal intensity. Signal intensity was quantified using NIH Image software.
Electrophysiology in vitro and in vivo.
The experiments were performed as described previously (Akaneya et al., 1997, 2005). For in vitro experiments, after anesthetizing the rats, the region of the visual cortex was rapidly removed and placed in a chilled medium saturated with 95% O2-5% CO2. For RISLE, the tissues between two electroporation scars were used. The tissues were sectioned into coronal slices 400 μm thick with a rotary slicer, followed by incubation for >2 h at room temperature. For recording field-evoked potentials (fEPs), a glass micropipette filled with 0.5 m sodium acetate and 2% pontamine sky blue (<4 MΩ) was inserted into layer II/III, whereas a bipolar stimulation electrode was placed in layer IV (see Fig. 1A, left scheme). The fEPs in response to stimuli, 0.2 ms in duration at an intensity of 15–300 μA, were amplified and filtered at 0.1–3 kHz, digitized at 20 kHz, and stored using the PowerLab software (AD Instruments, Colorado Springs, CO). The peak-to-peak fEP amplitude of the postsynaptic component of layer II/III was measured as shown in the right panel of Figure 1A. For in vivo experiments, to stimulate the lateral geniculate nucleus (LGN), a bipolar stimulation electrode was inserted into the brain at the point 4.0 mm posterior to the bregma and 3.5–4.0 mm lateral to the midline. The tip of the electrode was adjusted to a depth at which maximal field responses were obtained to flashes of light presented to the eye contralateral to the LGN. For the monopolar recording of cortical fEP, a single-barrel borosilicate glass micropipette filled with 3 m NaCl was placed 5.8–6.0 mm posterior to the bregma, 4.5–4.7 mm lateral to the midline, and in layer II/III of the visual cortex by lowering it vertically 0.5 mm below the pial surface. fEPs were evoked by stimuli 0.2 ms in duration at an intensity of 0.2–0.9 mA. Evoked responses were amplified and filtered at 0.1–3 kHz, and digitized at 20 kHz. To determine the intensity of stimulation, a full input–output curve was examined. The intensity that yielded an amplitude of potentials 50–60% of the maximum was used in the experiments. For TBS in vivo and in vitro, the following paradigms were used: five stimulus trains at the interval of 10 s, each train consisting of 10 bursts at 5 Hz, and each burst consisting of four pulses at 100 Hz. These theta-burst stimuli were repeated five times at the interval of 10 s. Acute slices were pretreated with AA (100 μm) (a gift from Suntory, Osaka, Japan), each prostaglandin (50 μm) (Cayman) or cycloheximide (CHX, 50 μm; Sigma) at least 2 h before electrophysiological and biochemical experiments. CHX was dissolved with DMSO (0.05%). Usually, test slices were randomly interleaved with control slices obtained from the same animal under the same incubation condition. In part of the experiments for paired-pulse ratio (PPR) of fEPs, bicuculline (1 μm; Tocris, Avonmouth, UK) was applied to the slices from at least 30 min before the recording to the end of the experiments.
Analysis of EP1–4 genes, interferon-response gene expression with real-time PCR.
RISLE was performed for the visual cortex with iRCOX-1, iRCOX-2, or siRNA for EP1–4 (iREP1–4). The tissues around the RISLE and contralateral sites were removed and stored in RNAlater stabilization reagent (Qiagen, Hilden, Germany) at −80°C. The tissues were cut into pieces with scalpels; the pieces were put in a cold lysis buffer, and then passed through a 20 gauge needle. Using an RNeasy minikit (Qiagen), total RNA was prepared using these lysates according to the manufacturer’s instructions. Briefly, to obtain cDNA, the template RNA was incubated with 4 u/reaction Omniscriot reverse transcriptase (Qiagen), deoxyribonucleoside triphosphate (dNTP) mix (5 mm for each dNTP), 1 μm oligo-dT primer (Roche, Welwyn Garden City, UK), and 10 u/reaction RNase inhibitor for 1 h at 37°C. Then, to inactivate the reverse transcriptase, the reaction mixture was incubated at 93°C for 5 min, followed by rapid cooling on ice. The subsequent quantitative real-time PCR for EP1–4, 2′,5′-oligoadenylate synthetase 1 (OAS1), interleukin-1β (IL-1β), tumor necrosis factor α (TNFα), brain-derived neurotrophic factor (BDNF), c-Fos, or Arc was performed using the Assay-on-Demand kit (Applied Bioscience, Foster City, CA). The TaqMan probes have 6-carboxy fluorescein as the reporter at the 5′ end and 6-carboxytetramethylrhodamine as the quencher at the 3′ end. For endogenous control, TaqMan rodent glyceraldehyde-3-phosphate dehydrogenase (GAPDH) control reagents (ABI, Columbia, MD) were used. The template cDNA in the TaqMan Universal PCR master mix (ABI) was amplified using an ABI PRISM 7900HT sequence detection system. The conditions for the PCR were as follows: (1) 50°C for 2 min and 95°C for 10 min, (2) 95°C for 15 s followed by 60°C for 1 min, for 40 cycles, and (3) storage at 25°C. The data were normalized to the data from GAPDH cDNA by comparative CT analysis.
PGE2 and cAMP assays.
After obtaining tissues from the visual cortex with or without TBS, AA, or PGE2 for wild-type or EP1–4 knockdown rats, PGE2 and cAMP in the lysates were assayed with a PGE2 EIA kit and cAMP EIA kit (Cayman) in accordance with the manufacturer’s instructions.
Preparation of synaptoneurosomes and quantification of glutamate release.
To obtain synaptoneurosomes, the visual cortices on the RISLE-treated side and the contralateral side were gently homogenized on ice in a glass homogenizer containing the following (in mm): 125 NaCl, 5 KCl, 1 MgCl2, 1.2 Na2HPO4, 10 glucose, and 20 HEPES/NaOH, pH 7.4. These lysate solutions were filtered sequentially through two layers of nylon mesh (pore size, 100 μm) and a 5 μm filter, followed by centrifugation at 1,000 × g at 4°C for 10 min. Glutamate release from synaptoneurosomes (GRS) was measured using an enzyme-coupled fluorometric assay with some modifications (Akaneya et al., 2005). Resuspended synaptoneurosomes were stirred at 37°C, followed by the addition of a solution of NADP (final concentration, 1 mm), glutamate dehydrogenase (50 U/ml), and CaCl2 (1 mm). After 3 min, KCl (30 mm) was added to the solution. Fluorescence intensity was monitored using a spectrofluorometer at 340 nm (excitation) and 460 nm (emission). For PGE2 assay and Western blot analysis with extra-synaptoneurosomes, the tissues attached with the nylon mesh were homogenized through an 18 gauge needle 30 times in lysis buffer containing 25 mm HEPES, 150 mm NaCl, 1 mm EDTA, and 1% Triton X-100.
Results
Involvement of PGE2 in TBS-induced LTP of visual cortex
Using slices of the visual cortex of rats, fEP was recorded from layer II/III during stimulation of layer IV at 0.017 Hz, and the peak-to-peak amplitude of the postsynaptic component was measured (Fig. 1A). The continuous treatment of cortical slices with AA (100 μm) had no significant effect on the baseline fEP amplitude for at least 2 h (data not shown). TBS induced LTP with an increase in the amplitude of fEPs of ∼20% relative to the baseline (Fig. 1B, open circles), consistent with the results of our previous studies and those of other studies (Kirkwood and Bear, 1994; Akaneya et al., 1997, 2005). The addition of AA before the application of TBS enhanced the magnitude of LTP by ∼40–50% of the baseline (Fig. 1B, filled circles). The difference in mean amplitude between the two conditions at 170–180 min after TBS was statistically significant (unpaired t test; p < 0.05). To distinguish whether AA or its metabolites are involved in the enhancement of LTP, RISLE was used to knock down COX-1 or COX-2 (Akaneya et al., 2005). The knockdown of COX-1 and COX-2 by introducing their siRNAs (iRCOX-1 and iRCOX-2, respectively) into the visual cortex in vivo significantly decreased the expression levels of COX-1 and COX-2, respectively (Fig. 2C). Recent studies have reported off-target effects of RNA interference (Scacheri et al., 2004) and the possibility of perturbation of neuronal structure and function by the off-target effects (Alvarez et al., 2006). To exclude the off-target effects and the activation of interferon-response genes, we tested whether our knockdown method has such side effects. Consequently, we found that the expression levels of the proteins such as NR1, GluR1, Ca2+/calmodulin-dependent protein kinase II (CaMKII), phosphorylated CaMKII, and α-tubulin were not significantly altered, suggesting that no off-target effects occurred (Fig. 2C). Moreover, the interferon-response gene OAS1, IL-1β, or TNFα was not activated to levels that are believed to be pathological (more than 30 to 50 times) (Chang et al., 2004) by RISLE with iRCOX-1 or iRCOX-2, suggesting that no significant inflammation responses were induced (Fig. 2B). Therefore, these knockdown rats were used for the subsequent experiments. RNAi for COX-2 blocked LTP almost completely, whereas that for COX-1 showed no significant effect on the induction or maintenance of LTP (Fig. 1C). Similarly, the enhancing effect of AA on LTP was completely blocked by the RNAi for COX-2, but not that for COX-1 (Fig. 1D). These results indicate the involvement of AA metabolites, but not that of AA itself, and suggest that COX-2 plays a role in TBS-induced LTP in the visual cortex.
Figure 2.

Knockdown of COX-1, COX-2, and EP1–4 by RISLE. A, Immunohistochemically stained cortex to which Cy3-conjugated siRNA (iREP2 antisense) was applied by electroporation. NeuN and Cy3 are marked by green and red, respectively. Scale bar, 10 μm. B, The expression level of OAS1, IL-1β, or TNFα was measured in the tissues of the visual cortex subjected to RISLE with or without the indicated siRNA. C, D, Western blot analysis of indicated proteins was performed by RISLE with iRCOX-1 or iRCOX-2 (C) or with iREP1–4 (D). The left (C) or top (D) panels of each graph show representative expression of the indicated proteins without (−) or with (+) RISLE. In the graphs the data were normalized to those of the contralateral side of tissues that were not subjected to RISLE. B, n = 7–9, C, n = 7–9, D, n = 7–10. Error bars indicate SEM.
Next, we investigated which prostaglandins as AA metabolites are involved in LTP. None of the five prostaglandins (each 50 μm) that were applied through the perfusing medium showed a significant effect on the baseline amplitudes of fEPs (Fig. 3A). Because these prostaglandins are considerably unstable in an oxidative, free-radical-rich medium saturated with 95% O2-5% CO2 by bubbling, we increased prostaglandin concentration so that it was higher than that reported previously (Chen et al., 2002). The application of TBS with PGE2 enhanced LTP with an increase in fEP amplitude of ∼40–50% relative to the baseline, whereas the other four prostaglandins showed no significant effect on LTP (Fig. 3B). Moreover, the effects of both AA and PGE2 were dose-dependent (Fig. 3C). Then, it was investigated whether PGE2 is generated from AA in visual cortical slices with or without the application of TBS. We found that TBS enhanced the production of PGE2, the effect of which was completely blocked by RNAi for COX-2, but not that for COX-1 (Fig. 3D). Moreover, the addition of AA promoted the production of PGE2 by TBS, the effect of which was almost completely blocked by RNAi for COX-2, but not that for COX-1 (Fig. 3D). To examine whether PGE2 is produced synaptically by TBS, we performed PGE2 assay with the two biochemical components, synapse-rich synaptoneurosomes and extra-synaptoneurosomes. Consequently, significant production of PGE2 was observed only in synaptoneurosomes, the effect of which was significantly enhanced by the addition of AA (Fig. 3E) (p < 0.05, ANOVA). These results suggest that the application of TBS in the visual cortex induces the production of PGE2 mostly if not all at synaptic sites by COX-2, the effect of which is promoted by the addition of AA as a precursor of PGE2.
Figure 3.

Involvement of PGE2 in LTP. A, B, Time courses of mean amplitudes of fEPs without (A) and with (B) TBS in cortical slices to which each of the prostaglandins was applied, as indicated by respective colors. The number of slices was 7–8 for each condition. The horizontal bar indicates the time when each prostaglandin was applied. The arrow in B indicates the time when TBS was applied. The calibration bars in A and B are the same as those in Figure 1A. C, Dose–response curve of AA- and PGE2-induced enhancement of fEP amplitude 170∼180 min after TBS. The numbers of slices were 7–9. D, E, The level of PGE2 was measured in slices of the visual cortex 30 min after TBS with total tissues (D) or with synaptoneurosomes and extra-synaptoneurosomes (E). The data were normalized to those from the contralateral side as a control. The numbers of slices were 7–10 in D and 7 in E. *Statistically significant difference (p < 0.05, ANOVA). Error bars indicate SEM.
Roles of PGE2 receptor subtypes in TBS-induced LTP
To examine whether particular PGE2 receptor subtypes are involved in TBS-induced LTP, RISLE was performed using iREP1–4 similarly to that described for COX-1 and COX-2 knockdowns. To directly confirm the introduction of siRNA, we used siRNA conjugated with Cy-3 at the 5 prime site in a part of the experiments, and found that Cy-3-conjugated siRNA was introduced into a substantial proportion of neurons within the region between the two electroporation electrodes 1 h after electroporation (Fig. 2A). The effects of RISLE using iREP1–4 were examined and found to be target-specific without significantly activating OAS1, IL-1β, or TNFα, suggesting the lack of inflammatory change in RISLE-treated tissues (Fig. 2B-D). Experiments using scramble siRNAs of COX-1, COX-2, or EP1–4 confirmed the target-specificity for siRNA used for the present knockdown studies (supplemental Fig. 1A, available at www.jneurosci.org as supplemental material). Real-time PCR analysis revealed that effects of the knockdown on the mRNA levels were almost similar to those of the knockdown on the protein levels (supplemental Fig. 1B, available at www.jneurosci.org as supplemental material). Moreover, an immunohistochemical analysis of acute slices of the visual cortex revealed that the region knocked down by RISLE using iRCOX-1, iRCOX-2, or iREP1–4 included an area of at least 0.7 mm width, from layers I to VI of the cortex. TUNEL (terminal deoxynucleotidyl transferase-mediated dUTP nick-end labeling) showed no apoptotic cell death in tissues subjected to RISLE (data not shown) (Akaneya et al., 2005). Thus, we were able to examine the effects of RISLE using iREP1–4. RNAi for EP2 with or without the addition of AA or PGE2 suppressed the induction of LTP almost completely (Fig. 4A, red circles). Conversely, RNAi for EP3 with or without the addition of AA or PGE2 significantly enhanced the magnitude of LTP (Fig. 4A, green circles). However, RNAi for EP1 or EP4 with or without the addition of AA or PGE2 had no significant effect on LTP (Fig. 4A, black and blue circles, respectively). To determine whether these in vitro effects of PGE2 receptor subtypes can be reproduced in vivo, fEP from the RISLE-treated cortex with iREP1–4 in anesthetized rats was recorded while stimulating the LGN ipsilateral to the visual cortex. The magnitude of LTP in vivo was similar to that of LTP in vitro (Figs. 1B, 4B), consistent with the results of our previous studies and those of other studies (Heynan and Bear, 2001; Jiang et al., 2001; Akaneya et al., 2005). Similarly, LTP in vivo was also blocked by EP2 knockdown and enhanced by EP3 knockdown, and was not altered by EP1 or EP4 knockdown (Fig. 4B).
Figure 4.
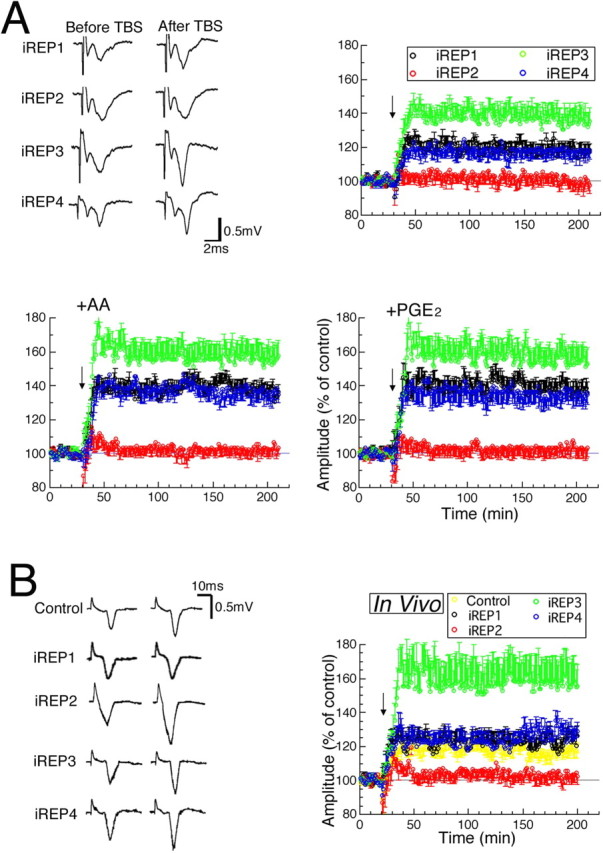
Effects of knockdown of EP1–4 by RISLE on LTP. Time courses of mean amplitude of fEPs of visual cortex in which each PGE2 receptor subtype was knocked down are shown, as indicated by respective colors. Arrows indicate the time when TBS was applied. A, Representative fEPs from 0∼10 min before and 170∼180 min after TBS (top left) and the mean values obtained from slices without AA and PGE2 (top right) (n = 7–8). The values from slices to which AA and PGE2 were applied are shown in the lower left and right, respectively (n = 7–9 and 7–8, respectively). B, Representative fEPs from 0∼10 min before and 170∼180 min after TBS (left), and time courses of mean fEP amplitudes recorded from in vivo visual cortex (right) (n = 7–8).
To determine whether TBS influences the expression of PGE2 receptor subunits at the membrane before or after TBS application, the ratios of the level of biotinylated subunit expression to that of total expression were calculated for each subtype before and 30 min and 3 h after TBS in acute slices. The wounds of cells caused by slicing are known to be sealed after ∼1 h of incubation in artificial CSF (ACSF), resulting in the protection of their intracellular contents from binding with extracellular biotin. The surface expression level of EP2 significantly increased 30 min after TBS, followed by a decrease to the basal level after 3 h, whereas that of EP3 significantly decreased 30 min after TBS, followed by a recovery to the control level (Fig. 5A). However, the levels of EP1 and EP4 surface expression were not significantly affected by TBS. These results suggest that the application of TBS induces the simultaneous translocation of EP2 from the cytosol to the membrane and of EP3 from the membrane to the cytosol in an activity-dependent manner.
Figure 5.
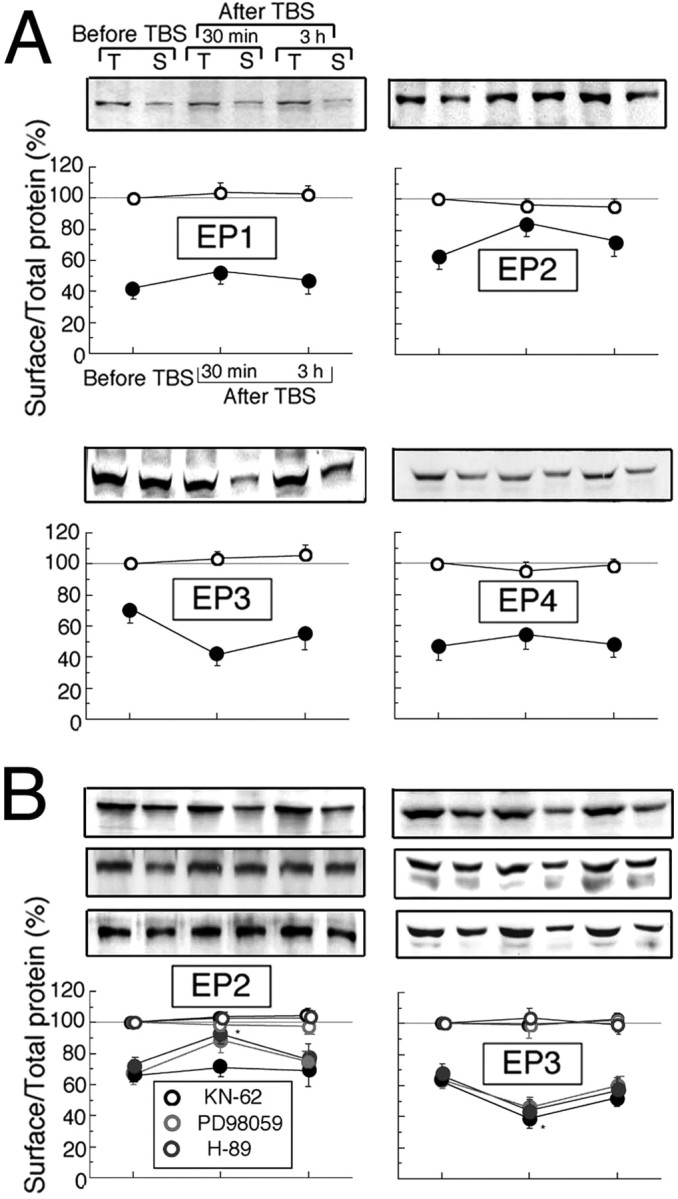
Changes in subcellular distribution of each subtype of PGE2 receptors after TBS. A, B, The surface/total expression ratios of EP1–4 protein assayed before and 30 min and 3 h after TBS are indicated by filled circles, whereas the total expression levels of EP1–4 are indicated by open circles. The data were normalized to those of total expression without TBS as control. A, Mean values obtained without inhibitors. Error bars, which indicate SEM, are shown only when they are larger than the size of symbols (EP1, n = 7; EP2, n = 8; EP3, n = 8; EP4, n = 7). Top panels above each graph show representative expression of EP1–4. T, Total; S, surface expression. B, Mean values obtained with KN-62, H-89, and PD98059 (EP2, n = 7; EP3, n = 7). Top panels above each graph show representative expression of EP2 and EP3 with KN-62 (top), H-89 (middle), and PD98059 (bottom). *Significant difference from the results before TBS (p < 0.05, ANOVA).
To explore how this bidirectional trafficking of EP2 and EP3 are regulated, we examined the effects of membrane-permeable inhibitors of protein kinases such as CaMKII, cAMP-dependent protein kinase (PKA), or MAP kinase kinase (MEK) on the ratios of surface/total expression of EP2 and EP3. The application of an inhibitor of CaMKII, KN-62 (2 μm), to visual cortical slices immediately after TBS blocked the elevation of surface/total expression ratio of EP2 30 min after TBS, whereas H-89 (20 μm), an inhibitor of PKA and 3-methoxyphenyl-4H-1-benzopyran-4-one (PD98059) (10 μm), an inhibitor of MEK, did not affect the effect of TBS on the increase in surface/total expression ratio of EP2 (Fig. 5B, left). The values obtained 30 min after TBS with treatment with H-89 or PD98059, but not KN-62, were significantly larger than those before TBS (p < 0.05, ANOVA). However, the effect of TBS on the decrease in surface/total expression ratio of EP3 30 min after TBS was not affected by the addition of any of these inhibitors (Fig. 5B, right). The total levels of EP1–4 expression were not changed with or without the inhibitors throughout the experiments (Fig. 5A,B, open symbols).
To test whether the trafficking of EP2 and EP3 is regulated by an exocytosis-dependent mechanism, we then applied 0.5 m sucrose to slices for 10 min before TBS, which was followed by the determination of surface/total protein expression ratios of EP2 and EP3. Consequently, we found that the TBS-induced changes in the surface/total expression ratios of EP2 and EP3 were blocked by the pretreatment with sucrose (Fig. 6A). Because a cytoplasmic sorting compartment such as early endosomes is a pool for endocytosis/exocytosis in the cytosol (Christoforidis et al., 1999), we examined the colocalization ratio of EEA1 (green) as a marker for early endosomes and EP2 (red) or EP3 (red) 30 min after TBS by immunostaining (Fig. 6B). EEA1 is located exclusively in dendrites and cell bodies, but not in axons (supplemental Fig. 2, available at www.jneurosci.org as supplemental material), as reported previously (Wilson et al., 2000). Subsequently, we measured the intensities of green and red colors, and then calculated the proportion of overlapping area of these two colors (see Materials and Methods). The colocalization factor of EP2 decreased whereas that of EP3 increased significantly (Fig. 6B). This suggests that EP2 leaves from and EP3 enters into early endosomes after TBS.
Figure 6.
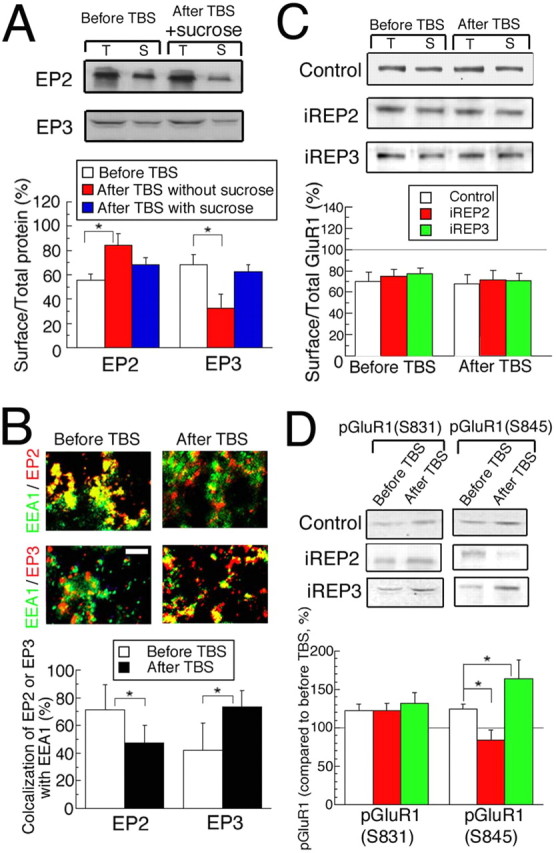
Mechanisms of TBS-induced LTP. A, The surface/total expression ratio of EP2 and EP3 protein assayed before and 30 min after TBS in cortical slices, which were treated for 10 min with 0.5 m sucrose before TBS. Top, Representative expression of each of EP2 and EP3 with or without sucrose (n = 7–8). B, Slices immunostained with anti-EEA 1 antibody (green) and anti-EP2 or -EP3 antibody (red) before or 30 min after TBS. Scale bar, 10 μm. Bottom, The ratio of intensities of the yellow signal to the total intensities of the green and red signals in each image (100 × 100 μm) was calculated before and after TBS. The number of images used was 52 and 63 before and after TBS, respectively. *Significant difference from the results before TBS (p < 0.05, ANOVA in A or unpaired t test in B). C, The ratios of surface/total protein of GluR1 measured before and 30 min after TBS as in A. T, Total; S, surface expression (n = 7–8). D, Phospho-GluR1 at serine 831 or 845 [pGluR1(S831) or pGluR1(S845), respectively] in tissues was measured before and 30 min after TBS (n = 7–8). Error bars indicate SEM.
It was reported that the trafficking of AMPA receptor (AMPAR) from cytosolic pools to the membrane is involved in LTP (Ehlers, 2000; Esteban et al., 2003; Collingridge et al., 2004). To examine whether AMPAR trafficking is induced in PGE2-associated LTP, we measured the ratio of surface/total protein of GluR1 similarly to that of PGE2 receptor subtypes as described above. We did not observe significant differences in the ratios of surface/total GluR1 between before and 30 min after TBS (Fig. 6C). This may be because of the difficulty in detecting a small change in this value, ascribable to the rapid and constitutive cycling between intracellular stores and the membrane, or to lateral movement, as suggested in previous reports (Grosshans et al., 2002; Adesnik et al., 2005). Because LTP in hippocampus was reported to be associated with the phosphorylation of intracellular domains of glutamate receptors by protein kinases, we examined whether PGE2-associated LTP may involve this mechanism. When TBS was applied to the slices, phosphorylations at serine 831 (S831) and 845 (S845) on GluR1, which are activated by CaMKII and PKA, respectively (Roche et al., 1996; Barria et al., 1997; Mammen et al., 1997), were enhanced significantly (Fig. 6D, white bars) (p < 0.05, unpaired t test, vs before TBS). Then we found that the phosphorylation at S845, but not S831, was blocked in EP2 knockdown tissues and enhanced in EP3 knockdown tissues (Fig. 6D). These results suggest that TBS may induce LTP through phosphorylation at S845 on GluR1 by PKA, rather than AMPAR trafficking.
Postsynaptic action of PGE2 in TBS-induced LTP
To determine whether presynaptic or postsynaptic sites or both are involved in PGE2-associated LTP, PPR and fiber volley (FV) of fEP and GRS were investigated before and after TBS. In comparison with values before TBS, PPR and FV showed no significant changes 30 min or 3 h after TBS (Fig. 7A,B, open symbols). Because a previous study indicated a large contribution of GABAergic inhibition to PPR (Castro-Alamancos and Connors, 1997), we also examined PPR and FV with a GABAA receptor antagonist, bicuculline (1 μm). Similarly to the experiments without bicuculline, PPR and FV showed no significant changes 30 min or 3 h after TBS (Fig. 7A,B, filled symbols). Next, we measured glutamate, which is released from synaptoneurosomes when activated by adding KCl. The pretreatment of synaptoneurosomes with BDNF as a positive control showed a greater degree of enhancement of GRS than that with or without the application of TBS, confirming the presynaptic action of BDNF, consistent with the results of previous studies (Fig. 7C, top) (Gottschalk et al., 1998; Jovanovic et al., 2000). Similar to the results of PPR, GRS did not significantly change 30 min or 3 h after TBS with or without AA or PGE2 (Fig. 7C, middle and bottom graphs). Moreover, RNAi with iREP1–4 had no effect on PPR, FV, or GRS (Fig. 7A–C).
Figure 7.

A–C, No changes in PPR of fEPs (A), FVs (B), and released glutamate (C) after the induction of LTP. Open and filled symbols with error bars indicate values obtained without and with bicuculline (1 μm), respectively. A, Top, Representative fEPs evoked by paired-pulse stimulation at an interval of 20 ms. Middle, Bottom, Mean PPRs under the conditions indicated. Circles, triangles and squares indicate the mean values obtained before, and 30 min and 3 h after TBS, respectively. Vertical lines indicate 2 SEMs (n = 7–8). B, Mean ratio of FVs of fEPs after TBS to those before TBS. Top, Representative traces of early phase of fEPs. Note that the time scale is expanded, compared with that of A. Measured amplitudes of FVs are shown as intervals between broken lines. C, Top, Representative time courses of GRS before (open circles) and 30 min after TBS (closed circles) without AA and PGE2 and that obtained after pretreatment with BDNF (triangles). In the middle (with AA) and bottom (with PGE2), the fluorescence intensities that were normalized to those from the contralateral side as a control (n = 7–9) are shown. Error bars indicate SEM.
To see whether PGE2 receptors are located at presynaptic or postsynaptic sites more directly, we performed the immunocytochemical analysis of the location of EP2, EP3, PSD-95, a postsynaptic marker, and synaptophysin, a presynaptic marker, in cultured neurons of the visual cortex. We found that EP2 and EP3 were almost completely colocalized with PSD-95, whereas they were located adjacently to synaptophysin with a slightly or no overlapping area at most synapses (Fig. 8). To confirm that EP2 and EP3 are located at postsynaptic sites, we performed a quantitative analysis by calculating the colocalization factors of EP2 and EP3 with PSD-95 and those of EP2 and EP3 with synaptophysin in the same way as we performed for EP2 and EP3 with EEA1, as in Figure 6B. Consequently, we found that the colocalization factors of EP2 and EP3 with PSD-95 were 71 ± 12 (mean ± SEM; n = 6) and 82 ± 8.2% (n = 6), respectively, whereas those of EP2 or EP3 with synaptophysin were 25 ± 7.1 (n = 6) and 13 ± 5.3% (n = 6), respectively. These results indicate that EP2 and EP3 are mostly located at postsynaptic sites.
Figure 8.

Immunocytochemistry for EP2, EP3, PSD-95, and synaptophysin in neurons from visual cortex cultured for 10–11 d. The green color represents PSD-95 or synaptophysin whereas the red color represents EP2 or EP3, as indicated. Scale bar, 5 μm. Bottom, Magnified images of insets in the merged images.
Effect of PGE2 on late LTP
LTP is classified into early and late LTP (E-LTP and L-LTP, respectively) in hippocampus, and L-LTP depends on protein synthesis (Frey et al., 1993; Abel et al., 1997; Huang et al., 2004). The two similar types of LTP were reported also in the visual cortex (Kurotani et al., 1996). Because it is practically very difficult to separate L-LTP from E-LTP in the visual cortex, we examined whether a selective blocker of L-LTP, a protein synthesis inhibitor CHX (50 μm), inhibits the late phase of PGE2-associated LTP. We found that the late phase of LTP was not seen in slices treated with CHX, although it was observed in control slices treated with vehicle (DMSO) alone (Fig. 9A).
Figure 9.

Effect of PGE2 on L-LTP and generation of cAMP, and activation of CREB by TBS. A, Time course of mean amplitude of fEPs with CHX, protein synthesis inhibitor (red), and those with vehicle alone (black). The horizontal bar indicates the period when CHX or vehicle was applied. Tests with CHX-treated slices were interleaved with control slices with vehicle alone. Number of slices was 7 for each. B, cAMP level after TBS with or without AA (left) or PGE2 (right). The conditions under which cAMP level was measured are indicated along the abscissa (n = 7–8). *Significant differences between indicated groups; **significant differences in comparison with control (p < 0.05, ANOVA). C, Ratio of pCREB/total CREB in cortical layer II/III after TBS without or with AA (left) or PGE2 (right). The top panels show representative expressions of pCREB and total CREB (n = 7–9). B, C, The data were normalized to those from the contralateral side as control. D, mRNA expression level of BDNF, c-Fos, and Arc measured by real-time PCR 3 h after TBS using control, and EP2- and EP3-knockdown rats (n = 7–8). The data are normalized to control (before TBS). Error bars indicate SEM.
Because EP2 increases and EP3 decreases cAMP level (Jumblatt and Paterson, 1991; Sugimoto et al., 1992), the present data suggesting the trafficking of EP2 and EP3 predicted that TBS would increase cAMP level in the visual cortex. Indeed, TBS significantly increased cAMP level 30 min after TBS, consistent with a previous study (Chetkovitch et al., 1991), and this effect of TBS was significantly enhanced by the pretreatment with AA or PGE2 (Fig. 9B). This enhancing effect of AA or PGE2 on the cAMP level was blocked by RNAi with iREP2 and promoted by RNAi with iREP3, whereas RNAi with iREP1 or iREP4 had no significant effect (Fig. 9B). Because PKA is the main activator of CREB, it was examined whether TBS subsequently induces the phosphorylation of CREB in layer II/III of the visual cortex. TBS significantly increased the pCREB/total CREB ratio 30 min after TBS in the visual cortex, and this effect was significantly enhanced by the pretreatment with AA or PGE2 (Fig. 9C). Moreover, this effect of AA or PGE2 was blocked by RNAi with iREP2 and enhanced by RNAi with iREP3 (Fig. 9C). However, RNAi with iREP1 or iREP4 did not significantly affect the changes in pCREB/CREB ratio after the application of TBS with AA or PGE2 (Fig. 9C). Finally we examined whether CREB products such as BDNF, c-Fos, and Arc may be associated with L-LTP by real-time PCR analysis. The expression levels of these three products significantly increased when TBS was applied to the slices (Fig. 9D, white bars) (p < 0.05, unpaired t test, vs before TBS). The change in the expression level of BDNF, but not that of c-Fos or Arc, was blocked in EP2 knockdown and enhanced in EP3 knockdown (Fig. 9D). These results suggest that CREB activation via PGE2 receptors may promote the generation of BDNF. These observations further suggest that the activation of the cAMP signaling cascade leads to the phosphorylation of CREB, which may be involved in the maintenance of LTP (Huang et al., 2004).
Discussion
Postsynaptic generation of PGE2 by TBS
In the visual cortex, TBS induces an increase in postsynaptic Ca2+ mainly through NMDAR (Tsumoto, 1992; Bear and Kirkwood, 1993). The increased Ca2+ at postsynaptic sites results in the activation of cPLA2, which produces AA by acting on lipid-rich membranes (supplemental Fig. 3, available at www.jneurosci.org as supplemental material). AA is converted to PGH2 and then to PGE2. The membrane permeability of hydrophobic compounds permits the propagation of PGE2 from the intracellular region into the synaptic cleft across the postsynaptic membrane; thus, PGE2 reaches outside of the postsynaptic membrane by diffusion.
It is possible that PGE2 generated at postsynaptic sites might “spill over” onto neighboring synapses so as to exert its action there. However, the possible range of PGE2 diffusion is restricted to a short distance because of its short life span caused by its chemical and metabolic instability. Thus, it is likely that endogenous PGE2, which is produced at active postsynaptic sites, regulates plasticity of the active synapses alone. Because astrocytes also can generate PGE2 (Bezzi et al., 1998), PGE2 released from astrocytes might act on PGE2 receptors at postsynaptic sites of neurons. This possibility seems low, however, because of the very restricted diffusion of PGE2.
PGE2 as a candidate for post-to-postsynaptic messengers
Retrograde signaling as well as anterograde signaling is necessary for the development, maintenance, and activity-dependent modulation of synaptic connections (Williams, 1996; Fitzsimonds and Poo, 1998; Elphick and Egertova 2001; Bazan, 2003). After the activation of NMDAR at postsynaptic sites, cPLA2 is activated and this results in the release of AA and other products. Because, in the current study, exogenous AA (without TBS) did not significantly change fEP, PPR of fEP, or glutamate release from synaptoneurosomes, it is unlikely that AA is a retrograde messenger in the visual cortex.
An immunocytochemical study of cultured hippocampal neurons showed that EP2 and EP3 are expressed in an activity-dependent manner at presynaptic and postsynaptic sites, respectively (Zhu et al., 2005). Thus, it seems possible that PGE2, which is produced at postsynaptic sites, acts on presynaptic EP2 in the hippocampus, as suggested in another report (Sang et al., 2005). In the present study, however, we found no presynaptic involvement in PGE2-associated LTP with the three different measures such as PPR, FV, and glutamate release from synaptoneurosomes. Furthermore, the immunocytochemical analysis of location of EP2/EP3 has clearly shown that these receptors are located at postsynaptic sites. These results together suggest that PGE2 is released from postsynaptic sites and acts on EP2 and EP3 at postsynaptic sites. The difference in the location of EP2 between the previous and present results may be ascribable to the regional specificity of the hippocampus and visual cortex. For example, the stimulus protocol for the induction of LTP, the magnitude of induced LTP, and the time course of its rising phase are markedly different between CA1 of the hippocampus and visual cortex (Bear and Kirkwood, 1993; Akaneya et al., 1997).
Differential regulation of trafficking of PGE2 receptor subtypes by TBS
The present study has shown that intracellular EP2 at postsynaptic sites of the visual cortex can be recruited to the surface membrane after TBS, whereas EP3 located at the membrane is transferred into the cytosol. PGE2 from the postsynaptic site can bind to EP2 as well as EP3 located at the postsynaptic membrane, although the level of EP3 at the membrane is expected to decrease because of its trafficking to the cytosol. The analysis of colocalization ratios of EEA1 with EP2 and EP3 indicates that TBS may induce simultaneous trafficking of EP2 from early endosomes to the membrane and of EP3 from the membrane to early endosomes. The observation that sucrose blocked the TBS-induced decrease in the surface expression level of EP3 can be explained by the osmotic action of sucrose by which exocytosis such as the release of synaptic vesicles from presynaptic terminals is facilitated. The blockade of EP2 trafficking by sucrose seems inconsistent with such an explanation. It seems possible, however, that EP2 trafficking to the membrane is induced through secretory vesicle-independent and, thus, sucrose-insensitive mechanisms, as suggested in a previous study that sucrose has no effect on AMPAR trafficking from the intracellular pools to the membrane for exposure (Man et al., 2000).
Because EP2 and EP3 have opposite effects on the production of cAMP, a reasonable explanation for the mechanism underlying LTP could be that the increase in EP2 and the decrease in EP3 at the membrane synergistically produce cAMP at postsynaptic sites. To produce cAMP at a level necessary to induce LTP, such a bidirectional trafficking of both receptor subtypes may be indispensable, because the majority of EP3 (70∼80%) is expressed at the membrane in the steady state (Fig. 5A). Such a requirement of opposite trafficking of both receptor subtypes to induce LTP may explain why the treatment with PGE2 without TBS did not increase fEP amplitude.
The dynamic force for the trafficking of EP2 can be provided by CaMKII activated by Ca2+ via NMDAR. Indeed, EP2 is a strong candidate for the targets of phosphorylation by CaMKII, because the EP2 molecule contains a CaMKII phosphorylation consensus motif, Hyd-X-Arg-NB-X-Ser/Thr-Hyd, where Hyd represents a hydrophobic amino acid, X any amino acid, and NB a nonbasic amino acid (White et al., 1998). This dynamic of EP2 is similar to the trafficking of AMPAR with respect to dependency on CaMKII (Liao et al., 2001). Mechanisms of EP3 trafficking are not clear in the present study. There is another possibility that as yet unknown EP2- and EP3-interacting proteins might be involved, as in the so-called “silent synapse” mechanisms (Collingridge et al., 2004).
The bidirectional translocation of EP2/EP3 would not be fast processes as activations of enzymes. If so, LTP is expected to be induced with some delay after TBS. In the visual cortex, in fact, it takes ∼5 min for LTP to become clearly detectable and 10–15 min to fully develop after TBS, as seen in Figure 1. Thus, the trafficking of PGE2 receptors may be related to the relatively slow induction of visual cortical LTP, although we cannot exclude the involvement of faster processes after the activation of CaMKII in the induction of LTP.
Significance of differential expression of PGE2 receptor subtypes
An in situ hybridization analysis revealed a distinct distribution of PGE2 receptors in the brain and other organs. EP2 mRNA is expressed abundantly and EP3 mRNA moderately in the cerebral cortex; however, EP4 mRNA is scarce in the cortex despite being abundant elsewhere, particularly in the hypothalamus and brainstem (Sugimoto et al., 1994; Zhang and Rivest, 1999). Moreover, the distribution of EP1 mRNA is restricted in other organs (Watabe et al., 1993). Thus, differences in the regional distribution and expression level among the four subtypes of PGE2 receptors may explain the difference in their action in the visual cortex.
Action of PGE2 in both E-LTP and L-LTP
In the Schaffer collateral-CA1 pathway in the hippocampus, E-LTP generally does not depend on PKA (Frey et al., 1993; Abel et al., 1997; Huang et al., 2004), although a few studies reported that the inhibition of PKA by the direct injection of its inhibitors into postsynaptic cells impairs E-LTP (Blitzer et al., 1995; Otmakhova et al., 2000). In layer II/III of the visual cortex, however, genetic and pharmacological analyses demonstrated that the inhibition of PKA activity blocks the induction of TBS-induced and pairing-induced LTP, both of which are associated with E-LTP (Hensch et al., 1998; Liu et al., 2003), which is consistent with the current results demonstrating the absence of E-LTP with EP2-knockdown manipulation. The discrepancy in the PKA-involved phase of LTP between the hippocampal CA1 area and visual cortex may be explained by the regional specificity, as mentioned above. Regarding the question of how PKA regulates E-LTP in the visual cortex, it is possible to assume that TBS enhanced the phosphorylation of intracellular S845 of GluR1 through activated PKA. The phosphorylation of GluR1 might participate in E-LTP.
For L-LTP, the results of the present study are consistent with previous findings that PKA is involved in L-LTP in the hippocampus (Frey et al., 1993; Abel et al., 1997), although there are differences in stimulus conditions to induce L-LTP between the visual cortex and hippocampus. Accumulating evidence has indicated the postsynaptic involvement of CREB in LTP in the hippocampus (Impey et al., 1996; Davis et al., 2000), although the functions of CREB in TBS-induced LTP in the visual cortex were not reported. The current findings suggest that phosphorylated CREB in postsynaptic cells may promote transcription and protein synthesis (Lonze and Ginty, 2002). A recent study showed that the expression of the constitutively active form of CREB induces the overexpression of BDNF, which is involved in L-LTP (Barco et al., 2005). Here, we showed that the generation of BDNF mRNA after TBS is mediated via PGE2 receptor subtypes. Because BDNF controls spine formation (Ji et al., 2005), L-LTP can be maintained by reinforced responsiveness of postsynaptic sites.
Possibility for RNAi to perturb neuronal structure and function
In the course of revision of this paper Sabatini and colleagues reported that the “off-target effects” of RNAi can induce the perturbation of neuronal structure and function (Alvarez et al., 2006). They found that their RNAi with short hairpin RNAs (shRNAs) reduced the complexity of dendritic arbors of hippocampal neurons and triggered the loss of dendritic spines, and perturbed functions of excitatory and inhibitory synapses.
In the present study we performed several control experiments in which we did not detect significant changes in the expression levels of NR1, GluR1, CaMKIIα, phosphorylated CaMKIIα, and α-tubulin. Also, we found that the expressions of interferon-response gene, OAS1, IL-1β, and TNFα, were not activated to the pathological levels. However, we cannot completely exclude the possibility that our RNAi might induce some changes in morphology of neurons, because we did not perform systematic morphological analysis of cortical neurons in the present study. We would like to point out, however, that we did not find clearly detectable changes in the laminar structure of the visual cortex in our previous study, in which the exactly same method of RNAi as the present one was used (Akaneya et al., 2005). Also, it is to be noted that there are substantial differences between our and Alvarez et al.’s (2006) methods such as siRNA versus shRNA with different sequences, and in vivo gene transfer to visual cortical neurons by electroporation versus biolistic gene transfer to cultured hippocampal neurons. Alvarez et al. (2006) state that the perturbation they observed is independent of the targeted protein, but dependent on the sequence of the shRNA.
In the present study, the stable recordings from the RNAi-applied slices could be maintained as long as 3 h, similar to the control experiments without RNAi. Also we found that normal LTP was induced with iREP1 and iREP4, and even the larger magnitude of LTP was induced with iREP3 (Fig. 4).
Thus, it seems possible to state that our RNAi did not induce the off-target effects in neural circuits of the visual cortex to the extent to which field potentials were changed, although we cannot completely exclude finer changes in morphology of neurons in the cortex.
Footnotes
This work was supported in part by a Grant-in-Aid for Scientific Research from the Ministry of Education, Culture, Sports, and Science and Technology in Japan. We thank the Suntory Company for their kind gift of arachidonic acid and Dr. Bin Jiang for the critical reading of this manuscript.
References
- Abel T, Nguyen PV, Barad M, Deuel TA, Kandel ER, Bourtchouladze R. Genetic demonstration of a role for PKA in the late phase of LTP and in hippocampus-based long-term memory. Cell. 1997;88:615–626. doi: 10.1016/s0092-8674(00)81904-2. [DOI] [PubMed] [Google Scholar]
- Adesnik H, Nicoll RA, England PM. Photoinactivation of native AMPA receptors reveals their real-time trafficking. Neuron. 2005;48:977–985. doi: 10.1016/j.neuron.2005.11.030. [DOI] [PubMed] [Google Scholar]
- Akaneya A, Jiang B, Tsumoto T. RNAi-induced gene silencing by local electroporation in targeting brain region. J Neurophysiol. 2005;93:594–602. doi: 10.1152/jn.00161.2004. [DOI] [PubMed] [Google Scholar]
- Akaneya Y, Tsumoto T, Kinoshita S, Hatanaka H. Brain-derived neurotrophic factor enhances long-term potentiation in rat visual cortex. J Neurosci. 1997;17:6707–6716. doi: 10.1523/JNEUROSCI.17-17-06707.1997. [DOI] [PMC free article] [PubMed] [Google Scholar]
- Alvarez VA, Ridenour DA, Sabatini BL. Retraction of synapses and dendritic spines induced by off-target effects of RNA interference. J Neurosci. 2006;26:7820–7825. doi: 10.1523/JNEUROSCI.1957-06.2006. [DOI] [PMC free article] [PubMed] [Google Scholar]
- Barco A, Patterson S, Alarcon JM, Gromova P, Mata-Roig M, Morozov A, Kandel ER. Gene expression profiling of facilitated L-LTP in VP16-CREB mice reveals that BDNF is critical for the maintenance of LTP and its synaptic capture. Neuron. 2005;48:123–137. doi: 10.1016/j.neuron.2005.09.005. [DOI] [PubMed] [Google Scholar]
- Barria A, Derkach V, Soderling T. Identification of the Ca2+/calmodulin-dependent protein kinase II regulatory phosphorylation site in the alpha-amino-3-hydroxyl-5-methyl-4-isoxazole-propionate-type glutamate receptor. J Biol Chem. 1997;272:32727–32730. doi: 10.1074/jbc.272.52.32727. [DOI] [PubMed] [Google Scholar]
- Bazan NG. Synaptic lipid signaling: significance of polyunsaturated fatty acids and platelet-activating factor. J Lipid Res. 2003;44:2221–2233. doi: 10.1194/jlr.R300013-JLR200. [DOI] [PubMed] [Google Scholar]
- Bear MF, Kirkwood A. Neocortical long-term potentiation. Curr Opin Neurobiol. 1993;3:197–202. doi: 10.1016/0959-4388(93)90210-p. [DOI] [PubMed] [Google Scholar]
- Bezzi P, Carmignoto G, Pasti L, Vesce S, Rossi D, Rizzini BL, Pozzan T, Volterra A. Prostaglandins stimulate calcium-dependent glutamate release in astrocytes. Nature. 1998;391:281–285. doi: 10.1038/34651. [DOI] [PubMed] [Google Scholar]
- Bliss TV, Collingridge GL. A synaptic model of memory: long-term potentiation in the hippocampus. Nature. 1993;361:31–39. doi: 10.1038/361031a0. [DOI] [PubMed] [Google Scholar]
- Blitzer RD, Wong T, Nouranifar R, Iyengarr R, Landau EM. Postsynaptic pathway gates early LTP in hippocampal CA1 region. Neuron. 1995;15:1403–1414. doi: 10.1016/0896-6273(95)90018-7. [DOI] [PubMed] [Google Scholar]
- Castro-Alamancos MA, Connors BW. Distinct forms of short-term plasticity at excitatory synapses of hippocampus and neocortex. Proc Natl Acad Sci USA. 1997;94:4161–4166. doi: 10.1073/pnas.94.8.4161. [DOI] [PMC free article] [PubMed] [Google Scholar]
- Chang HM, Paulson M, Holko M, Rice CM, Williams BR, Marie I, Levy DE. Induction of interferon-stimulated gene expression and antiviral responses require protein deacetylase activity. Proc Natl Acad Sci USA. 2004;101:9578–9583. doi: 10.1073/pnas.0400567101. [DOI] [PMC free article] [PubMed] [Google Scholar]
- Chen C, Bazan NG. Endogenous PGE2 regulates membrane excitability and synaptic transmission in hippocampal CA1 pyramidal neurons. J Neurophysiol. 2005;93:929–941. doi: 10.1152/jn.00696.2004. [DOI] [PubMed] [Google Scholar]
- Chen C, Magee JC, Bazan NG. Cyclooxygenase-2 regulates prostaglandin E2 signaling in hippocampal long-term synaptic plasticity. J Neurophysiol. 2002;87:2851–2857. doi: 10.1152/jn.2002.87.6.2851. [DOI] [PubMed] [Google Scholar]
- Chetkovitch DM, Gray R, Johnston D, Sweatt JD. N-methyl-d-aspartate receptor activation increases cAMP levels and voltage-gated Ca2+ channel activity in area CA1 of hippocampus. Proc Natl Acad Sci USA. 1991;88:6467–6471. doi: 10.1073/pnas.88.15.6467. [DOI] [PMC free article] [PubMed] [Google Scholar]
- Christoforidis S, McBride HM, Burgoyne RD, Zerial M. The Rab5 effector EEA1 is a core component of endosome docking. Nature. 1999;397:621–625. doi: 10.1038/17618. [DOI] [PubMed] [Google Scholar]
- Collingridge GL, Isaac JTR, Wang YT. Receptor trafficking and synaptic plasticity. Nat Rev Neurosci. 2004;5:952–962. doi: 10.1038/nrn1556. [DOI] [PubMed] [Google Scholar]
- Davis S, Vanhoutte P, Pages C, Caboche J, Laroche S. The MAPK/ERK cascade targets both Elk-1 and cAMP response element-binding protein to control long-term potentiation-dependent gene expression in the dentate gyrus in vivo. J Neurosci. 2000;20:4563–4572. doi: 10.1523/JNEUROSCI.20-12-04563.2000. [DOI] [PMC free article] [PubMed] [Google Scholar]
- Ehlers MD. Reinsertion or degradation of AMPA receptors determined by activity-dependent endocytic sorting. Neuron. 2000;28:511–525. doi: 10.1016/s0896-6273(00)00129-x. [DOI] [PubMed] [Google Scholar]
- Elphick MR, Egertova M. The neurobiology and evolution of cannabinoid signalling. Philos Trans R Soc Lond B Biol Sci. 2001;356:381–408. doi: 10.1098/rstb.2000.0787. [DOI] [PMC free article] [PubMed] [Google Scholar]
- Esteban JA, Shi SH, Wilson C, Nuriya M, Huganir RL, Malinow R. PKA phosphorylation of AMPA receptor subunits controls synaptic trafficking underlying plasticity. Nat Neurosci. 2003;6:136–143. doi: 10.1038/nn997. [DOI] [PubMed] [Google Scholar]
- Farooqui AA, Yang HC, Rosenberger TA, Horrocks LA. Phospholipase A2 and its role in brain tissue. J Neurochem. 1997;69:889–901. doi: 10.1046/j.1471-4159.1997.69030889.x. [DOI] [PubMed] [Google Scholar]
- Fitzsimonds RM, Poo MM. Retrograde signaling in the development and modification of synapses. Physiol Rev. 1998;78:143–170. doi: 10.1152/physrev.1998.78.1.143. [DOI] [PubMed] [Google Scholar]
- Frey U, Huang YY, Kandel ER. Effects of cAMP simulate a late stage of LTP in hippocampal CA1 neurons. Science. 1993;260:1661–1664. doi: 10.1126/science.8389057. [DOI] [PubMed] [Google Scholar]
- Gottschalk W, Pozzo-Miller LD, Figurov A, Lu B. Presynaptic modulation of synaptic transmission and plasticity by brain-derived neurotrophic factor in the developing hippocampus. J Neurosci. 1998;18:6830–6839. doi: 10.1523/JNEUROSCI.18-17-06830.1998. [DOI] [PMC free article] [PubMed] [Google Scholar]
- Grosshans DR, Clayton DA, Coultrap SJ, Browning MD. LTP leads to rapid surface expression of NMDA but not AMPA receptors in adult rat CA1. Nat Neurosci. 2002;5:27–33. doi: 10.1038/nn779. [DOI] [PubMed] [Google Scholar]
- Hensch TK, Gordon JA, Brandon EP, McKnight GS, Idzerda RL, Stryker MP. Comparison of plasticity in vivo and in vitro in the developing visual cortex of normal and protein kinase A RIbeta-deficient mice. J Neurosci. 1998;18:2108–2117. doi: 10.1523/JNEUROSCI.18-06-02108.1998. [DOI] [PMC free article] [PubMed] [Google Scholar]
- Heynan AJ, Bear MF. Long-term potentiation of thalamocortical transmission in the adult visual cortex in vivo. J Neurosci. 2001;21:9801–9813. doi: 10.1523/JNEUROSCI.21-24-09801.2001. [DOI] [PMC free article] [PubMed] [Google Scholar]
- Huang YY, Pittenger C, Kandel ER. A form of long-lasting, learning-related synaptic plasticity in the hippocampus induced by heterosynaptic low-frequency pairing. Proc Natl Acad Sci USA. 2004;101:859–864. doi: 10.1073/pnas.2237201100. [DOI] [PMC free article] [PubMed] [Google Scholar]
- Impey S, Mark M, Villacres EC, Poser S, Chavkin C, Storm DR. Induction of CRE-mediated gene expression by stimuli that generate long-lasting LTP in area CA1 of the hippocampus. Neuron. 1996;16:973–982. doi: 10.1016/s0896-6273(00)80120-8. [DOI] [PubMed] [Google Scholar]
- Ji Y, Pang PT, Feng L, Lu B. Cyclic AMP controls BDNF-induced TrkB phosphorylation and dendritic spine formation in mature hippocampal neurons. Nat Neurosci. 2005;8:164–712. doi: 10.1038/nn1381. [DOI] [PubMed] [Google Scholar]
- Jiang B, Akaneya Y, Ohshima M, Ichisaka S, Hata Y, Tsumoto T. Brain-derived neurotrophic factor induces long-lasting potentiation of synaptic transmission in visual cortex in vivo in young rats, but not in the adult. Eur J Neurosci. 2001;14:1219–1228. doi: 10.1046/j.0953-816x.2001.01751.x. [DOI] [PubMed] [Google Scholar]
- Jovanovic JN, Czernik AJ, Fienberg AA, Greengard P, Sihra TS. Synapsins as mediators of BDNF-enhanced neurotransmitter release. Nat Neurosci. 2000;3:323–329. doi: 10.1038/73888. [DOI] [PubMed] [Google Scholar]
- Jumblatt MM, Paterson CA. Prostaglandin E2 effects on corneal endothelial cyclic adenosine monophosphate synthesis and cell shape are mediated by a receptor of the EP2 subtype. Invest Ophthalmol Vis Sci. 1991;32:360–365. [PubMed] [Google Scholar]
- Kaufmann WE, Worley PF, Pegg J, Bremer M, Isakson P. COX-2, a synaptically induced enzyme, is expressed by excitatory neurons at postsynaptic sites in rat cerebral cortex. Proc Natl Acad Sci USA. 1996;93:2317–2321. doi: 10.1073/pnas.93.6.2317. [DOI] [PMC free article] [PubMed] [Google Scholar]
- Kirkwood A, Bear MF. Hebbian synapses in visual cortex. J Neurosci. 1994;14:1634–1645. doi: 10.1523/JNEUROSCI.14-03-01634.1994. [DOI] [PMC free article] [PubMed] [Google Scholar]
- Kurotani T, Higashi S, Inokawa H, Toyama K. Protein and RNA synthesis-dependent and -independent LTPs in developing rat visual cortex. NeuroReport. 1996;8:35–39. doi: 10.1097/00001756-199612200-00008. [DOI] [PubMed] [Google Scholar]
- Liao D, Scannevin RH, Hugani R. Activation of silent synapses by rapid activity-dependent synaptic recruitment of AMPA receptors. J Neurosci. 2001;21:6008–6017. doi: 10.1523/JNEUROSCI.21-16-06008.2001. [DOI] [PMC free article] [PubMed] [Google Scholar]
- Lisman J. Long-term potentiation: outstanding questions and attempted synthesis. Philos. Trans R Soc Lond B Biol Sci. 2003;358:829–842. doi: 10.1098/rstb.2002.1242. [DOI] [PMC free article] [PubMed] [Google Scholar]
- Liu S, Rao Y, Daw N. Roles of protein kinase A and protein kinase G in synaptic plasticity in the visual cortex. Cereb Cortex. 2003;13:864–869. doi: 10.1093/cercor/13.8.864. [DOI] [PubMed] [Google Scholar]
- Lonze BE, Ginty DD. Function and regulation of CREB family transcription factors in the nervous system. Neuron. 2002;15:605–623. doi: 10.1016/s0896-6273(02)00828-0. [DOI] [PubMed] [Google Scholar]
- Lynch MA. Long-term potentiation and memory. Physiol Rev. 2004;84:87–136. doi: 10.1152/physrev.00014.2003. [DOI] [PubMed] [Google Scholar]
- Malenka RC, Nicoll RA. Long-term potentiation–a decade of progress? Science. 1999;285:1870–1874. doi: 10.1126/science.285.5435.1870. [DOI] [PubMed] [Google Scholar]
- Mammen AL, Kameyama K, Roche KW, Huganir RL. Phosphorylation of the alpha-amino-3-hydroxy-5-methylisoxazole4-propionic acid receptor GluR1 subunit by calcium/calmodulin-dependent kinase II. J Biol Chem. 1997;272:32528–32533. doi: 10.1074/jbc.272.51.32528. [DOI] [PubMed] [Google Scholar]
- Man HY, Lin JW, Ju WH, Ahmadian G, Liu L, Becker LE, Sheng M, Wang YT. Regulation of AMPA receptor-mediated synaptic transmission by clathrin-dependent receptor internalization. Neuron. 2000;25:649–662. doi: 10.1016/s0896-6273(00)81067-3. [DOI] [PubMed] [Google Scholar]
- Narumiya S, FitzGerald GA. Genetic and pharmacological analysis of prostanoid receptor function. J Clin Inv. 2001;108:25–30. doi: 10.1172/JCI13455. [DOI] [PMC free article] [PubMed] [Google Scholar]
- Narumiya S, Sugimoto Y, Ushikubi F. Prostanoid receptors: structures, properties, and functions. Physiol Rev. 1999;79:1193–1226. doi: 10.1152/physrev.1999.79.4.1193. [DOI] [PubMed] [Google Scholar]
- Osten P, Khatri L, Peretz JL, Kohr G, Giese G, Daly C, Schultz TW, Wensky A, Lee LM, Ziff EB. Mutagenesis reveals a role for ABP/GRIP binding to GluR2 in synaptic surface accumulation of the AMPA receptor. Neuron. 2000;27:313–325. doi: 10.1016/s0896-6273(00)00039-8. [DOI] [PubMed] [Google Scholar]
- Otmakhova NA, Otmakhov N, Mortenson LH, Lisman JE. Inhibition of the cAMP pathway decreases early long-term potentiation at CA1 hippocampal synapses. J Neurosci. 2000;20:4446–4451. doi: 10.1523/JNEUROSCI.20-12-04446.2000. [DOI] [PMC free article] [PubMed] [Google Scholar]
- Roche KW, O’Brien RJ, Mammen AL, Bernhardt J, Huganir RL. Characterization of multiple phosphorylation sites on the AMPA receptor GluR1 subunit. Neuron. 1996;16:1179–1188. doi: 10.1016/s0896-6273(00)80144-0. [DOI] [PubMed] [Google Scholar]
- Sang N, Zhang J, Marcheselli V, Bazan NG, Chen C. Postsynaptically synthesized prostaglandin E2 (PGE2) modulates hippocampal synaptic transmission via a presynaptic PGE2 EP2 receptor. J Neurosci. 2005;25:9858–9870. doi: 10.1523/JNEUROSCI.2392-05.2005. [DOI] [PMC free article] [PubMed] [Google Scholar]
- Scacheri PC, Rozenblatt-Rosen O, Caplen NJ, Wolfsberg TG, Umayam L, Lee JC, Hughes CM, Shanmugam KS, Bhattacharjee A, Meyerson M, Collins FS. Short interfering RNAs can induce unexpected and divergent changes in the levels of untargeted proteins in mammalian cells. Proc Natl Acad Sci USA. 2004;17:1892–1897. doi: 10.1073/pnas.0308698100. [DOI] [PMC free article] [PubMed] [Google Scholar]
- Sugimoto Y, Namba T, Honda A, Hayashi Y, Negishi M, Ichikawa A, Narumiya S. Cloning and expression of a cDNA for mouse prostaglandin E receptor EP3 subtype. J Biol Chem. 1992;267:6463–6466. [PubMed] [Google Scholar]
- Sugimoto Y, Namba T, Negishi M, Mizuno N, Narumiya S, Ichikawa A. Distribution of the messenger RNA for the prostaglandin E receptor subtypes in the mouse nervous system. Neuroscience. 1994;62:919–928. doi: 10.1016/0306-4522(94)90483-9. [DOI] [PubMed] [Google Scholar]
- Sukharev SI, Klenchin VA, Serov SM, Chernomordik LV, Chizmadzhev YuA. Electroporation and electrophoretic DNA transfer into cells. The effect of DNA interaction with electropores. Biophys J. 1992;63:1320–1327. doi: 10.1016/S0006-3495(92)81709-5. [DOI] [PMC free article] [PubMed] [Google Scholar]
- Tsumoto T. Long-term potentiation and long-term depression in the neocortex. Prog Neurobiol. 1992;39:209–228. doi: 10.1016/0301-0082(92)90011-3. [DOI] [PubMed] [Google Scholar]
- Watabe A, Sugimoto Y, Honda A, Irie A, Namba T, Negishi M, Ito S, Narumiya S, Ichikawa A. Cloning and expression of cDNA for a mouse EP1 subtype of prostaglandin E receptor. J Biol Chem. 1993;268:20175–20178. [PubMed] [Google Scholar]
- White RR, Kwon YG, Taing M, Lawrence DS, Edelman AM. Definition of optimal substrate recognition motifs of Ca2+-calmodulin-dependent protein kinases IV and II reveals shared and distinctive features. J Biol Chem. 1998;273:3166–3172. doi: 10.1074/jbc.273.6.3166. [DOI] [PubMed] [Google Scholar]
- Williams JH. Retrograde messengers and long-term potentiation: a progress report. J Lipid Mediat Cell Signal. 1996;14:331–339. doi: 10.1016/0929-7855(96)00542-1. [DOI] [PubMed] [Google Scholar]
- Wilson JM, de Hoop M, Zorzi N, Toh BH, Dotti CG, Parton RG. EEA1, a tethering protein of the early sorting endosome, shows a polarized distribution in hippocampal neurons, epithelial cells, and fibroblasts. Mol Biol Cell. 2000;11:2657–2671. doi: 10.1091/mbc.11.8.2657. [DOI] [PMC free article] [PubMed] [Google Scholar]
- Yamagata K, Andreasson KI, Kaufmann WE, Barnes CA, Worley PF. Expression of a mitogen-inducible cyclooxygenase in brain neurons: regulation by synaptic activity and glucocorticoids. Neuron. 1993;11:371–386. doi: 10.1016/0896-6273(93)90192-t. [DOI] [PubMed] [Google Scholar]
- Zhang J, Rivest S. Distribution, regulation and colocalization of the genes encoding the EP2- and EP4-PGE2 receptors in the rat brain and neuronal responses to systemic inflammation. Eur J Neurosci. 1999;11:2651–2668. doi: 10.1046/j.1460-9568.1999.00682.x. [DOI] [PubMed] [Google Scholar]
- Zhu P, Genc A, Zhang X, Zhang J, Bazan NG, Chen C. Heterogeneous expression and regulation of hippocampal prostaglandin E2 receptors. J Neurosci Res. 2005;81:817–826. doi: 10.1002/jnr.20597. [DOI] [PubMed] [Google Scholar]