

Abstract
The left hemisphere of the human cerebral cortex is dominant for processing rapid acoustic stimuli, including speech, and this specialized activity is preceded by processing in the auditory brainstem. It is not known to what extent the integrity of brainstem encoding of speech impacts patterns of asymmetry at cortex. Here, we demonstrate that the precision of temporal encoding of speech in auditory brainstem predicts cerebral asymmetry for speech sounds measured in a group of children spanning a range of language skills. Results provide strong evidence that timing deficits measured at the auditory brainstem negatively impact rapid acoustic processing by specialized structures of cortex, and demonstrate a delicate relationship between cortical activation patterns and the temporal integrity of cortical input.
Keywords: auditory brainstem, auditory cortex, reading, dyslexia, cerebral asymmetry, speech
Introduction
The left hemisphere of the cerebral cortex is dominant in the processing of speech, and multiple lines of evidence have demonstrated a general preference of left auditory regions for the processing of rapid acoustic signals (Belin et al., 1998; Liégeois-Chauvel et al., 1999; Zatorre and Belin, 2001). Activation of specialized structures in the left hemisphere is preceded by processing in the auditory brainstem, a series of nuclei that receive input from the acoustic nerve and transmit this signal to the cortex via auditory thalamus. It is not known to what extent the integrity of brainstem encoding of speech is related to patterns of asymmetry at cortex. Here, we demonstrate a correlation between the precision of temporal encoding of speech in auditory brainstem and cerebral asymmetry for speech sounds.
The auditory brainstem response (ABR) reflects neurophysiologic activity from synchronous neuronal ensembles in rostral and posterior brainstem structures. The ABR has emerged as an experimental tool to assess the integrity of brainstem processing of speech and other complex stimuli in normal and impaired populations (Kraus and Nicol, 2005). Speech-evoked ABRs represent temporal features of speech stimuli with great fidelity and delays in the response on the order of fractions of milliseconds have been linked to abnormal perception and linguistic abilities.
Auditory-evoked cortical responses reflect the summation of EPSPs originating from structures located primarily in the temporal lobe. Like ABRs, cortical potentials rely on stimulus-locked, synchronous firing from neuronal ensembles; however, they provide an abstract representation of features in acoustic stimuli. The early components of cortical responses (<150 ms) reflect obligatory acoustic processing of speech stimuli (Sharma et al., 2000) and left-asymmetric responses in this time range is thought to describe its preference for processing of rapid acoustic signals, including speech (Liégeois-Chauvel et al., 1999; Bellis et al., 2000).
To investigate a correspondence between brainstem encoding of speech and patterns of asymmetry at cortex, speech-evoked ABRs and cortical asymmetry for speech were evaluated in a group of children spanning a range in language skills, including children with language-based learning disabilities (LD). LD children were included in this study to provide the larger group with a wide range of neurophysiologic profiles: LDs have long been associated with abnormal cerebral asymmetry (Morgan, 1896) and more recently have demonstrated deficient encoding of speech sounds in the auditory brainstem (Cunningham et al., 2001; Banai et al., 2005; Wible et al., 2005). We also tested subjects on behavioral measures, including speech sound perception and tests of academic achievement, to assess a potential relationship between behavior and cortical asymmetry.
Materials and Methods
The research protocol was approved by the Institutional Review Board of Northwestern University. Parental consent and the child's assent were obtained for all evaluation procedures, and children were paid for their participation in the study.
Subjects.
All children were between 8 and 12 years of age, reported no history of neurological or otological disease, and were of normal intelligence (scores >85 on the Brief Cognitive Scale) (Woodcock and Johnson, 1977). In addition, all children had normal pure-tone hearing thresholds and click-evoked ABRs. The grouping of subjects in this work is based entirely on brainstem or cortical physiologic measures; however, normal (NL) and LD children are briefly described here, with group statistics provided in Table 1. LD children (n = 30) were age-matched to NLs (n = 37). Children with learning problems consisted of children who had been formally identified as such by an independent pyschoeducational diagnostician. Inspection of Table 1 reveals that the mean reading and spelling scores for LD subjects are below average (average is a score of 100 for these standardized test scores), but are not in the “impaired” range, defined as a score of <85. In addition, mean reading and spelling scores of NLs are considered above average. Nevertheless, the normal group differed significantly from the LD group on measures of auditory processing (Woodcock and Johnson, 1989) (a composite score derived from the Incomplete Words and Sound Blending subtests), single-word reading and spelling (p < 0.001 for these three tests) (Wilkinson, 1993) and a measure of speech sound discrimination (p < 0.03) (Carrell et al., 1999).
Table 1.
Normal and learning-disabled subject characteristics
| NL | LD | p | |
|---|---|---|---|
| N | 30 | 37 | |
| Age (years) | 10.6 (1.6) | 10.0 (1.5) | NS |
| IQ | 120.5 (13.7) | 105.6 (14) | <0.01 |
| Reading | 114.4 (14.1) | 93.7 (14.6) | <0.01 |
| Spelling | 112.9 (12.8) | 92.8 (15.6) | <0.01 |
| Word attack | 112.6 (13.2) | 93.6 (14.3) | <0.01 |
| Auditory processing | 98.8 (11.0) | 89.5 (9.2) | <0.01 |
| Incomplete words | 95.8 (12.5) | 92.4 (11.1) | NS |
| Memory for words | 105.8 (14.9) | 95.5 (11.5) | <0.01 |
| Sound blending | 101.7 (12.4) | 90.1 (11.8) | <0.01 |
| Listening comprehension | 123.0 (16.7) | 112.7 (18.3) | <0.05 |
| Cross out | 111.9 (11.5) | 106.6 (14.1) | NS |
| Just noticeable difference | |||
| /da/–/ga/ (Hz) | 95.6 (53.1) | 124.8 (51.0) | <0.01 |
| /ba/–/wa/ (ms) | 8.5 (2.9) | 7.7 (2.9) | NS |
Values in parentheses indicate SDs.
Recording procedure.
The procedures to measure brainstem and cortical responses were identical to those that have been described (Russo et al., 2004; Warrier et al., 2004). Brainstem and cortical responses were measured during different sessions. Brainstem responses were differentially recorded at a sampling rate of 20 kHz using a vertex electrode referenced to the right earlobe. The forehead served as ground. Three blocks of 1000 repetitions were collected at each polarity. For cortical responses, recording electrodes were placed at the vertex and over left and right temporal lobes; TL was located halfway between electrode sites T3 and T5 according to the international 10–20 system (Jasper, 1958), and TR was located halfway between T4 and T6. The nose served as the reference electrode, and the forehead served as ground. Cortical responses were sampled at 2 kHz, and 1000 repetitions were collected. For both brainstem and cortical recordings, speech sounds were presented to the right ear at 80 dB sound pressure level through insert earphones. The interstimulus interval was 51 ms for brainstem responses and 590 ms for cortical responses. Because the side of stimulation was held constant for all subjects (right ear), we reasoned that subject differences in cortical asymmetry could not be attributable to stimulus delivery issues. The stimulus used to evoke brainstem and cortical responses was the speech syllable /da/ synthesized at a sampling rate of 10 kHz. The stimulus was 40 ms in duration and consisted of five formants with an onset burst during the first 10 ms at F3, F4, and F5.
Data analysis.
Brainstem responses to the speech sound /da/ have been described in previous reports (Cunningham et al., 2001; King et al., 2002; Russo et al., 2004, 2005; Wible et al., 2004, 2005; Banai et al., 2005; Johnson et al., 2005) and are extremely reliable between and within subjects (Russo et al., 2004). Amplitudes and latencies for brainstem onset (peaks V and A), offset (peak O), and fundamental frequency following (peaks D, E, and F) were identified for each subject. To enable comparisons between peak latencies, Z scores for all peak latencies were calculated. To prevent spurious results from regression analyses, which can be overly biased by outlying data points, all raw (i.e., before Z score calculation) brainstem peak and cortical asymmetry values beyond 2 SDs of the mean were moved to the 2 SD point for that particular measure. Across all brainstem peak and cortical asymmetry measures, 19 data points (of a total of 455) were moved to the 2 SD point. Brainstem responses in one normal and one LD subject did not indicate a clear peak D and peak O, respectively. Because ANOVA and regression analyses explicitly relied on latency and amplitude data for all brainstem peaks, these subjects were omitted. Detailed descriptions of all analyses are provided throughout Results and are not repeated here.
Results
Figure 1, bottom, shows the /da/ stimulus waveform and three overlaid brainstem responses. Common among these three responses is that temporal features of the stimulus are represented in brainstem responses: stimulus onset is evidenced by a large positive–negative peak complex at ∼8.5 ms after stimulus onset (peaks V and A); phase-locking to the fundamental frequency of the stimulus is represented by negative peaks between 20 and 45 ms (peaks D, E, F); the offset of the stimulus is represented by a negative peak at ∼49 ms (peak O). The presence of these particular peaks is extremely consistent between subjects and has been described in previous reports (King et al., 2002; Russo et al., 2004; Wible et al., 2004; Banai et al., 2005; Johnson et al., 2005). It has been proposed that peaks representing acoustic transients in the stimulus (peaks V, A, and O) are served by distinct neural mechanisms relative to those representing steady-state aspects of the stimulus, like the fundamental frequency (peaks D, E, and F) (Kraus and Nicol, 2005).
Figure 1.
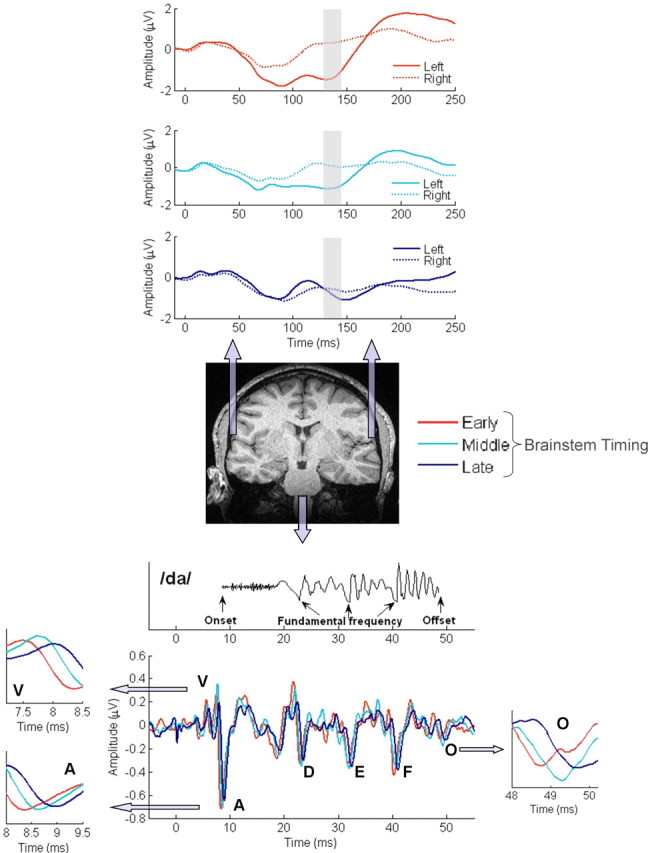
Grand average neurophysiologic responses. Bottom, Acoustic waveform of the synthesized speech stimulus /da/ (above) and grand average auditory brainstem responses to /da/ (below). The stimulus has been moved forward in time to the latency of onset responses (peak V) to enable direct comparisons with brainstem responses. Lower insets, First, third, and fifth quintile responses for waves V, A, and O. Top, Grand average cortical responses measured from left and right hemisphere temporal electrodes, grouped by latency of ABR responses.
Regardless of the stereotyped morphology of responses, slight variations in the timing of brainstem peak latencies are evident across subjects, and previous studies have indicated that delays in the representation of acoustic transients by the brainstem, such as speech onset and offset are related to literacy in school-aged children (Cunningham et al., 2001; King et al., 2002; Wible et al., 2004; Banai et al., 2005). We ranked subjects' brainstem responses according to the latency of onset and offset peaks by transforming absolute latencies of peaks V, A, and O into Z scores, and then averaged these Z-score values for each subject. This provided a single score for a subject that represented the composite transient (onset and offset) response of the brainstem to the speech sound stimulus. We then divided the subjects into five groups in ascending order of brainstem latency and averaged the responses within each group. Dividing all the subjects into five groups for this initial analysis enabled large enough samples (n = 13) to avoid a single subject overwhelming an average across responses while also enabling a reasonable gradient by which to assess cortical activation patterns as a function of brainstem onset/offset latency. The zoomed-in plots of peaks V, A, and O in Figure 1 show the latency differences, which are on the order of tenths of milliseconds, between first (early), third (middle), and fifth quintile (late) brainstem responses to transients. Table 2 lists the number of subjects, as well as the breakdown of normal and LD subjects, in the five groups categorized according to brainstem transient (onset/offset) latency.
Table 2.
ABR grouping
| Quintile 1 (early ABR) | Quintile 2 | Quintile 3 | Quintile 4 | Quintile 5 (late ABR) | |
|---|---|---|---|---|---|
| N, Total | 13 | 13 | 13 | 13 | 13 |
| N, NL | 8 | 4 | 6 | 6 | 5 |
| N, LD | 5 | 9 | 7 | 7 | 8 |
| Age (years) | 10.2 (1.4) | 9.9 (1.5) | 11.3 (1.7) | 10.3 (1.4) | 9.9 (1.5) |
| IQ | 107.5 (15.8) | 115.9 (16.0) | 113.5 (12.1) | 116.2 (15.8) | 108.8 (19.2) |
| Peak V latency (ms) | 7.4 (0.2) | 7.6 (0.1) | 7.8 (0.1) | 7.9 (0.1) | 8.0 (0.1) |
| Peak A latency (ms) | 8.4 (0.1) | 8.6 (0.2) | 8.6 (0.1) | 8.8 (0.2) | 9.0 (0.2) |
| Peak O latency (ms) | 48.7 (0.8) | 48.7 (0.4) | 49.1 (0.5) | 49.1 (0.5) | 49.9 (0.7) |
| Asymmetry, 130–145 ms (μV) | −47.9 (38.1) | −58.0 (44.1) | −36.4 (33.8) | −34.1 (57.9) | −8.0 (28.7) |
Values in parentheses indicate SDs.
For cortical responses, we calculated the global field power (GFP), a measure defined as the SD across multiple channels as a function of time. Peaks in the GFP serve to isolate and identify auditory evoked potential components and reflect a maximum of the total underlying brain activity that contributes to the surface potential field (Lehmann and Skrandies, 1980). A dominant peak identified in the GFP for both normal and LD subjects occurred at ∼140 ms, consistent with a pattern of cortical activation that has been described in previous reports (Wolpaw and Penry, 1975, 1977; Tonnquist-Uhlén et al., 2003). This GFP result enabled us to focus our investigation on auditory cortical responses at this latency.
To investigate cortical activation patterns associated with delayed brainstem timing, cortical responses were averaged within each of the five brainstem timing-defined groups. Figure 1, top, shows a distinct relationship between the relative timing of brainstem peaks and early cortical responses: subjects in the early brainstem timing group show a striking left-dominant cortical activation pattern, whereas middle and late groups showed progressively more similar responses between temporal electrodes, with subjects in the late group showing virtually symmetric responses. This pattern was most prominent at latencies centered at 140 ms (shaded region), the latency range identified in the GFP analysis. The large amplitude difference between left and right temporal electrodes seen in the early brainstem group has been described in previous reports as an indicator of cortical response asymmetry (Näätänen et al., 1997; Bellis et al., 2000) and provides evidence for diminished cortical asymmetry for speech sounds in children with delayed brainstem responses. One-way ANOVA statistics comparing individual subjects' cortical asymmetry, defined as the mean amplitude difference between TL and TR electrodes from 130 to 145 ms, for the three brainstem-defined groups displayed in Figure 1, top, indicated a significant effect of brainstem timing on cortical asymmetry (F(2,36)= 4.805; p = 0.014). Post hoc Tukey's honestly significant difference comparisons revealed that the early ABR group exhibited greater asymmetry than the late group (p = 0.013); however, the middle group was not statistically different from either the early or late group (p > 0.05).
To further investigate the relationship between the timing of brainstem response onset/offset and cortical asymmetry, we evaluated this phenomenon across all subjects. To assign an asymmetry value to each subject, we calculated the mean amplitude difference between TL and TR electrodes for all subjects from 130 to 145 ms, producing a range of numbers from −150 through +50 μV, with the most negative values indicating responses with the greatest leftward dominance. To quantify the relationship between brainstem timing for transients and cortical asymmetry, we performed a regression analysis on subjects' average brainstem onset/offset peak latency Z score and asymmetry values. This relationship is displayed in Figure 2A, and results indicate that the timing of onset/offset transients in the brainstem response predicts the degree of cerebral asymmetry across subjects (F(1,63)= 10.365; p = 0.002; r2= 0.14). This relationship is markedly stronger when the three data points outside of the 95% confidence interval are removed from the regression analysis (F(1,60)= 15.947; p = 0.0002; r2= 0.21) (note that two of the data points outside of the 95% confidence interval fall on top of one another, making it appear that only two data points are outside this interval). The same relationship was found when the LD group was analyzed separately from the normal group (F(1,34)= 5.376; p = 0.027; r2= 0.14) and was marginally significant because of an outlying data point when the normal group was analyzed separately (with outlier: F(1,27)= 4.065, p = 0.054, r2= 0.13; without outlier: F(1,26)= 6.510, p = 0.017, r2= 0.20). The within-group results indicate that the relationship between brainstem timing and cortical asymmetry is a general property of the central auditory system regardless of diagnostic category.
Figure 2.

Brainstem responses and cortical asymmetry. The linear fit for the data in both plots is indicated by the central line and is flanked by dashed lines indicating the limits of the range for prediction of individual data points with 95% certainty. A, Brainstem onset/offset and cortical asymmetry. B, Brainstem frequency following and cortical asymmetry.
Contrary to findings with respect to onset/offset peaks in the brainstem response, no relationship was seen between fundamental frequency phase-locking, defined as the average Z-transformed latency of peaks D, E, and F, and cortical asymmetry (Fig. 2B). Regression of the timing of fundamental frequency phase-locking on cerebral asymmetry was neither significant when analyzed across all subjects (F(1,63)= 0.936; p = 0.337; r2= 0.01; not significant) nor when analyzed separately in the normal and LD groups (normal group only: F(1,28)= 0.147, p = 0.704, r2= 0.005, not significant; LD only: F(1,34)= 0.935, p = 0.34, r2= 0.027, not significant). Moreover, no relationship was seen between cortical asymmetry and any measure of brainstem peak amplitude or frequency-domain spectrum (p > 0.15 for all measures; not significant). Consistent with previous reports, these data demonstrate dissociation between onset/offset and frequency following components of the brainstem response, further suggesting separate mechanisms for these features of the response (Kraus and Nicol, 2005).
It is not known to what extent abnormal brain processing of brief speech sound stimuli may be related to behavioral deficits on tasks that rely on normal auditory function. We reasoned that if the current measure of cortical asymmetry reflected temporal processing of the speech signal, then individuals with abnormal patterns of asymmetry should reveal deficits on two types of behavioral tasks: tasks that directly measure rapid acoustic processing (Johnsrude et al., 1997; Belin et al., 1998; Joanisse and Gati, 2003; Zaehle et al., 2004) such as speech sound discrimination, and linguistic measures, such as reading and phonological processing, which are thought to be negatively affected as a consequence of deficient acoustic processing (Tallal et al., 1993). To test this hypothesis, we first divided the combined normal and LD group into quintiles based on strength of cortical asymmetry (Table 3). Then, we compared individual subjects' scores of speech perception and academic achievement for those subjects with the strongest and weakest leftward asymmetry, determined by the bottom and top asymmetry quintiles for the combined normal and LD group (n = 14) (Fig. 3). Results indicated that strong left-dominant subjects performed better in discriminating the speech syllable /da/ from /ga/, a contrast that requires precise acoustic processing of rapid frequency transitions (t = 2.575; p = 0.016). Discrimination between the speech syllables /ba/–/wa/, a contrast that varies in the duration of the formant transition, serves as a task control to /da/–/ga/ discrimination (Kraus et al., 1996), which varies in the spectral content of the formant transition. There was no difference between strong and weak left-dominant subjects on the /ba/–/wa/ discrimination task (t = 0.511; p > 0.50; not significant). The strong left-dominant subjects also performed better on tests of phonological processing and spelling, and results from a single-word reading test narrowly missed statistical significance (auditory processing: t = 2.106, p = 0.045; spelling: t = 2.608, p = 0.015; single-word reading: t = 1.897, p = 0.068). The majority of strong (n = 12) and weak (n = 13) left-dominant subjects were also tested on nonword reading, another important measure of phonological ability, and again strong left-dominant subjects performed better (t = 2.366; p = 0.027). A consideration is that the strong left-dominant subject group consists primarily of normal subjects, whereas the weak left-dominant group has primarily LDs (Table 3), which explains the discrepancy in the behavioral scores between these groups. Nevertheless, these data suggest that the current measure of cortical asymmetry reflects essential temporal processing of the speech stimulus and that abnormal acoustic encoding of speech sounds by left hemisphere auditory areas may contribute to reading deficits.
Table 3.
Asymmetry grouping and measures of academic achievement
| Quintile 1 (strong left-dominant) | Quintile 2 | Quintile 3 | Quintile 4 | Quintile 5 (weak left-dominant) | |
|---|---|---|---|---|---|
| N, Total | 14 | 13 | 13 | 13 | 14 |
| N, NL | 9 | 6 | 6 | 6 | 3 |
| N, LD | 5 | 7 | 7 | 7 | 11 |
| Asymmetry, 130–145 ms (μV) | −101.3 (26.1) | −51.0 (6.2) | −33.3 (3.8) | −17.1 (7.3) | 18.5 (15.5) |
| Age (years) | 10.2 (1.4) | 9.9 (1.5) | 11.3 (1.7) | 10.3 (1.4) | 9.9 (1.5) |
| IQ | 107.5 (15.8) | 115.9 (16.0) | 113.5 (12.1) | 116.2 (15.8) | 108.8 (19.2) |
| Reading | 112.0 (9.2) | 94.7 (17.5) | 105.0 (21.1) | 100.8 (18.4) | 101.8 (17.9) |
| Spelling | 112.9 (11.9) | 95.4 (19.9) | 103.5 (16.9) | 97.8 (18.7) | 98.9 (16.3) |
| Auditory processing | 102.4 (9.2) | 87.8 (8.3) | 94.1 (11.2) | 89.8 (8.5) | 93.6 (12.4) |
| Incomplete words | 99.2 (11.2) | 86.1 (11.2) | 98.3 (9.3) | 91.2 (12.6) | 94.2 (10.9) |
| Memory for words | 106.4 (16.4) | 91.2 (9.2) | 99.8 (13.2) | 100.8 (17.0) | 101.9 (9.9) |
| Sound blending | 106.6 (12.5) | 90.4 (7.8) | 93.0 (13.0) | 91.7 (10.7) | 94.1 (15.7) |
| Listening comprehension | 123.6 (14.1) | 112.1 (20.1) | 121.4 (17.7) | 111.1 (20.4) | 117.9 (17.6) |
| Cross out | 109.4 (11.0) | 115.3 (10.5) | 107.6 (14.3) | 112.3 (15.1) | 101.2 (12.1) |
| Just noticeable difference | |||||
| /da/–/ga/ (Hz) | 83.9 (31.1) | 123.2 (47.3) | 97.8 (48.2) | 133.7 (78.7) | 121.2 (43.5) |
| /ba/–/wa/ (ms) | 7.5 (2.8) | 7.0 (3.2) | 10.0 (2.8) | 8.0 (2.8) | 8.1 (2.7) |
Values in parentheses indicate SDs.
Figure 3.

Cortical asymmetry and measures of speech discrimination and academic achievement. Error bars indicate SEM.
Discussion
In summary, we have shown that auditory brainstem timing of speech onset and offset is correlated to a measure of cortical asymmetry across, and within, normal and LD subjects. In addition, it was shown that subjects with greater left-asymmetric activation patterns were better than subjects with weak asymmetry on a number of tasks that rely on phonological processing, including reading and spelling. Together, these data indicate a specific relationship between temporal acuity in the auditory brainstem and cerebral asymmetry for speech sounds associated with phonological processing and reading ability.
Brainstem and cortical processing of speech sounds
The relationship between brainstem synchrony and cerebral asymmetry for speech sounds adds to a growing literature linking the auditory brainstem with cortical processing of speech. Wible et al. (2005) demonstrated a strong correlation between synchronous onset timing of the speech-evoked ABR and the ability of cortical responses to maintain their representation of speech in the presence of background noise, suggesting that brainstem synchrony is related to the robustness of cortical representations. In another study, Banai et al. (2005) showed that asynchronous onset timing in the auditory brainstem was related to poor cortical sensitivity to acoustic change, measured in a group of normal and LD children. In conjunction with the findings described here, these data provide converging evidence that cortical function is closely related to brainstem timing for speech sounds.
An important consideration for the current data is the presence of temporal processing abnormalities across multiple levels of the auditory system. The dynamics of this system is an exciting topic, and although the results reported here do not prove causality between brainstem and cortical processing of speech sounds, the three following scenarios could account for their srelationship. One plausible scenario is that neural deficits at a lower (i.e., more peripheral) level of the auditory pathway cause abnormal cortical activation patterns, a tempting possibility based on signal flow in the afferent pathway of the auditory system. A piece of evidence in favor of this hypothesis is that auditory brainstem responses reach maturity many years before auditory cortex (Inagaki et al., 1987; Ponton et al., 2000), indicating a peripheral-to-central hierarchy in the development of this system. To its detriment, this interpretation would be an oversimplification of an extremely complex system that includes parallel (Young, 1998; Kaas and Hackett, 2000) and top–down (Xiao and Suga, 2002; Perrot et al., 2005) processing from cortex, allowing for ongoing reciprocal brainstem/cortex interactions. Although it is certainly plausible that “normal” cortical activation patterns would not develop if brainstem nuclei were not able to properly represent this signal, it remains to be seen whether this is what actually occurs in the disabled auditory system.
Alternatively, a top–down scenario in which abnormal cortical function causes poor neural synchrony in the brainstem, and possibly more peripheral stations in the auditory system (Xiao and Suga, 2002), is also a possibility. A compelling hypothesis from the visual system, called the reverse hierarchy theory, poses that high-level cortical areas are responsible for directing plasticity in lower cortical levels, such as V1 (Ahissar and Hochstein, 2004). Although it is conceivable that similar forms of plasticity could extend to brainstem nuclei, the authors of this theory do not explicitly address this possibility. Indeed, studies in anesthetized bat have shown that cortical stimulation can drive plasticity in the inferior colliculus (Ma and Suga, 2001), the primary auditory nucleus of the midbrain. Moreover, it has been shown that auditory training (Russo et al., 2005) and language experience (Krishnan et al., 2005) impact brainstem encoding of acoustic elements of speech, which suggests that cortical mechanisms associated with directed attention and language can improve subcortical sensory encoding. Although these pieces of evidence describe particular top–down relationships between the cortex and brainstem, neither of them speaks directly to the etiology of abnormal acoustic processing in these two parts of the brain.
A third possible scenario to describe the dynamics of abnormal brainstem–cortical function lies somewhere between the previous two possibilities: abnormal function is truly systemic in nature, owing neither to aberrant brainstem or cortical function in particular. In this scenario, abnormal brainstem–cortical function represents a general failure of the system, possibly attributable to asynchronous activation patterns between the two auditory regions. A tenet of neuroscience proposed by Donald Hebb states that neurons that are active at the same time are mutually strengthened, and conversely, neural connections are weakened when the constituent neurons are activated asynchronously (Hebb et al., 1949). In the event that normal brainstem and cortical function are mutually reliant on synchronous activation between one another, then the current data could be explained as a general signaling disorder between these two regions of the brain. More work is required to specifically address the etiology of abnormal auditory function in the brainstem and cortex.
Feature dissociation in the auditory brainstem
The speech-evoked ABR provides discrete representations of many aspects of the acoustic structure of speech (Russo et al., 2004), including separate neural representations of speech sound onset, phase-locking to the fundamental and formant frequencies and speech sound offset. As mentioned previously, the current work adds to a growing body of evidence linking brainstem and cortical processing of speech sounds. A common thread among all of these studies is that the portion of the ABR reflecting speech sound onset is the structural feature that is associated with these various forms of cortical processing, in this case patterns of cortical asymmetry. The specificity of the onset response of the brainstem with regards to cortical processing of speech reinforces the notion that component features of the brainstem response are functionally dissociated from one another. This finding is consistent with a meta-analysis of a number of speech ABR experiments that showed a pattern in the dissociation of speech sound representations in the auditory brainstem (Kraus and Nicol, 2005). Specifically, it was argued that auditory brainstem representations of the “source” of speech, which is generated by the vocal folds (i.e., the fundamental frequency), is differentiated from brainstem representations of features of speech introduced by the rest of the vocal tract, which serves as an acoustic “filter” (i.e., onset transients and formant structure). Future studies in both humans and animal models (King et al., 1999) may be able to better characterize the dissociation of the representations of acoustic features by the brainstem in speech.
Components of cerebral asymmetry
A known limitation of this work is that stimulus presentation was provided to the right ear for all subjects, yet it is well established that there is a stronger contralateral than ipsilateral cortical response independent of left hemisphere asymmetries for speech sounds. Therefore, a reduction in the size of the asymmetry could be due either to (1) a reduction in the contralaterality of the right ear–left hemisphere response, or (2) a change in the degree of left hemisphere specialization. It is argued that, because all subjects were tested identically, it is reasonable to assume that effects of cerebral asymmetry are attributable to known specialized processing of the left hemisphere for the speech signal. Although the current data clearly demonstrate a general effect of cerebral asymmetry, future studies are needed to delineate the relative contributions of the contralateral response and the left hemisphere specialization for acoustic features of speech.
Conclusion
Cerebral dominance is a fundamental organizing principle of the nervous system. It is hypothesized that the left hemisphere's preference for rapid acoustic signals (Schwartz and Tallal, 1980; Belin et al., 1998) underlies cerebral dominance for language, and serves as a mechanism for the remarkable translation of acoustic speech information into complex linguistic constructs. Normal auditory function relies on the integrity of many auditory nuclei in the ascending pathway between the cochlea and the cortex, and findings described here demonstrate a relationship between extremely brief (∼0.05 ms) delays at the brainstem and cortical activation patterns. Future studies addressing functional relationships between cortex and more peripheral loci in the auditory system will enable a more comprehensive understanding of the normal auditory system, and may serve to remediate auditory deficits in populations in which hearing function is of interest, such as individuals with learning disabilities, individuals with autism, and the elderly.
Footnotes
This work was supported by National Institutes of Health Grant R01 DC01510-10 and National Organization for Hearing Research Grant 340-B208. We thank members of the Auditory Neuroscience Laboratory for help with data collection and analysis, and C. Warrier and K. Banai for critical reviews of this manuscript. We also thank the children who participated in this study and their families.
References
- Ahissar M, Hochstein S. The reverse hierarchy theory of visual perceptual learning. Trends Cogn Sci. 2004;8:457–464. doi: 10.1016/j.tics.2004.08.011. [DOI] [PubMed] [Google Scholar]
- Banai K, Nicol T, Zecker SG, Kraus N. Brainstem timing: implications for cortical processing and literacy. J Neurosci. 2005;25:9850–9857. doi: 10.1523/JNEUROSCI.2373-05.2005. [DOI] [PMC free article] [PubMed] [Google Scholar]
- Belin P, Zilbovicius M, Crozier S, Thivard L, Fontaine A, Masure MC, Samson Y. Lateralization of speech and auditory temporal processing. J Cogn Neurosci. 1998;10:536–540. doi: 10.1162/089892998562834. [DOI] [PubMed] [Google Scholar]
- Bellis TJ, Nicol T, Kraus N. Aging affects hemispheric asymmetry in the neural representation of speech sounds. J Neurosci. 2000;20:791–797. doi: 10.1523/JNEUROSCI.20-02-00791.2000. [DOI] [PMC free article] [PubMed] [Google Scholar]
- Carrell TD, Bradlow AR, Nicol TG, Koch DB, Kraus N. Interactive software for evaluating auditory discrimination. Ear Hear. 1999;20:175–176. doi: 10.1097/00003446-199904000-00008. [DOI] [PubMed] [Google Scholar]
- Cunningham J, Nicol T, Zecker S, Bradlow A, Kraus N. Neurobiologic responses to speech in noise in children with learning problems: deficits and strategies for improvement. Clin Neurophysiol. 2001;112:758–767. doi: 10.1016/s1388-2457(01)00465-5. [DOI] [PubMed] [Google Scholar]
- Hebb DO. New York: Wiley; 1949. The organization of behavior: a neuropsychological theory. [Google Scholar]
- Inagaki M, Tomita Y, Takashima S, Ohtani K, Andoh G, Takeshita K. Functional and morphometrical maturation of the brainstem auditory pathway. Brain Dev. 1987;9:597–601. doi: 10.1016/s0387-7604(87)80092-x. [DOI] [PubMed] [Google Scholar]
- Jasper HH. The ten-twenty electrode system of the international federation. Electroencephalogr Clin Neurophysiol. 1958;10:371–375. [PubMed] [Google Scholar]
- Joanisse MF, Gati JS. Overlapping neural regions for processing rapid temporal cues in speech and nonspeech signals. NeuroImage. 2003;19:64–79. doi: 10.1016/s1053-8119(03)00046-6. [DOI] [PubMed] [Google Scholar]
- Johnson KL, Nicol TG, Kraus N. Brain stem response to speech: a biological marker of auditory processing. Ear Hear. 2005;26:424–434. doi: 10.1097/01.aud.0000179687.71662.6e. [DOI] [PubMed] [Google Scholar]
- Johnsrude IS, Zatorre RJ, Milner BA, Evans AC. Left-hemisphere specialization for the processing of acoustic transients. NeuroReport. 1997;8:1761–1765. doi: 10.1097/00001756-199705060-00038. [DOI] [PubMed] [Google Scholar]
- Kaas JH, Hackett TA. Subdivisions of auditory cortex and processing streams in primates. Proc Natl Acad Sci USA. 2000;97:11793–11799. doi: 10.1073/pnas.97.22.11793. [DOI] [PMC free article] [PubMed] [Google Scholar]
- King C, Nicol T, McGee T, Kraus N. Thalamic asymmetry is related to acoustic signal complexity. Neurosci Lett. 1999;267:89–92. doi: 10.1016/s0304-3940(99)00336-5. [DOI] [PubMed] [Google Scholar]
- King C, Warrier CM, Hayes E, Kraus N. Deficits in auditory brainstem pathway encoding of speech sounds in children with learning problems. Neurosci Lett. 2002;319:111–115. doi: 10.1016/s0304-3940(01)02556-3. [DOI] [PubMed] [Google Scholar]
- Kraus N, Nicol T. Brainstem origins for cortical “what” and “where” pathways in the auditory system. Trends Neurosci. 2005;28:176–181. doi: 10.1016/j.tins.2005.02.003. [DOI] [PubMed] [Google Scholar]
- Kraus N, McGee TJ, Carrell TD, Zecker SG, Nicol TG, Koch DB. Auditory neurophysiologic responses and discrimination deficits in children with learning problems. Science. 1996;273:971–973. doi: 10.1126/science.273.5277.971. [DOI] [PubMed] [Google Scholar]
- Krishnan A, Xu Y, Gandour J, Cariani P. Encoding of pitch in the human brainstem is sensitive to language experience. Brain Res Cogn Brain Res. 2005;25:161–168. doi: 10.1016/j.cogbrainres.2005.05.004. [DOI] [PubMed] [Google Scholar]
- Lehmann D, Skrandies W. Reference-free identification of components of checkerboard-evoked multichannel potential fields. Electroencephalogr Clin Neurophysiol. 1980;48:609–621. doi: 10.1016/0013-4694(80)90419-8. [DOI] [PubMed] [Google Scholar]
- Liégeois-Chauvel C, de Graaf JB, Laguitton V, Chauvel P. Specialization of left auditory cortex for speech perception in man depends on temporal coding. Cereb Cortex. 1999;9:484–496. doi: 10.1093/cercor/9.5.484. [DOI] [PubMed] [Google Scholar]
- Ma X, Suga N. Plasticity of bat's central auditory system evoked by focal electric stimulation of auditory and/or somatosensory cortices. J Neurophysiol. 2001;85:1078–1087. doi: 10.1152/jn.2001.85.3.1078. [DOI] [PubMed] [Google Scholar]
- Morgan WP. A case of congenital word-blindness. Br Med J. 1896;2:1378. doi: 10.1136/bmj.2.1871.1378. [DOI] [PMC free article] [PubMed] [Google Scholar]
- Näätänen R, Lehtokoski A, Lennes M, Cheour M, Huotilainen M, Iivonen A, Vainio M, Alku P, Ilmoniemi RJ, Luuk A, Allik J, Sinkkonen J, Alho K. Language-specific phoneme representations revealed by electric and magnetic brain responses. Nature. 1997;385:432–434. doi: 10.1038/385432a0. [DOI] [PubMed] [Google Scholar]
- Perrot X, Ryvlin P, Isnard J, Guénot M, Catenoix H, Fischer C, Mauguière F, Collet L. Evidence for corticofugal modulation of peripheral auditory activity in humans. Cereb Cortex. 2005;16:941–948. doi: 10.1093/cercor/bhj035. [DOI] [PubMed] [Google Scholar]
- Ponton CW, Eggermont JJ, Kwong B, Don M. Maturation of human central auditory system activity: evidence from multi-channel evoked potentials. Clin Neurophysiol. 2000;111:220–236. doi: 10.1016/s1388-2457(99)00236-9. [DOI] [PubMed] [Google Scholar]
- Russo N, Nicol T, Musacchia G, Kraus N. Brainstem responses to speech syllables. Clin Neurophysiol. 2004;115:2021–2030. doi: 10.1016/j.clinph.2004.04.003. [DOI] [PMC free article] [PubMed] [Google Scholar]
- Russo NM, Nicol TG, Zecker SG, Hayes EA, Kraus N. Auditory training improves neural timing in the human brainstem. Behav Brain Res. 2005;156:95–103. doi: 10.1016/j.bbr.2004.05.012. [DOI] [PubMed] [Google Scholar]
- Schwartz J, Tallal P. Rate of acoustic change may underlie hemispheric specialization for speech perception. Science. 1980;207:1380–1381. doi: 10.1126/science.7355297. [DOI] [PubMed] [Google Scholar]
- Sharma A, Marsh C, Dorman M. Relationship between N1 evoked potential morphology and the perception of voicing. J Acoust Soc Am. 2000;108:3030–3035. doi: 10.1121/1.1320474. [DOI] [PubMed] [Google Scholar]
- Tallal P, Miller S, Fitch RH. Neurobiological basis of speech: a case for the preeminence of temporal processing. Ann NY Acad Sci. 1993;682:27–47. doi: 10.1111/j.1749-6632.1993.tb22957.x. [DOI] [PubMed] [Google Scholar]
- Tonnquist-Uhlén I, Ponton CW, Eggermont JJ, Kwong B, Don M. Maturation of human central auditory system activity: the T-complex. Clin Neurophysiol. 2003;114:685–701. doi: 10.1016/s1388-2457(03)00005-1. [DOI] [PubMed] [Google Scholar]
- Warrier CM, Johnson KL, Hayes EA, Nicol T, Kraus N. Learning impaired children exhibit timing deficits and training-related improvements in auditory cortical responses to speech in noise. Exp Brain Res. 2004;157:431–441. doi: 10.1007/s00221-004-1857-6. [DOI] [PubMed] [Google Scholar]
- Wible B, Nicol T, Kraus N. Atypical brainstem representation of onset and formant structure of speech sounds in children with language-based learning problems. Biol Psychol. 2004;67:299–317. doi: 10.1016/j.biopsycho.2004.02.002. [DOI] [PubMed] [Google Scholar]
- Wible B, Nicol T, Kraus N. Correlation between brainstem and cortical auditory processes in normal and language-impaired children. Brain. 2005;128:417–423. doi: 10.1093/brain/awh367. [DOI] [PubMed] [Google Scholar]
- Wilkinson G. Wilmington, DE: Jastak; 1993. Wide Range Achievement Test-3 (WRAT-3) [Google Scholar]
- Wolpaw JR, Penry JK. A temporal component of the auditory evoked response. Electroencephalogr Clin Neurophysiol. 1975;39:609–620. doi: 10.1016/0013-4694(75)90073-5. [DOI] [PubMed] [Google Scholar]
- Wolpaw JR, Penry JK. Hemispheric differences in the auditory evoked response. Electroencephalogr Clin Neurophysiol. 1977;43:99–102. doi: 10.1016/0013-4694(77)90200-0. [DOI] [PubMed] [Google Scholar]
- Woodcock R, Johnson M. Allen, TX: DLM Teaching Resources; 1977. Woodcock-Johnson psychoeducational battery: tests of cognitive ability. [Google Scholar]
- Woodcock R, Johnson M. Allen, TX: DLM Teaching Resources; 1989. Woodcock-Johnson psychoeducational battery revised: tests of cognitive ability. [Google Scholar]
- Xiao Z, Suga N. Modulation of cochlear hair cells by the auditory cortex in the mustached bat. Nat Neurosci. 2002;5:57–63. doi: 10.1038/nn786. [DOI] [PubMed] [Google Scholar]
- Young E. Cochlear nucleus. In: Shepherd G, editor. Synaptic organization of the brain. Ed 4. New York: Oxford UP; 1998. pp. 121–158. [Google Scholar]
- Zaehle T, Wüstenberg T, Meyer M, Jäncke L. Evidence for rapid auditory perception as the foundation of speech processing: a sparse temporal sampling fMRI study. Eur J Neurosci. 2004;20:2447–2456. doi: 10.1111/j.1460-9568.2004.03687.x. [DOI] [PubMed] [Google Scholar]
- Zatorre RJ, Belin P. Spectral and temporal processing in human auditory cortex. Cereb Cortex. 2001;11:946–953. doi: 10.1093/cercor/11.10.946. [DOI] [PubMed] [Google Scholar]