

Abstract
Evidence suggests that neuronal dysfunction in Huntington's disease (HD) striatum involves deficits in mitochondrial function and in Ca2+ handling. However, the relationship between mitochondria and Ca2+ handling has been incompletely studied in intact HD striatal cells. Treatment with histone deacetylase (HDAC) inhibitors reduces cell death in HD models, but the effects of this promising therapy on cellular function are mostly unknown. Here, we use real-time functional imaging of intracellular Ca2+ and mitochondrial membrane potential to explore the role of in situ HD mitochondria in Ca2+ handling. Immortalized striatal (STHdh) cells and striatal neurons from transgenic mice, expressing full-length mutant huntingtin (Htt), were used to model HD. We show that (1) active glycolysis in STHdh cells occludes the mitochondrial role in Ca2+ handling as well as the effects of mitochondrial inhibitors, (2) STHdh cells and striatal neurons in the absence of glycolysis are critically dependent on oxidative phosphorylation for energy-dependent Ca2+ handling, (3) expression of full-length mutant Htt is associated with deficits in mitochondrial-dependent Ca2+ handling that can be ameliorated by treatment with HDAC inhibitors (treatment with trichostatin A or sodium butyrate decreases the proportion of STHdh cells losing Ca2+ homeostasis after Ca2+-ionophore challenging, and accelerates the restoration of intracellular Ca2+ in striatal neurons challenged with NMDA), and (4) neurons with different response patterns to NMDA receptor activation exhibit different average somatic areas and are differentially affected by treatment with HDAC inhibitors, suggesting subpopulation or functional state specificity. These findings indicate that neuroprotection induced by HDAC inhibitors involves more efficient Ca2+ handling, thus improving the neuronal ability to cope with excitotoxic stimuli.
Keywords: Huntington's disease, striatal neurons, excitotoxicity, mitochondria, calcium, HDAC inhibitors
Introduction
Huntington's disease (HD) is an autosomal-dominant neurodegenerative disorder, characterized by a selective and progressive loss of GABAergic medium spiny neurons (MSNs) in the striatum (Vonsattel and DiFiglia, 1998). HD is caused by a mutant form of the huntingtin (Htt) protein with an expanded polyglutamine (polyQ) tract (Huntington's Disease Collaborative Research Group, 1993). Proteins with expanded polyQ tracts are a common feature in at least nine human neurodegenerative disorders. However, the different protein context in which the polyQ tract is inserted determines the brain regions and neurons that are affected (Gusella and Macdonald, 2000). Significantly, mice expressing full-length mutant Htt were shown to reproduce quantitative striatal loss, a hallmark of the human condition (Slow et al., 2003).
The mechanisms by which mutant Htt exerts its deleterious effects on MSNs are poorly understood (Tobin and Signer, 2000). Mitochondrial dysfunction (Beal, 2005), abnormalities in Ca2+ handling (Bezprozvanny and Hayden, 2004) and in transcriptional regulation (Cha, 2000; Bates, 2001; Sugars and Rubinsztein, 2003), all seem to contribute for HD pathogenesis. A link between mitochondrial dysfunction and abnormalities in Ca2+ handling is supported by studies with isolated mitochondria, suggesting that a direct interaction with mutant Htt can impair mitochondrial Ca2+ handling (Panov et al., 2002). However, whether mitochondrial-dependent Ca2+ handling is impaired in intact HD striatal cells is mostly unknown. Abnormalities in transcriptional regulation in HD are proposed to stem from inhibition of histone acetyltransferases by mutant Htt, an effect counteracted by histone deacetylase (HDAC) inhibitors, which increase the levels of histone acetylation (Steffan et al., 2000). Importantly, HDAC inhibitors have shown efficacy in several animal models of HD, improving survival, motor performance, and striatal atrophy (Beal and Ferrante, 2004). However, HDAC inhibitors seem to be neuroprotective even in the absence of a polyQ expansion background, being able to reduce neuronal death induced by a mitochondrial inhibitor and by excitotoxic stimuli (Ryu et al., 2003; Kanai et al., 2004).
In the present study, we examined the contribution of in situ mitochondria for Ca2+ handling in intact striatal cells expressing full-length mutant Htt, thus modeling both the selective striatal pathology and the full protein context of the HD mutation. Detailed functional information was obtained by real-time fluorescence microscopy at single-cell resolution. Functional experiments using immortalized striatal cell lines (STHdh cells) and primary striatal neurons revealed deficits in mitochondrial-dependent Ca2+ handling in cells expressing mutant Htt. These deficits were taken to reflect early, nonlethal, neuronal dysfunction in HD striatum. Because dysfunction precedes neuronal death and likely accounts for many HD symptoms (Hughes, 2002), improving neuronal function is an important therapeutic goal. Therefore, we tested whether treatment with HDAC inhibitors, previously shown to reduce cell death in HD models (Beal and Ferrante, 2004), was able to improve function in HD cellular models exhibiting early signs of neuronal dysfunction. Real-time monitoring of the ability of STHdh cells and striatal neurons to cope with energy-demanding intracellular Ca2+ elevations (i.e., Ca2+ excitotoxicity) evidenced more efficient Ca2+ handling after treatment with HDAC inhibitors, thus supporting improved neuronal function.
Materials and Methods
Materials.
Fura-2 AM, fura-4F AM, fluo-5F AM, rhodamine-123 (Rh123), tetramethylrhodamine methyl ester (TMRM+) and 4-bromocalcimycin (4Br-A23187) were from Invitrogen (Carlsbad, CA). Culture media and supplements were from Invitrogen, unless otherwise stated. For primary antibodies, anti-Htt mAB2166 and anti-NMDAR2B were from Chemicon (Temecula, CA), anti-Htt BKP1 was from M. R. Hayden's laboratory, anti-acetylated-histone-H3 was from Upstate Biotechnology (Lake Placid, NY), and anti-α-tubulin and anti-β-tubulin were from Sigma (St. Louis, MO). DMEM, NMDA, (5R,10S)-(+)-5-methyl-10,11-dihydro[a,d]cyclohepten-5,10-imine hydrogen maleate (MK-801), sodium butyrate (SB), trichostatin A (TSA), oligomycin, rotenone, carbonylcyanide-p-(trifluoromethoxyphenyl)hydrazone (FCCP), and other reagents were from Sigma.
Immortalized striatal cell lines.
STHdh cells expressing wild-type Htt (Q7 cells) or expressing mutant Htt (Q111 cells) (Trettel et al., 2000) were generously provided by Dr. Marcy MacDonald (Massachusetts General Hospital, Charleston, MA). Briefly, cells were grown at 33°C in DMEM supplemented with 10% fetal bovine serum (FBS), 4 mm glutamine, 100 U/ml penicillin, 0.1 mg/ml streptomycin, and 400 μg/ml geneticin in a humidified atmosphere of 95% air/5% CO2. STHdh cells (0.5 × 10⁴) were plated on 22-mm-diameter glass coverslips and used after 48 h in functional imaging experiments.
Primary striatal neurons.
Primary striatal cultures were generated from the offspring of crosses between heterozygous male YAC128 HD transgenic mice (Slow et al., 2003) and wild-type females from the same genetic background (FVB/N). All procedures were approved by the Institutional Animal Care and Use Committee. Striatal cultures were prepared similarly to previously described procedures (Mao and Wang, 2001) with minor adaptations. Briefly, striata from embryonic day 16 (E16) to E17 embryos were dissected in HBSS while tail DNA was being used for genotyping by PCR (supplemental Fig. 3A, available at www.jneurosci.org as supplemental material). Striata were pooled according to genotype, finely minced, and dissociated with 0.25% trypsin-EDTA. After enzyme inhibition with 10% FBS in Neurobasal medium, cells were plated in polyethyleneimine-coated glass-bottomed eight-well chambers (LabTek, Naperville, IL) at a density of 2.5 × 10⁵ cells per well. Cultures were maintained in Neurobasal medium supplemented with 1% glutamax, 2% B27, 1% FBS, 100 U/ml penicillin, and 0.1 μg/ml streptomycin. Cytosine arabinoside (10 μm) was added to inhibit growth of non-neuronal cells. Cultures were maintained at 37°C in a humidified atmosphere of 5% CO2/95% air and used for experiments at 13 d in vitro (DIV).
Western blotting.
Both STHdh cells and primary striatal neurons were rinsed in ice-cold PBS and collected in radioimmunoprecipitation assay buffer (50 mm Tris-HCl, pH 8.0, 150 mm NaCl, 0.1% SDS, 1% sodium deoxycholate, 1% NP-40) with protease inhibitors. Samples were sheered with a 26-gauge needle and three freeze–thaw cycles followed by centrifugation at 16,000 × g for 10 min (4°C). Protein concentrations of the supernatants were determined using the bicinchoninic acid method (Bio-Rad, Hercules, CA). STHdh cellular extracts were resolved in 6.5–15% SDS-PAGE page and electroblotted onto polyvinylidene difluoride membranes. Neuronal extracts were resolved in 4–12% Bis-Tris precast gels (Invitrogen) and blotted onto nitrocellulose membranes. Membranes were probed with primary antibodies, and secondary antibodies were used for development with enhanced chemifluorescence or chemiluminescence (Amersham Biosciences, Buckinghamshire, UK) for STHdh cells or striatal neurons, respectively. Western blots were scanned and analyzed quantitatively by densitometry with NIH ImageJ software.
Monitoring of dynamic changes in intracellular free Ca2+ concentration ([Ca2+]i) and mitochondrial membrane potential (Δψm) in STHdh cells.
Single-cell imaging was performed with an imaging system composed by an inverted epifluorescence microscope (Eclipse TE300; Nikon, Tokyo, Japan) equipped with a 20× air objective, a monochromator (Polychrome II; TILL Photonics, Martinsried, Germany), a CCD camera (C6790; Hamamatsu Photonics, Hamamatsu, Japan), and a computer with analysis software (Aquacosmos, Hamamatsu Photonics). Cells were loaded with either the high affinity Ca2+ probe fura-2 (5 μm) or the intermediate-affinity Ca2+ probe fura-4F (5 μm), allowing for detection of small or large changes in [Ca2+]i, respectively. Loading of the Ca2+ probe was performed simultaneously with the Δψm-sensitive probe (10 μm Rh123; quench mode) for 1 h at room temperature in buffer containing the following (in mm): 135 NaCl, 5 KCl, 0.4 KH2PO4, 1.8 CaCl2, 1 MgSO4, 20 HEPES, and 5.5 glucose, pH 7.4. In experiments aiming at eliminating glycolysis in STHdh cells, glucose was replaced by pyruvate (10 mm) plus 2-deoxy-d-glucose (DDG) (2 mm). After rinsing with fresh buffer, coverslips were mounted in a nonperfused 600 μl chamber and thermostatized at 30°C. This lower temperature minimized movement of STHdh cells, which, at higher temperatures, compromised accurate fluorescence imaging in long-term experiments. Fura-4F (or fura-2) was excited at 340 and 380 nm, whereas Rh123 was excited at 485 nm. For all probes, >515 nm emission was collected by means of a long-pass filter. Individual whole cells were identified as regions of interest (ROIs) for the determination of fluorescence time courses. The area over the nucleus (nuclear area) was also identified as an additional ROI for the monitoring of extramitochondrial Rh123 fluorescence. In situ calibration of Ca2+ responses was performed at the end of every individual experiment, by determining maximal and minimal 340/380 ratios for each individual cell. This was achieved by adding a high concentration of Ca2+ ionophore (30 μm 4Br-A23187) in buffer with 1.8 mm Ca2+, followed by Ca2+-free buffer with 5 mm EGTA. Maximal mitochondrial depolarization (Δψm collapse) was also performed in every individual experiment by adding protonophore (1 μm FCCP), which was always preceded by oligomycin (2 μg/ml) to prevent ATP synthase reversal. Additional details on the analysis of Ca2+ responses and Rh123 fluorescence changes in STHdh cells are provided below (under Data analysis).
Monitoring of [Ca2+]i, Δψm, and somatic swelling in striatal neurons.
Single-cell imaging was performed in a Zeiss Pascal confocal Axiovert 100 M inverted microscope with a 20× air objective and argon (488 nm) and helium–neon (543 nm) lasers. The intermediate-affinity Ca2+ probe fluo-5F (Kd ∼ 2.3 μm) was found to be the best compromise solution for the detection of small Ca2+ rises and the avoidance of probe saturation. The Δψm probe TMRM+, used in quench mode (Ward et al., 2000), allowed estimation of mitochondrial depolarization and repolarization, and distinguishing between loss of the Ca2+ probe attributable to membrane rupture and a true Ca2+ recovery. Cells were simultaneously loaded with fluo-5F AM (0.5 μm) and TMRM+ (50 nm) for 30 min at 37°C in buffer containing the following (in mm): 120 NaCl, 3.5 KCl, 0.4 KH2PO4, 1.3 CaCl2, 20 TES (N-Tris[hydroxy-methyl]methyl-2-aminoethane sulfonic acid), 5 NaHCO3, 1.2 mm NaSO4, and 15 mm glucose, pH 7.4. At the end of the incubation, cells were washed three times with fresh buffer containing 50 nm TMRM+ in which glucose was replaced with 10 mm pyruvate to accentuate the mitochondrial role in the maintenance of neuronal homeostasis. Experiments were performed in this buffer at 37°C. Cells were excited at 488 nm for fluo-5F (emission, 505–530 nm) and at 543 nm for TMRM+ (emission, >560 nm). Individual cell somata were identified as ROIs for the determination of fluorescence time courses. Somatic swelling was estimated by the area analysis of cell somata in transmission images acquired throughout the experiments. NMDA receptor (NMDAR) activation was achieved with 100 μm NMDA/10 μm glycine in the absence of Mg2+.
Treatment with HDAC inhibitors (iHDAC treatment).
For both HD cell models, single concentrations of HDAC inhibitors were chosen in preliminary experiments on the basis of “maximal effective concentration devoid of any obvious toxicity.” Q7 and Q111 STHdh cells, 24 h after plating, were incubated with 10 nm TSA or 1 mm SB for 24 h and used in experiments. The 24 h incubation time was chosen because it is the approximate doubling time of these cell lines under our growth conditions, and hence sufficient for changes in gene transcription to take place (as confirmed by microarray experiments) (our unpublished data). These concentrations had no significant effect on the viability of STHdh cells (determined by lactate dehydrogenase leakage) (data not shown), consistently with being even lower than those reported as “subapoptotic” in other neural cell lines (Ajamian et al., 2004), and effectively increased histone acetylation (see Fig. 4A,B). Striatal neurons from YAC128 mice and wild-type littermates, at 6 DIV, were incubated with 50 nm TSA or 500 μm SB for 7 DIV and used in experiments. These concentrations are one-half of the maximal used without obvious toxic effects in cerebellar granule neurons, in which the protracted 7 DIV incubation time was shown to maximize protection from excitotoxicity (Kanai et al., 2004). Toxic effects were also not observed in our striatal cultures, consistently with the mitochondrial quenching of the Δψm-sensitive probe TMRM+ and a low resting [Ca2+]i detected by fluo-5F. Treatment with HDAC inhibitors increased histone acetylation without affecting the mutant HD transgene expression in YAC128 neurons (supplemental Fig. 3C, available at www.jneurosci.org as supplemental material). All functional experiments were performed without HDAC inhibitors in the loading and assay buffers.
Figure 4.

Immunoblot analysis and mitochondrial-dependent Ca2+ handling in STHdh cells treated with HDAC inhibitors. Shown are Q7 (left) and Q111 cells (right) under control conditions (no HDAC inhibitors added) and after treatment with either TSA (10 nm) or SB (1 mm) for 24 h. A, Immunoblot analysis. The anti-Htt antibody mAB2166 (1:250) recognized wild-type Htt (Htt-7Q) in Q7 cells and mutant Htt (Htt-111Q) in Q111 cells. As originally reported for these cells using the same antibody (Trettel et al., 2000), the mutant Htt band was less intense. This is not attributable to differences in protein loading as confirmed by tubulin labeling (anti-α-tubulin, 1:10,000). Acetyl-H3 labeling (anti-acetylated-histone-H3 antibody, 1:10,000) confirms effective HDAC inhibition. B, Densitometry analysis of immunoblots. Data are mean ± SEM of acetyl-H3/tubulin ratios in percentage of control Q7 cells. Significant differences: ***p < 0.001 versus control, ###p < 0.001 versus TSA; n = 5 for control Q7 and Q111 cells, n = 2 for cells treated with HDAC inhibitors in both genotypes. C, Percentage of cells exhibiting “deregulation” [irreversible [Ca2+]i elevation and mitochondrial depolarization (i.e., Rh123 dequenching)] in the 20 min between 4Br-A23187 challenging and oligomycin addition, in experiments performed exactly as those in Figure 2, A and D. Data are mean and SEM of n = 4–5 independent experiments, comprising a total of 312–401 Q7 and 289–400 Q111 cells per experimental group. Significant differences: ***p < 0.001 versus control. See Results for statistical details.
Data analysis.
Values in figures and text are presented as mean and SEM (except for data in Fig. 3, for which SD was used to improve error bar visibility) of the indicated number of independent experiments (n). Differences among group means were assessed with t test when comparing two groups or with ANOVAs when comparing three or more groups. The Newman–Keuls test was used for post hoc evaluations. Differences for all statistical tests were considered statistically significant when p < 0.05.
Figure 3.

Comparative effect of mitochondrial inhibitors on [Ca2+]i and Δψm of STHdh cells with or without active glycolysis. Q7 cells (A, C) and Q111 cells (B, D) were loaded with fura-2 (Kd ∼ 0.16 μm) and Rh123 and assayed either in the presence of 5.5 mm glucose (left panel; A, B) or in the absence of glucose, in buffer containing 10 mm pyruvate and 2 mm DDG (right panel; C, D). Changes in fura-2 and Rh123 fluorescence, indicative of [Ca2+]i and Δψm, respectively, were simultaneously imaged in single cells. The following drugs were added sequentially where indicated: 2 μm rotenone (R), 2 μg/ml oligomycin (O), and 1 μm FCCP (F). Maximal and minimal Ca2+ signals (data not shown) were determined at t = 55 and 60 min, respectively, and used to normalize fura-2 ratios of individual cells (see Materials and Methods). A–D, i, Average changes in [Ca2+]i (the left yy-axis spans only up to 40 U for clarity; fura-2 saturated with Ca2+ corresponds to 100 U; the right yy-axis is an approximation as described in Materials and Methods); ii, average changes in Rh123 fluorescence monitored in the nuclear area. Tracings represent the average of n = 3 independent experiments. In each experiment, the individual responses from 20 to 40 random cells were averaged to provide n = 1. Data points used in statistical analysis are highlighted by circles (white, Q7 cells; black, Q111 cells) with SD error bars (bars smaller than circle radius are not visible). Significant differences: *p < 0.05 between genotype (Q7 vs Q111) at same substrate (glucose vs pyruvate plus DDG); ##p < 0.01, ###p < 0.001 between substrates at same genotype. See Results for a detailed description of the individual tracings and statistics.
For the analysis of Ca2+ responses in STHdh cells, background-corrected 340/380 fura-4F or fura-2 ratios were normalized to the maximal (100 U) and minimal (0 U) ratios determined for each single cell during in situ calibration. Left yy-axis of Ca2+ graphs are scaled with these normalized values, where 50 U should correspond to the Ca2+ probe Kd, regardless of its absolute value. Because of uncertainties in the validity of Kd values for different cell types, we present an approximate log [Ca2+]i scale in the right yy-axis. These approximate scales span a maximum of 2 log10 U in both directions from the Kd, because this corresponds to the approximate Ca2+ concentration response range of fura-4F and fura-2 (Haugland, 2002). We assumed intermediate Kd values of ∼1 and ∼0.16 μm for fura-4F and fura-2, respectively (Haugland, 2002; Wokosin et al., 2004).
Changes in Rh123 whole-cell fluorescence in STHdh, indicative of Δψm, were expressed as F′/F0 ratios or arbitrary fluorescence units. F′/F0 ratios were calculated, after background correction, dividing the whole-cell Rh123 fluorescence obtained at every time point (F′) by the initial fluorescence (F0). We noticed a less stable whole-cell Rh123 fluorescence baseline in experiments performed in glucose buffer after rotenone addition (see Fig. 1C,F). We found that monitoring Rh123 fluorescence in the nuclear area provided a more stable baseline, improving detection of rotenone-induced mitochondrial depolarization. These measurements in the nuclear area are expressed either in arbitrary fluorescence units in comparison with whole-cell measurements (see Figs. 1, 2), or normalized between initial fluorescence (0 U) and maximal fluorescence (100 U) (see Fig. 3).
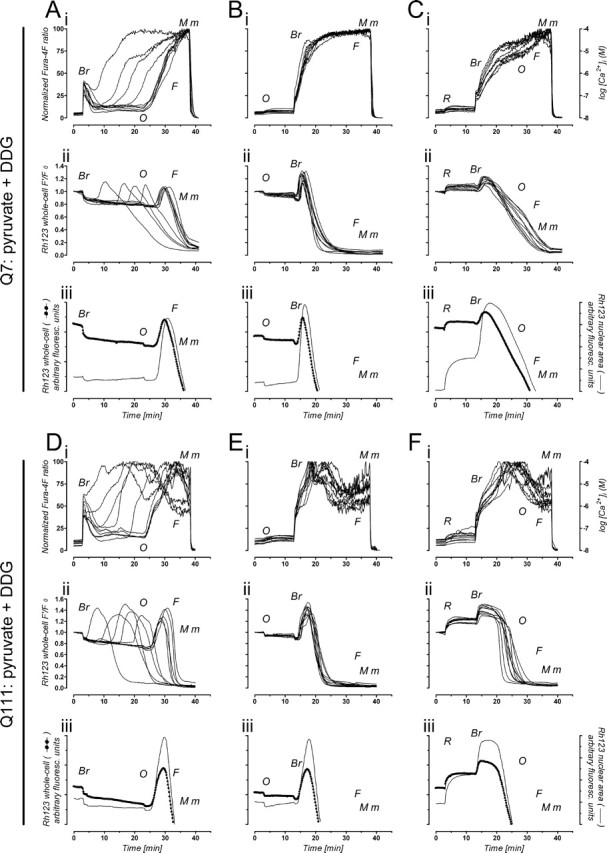
Figure 1.

Ca2+ handling and Δψm in STHdh cells with active glycolysis. Q7 cells (top panel; A–C) and Q111 cells (bottom panel; D–F) were loaded with fura-4F (Kd ∼ 1 μm) and Rh123 for the simultaneous monitoring of changes in [Ca2+]i and Δψm, respectively, and assayed in the presence of 5.5 mm glucose. Where indicated, the following drugs were added: 7 μm 4Br-A23187 (Br), 2 μg/ml oligomycin (O), 1 μm FCCP (F), and 2 μm rotenone (R). Maximal (M) and minimal (m) Ca2+ signals were used to normalize fura-4F ratios of individual cells; the right yy-axis is an approximation (see Materials and Methods). A–F, i, Individual Ca2+ responses of 10 representative cells; ii, individual changes in Rh123 whole-cell F′/F0 fluorescence ratios for the same single cells; iii, average change in Rh123 fluorescence in the nuclear area (thin line), in comparison with the average change in whole-cell Rh123 fluorescence (dotted line; may appear as a thicker line because of the 0.1 Hz image acquisition frequency). In each individual experiment, 20–40 random single cells were analyzed; only 10 are shown for clarity but are representative of n = 3 independent experiments. See Results for a detailed description of the individual tracings.
Figure 2.
Ca2+ handling and Δψm in STHdh cells without active glycolysis. Q7 cells (top panel; A–C) and Q111 cells (bottom panel; D–F) were loaded with fura-4F and Rh123 and assayed in the absence of glucose, in buffer containing 10 mm pyruvate and 2 mm DDG. Where indicated, the following drugs were added: 7 μm 4Br-A23187 (Br), 2 μg/ml oligomycin (O), 1 μm FCCP (F), and 2 μm rotenone (R). Maximal (M) and minimal (m) Ca2+ signals were used to normalize fura-4F ratios of individual cells; the right yy-axis is an approximation (see Materials and Methods). A–F, i, Individual Ca2+ responses of 10 representative cells; ii, individual changes in Rh123 whole-cell F′/F0 fluorescence ratios for the same single cells; iii, average change in Rh123 fluorescence (cells collapsing Δψm before oligomycin in Aii and Dii were excluded from the averaging) in the nuclear area (thin line), in comparison with the average change in whole-cell Rh123 fluorescence (dotted line). In each individual experiment, 40–100 random single cells were analyzed; only 10 are shown for clarity but are representative of n = 3–5 independent experiments. See Results for a detailed description of the individual tracings.
Nonlinear regression was used for comparing the susceptibility of striatal neurons to ATP depletion (see Fig. 5B). The increasing number of neurons with elevated [Ca2+]i was modeled by a four-parameter logistic equation of the following form: y = 100/(1 + 10(T50 − x) × slope), where y represents the number of neurons with elevated [Ca2+]i (in percentage of total), x represents time, slope represents the steepness of the curve, and T50 represents the time required for 50% of the neurons to elevate [Ca2+]i as a result of ATP depletion.
Figure 5.

Effect of mitochondrial inhibitors on [Ca2+]i and Δψm in striatal neurons. Experiments were performed in WT and YAC128 neurons, loaded with fluo5-F and equilibrated with TMRM+, in media with 10 mm pyruvate in the absence of glucose and Mg2+. A, Changes in [Ca2+]i (a), Δψm (b), and somatic area (c) induced by oligomycin (2 μg/ml) followed by ionomycin (2 μm). Representative tracings are from YAC128 neurons (similar tracings are observed in WT neurons although in different proportions as deducible from B). Tracings from i to iv represent distinct neurons with increasing degrees of susceptibility to oligomycin as observed by the progressively earlier onset of Ca2+ elevation. B, Quantitative analysis of the increasing number of neurons with elevated [Ca2+]i after ATP synthase inhibition (oligomycin). YAC128 (black circles) elevate [Ca2+]i within a shorter time than WT (white circles) neurons (black vs white bar, *p < 0.05, n = 3, comprising 300 neurons per genotype). Values are mean and SEM. C, Representative single neuron recordings illustrating the continuous elevation of Ca2+ (no [Ca2+]i plateau) when mitochondria are depolarized with oligomycin and rotenone (1 μm). See Results for a detailed description of the individual tracings.
With the exception of factorial ANOVAs (performed with STATISTICA 7.0; StatSoft, Tulsa, OK), all other statistical analyses including nonlinear regression were performed using GraphPad (San Diego, CA) Prism 4.0.
Results
Mitochondrial ATP synthesis is not essential for Ca2+ handling in STHdh cells with active glycolysis
Efficient handling of increases in [Ca2+]i is a critical process to avoid Ca2+-induced toxicity. To test for functional differences in Ca2+ handling between STHdh cells expressing wild-type Htt (Q7) and STHdh cells expressing mutant Htt (Q111), we challenged the cells with the Ca2+ ionophore 4Br-A23187 (Abramov and Duchen, 2003). When glucose (5.5 mm) was used as energy substrate (Fig. 1), both Q7 and Q111 cells responded to 4Br-A23187 (7 μm) with an increase in [Ca2+]i that was followed by a full recovery. [Ca2+]i was rectified to baseline values, remaining stable even after ATP synthase inhibition (2 μg/ml oligomycin) and Δψm collapse with FCCP (1 μm), which fully dequenched Rh123 from mitochondria (Fig. 1A,Di–iii). These results suggest that, when glycolysis is active, mitochondrial ATP synthesis is not essential to restore Ca2+ homeostasis in the presence of Ca2+ ionophore. Indeed, full Ca2+ recovery is also observed when ATP synthase is inhibited before 4Br-A23187 challenge (Fig. 1B,Ei–iii). Strikingly, cells fully recover even when rotenone (2 μm, a mitochondrial complex I inhibitor) precedes 4Br-A23187 challenging (Fig. 1C,Fi–iii). Rotenone evokes only minor mitochondrial depolarization, which does not increase throughout 4Br-A23187 exposure, until ATP synthase is inhibited and pronounced Rh123 dequenching is observed (Fig. 1C,Fiii, thin line). These results support the hypothesis that rotenone reverses ATP synthase, arresting mitochondrial ATP synthesis and inducing glycolytic ATP consumption to maintain Δψm. Hence, when glucose is available for STHdh cells, abundant glycolytic ATP efficiently supports energy-demanding Ca2+-buffering mechanisms, occluding the mitochondria role in Ca2+ handling.
Inhibition of glycolysis highlights the mitochondrial role in Ca2+ handling, rendering STHdh cells critically dependent on oxidative phosphorylation
To highlight the mitochondrial role in Ca2+ handling, we replaced glucose with pyruvate (10 mm). Likely because of abundant glycogen stores in STHdh cells, replacement of glucose by pyruvate alone was not sufficient to prevent glycolysis (supplemental Fig. 1, available at www.jneurosci.org as supplemental material). Therefore, DDG (2 mm; a competitive inhibitor of glucose metabolism) was also added to the assay buffer to maximize glycolysis inhibition. In experiments identical to those performed with glucose (Fig. 1) except for the replacement with pyruvate plus DDG, STHdh cells were more vulnerable to 4Br-A23187 challenging, exhibiting a clear dependence on mitochondrial ATP synthesis (i.e., oxidative phosphorylation) (Fig. 2). In the absence of mitochondrial inhibitors (Fig. 2A,D), a secondary [Ca2+]i rise indicative of failure to maintain Ca2+ homeostasis (i.e., Ca2+ deregulation) occurred with a variable delay from the 4Br-A23187 challenging. Secondary [Ca2+]i rises were followed by mitochondrial depolarization with clear direct correlation in both Q7 and Q111 cells (significant Pearson correlation between the onset of [Ca2+]i rise and the onset of Rh123 dequenching; Q7: slope = 1.07 ± 0.07, r = 0.9667, p < 0.001, n = 20 cells; Q111: slope = 1.06 ± 0.04, r = 0.9848, p < 0.001, n = 20 cells). ATP synthase inhibition (oligomycin; 20 min after 4Br-A23187 challenge) caused the entire cell population to elevate [Ca2+]i synchronously (Fig. 2A,Di), indicating that maintenance of Ca2+ homeostasis primarily depended on oxidative phosphorylation. Indeed, oligomycin-evoked mitochondrial hyperpolarization (Fig. 2A,Dii,iii) (increased Rh123 quenching as ongoing proton reentry through ATP synthase is blocked) evidences ongoing ATP synthesis (Ward et al., 2000). Furthermore, when either oligomycin or rotenone precedes 4Br-A23187 challenging (Fig. 2B,E or C,F, respectively), synchronous loss of Ca2+ homeostasis occurs in the entire Q7 and Q111 cell population, revealing a critical dependence on mitochondrial ATP.
Active glycolysis attenuates the effect of mitochondrial inhibitors in STHdh cells
Mitochondria hyperpolarization by oligomycin and especially the depolarization by rotenone, were more pronounced in the absence of glycolysis (compare Figs. 1, 2A–Fii,iii). Because differential susceptibility to mitochondrial inhibitors is often used to estimate mitochondrial impairment in cellular disease models, namely in the STHdh cells used in the present study (Gines et al., 2003a; Ruan et al., 2004; Mao et al., 2006), we further explored the effect of rotenone with and without active glycolysis. The high-affinity Ca2+ probe fura-2 was used to improve the detection of small [Ca2+]i changes evoked by rotenone in Q7 and Q111 cells, also loaded with Rh123 for simultaneous monitoring of Δψm changes (Fig. 3). Two-factor (genotype by substrate) ANOVA revealed no effect of genotype (Q7 vs Q111; F(1,8) = 0.07, p > 0.05) on basal [Ca2+]i before rotenone addition. However, baseline [Ca2+]i levels were significantly influenced by the energy substrate (glucose vs pyruvate plus DDG; F(1,8) = 15.2, p < 0.01), causing cells with active glycolysis to rest at lower [Ca2+]i levels (Fig. 3A–Di; data points: circles at t = 4.9 min). Analysis of the maximal level of [Ca2+]i achieved after rotenone addition (Fig. 3A–Di; data points: circles at Ca2+ peaks) revealed higher increases above basal in cells assayed with pyruvate plus DDG (significant effect of substrate: F(1,8) = 16.9, p < 0.01). For both energy substrates, rotenone evoked a larger [Ca2+]i increase in Q111 cells than in Q7 cells (significant effect of genotype, F(1,8) = 10.1; p < 0.05). Analysis of the maximal effect achieved with rotenone (Fig. 3A–Dii; data points: circles at maximal rotenone effects) evidenced a significant attenuation of mitochondrial depolarization by active glycolysis in both Q7 and Q111 cells (significant effect of substrate, F(1,8) = 221.0, p < 0.001; no genotype effect, F(1,8) = 1.1, p > 0.05). The extensive mitochondrial depolarization achieved with oligomycin in cells with active glycolysis (Fig. 3A,Bii) confirms that the rotenone effect on Δψm was being attenuated through ATP synthase reversal.
HDAC inhibitors improve mitochondrial-dependent Ca2+ handling in STHdh cells
The effect of 24 h treatment with HDAC inhibitors [iHDAC treatment: control (no iHDAC inhibitors); TSA (10 nm trichostatin A); SB (1 mm sodium butyrate)] was investigated in the two genotypes (Q7 and Q111) of STHdh cells (Fig. 4).
Immunolabeling of acetylated histone H3 (acetyl-H3) confirmed the efficacy of HDAC inhibitors under our experimental conditions (Fig. 4A). Densitometry analysis revealed a significant increase in acetyl-H3/tubulin ratios induced by HDAC inhibitors in both genotypes (genotype by iHDAC treatment, F(2,12) = 0.6, p > 0.05; genotype, F(1,12) = 4.3, p > 0.05; iHDAC treatment, F(2,12) = 108.5, p < 0.001), an effect more pronounced for SB than for TSA (post hoc Newman–Keuls, p < 0.001 TSA or SB vs control; p < 0.001 TSA vs SB) (Fig. 4B). Hence, despite a trend for lower levels of histone H3 acetylation in control Q111 cells (acetyl-H3/tubulin, 82 ± 6 vs 100 ± 8% in control Q7 cells; n = 5), genotype differences did not reach statistical significance.
Imaging experiments for the assessment of iHDAC treatment effect on STHdh cellular function were performed exactly as those depicted in Figure 2A,D. The ability of in situ mitochondria to provide sufficient ATP for energy-demanding Ca2+-buffering mechanisms, was estimated by scoring the percentage of deregulating cells in the 20 min after 4Br-A23187 challenge in the absence of glycolysis (percentage deregulation) (Fig. 4C). The isolated comparison of Q7 and Q111 cells under control conditions (no HDAC inhibitors added) revealed a higher percentage deregulation in Q111 cells (36.2 ± 1.9% for Q7 cells and 48.2 ± 2.3% for Q111 cells; p < 0.01, unpaired t test; n = 5, comprising 401 Q7 and 400 Q111 cells). The integrated two-factor (genotype by iHDAC treatment) ANOVA evidenced no significant factor interaction (F(2,22) = 1.4; p > 0.05) nor genotype effect (F(1,22) = 1.6; p > 0.05), but a significant iHDAC treatment effect (F(2,22) = 13.2; p < 0.001) with both TSA and SB significantly decreasing the percentage deregulation (post hoc Newman–Keuls test, p < 0.001 vs control) (Fig. 4C). Because maintenance of Ca2+ homeostasis under these experimental conditions is mostly dependent on mitochondrial ATP synthesis, these results support the hypothesis that treatment with HDAC inhibitors improves mitochondrial-dependent Ca2+ handling.
Striatal neurons maintained in pyruvate media are critically dependent on mitochondria for the maintenance of Ca2+ homeostasis
After the observation of improved mitochondrial-dependent Ca2+ handling in the immortalized striatal cell lines, STHdh Q7 and Q111, we sought to investigate whether striatal neurons exhibited similar improvements after treatment with HDAC inhibitors. We prepared primary striatal cultures from YAC128 transgenic mice (expressing full-length mutant Htt) and from their wild-type littermates (supplemental Fig. 3B, available at www.jneurosci.org as supplemental material). Because of limited glycogen availability in neurons (Brown, 2004), replacement of glucose with pyruvate alone should suffice to render neurons critically dependent on mitochondria for Ca2+ handling (Nicholls, 2004). To verify this assumption, we challenged striatal neurons with mitochondrial inhibitors and monitored the subsequent changes in [Ca2+]i, Δψm, and somatic swelling (Fig. 5; supplemental Fig. 2, available at www.jneurosci.org as supplemental material).
If for pyruvate-maintained neurons mitochondrial function is in fact critical, ATP synthase inhibition should lead to cell failure. Indeed, after oligomycin (2 μg/ml) addition, striatal neurons started to elevate [Ca2+]i (Fig. 5Aa). This is a likely consequence of cellular ATP depletion and failure of Na+/K+-ATPases. Plasma membrane depolarization and activation of voltage-dependent Ca2+ channels initiate net Ca2+ uptake by the cell with the failure of Ca2+-ATPases also contributing to elevate [Ca2+]i. Using ionomycin (2 μm) to establish maximal Ca2+ responses, we scored neurons as having “elevated [Ca2+]i” when the fluo-5F fluorescence surpassed 10% of the ionomycin response (equivalent to a [Ca2+]i increase >250 nm). The increasing number of wild-type (WT) or YAC128 neurons with elevated [Ca2+]i after exposure to oligomycin was plotted as a function of time (Fig. 5B). Meaningfully, [Ca2+]i elevation in the presence of oligomycin occurred sooner for YAC128 neurons than for wild-type neurons (p < 0.05) (Fig. 5B).
Interestingly, [Ca2+]i elevation in oligomycin-exposed neurons was biphasic (Fig. 5Aa). After a variable delay, the Ca2+ signal increased to a [Ca2+]i “plateau” where it was maintained until cytoplasmic Ca2+ deregulation occurred (Fig. 5Aa, trace iv) or ionomycin was added, leading to mitochondrial depolarization (TMRM+ dequenching) and pronounced somatic swelling (Fig. 5Ab,c). Based on the Kd for fluo-5F, the [Ca2+]i plateau is close to 1 μm, consistent with the cytoplasmic set point maintained by Ca2+-accumulating mitochondria (Nicholls and Budd, 2000). Indeed, in oligomycin-treated neurons, mitochondria remain polarized (steady TMRM+ signal) (Fig. 5Ab) and thus able to accumulate Ca2+. Additional confirmation for the [Ca2+]i plateau being maintained by mitochondria arises from the observation that no [Ca2+]i plateau is observed when mitochondria are extensively depolarized by the combination of oligomycin and rotenone (1 μm). This combination leads to pronounced TMRM+ dequenching and the [Ca2+]i elevation that follows is not interrupted by a plateau, coinciding with TMRM+ reequilibration across the depolarized plasma membrane (Fig. 5C).
Together, these results demonstrate that under our experimental conditions striatal neurons are critically dependent on mitochondrial ATP synthesis and Ca2+ uptake for the maintenance of cytoplasmic Ca2+ homeostasis. These results also reveal that YAC128 neurons are more sensitive than wild-type neurons to ATP depletion, which may indicate higher energy requirements in the resting state.
Striatal neurons challenged with NMDA present different patterns of changes in [Ca2+]i, Δψm, and somatic area
With the aim of establishing a model to test the effects of HDAC inhibitors on neuronal function, namely Ca2+ handling, we induced selective NMDAR activation in striatal neurons and assessed their ability to recover from this stimulus by simultaneously monitoring changes in [Ca2+]i, Δψm, and somatic swelling. Striatal neurons with 13 DIV, expressing NMDAR2B (supplemental Fig. 3B, available at www.jneurosci.org as supplemental material), were challenged with 100 μm NMDA and 10 μm glycine in Mg2+-free buffer containing pyruvate instead of glucose, to accentuate the mitochondrial role in Ca2+ handling. After 10 min, the NMDAR antagonist MK-801 (5 μm) was added to stop receptor activation and allow for neuronal recovery as illustrated in Figure 6A,B. In some experiments, oligomycin (2 μg/ml) and FCCP (2 μm) were added 20 and 30 min after MK-801, respectively, for a deeper analysis of mitochondrial function in recovering neurons (Fig. 6C–E).
Figure 6.

Changes in [Ca2+]i, Δψm, and somatic area after NMDAR activation in striatal neurons. Representative tracings and images are from YAC128 neurons (similar responses are observed in wild-type neurons although in different proportions as shown in Fig. 7A). Neurons were challenged with 100 μm NMDA/10 μm glycine in Mg2+-free buffer with pyruvate instead of glucose. MK-801 (5 μm) was added after 10 min to stop NMDAR activation and allow for neuronal recovery. A, Field excerpts of a representative time sequence (0–35 min) of striatal neurons loaded with the fluo-5F (green) and equilibrated with TMRM+ (red). Note the different response patterns to NMDA, before and after addition of MK-801, and the variety of somatic sizes within the striatal neuronal population. B, Time sequence (0–35 min) illustrating a pair of striatal neurons with different extents of somatic swelling after NMDA challenging. C–E, Three distinct response patterns, involving changes in [Ca2+]i (C), Δψm (D), and somatic area (E), were identified: normal recovery (blue tracings), delayed recovery (green tracings), and immediate deregulation (red tracings). See Results for a detailed description of the individual tracings.
Three response patterns were identified in striatal neurons challenged with NMDA: “normal recovery,” “delayed recovery,” and “immediate deregulation.” The relative proportions of each response pattern observed in wild-type and YAC128 neurons are described in Figure 7A.
Figure 7.

Quantitative analysis of the response patterns on NMDAR activation: effect of HDAC inhibitors and putative striatal subpopulations. A, Percentage of neurons exhibiting delayed recovery (white bars) and immediate deregulation (gray bars) in the different experimental groups: control, SB, and TSA for both WT (left) and YAC128 (right). Residual percentage is normal recovery (data not shown). Significant differences from WT control: *p < 0.05, **p < 0.01; and from YAC128 control: ##p < 0.01. B, Resting somatic area (before NMDA challenge) of neurons corresponding to the following: normal recovery, delayed recovery, and immediate deregulation (left to right). Shown are control (circles), SB-treated (triangles), and TSA-treated (squares) neurons from both WT and YAC128 (white and black symbols, respectively). Significant differences are shown, regardless of genotype, for each iHDAC treatment group at each of the response patterns (control group: ***p < 0.001 from normal recovery and ###p < 0.001 from delayed recovery; SB group: &&&p < 0.001 from normal and delayed recovery; TSA group: ++p < 0.01 from normal recovery and +++p < 0.001 from normal and delayed recovery). Data are shown as mean ± SEM, n = 5 per treatment group, except for WT with SB or TSA (n = 2), comprising 415–1250 neurons per treatment group.
Normal recovery (Fig. 6C–E, blue traces) occurred in the majority of neurons being characterized by a rapid [Ca2+]i recovery after MK-801 and maintenance of a low [Ca2+]i until ionomycin (2 μm) was added. The TMRM+ response showed a slight dequenching characteristic of 5–10 mV of mitochondrial depolarization (Ward et al., 2000) on activation of the receptor, but little transient loss of probe across the plasma membrane as a consequence of plasma membrane depolarization. Mitochondrial hyperpolarization (increased TMRM+ quenching) on addition of oligomycin and the robust TMRM+ dequenching with FCCP were consistent with continued mitochondrial ATP generation and Δψm retention, respectively. Finally, receptor activation caused only a slight somatic swelling that rapidly reversed.
Delayed recovery (Fig. 6C–E, green tracings) was the second more frequent response pattern, occurring in neurons unable to stabilize [Ca2+]i during NMDA exposure. [Ca2+]i underwent a secondary rise until the onset of a slow recovery subsequent to NMDAR blockade. Loss of TMRM+ fluorescence was synchronous with the secondary rise in [Ca2+]i and slowly reversed after MK-801. The rise in [Ca2+]i after FCCP addition in these cells likely reflects release of matrix-accumulated Ca2+. It should be noted that the collapse and slow recovery in the TMRM+ response could be a consequence of a reversible depolarization of either the mitochondrial or plasma membrane (Ward et al., 2000; Rego et al., 2001), the latter could underlie the somatic swelling that occurred until the NMDA receptor antagonist was added. Nevertheless, swelling was reversible as can be seen in Figure 6, B (bottom neuron) and E.
Immediate deregulation (Fig. 6A, green neurons in the bottom frame; C–E, red tracings) was the less frequent response pattern. After NMDAR activation, [Ca2+]i increased to a high and persistent plateau. No recovery was observed with receptor blockade and even ionomycin produced no additional increase in [Ca2+]i. Mitochondria depolarization was immediately followed by extensive TMRM+ loss with no sign of recovery. Somatic swelling was also extremely fast and persistent.
Monitoring of neurons for up to 3 h after NMDAR blockade (with no other drugs added afterward) revealed stable Δψm and low [Ca2+]i for neurons exhibiting normal recovery and many of those exhibiting delayed recovery, although some of the latter underwent a form of delayed Ca2+ deregulation (DCD) (Tymianski et al., 1993), with [Ca2+]i rising to high values after a period of apparent recovery. Both, neurons undergoing delayed recovery followed by DCD and neurons experiencing immediate deregulation, progressed to membrane rupture and loss of fluorescent probes compatible with necrotic death (data not shown).
Treatment with HDAC inhibitors improves recovery from NMDAR activation: response patterns and putative striatal subpopulations
After establishing a model for studying mitochondrial-dependent Ca2+ handling in striatal neurons, we performed a comparative analysis between WT and YAC128 neurons. Striatal neurons from both genotypes were treated with HDAC inhibitors for 7 DIV [iHDAC treatment: control (no HDAC inhibitors added); SB (500 μm); TSA (50 nm)], and challenged at 13 DIV with 100 μm NMDA/10 μm glycine for 10 min in glucose- and Mg2+-free media containing 10 mm pyruvate. Responses of individual neurons to NMDA were assorted according to the three distinct patterns described above (Fig. 6), and the relative proportions are shown in Figure 7A. Two-factor (genotype by iHDAC treatment) ANOVA of delayed recovery revealed a significant main effect of genotype (F(1,18) = 7.9; p < 0.05) and iHDAC treatment (F(2,18) = 15.9; p < 0.01) and a significant genotype by iHDAC treatment interaction (F(2,18) = 3.9; p < 0.05). Post hoc Newman–Keuls test revealed a significantly higher proportion of delayed recovery in control YAC128 neurons versus control WT neurons. SB reduced delayed recovery in both WT and YAC128 neurons, whereas the reduction with TSA was selective for YAC128 neurons. Immediate deregulation occurred in higher proportion in YAC128 neurons but was not affected by iHDAC treatment [two-factor ANOVA: significant effect of genotype (F(1,18) = 8.5; p < 0.01) and no significant effect of treatment (F(2,18) = 0.07; p > 0.05) nor of genotype by iHDAC treatment interaction (F(2,18) = 0.89; p > 0.05)]. Thus, decreases in delayed recovery by HDAC inhibitors correspond to increases in normal recovery, being indicative of improved Ca2+ handling.
If HDAC inhibitors were exerting a generalized effect on neuronal Ca2+ handling, one might expect a decrease in the proportion of immediate deregulation. Instead, we observed a constant proportion of immediate deregulation, suggesting an inability of HDAC inhibitors to protect neurons prone to this particular response pattern. Thus, we addressed the possibility that the different response patterns to NMDA challenging could reflect a heterogeneous population of striatal neurons.
The large majority of neurons in the striatum is composed by GABAergic MSNs (Calabresi et al., 1996); accordingly, >96% of the neurons in our striatal cultures were positive for the GABAergic marker GAD65 (glutamic acid decarboxylase 65) (data not shown). One important means of subdividing striatal neurons, namely MSNs, is focused on their compartment location and projection sites, two features irremediably lost in cultured neurons. Although it is conceivable to distinguish cultured striatal neurons based on antibody labeling of, for instance, different neurotransmitters or associated enzymes (e.g., GABA, enkephalin, substance P, choline acetyltransferase, etc.), the need to conjugate real-time imaging of neuronal function with posterior multiple-color antibody labeling of the same neurons renders it a complex task. Thus, in the present study, we focused on the measurement of cell body size, testing the hypothesis that, if different neurons are involved, this may be detected by differences in somatic area. Measurements performed in the 5960 striatal neurons used in the NMDA challenging experiments (Fig. 7), revealed an overall mean and SD of 122 ± 43 μm2 for the resting somatic area (before NMDA challenging), with >99% of neurons between 50 and 300 μm2. These values are compatible with the predominant GABAergic MSNs, although some of the less abundant aspiny neurons can also fall within this range, with an exception made for the large cholinergic interneurons, which tend to be bigger (Kawaguchi, 1997).
Given the existent variation in somatic area, we tested whether there were differences between the mean somatic areas of neurons corresponding to the three response patterns to NMDA challenging. Somatic areas are plotted in Figure 7B, organized by response pattern (normal recovery, delayed recovery, and immediate deregulation) and comprising neurons differentially treated (iHDAC treatment: control, SB, and TSA) from the two genotypes (WT or YAC128). The only significant interaction from a three-factor (genotype by iHDAC treatment by response pattern) ANOVA was the iHDAC treatment by response pattern interaction (F(4,54) = 4.3; p < 0.01). There was a significant main effect of response pattern (F(2,54) = 120; p < 0.001), but not of genotype (F(1,54) = 1.3; p > 0.05) nor treatment (F(2,54) = 1.2; p > 0.05). Post hoc Newman–Keuls test revealed that the mean somatic area of neurons exhibiting immediate deregulation is significantly smaller than that of the other neurons. Moreover, neurons exhibiting delayed recovery are, on average, significantly larger than the others. Interesting exceptions are the SB-treated neurons in which no significant difference exists between the mean somatic areas of neurons exhibiting normal recovery and delayed recovery. A possible explanation for the attenuation of this difference would be the substantial transition of larger neurons from the delayed recovery group into the normal recovery group, as deduced from Figure 7A.
Together, these results suggest that the different response patterns to NMDA challenging may be correlated with different subpopulations of MSNs, providing an explanation for the resistance to treatment with HDAC inhibitors observed in the subpopulation exhibiting immediate deregulation.
Discussion
Previous work suggests that mitochondrial dysfunction and abnormalities in Ca2+ handling play a role in HD pathogenesis (Panov et al., 2002; Bezprozvanny and Hayden, 2004). Here, we investigate the contribution of in situ mitochondria for Ca2+ handling in intact HD striatal cells. Through functional experiments with glucose or with nonglycolytic substrates, we evidence active glycolysis as a major confounding factor when assessing Δψm and Ca2+ handling in STHdh cells. This has broad implications for interpreting the effects of mitochondrial inhibitors, commonly used when exploring putative mitochondrial dysfunction in cellular disease models. Furthermore, in both STHdh cells and striatal neurons expressing full-length Htt, we demonstrate deficits in mitochondrial-dependent Ca2+ handling taken to reflect early nonlethal dysfunction. Finally, we investigate whether treatment with HDAC inhibitors, previously shown to reduce cell death in HD models (Beal and Ferrante, 2004), can ameliorate these signs of early neuronal dysfunction. Results obtained by functional studies in both STHdh cells and striatal neurons evidence more efficient Ca2+ handling, supporting improved neuronal function after treatment with HDAC inhibitors.
Immortalized striatal cells, STHdh Q7 and Q111, have been previously used as a HD cellular model (Trettel et al., 2000; Gines et al., 2003a,b; Choo et al., 2004; Ruan et al., 2004; Milakovic and Johnson, 2005; Seong et al., 2005; Wang et al., 2005; Mao et al., 2006). However, real-time measurements of Ca2+ handling and Δψm in these cells were not previously described. Calcium ionophores such as A23187 have been previously used to establish Ca2+-induced toxicity models of HD (Petersen and Brundin, 1999; Petersen et al., 2000). Here, we used the nonfluorescent derivative 4-BrA23187, more suitable for Ca2+-imaging studies with fura-4F and fura-2, to evoke increases in [Ca2+]i in STHdh cells. These ionophores induce intracellular Ca2+ overload by promoting both extracellular Ca2+ influx and Ca2+ release from intracellular compartments (Abramov and Duchen, 2003). Although the lack of specificity of ionophores may cause them to affect the mitochondrial membrane (Nicholls, 2006), and 7 μm 4Br-A23187 does hyperpolarize the mitochondria (increased Rh123 quenching was observed in the present study), this low ionophore concentration does not prevent mitochondrial ATP synthesis in intact coverslip-attached STHdh cells. This is clearly demonstrated by the effect of oligomycin after 20 min exposure to 4Br-A23187 in the absence of glycolysis. Oligomycin increases Rh123 quenching, demonstrating mitochondrial hyperpolarization as a result of blockade of proton reentry through the ATP synthase. Moreover, this proton reentry was efficiently leading to ATP synthesis as evidenced by the catastrophic consequences to Ca2+ homeostasis resulting from oligomycin addition. Hence, the proportion of deregulating cells in the course of 4Br-A23187 challenging, in the absence of glycolysis, reflects the ability of in situ mitochondria to provide ATP for energy-demanding Ca2+ buffering. Because this proportion of deregulating cells was higher for Q111 than for Q7 cells, under control conditions, these results are supportive of deficits in mitochondrial function, namely decreased ATP production in Q111 cells.
Deficits in mitochondrial function were previously reported for Q111 cells. Respiratory chain impairment in Q111 cells (Gines et al., 2003a) was proposed based on the following: (1) impaired MTT conversion, (2) heightened sensitivity to 3-nitropropionic acid (3-NP) estimated by the decreased percentage survival assessed by nuclei counting, and (3) decreased ATP and ATP/ADP ratio. The first two observations rely on assays highly influenced by cell number, and thus need to be interpreted with caution because Q111 cells are smaller than Q7 cells (Milakovic and Johnson, 2005) causing contact inhibition of growth to occur at higher cell number/area ratios (data not shown). Hence, treatments inducing identical growth arrest in proliferating Q7 and Q111 cells may appear to cause different effects, as a result of differences in the maximal confluence of nontreated controls. The first description of decreased total ATP levels (Gines et al., 2003a) contrasts with a later description of similar levels (Milakovic and Johnson, 2005). However, when the contribution of glycolysis versus oxidative phosphorylation is dissected, there seems to be an agreement as for the decreased mitochondrial ATP production in Q111 versus Q7 cells (Milakovic and Johnson, 2005; Seong et al., 2005).
The cause for the decreased mitochondrial ATP production is still a matter of debate. Decreased mitochondrial ADP uptake has been proposed (Seong et al., 2005), but the authors found no differences in the activity of the adenine nucleotide transporter. Their alternative hypothesis of decreased mitochondrial ADP uptake resulting from higher cytosolic Ca2+ in Q111 cells (determined by fluo-3 flow cytometry) is difficult to conciliate with the observation of decreased ADP uptake in experiments with isolated Q111 mitochondria, in which extramitochondrial Ca2+ is identical to Q7 cells (Seong et al., 2005). Moreover, the absence of differences in resting [Ca2+]i determined in the present study, using nonpermeabilized coverslip-attached STHdh cells and in situ calibration of the ratiometric fura-2 Ca2+ probe, is unsupportive of mitochondrial impairment caused by higher resting [Ca2+]i in Q111 versus Q7 cells.
A comprehensive analysis of mitochondrial respiratory function in digitonin-permeabilized Q7 and Q111 cells revealed that the decreased mitochondrial ATP production in Q111 cells is not related to the impairment of any of the respiratory chain complexes (Milakovic and Johnson, 2005). However, Q111 cells were reported to be selectively vulnerable to complex II inhibition with 3-NP (Ruan et al., 2004). As demonstrated in the present study, abundant glycolysis in STHdh cells substantially attenuates the effects of mitochondrial inhibitors, namely allowing for Δψm maintenance after complex I inhibition and subsequent ATP synthase reversal. It is therefore not surprising that, whereas 100 μm 3-NP is toxic for striatal neurons (Galas et al., 2004; Napolitano et al., 2004), 10–20 mm 3-NP concentrations are used in STHdh cells (Ruan et al., 2004; Mao et al., 2006). Because, at least in corticostriatal slices, succinate dehydrogenase is maximally inhibited with 1–3 mm 3-NP (Saulle et al., 2004), one possible explanation for conflicting reports of mitochondrial respiratory chain impairment in STHdh cells, is the lack of complex II selectivity achieved with high 3-NP concentrations.
Indeed, abundant glycolysis is a major confounding factor when looking for differences in mitochondrial function, and may contribute for the lack of difference in cell death induced by rotenone in Q111 and Q7 cells (Ruan et al., 2004), because, once ATP synthase reversal occurs, the cellular energetic fate will be primarily governed by glycolysis. In the present study, rotenone evoked a larger [Ca2+]i increase in Q111 cells versus Q7 cells, particularly in the absence of glycolysis. This may result from higher energy requirements in Q111 cells dealing with mutant Htt, causing the cellular ATP drop imposed by rotenone to have a larger impact on Q111 cells homeostasis. Accordingly, mutant Htt expression in YAC128 neurons was also associated with higher susceptibility to ATP synthase inhibition. Hence, a combination of deficits in mitochondrial ATP production and higher energy requirements in the basal state would synergistically hinder the cellular recovery from high-energy demanding stimuli (e.g., Ca2+ excitotoxicity) in cells expressing mutant Htt. In agreement with this hypothesis, real-time imaging of changes in [Ca2+]i and Δψm revealed deficits in recovery from 4Br-A23187 challenging and NMDAR activation in Q111 cells and YAC128 neurons, respectively, in comparison with wild-type controls. Given the critical dependence on mitochondrial function under our experimental conditions, these results are supportive of impaired mitochondrial-dependent Ca2+ handling in cells expressing mutant Htt. Thus, treatments able to improve this mitochondrial-dependent Ca2+ handling would be expected to improve neuronal function in HD.
Here, we demonstrate that treatment with two structurally unrelated HDAC inhibitors, TSA and SB, improves mitochondrial-dependent Ca2+ handling in two complementary striatal cell models of HD expressing full-length Htt. HDAC inhibitors increased histone H3 acetylation, evidencing effective HDAC inhibition in our study. The lack of differences in basal histone H3 acetylation between cells expressing full-length mutant Htt and cells expressing wild-type Htt is consistent with no large gene expression changes in early HD pathogenesis modeled with full-length Htt (Chan et al., 2002). Still, in the absence of differences in basal histone acetylation, the effects of HDAC inhibitors in the present study cannot simply be ascribed to the reestablishment of histone acetylation levels. This does not implicate that such reestablishment does not play a role in the protective effects of HDAC inhibitors, particularly in models of advanced HD exhibiting reduced histone acetylation levels (Steffan et al., 2000). However, beyond the simple restoration of “normal” gene expression levels, HDAC inhibitors may act to enhance the expression of genes and proteins that exert therapeutically useful effects on neuronal function. In agreement with this hypothesis, HDAC inhibitors improved mitochondrial-dependent Ca2+ handling also in cells that do not express mutant Htt. The only exception was the lack of effect of TSA over wild-type striatal neurons. Possibly, the extent of gene/protein changes evoked by TSA in striatal neurons was smaller than that evoked by SB, in agreement with TSA affecting 10 times less genes than SB in colon cells (Mariadason et al., 2000). Moreover, small changes in gene expression induced by TSA in striatal neurons may only be relevant when Ca2+ handling is impaired as in the case of YAC128 neurons.
The precise identification of the key gene and protein expression changes associated with the neuroprotective effects of HDAC inhibitors is likely to be complex and is beyond the scope of the present study, focused on the functional consequences of the treatment in HD cells exhibiting early signs of dysfunction. Nevertheless, microarray screens targeted at key genes involved in mitochondrial function and Ca2+ homeostasis are currently being conducted (our unpublished data). In addition to the functional data gathered in the present study, previous evidences support improved mitochondrial function and/or protection from excitotoxicity after treatment with HDAC inhibitors. Neuronal death induced by mitochondrial complex II inhibition is reduced by the HDAC inhibitor SB (Ferrante et al., 2003; Ryu et al., 2003). HDAC inhibitors potentiate the activity of the transcription factor cAMP response element-binding protein (CREB) (Michael et al., 2000), and CREB-dependent gene transcription enhances mitochondrial respiration through the induction of cytochrome c (Herzig et al., 2000). Furthermore, treatment with HDAC inhibitors was correlated with increased mitochondrial activity and/or mass in X-linked adrenoleukodystrophy cellular models (McGuinness et al., 2003). In addition, TSA and/or SB are able to reduce the death of cultured cortical or cerebellar granule neurons exposed to excitotoxic stimuli, namely to the glutamate analog homocysteate (Ryu et al., 2003) or SYM-2081 [(2S,4R)-4-methylglutamate], an inhibitor of excitatory amino acid transporters and an agonist of low-affinity kainate receptors (Kanai et al., 2004).
The increased and selective vulnerability of HD striatal neurons has been ascribed to a higher ability of mutant Htt to potentiate the NMDAR responses mediated by the NR1/NR2B subtype expressed particularly in striatal MSNs (Li et al., 2003; Bezprozvanny and Hayden, 2004). Still, the contribution of mitochondrial dysfunction for disturbed Ca2+ handling, as a downstream mechanism from NMDAR activation, cannot be ruled out and has not been explored in detail in intact HD neurons (i.e., in situ mitochondria in a striatal neuronal context expressing mutant Htt). Although some studies addressed the relationship between Ca2+ and Δψm using isolated mitochondria from HD cells (Panov et al., 2002; Choo et al., 2004; Brustovetsky et al., 2005), so far only one study addressed the changes in Δψm resulting from NMDAR activation in striatal neurons from HD mice (Zeron et al., 2004). However, changes in [Ca2+]i and Δψm were separately determined in different neurons, not allowing for a detailed analysis of the interaction between these two parameters. Furthermore, the use of the low-affinity Ca2+ probe, Mag-fura-2 (Kd ∼ 25 μm), and supramaximal NMDA concentrations (0.5 or 3 mm) also prevented the characterization of Ca2+ signals in neurons experiencing moderate Ca2+ elevations and normal recovery after NMDA challenge.
In the present study, using pyruvate instead of glucose, we have accentuated the cellular bioenergetic consequences of mitochondrial dysfunction in HD neurons. Furthermore, the simultaneous monitoring of three interrelated cellular parameters: changes in [Ca2+]i, Δψm, and somatic swelling, allowed for a detailed characterization of the homeostatic changes occurring in neurons. Clearly, cultured striatal neurons do not respond homogeneously to NMDAR activation. Three different response patterns were identified (normal recovery, delayed recovery, and immediate deregulation) in a population almost exclusively composed by GABAergic striatal neurons with somatic areas compatible with MSNs. The unaltered proportion of neurons exhibiting immediate deregulation after treatment with HDAC inhibitors and the smaller somatic area observed for these neurons, suggest that they may belong to a subpopulation resistant to treatment. Significantly, subpopulations of MSNs with different susceptibilities to HD have been identified in studies of autopsy material from HD patients (Reiner et al., 1988). It would be of great interest to know whether different subpopulations present different somatic increases of HD mutation length (Kennedy et al., 2003).
Although we have not performed a detailed biochemical characterization of the neurons exhibiting different response patterns, the present study has the advantage of correlating morphological criteria (somatic area) with functional data (real-time monitoring of changes in [Ca2+]i, Δψm, and somatic swelling). Thus, we advance the provocative hypothesis that, even if all neurons belong to the same population, sufficient functional differences exist in the ability to handle NMDAR activation to assign them to different functional states. Indeed, for the same stimulus, neurons exhibiting immediate deregulation will probably undergo necrosis, whereas neurons exhibiting delayed recovery are more likely to survive or undergo apoptosis, because the restoration of Δψm allows for the ATP synthesis needed for programmed cell death (Ankarcrona et al., 1995). Analysis of qualitative differences in recovery is advantageous to obtain relevant information on early neuronal dysfunction that may escape detection when focusing exclusively on cell death. Admitting that striatal neurons exhibiting immediate deregulation resemble advanced HD, whereas delayed recovery are better representatives of early HD, our data suggest one important therapeutic inference: treatment with HDAC inhibitors is likely to be more beneficial in early stages of HD.
In summary, functional data presented in this study have important implications for understanding early neuronal dysfunction in HD striatum, involving deficits in mitochondrial function and Ca2+ handling. The increased Ca2+-handling efficiency after treatment with HDAC inhibitors may be therapeutically useful for counteracting neuronal dysfunction in the course of HD pathology.
Footnotes
This work was supported by the HighQ Foundation (AC Rego-Grant) and Fundação para a Ciência e a Tecnologia I&D 226/94, POCTI-QCAIII, POCI/SAU-NEU/57310/2004. J.M.A.O. is grateful to the Calouste Gulbenkian Foundation for financial support. D.G.N. was supported by National Institute of Neurological Disorders and Stroke Grant RO1 NSO4 1908. L.M.E. was supported by National Institutes of Health Grant NS40251A and is grateful to the Hereditary Disease Foundation and HighQ Foundation for their support.
References
- Abramov AY, Duchen MR. Actions of ionomycin, 4-BrA23187 and a novel electrogenic Ca2+ ionophore on mitochondria in intact cells. Cell Calc. 2003;33:101–112. doi: 10.1016/s0143-4160(02)00203-8. [DOI] [PubMed] [Google Scholar]
- Ajamian F, Salminen A, Reeben M. Selective regulation of class I and class II histone deacetylases expression by inhibitors of histone deacetylases in cultured mouse neural cells. Neurosci Lett. 2004;365:64–68. doi: 10.1016/j.neulet.2004.04.087. [DOI] [PubMed] [Google Scholar]
- Ankarcrona M, Dypbukt JM, Bonfoco E, Zhivotovsky B, Orrenius S, Lipton SA, Nicotera P. Glutamate-induced neuronal death: a succession of necrosis or apoptosis depending on mitochondrial function. Neuron. 1995;15:961–973. doi: 10.1016/0896-6273(95)90186-8. [DOI] [PubMed] [Google Scholar]
- Bates GP. Huntington's disease. Exploiting expression. Nature. 2001;413:691, 693–694. doi: 10.1038/35099656. [DOI] [PubMed] [Google Scholar]
- Beal MF. Mitochondria take center stage in aging and neurodegeneration. Ann Neurol. 2005;58:495–505. doi: 10.1002/ana.20624. [DOI] [PubMed] [Google Scholar]
- Beal MF, Ferrante RJ. Experimental therapeutics in transgenic mouse models of Huntington's disease. Nat Rev Neurosci. 2004;5:373–384. doi: 10.1038/nrn1386. [DOI] [PubMed] [Google Scholar]
- Bezprozvanny I, Hayden MR. Deranged neuronal calcium signaling and Huntington disease. Biochem Biophys Res Commun. 2004;322:1310–1317. doi: 10.1016/j.bbrc.2004.08.035. [DOI] [PubMed] [Google Scholar]
- Brown AM. Brain glycogen re-awakened. J Neurochem. 2004;89:537–552. doi: 10.1111/j.1471-4159.2004.02421.x. [DOI] [PubMed] [Google Scholar]
- Brustovetsky N, LaFrance R, Purl KJ, Brustovetsky T, Keene CD, Low WC, Dubinsky JM. Age-dependent changes in the calcium sensitivity of striatal mitochondria in mouse models of Huntington's Disease. J Neurochem. 2005;93:1361–1370. doi: 10.1111/j.1471-4159.2005.03036.x. [DOI] [PubMed] [Google Scholar]
- Calabresi P, Pisani A, Mercuri NB, Bernardi G. The corticostriatal projection: from synaptic plasticity to dysfunctions of the basal ganglia. Trends Neurosci. 1996;19:19–24. doi: 10.1016/0166-2236(96)81862-5. [DOI] [PubMed] [Google Scholar]
- Cha JH. Transcriptional dysregulation in Huntington's disease. Trends Neurosci. 2000;23:387–392. doi: 10.1016/s0166-2236(00)01609-x. [DOI] [PubMed] [Google Scholar]
- Chan EY, Luthi-Carter R, Strand A, Solano SM, Hanson SA, DeJohn MM, Kooperberg C, Chase KO, DiFiglia M, Young AB, Leavitt BR, Cha JH, Aronin N, Hayden MR, Olson JM. Increased huntingtin protein length reduces the number of polyglutamine-induced gene expression changes in mouse models of Huntington's disease. Hum Mol Genet. 2002;11:1939–1951. doi: 10.1093/hmg/11.17.1939. [DOI] [PubMed] [Google Scholar]
- Choo YS, Johnson GV, MacDonald M, Detloff PJ, Lesort M. Mutant huntingtin directly increases susceptibility of mitochondria to the calcium-induced permeability transition and cytochrome c release. Hum Mol Genet. 2004;13:1407–1420. doi: 10.1093/hmg/ddh162. [DOI] [PubMed] [Google Scholar]
- Ferrante RJ, Kubilus JK, Lee J, Ryu H, Beesen A, Zucker B, Smith K, Kowall NW, Ratan RR, Luthi-Carter R, Hersch SM. Histone deacetylase inhibition by sodium butyrate chemotherapy ameliorates the neurodegenerative phenotype in Huntington's disease mice. J Neurosci. 2003;23:9418–9427. doi: 10.1523/JNEUROSCI.23-28-09418.2003. [DOI] [PMC free article] [PubMed] [Google Scholar]
- Galas MC, Bizat N, Cuvelier L, Bantubungi K, Brouillet E, Schiffmann SN, Blum D. Death of cortical and striatal neurons induced by mitochondrial defect involves differential molecular mechanisms. Neurobiol Dis. 2004;15:152–159. doi: 10.1016/j.nbd.2003.09.013. [DOI] [PubMed] [Google Scholar]
- Gines S, Seong IS, Fossale E, Ivanova E, Trettel F, Gusella JF, Wheeler VC, Persichetti F, Macdonald ME. Specific progressive cAMP reduction implicates energy deficit in presymptomatic Huntington's disease knock-in mice. Hum Mol Genet. 2003a;12:497–508. doi: 10.1093/hmg/ddg046. [DOI] [PubMed] [Google Scholar]
- Gines S, Ivanova E, Seong IS, Saura CA, Macdonald ME. Enhanced Akt signaling is an early pro-survival response that reflects N-methyl-d-aspartate receptor activation in Huntington's disease knock-in striatal cells. J Biol Chem. 2003b;278:50514–50522. doi: 10.1074/jbc.M309348200. [DOI] [PubMed] [Google Scholar]
- Gusella JF, Macdonald ME. Molecular genetics: unmasking polyglutamine triggers in neurodegenerative disease. Nat Rev Neurosci. 2000;1:109–115. doi: 10.1038/35039051. [DOI] [PubMed] [Google Scholar]
- Haugland RP. Handbook of fluorescent probes and research products. Eugene, OR: Molecular Probes; 2002. Fluorescent Ca2+ indicators excited with UV light; pp. 776–781. [Google Scholar]
- Herzig RP, Scacco S, Scarpulla RC. Sequential serum-dependent activation of CREB and NRF-1 leads to enhanced mitochondrial respiration through the induction of cytochrome c. J Biol Chem. 2000;275:13134–13141. doi: 10.1074/jbc.275.17.13134. [DOI] [PubMed] [Google Scholar]
- Hughes RE. Polyglutamine disease: acetyltransferases awry. Curr Biol. 2002;12:R141–R143. doi: 10.1016/s0960-9822(02)00709-1. [DOI] [PubMed] [Google Scholar]
- Huntington's Disease Collaborative Research Group. A novel gene containing a trinucleotide repeat that is expanded and unstable on Huntington's disease chromosomes. The Huntington's Disease Collaborative Research Group. Cell. 1993;72:971–983. doi: 10.1016/0092-8674(93)90585-e. [DOI] [PubMed] [Google Scholar]
- Kanai H, Sawa A, Chen RW, Leeds P, Chuang DM. Valproic acid inhibits histone deacetylase activity and suppresses excitotoxicity-induced GAPDH nuclear accumulation and apoptotic death in neurons. Pharmacogenomics J. 2004;4:336–344. doi: 10.1038/sj.tpj.6500269. [DOI] [PubMed] [Google Scholar]
- Kawaguchi Y. Neostriatal cell subtypes and their functional roles. Neurosci Res. 1997;27:1–8. doi: 10.1016/s0168-0102(96)01134-0. [DOI] [PubMed] [Google Scholar]
- Kennedy L, Evans E, Chen CM, Craven L, Detloff PJ, Ennis M, Shelbourne PF. Dramatic tissue-specific mutation length increases are an early molecular event in Huntington disease pathogenesis. Hum Mol Genet. 2003;12:3359–3367. doi: 10.1093/hmg/ddg352. [DOI] [PubMed] [Google Scholar]
- Li L, Fan M, Icton CD, Chen N, Leavitt BR, Hayden MR, Murphy TH, Raymond LA. Role of NR2B-type NMDA receptors in selective neurodegeneration in Huntington disease. Neurobiol Aging. 2003;24:1113–1121. doi: 10.1016/j.neurobiolaging.2003.04.003. [DOI] [PubMed] [Google Scholar]
- Mao L, Wang JQ. Upregulation of preprodynorphin and preproenkephalin mRNA expression by selective activation of group I metabotropic glutamate receptors in characterized primary cultures of rat striatal neurons. Brain Res Mol Brain Res. 2001;86:125–137. doi: 10.1016/s0169-328x(00)00276-x. [DOI] [PubMed] [Google Scholar]
- Mao Z, Choo YS, Lesort M. Cystamine and cysteamine prevent 3-NP-induced mitochondrial depolarization of Huntington's disease knock-in striatal cells. Eur J Neurosci. 2006;23:1701–1710. doi: 10.1111/j.1460-9568.2006.04686.x. [DOI] [PubMed] [Google Scholar]
- Mariadason JM, Corner GA, Augenlicht LH. Genetic reprogramming in pathways of colonic cell maturation induced by short chain fatty acids: comparison with trichostatin A, sulindac, and curcumin and implications for chemoprevention of colon cancer. Cancer Res. 2000;60:4561–4572. [PubMed] [Google Scholar]
- McGuinness MC, Lu JF, Zhang HP, Dong GX, Heinzer AK, Watkins PA, Powers J, Smith KD. Role of ALDP (ABCD1) and mitochondria in X-linked adrenoleukodystrophy. Mol Cell Biol. 2003;23:744–753. doi: 10.1128/MCB.23.2.744-753.2003. [DOI] [PMC free article] [PubMed] [Google Scholar]
- Michael LF, Asahara H, Shulman AI, Kraus WL, Montminy M. The phosphorylation status of a cyclic AMP-responsive activator is modulated via a chromatin-dependent mechanism. Mol Cell Biol. 2000;20:1596–1603. doi: 10.1128/mcb.20.5.1596-1603.2000. [DOI] [PMC free article] [PubMed] [Google Scholar]
- Milakovic T, Johnson GV. Mitochondrial respiration and ATP production are significantly impaired in striatal cells expressing mutant huntingtin. J Biol Chem. 2005;280:30773–30782. doi: 10.1074/jbc.M504749200. [DOI] [PubMed] [Google Scholar]
- Napolitano M, Centonze D, Gubellini P, Rossi S, Spiezia S, Bernardi G, Gulino A, Calabresi P. Inhibition of mitochondrial complex II alters striatal expression of genes involved in glutamatergic and dopaminergic signaling: possible implications for Huntington's disease. Neurobiol Dis. 2004;15:407–414. doi: 10.1016/j.nbd.2003.11.021. [DOI] [PubMed] [Google Scholar]
- Nicholls DG. Mitochondrial dysfunction and glutamate excitotoxicity studied in primary neuronal cultures. Curr Mol Med. 2004;4:149–177. doi: 10.2174/1566524043479239. [DOI] [PubMed] [Google Scholar]
- Nicholls DG. Simultaneous monitoring of ionophore- and inhibitor-mediated plasma and mitochondrial membrane potential changes in cultured neurons. J Biol Chem. 2006;281:14864–14874. doi: 10.1074/jbc.M510916200. [DOI] [PubMed] [Google Scholar]
- Nicholls DG, Budd SL. Mitochondria and neuronal survival. Physiol Rev. 2000;80:315–360. doi: 10.1152/physrev.2000.80.1.315. [DOI] [PubMed] [Google Scholar]
- Panov AV, Gutekunst CA, Leavitt BR, Hayden MR, Burke JR, Strittmatter WJ, Greenamyre JT. Early mitochondrial calcium defects in Huntington's disease are a direct effect of polyglutamines. Nat Neurosci. 2002;5:731–736. doi: 10.1038/nn884. [DOI] [PubMed] [Google Scholar]
- Petersen A, Brundin P. Effects of ciliary neurotrophic factor on excitotoxicity and calcium-ionophore A23187-induced cell death in cultured embryonic striatal neurons. Exp Neurol. 1999;160:402–412. doi: 10.1006/exnr.1999.7221. [DOI] [PubMed] [Google Scholar]
- Petersen A, Castilho RF, Hansson O, Wieloch T, Brundin P. Oxidative stress, mitochondrial permeability transition and activation of caspases in calcium ionophore A23187-induced death of cultured striatal neurons. Brain Res. 2000;857:20–29. doi: 10.1016/s0006-8993(99)02320-3. [DOI] [PubMed] [Google Scholar]
- Rego AC, Ward MW, Nicholls DG. Mitochondria control AMPA/kainate receptor-induced cytoplasmic calcium deregulation in rat cerebellar granule cells. J Neurosci. 2001;21:1893–1901. doi: 10.1523/JNEUROSCI.21-06-01893.2001. [DOI] [PMC free article] [PubMed] [Google Scholar]
- Reiner A, Albin RL, Anderson KD, D'Amato CJ, Penney JB, Young AB. Differential loss of striatal projection neurons in Huntington disease. Proc Natl Acad Sci USA. 1988;85:5733–5737. doi: 10.1073/pnas.85.15.5733. [DOI] [PMC free article] [PubMed] [Google Scholar]
- Ruan Q, Lesort M, Macdonald ME, Johnson GV. Striatal cells from mutant huntingtin knock-in mice are selectively vulnerable to mitochondrial complex II inhibitor-induced cell death through a non-apoptotic pathway. Hum Mol Genet. 2004;13:669–681. doi: 10.1093/hmg/ddh082. [DOI] [PubMed] [Google Scholar]
- Ryu H, Lee J, Olofsson BA, Mwidau A, Dedeoglu A, Escudero M, Flemington E, Azizkhan-Clifford J, Ferrante RJ, Ratan RR. Histone deacetylase inhibitors prevent oxidative neuronal death independent of expanded polyglutamine repeats via an Sp1-dependent pathway. Proc Natl Acad Sci USA. 2003;100:4281–4286. doi: 10.1073/pnas.0737363100. [DOI] [PMC free article] [PubMed] [Google Scholar]
- Saulle E, Gubellini P, Picconi B, Centonze D, Tropepi D, Pisani A, Morari M, Marti M, Rossi L, Papa M, Bernardi G, Calabresi P. Neuronal vulnerability following inhibition of mitochondrial complex II: a possible ionic mechanism for Huntington's disease. Mol Cell Neurosci. 2004;25:9–20. doi: 10.1016/j.mcn.2003.09.013. [DOI] [PubMed] [Google Scholar]
- Seong IS, Ivanova E, Lee JM, Choo YS, Fossale E, Anderson M, Gusella JF, Laramie JM, Myers RH, Lesort M, MacDonald ME. HD CAG repeat implicates a dominant property of huntingtin in mitochondrial energy metabolism. Hum Mol Genet. 2005;14:2871–2880. doi: 10.1093/hmg/ddi319. [DOI] [PubMed] [Google Scholar]
- Slow EJ, van Raamsdonk J, Rogers D, Coleman SH, Graham RK, Deng Y, Oh R, Bissada N, Hossain SM, Yang YZ, Li XJ, Simpson EM, Gutekunst CA, Leavitt BR, Hayden MR. Selective striatal neuronal loss in a YAC128 mouse model of Huntington disease. Hum Mol Genet. 2003;12:1555–1567. doi: 10.1093/hmg/ddg169. [DOI] [PubMed] [Google Scholar]
- Steffan JS, Kazantsev A, Spasic-Boskovic O, Greenwald M, Zhu YZ, Gohler H, Wanker EE, Bates GP, Housman DE, Thompson LM. The Huntington's disease protein interacts with p53 and CREB-binding protein and represses transcription. Proc Natl Acad Sci USA. 2000;97:6763–6768. doi: 10.1073/pnas.100110097. [DOI] [PMC free article] [PubMed] [Google Scholar]
- Sugars KL, Rubinsztein DC. Transcriptional abnormalities in Huntington disease. Trends Genet. 2003;19:233–238. doi: 10.1016/S0168-9525(03)00074-X. [DOI] [PubMed] [Google Scholar]
- Tobin AJ, Signer ER. Huntington's disease: the challenge for cell biologists. Trends Cell Biol. 2000;10:531–536. doi: 10.1016/s0962-8924(00)01853-5. [DOI] [PubMed] [Google Scholar]
- Trettel F, Rigamonti D, Hilditch-Maguire P, Wheeler VC, Sharp AH, Persichetti F, Cattaneo E, Macdonald ME. Dominant phenotypes produced by the HD mutation in STHdh(Q111) striatal cells. Hum Mol Genet. 2000;9:2799–2809. doi: 10.1093/hmg/9.19.2799. [DOI] [PubMed] [Google Scholar]
- Tymianski M, Charlton MP, Carlen PL, Tator CH. Source specificity of early calcium neurotoxicity in cultured embryonic spinal neurons. J Neurosci. 1993;13:2085–2104. doi: 10.1523/JNEUROSCI.13-05-02085.1993. [DOI] [PMC free article] [PubMed] [Google Scholar]
- Vonsattel JP, DiFiglia M. Huntington disease. J Neuropathol Exp Neurol. 1998;57:369–384. doi: 10.1097/00005072-199805000-00001. [DOI] [PubMed] [Google Scholar]
- Wang J, Gines S, Macdonald ME, Gusella JF. Reversal of a full-length mutant huntingtin neuronal cell phenotype by chemical inhibitors of polyglutamine-mediated aggregation. BMC Neurosci. 2005;6:1. doi: 10.1186/1471-2202-6-1. [DOI] [PMC free article] [PubMed] [Google Scholar]
- Ward MW, Rego AC, Frenguelli BG, Nicholls DG. Mitochondrial membrane potential and glutamate excitotoxicity in cultured cerebellar granule cells. J Neurosci. 2000;20:7208–7219. doi: 10.1523/JNEUROSCI.20-19-07208.2000. [DOI] [PMC free article] [PubMed] [Google Scholar]
- Wokosin DL, Loughrey CM, Smith GL. Characterization of a range of fura dyes with two-photon excitation. Biophys J. 2004;86:1726–1738. doi: 10.1016/S0006-3495(04)74241-1. [DOI] [PMC free article] [PubMed] [Google Scholar]
- Zeron MM, Fernandes HB, Krebs C, Shehadeh J, Wellington CL, Leavitt BR, Baimbridge KG, Hayden MR, Raymond LA. Potentiation of NMDA receptor-mediated excitotoxicity linked with intrinsic apoptotic pathway in YAC transgenic mouse model of Huntington's disease. Mol Cell Neurosci. 2004;25:469–479. doi: 10.1016/j.mcn.2003.11.014. [DOI] [PubMed] [Google Scholar]