

Abstract
One of the most salient features of primary vibrissal afferents is their sensitivity to the direction in which the vibrissae move. Directional sensitivity is also well conserved in brainstem, thalamic, and cortical neurons of the lemniscal pathway, indicating that this property plays a key role in the organization of the vibrissal system. Here, we show that directional tuning is also a fundamental feature of second-order interpolaris neurons that give rise to the paralemniscal pathway. Quantitative assessment of responses to vibrissa deflection revealed an anisotropic organization of receptive fields with regard to topography, response magnitude, and the degree of angular tuning. Responses evoked by all vibrissae within the receptive field of each cell exhibited a high consistency of direction preference, but a striking difference in angular tuning preference was found among cells that reside in the rostral and caudal divisions of the interpolaris nucleus. Although in caudal interpolaris vectors of angular preference pointed in all directions, in rostral interpolaris virtually all vectors pointed upward, revealing a strong preference for this direction. Control experiments showed that the upward bias did not rely on a preferential innervation of rostral cells by upwardly tuned primary vibrissa afferents, nor did it rely on a direction-selective recruitment of feedforward inhibition. We thus propose that the upward preference bias of rostral cells, which project to the posterior group of the thalamus, emerges from use-dependent synaptic processes that relate to the kinematics of whisking.
Keywords: vibrissa, trigeminal nuclei, paralemniscal pathway, interpolaris nucleus, whisking, vibrissal receptive field
Introduction
The brainstem trigeminal complex is the first relay station in the vibrissal system of rodents. From there, three pathways convey information to the cerebral cortex: (1) a pathway that arises from the principal trigeminal nucleus, transits through the ventral posterior medial nucleus (VPM) of the thalamus, and terminates in the barrels of the primary somatosensory cortex (often termed the lemniscal pathway); (2) a pathway that arises from the rostral interpolar nucleus of the spinal trigeminal complex (SpVir), transits through the posterior group nucleus (Po), and terminates principally in layers 1 and 5a throughout the primary somatosensory cortex [usually termed the paralemniscal pathway (Williams et al., 1994; Veinante and Deschênes, 1999; Pierret et al., 2000; Yu et al., 2006)]; and (3) a more recently discovered pathway that arises from the caudal interpolar nucleus (SpVic), transits through the ventral lateral part of the VPM (VPMvl), and terminates in the second somatosensory area and in the septal regions of the barrel field (Pierret et al., 2000). In accord with the dual origins of the SpVi–thalamic projections, two cytoarchitectonic divisions have been identified in the ventral, vibrissa-responsive region of the SpVi: a magnocellular division, which occupies the rostral half of the SpVi, and a parvocellular division, which occupies the caudal half of the nucleus (Phelan and Falls, 1989, 1991).
In contrast to the large number of studies that have dealt with the processing of vibrissal information in relay stations of the lemniscal pathway, few have investigated the physiology of second-order neurons within the SpVi. We know of only one study in which controlled deflection of the vibrissae was used to assess quantitatively the response properties of brainstem neurons that give rise to the paralemniscal pathways (Woolston et al., 1982). Yet, quantitative assessments were limited to the deflection of only one of the vibrissae within the receptive field of a cell (the “dominant” vibrissa as determined with a hand-held probe). An exhaustive survey of cell types and structure–function relationships in this nucleus was later provided by Jacquinapos;s group, who used tract tracing and single-cell labeling methods to show that the SpVi contains two broad classes of neurons: multivibrissa-responsive cells, which project to the thalamus or the cerebellum, and monovibrissa-responsive, local circuit cells that project to the other divisions of the trigeminal column (Jacquin et al., 1986b, 1989a,b, 1990). In none of the above studies, however, were differences reported among cells located in the rostral and caudal regions of the SpVi.
After the finding that the SpVi gives rise to two ascending pathways of vibrissal information, we undertook an exhaustive characterization of receptive field properties in this nucleus by means of controlled deflection of each of the vibrissae that compose the receptive field of a cell. Our results revealed an anisotropic organization of receptive fields with regard to topography, response magnitude, and the degree of angular tuning, but a high consistency of directional preference with a clear upward tuning bias for SpVir projection cells.
Materials and Methods
These experiments were conducted in accordance with federally prescribed animal care and use guidelines. The University Committee for Animal Use in Research approved all experimental protocols.
Electrophysiology.
Experiments were performed on 25 male and 3 female rats (250–300 g; Charles River, St-Constant, Quebec, Canada). Rats were anesthetized with pentobarbital (50 mg/kg) supplemented by a small amount of xylazine (1 mg/kg). Throughout the experiment, the animal breathed freely, and body temperature was maintained at 37°C with a heating pad controlled thermostatically. The left facial nerve was cut, and the rat was placed in a stereotaxic apparatus. Before the start of recordings, the nape of the neck was infiltrated with a long-lasting local anesthetic (Marcaine, 1%) to reduce animal discomfort. During the recording sessions, animals frequently displayed spontaneous twitches of the right vibrissae and reacted to a moderate pinch of the hindlimb but otherwise remained motionless, indicating that they did not experience any discomfort. An additional dose of anesthetic (ketamine, 20 mg/kg) was given when small-amplitude whisking movements were noticed.
Single units were recorded extracellularly with micropipettes (0.5–1 μm) filled with a solution of potassium acetate (0.5 m) and 2% Neurobiotin (Vector Laboratories, Burlingame, CA). Signals were amplified, bandpass filtered (100 Hz–3 kHz), and sampled at 10 kHz. To clearly distinguish between cell populations in the magnocellular and parvocellular divisions of the SpVi, in separate experiments all recordings were performed along closely spaced tracts (50 μm apart) in either the rostral (11.8–12.2 mm behind the bregma) or caudal part (12.8–13.3 mm behind the bregma) of the nucleus. The intermediate zone was avoided, because uncertainty remained about the precise location of the border between both divisions in cytochrome oxidase-stained horizontal sections of the brainstem. In each experiment, cell location was assessed by the juxtacellular labeling of at least one unit (Pinault, 1996). Some primary vibrissa afferents were also recorded and labeled intra-axonally. At the end of the experiments, rats were perfused under deep anesthesia with saline, followed by a fixative containing 4% paraformaldehyde in phosphate buffer (0.1 m), pH 7.4. Brains were postfixed for 2 h, cryoprotected in 30% sucrose, and cut horizontally at 70 μm on a freezing microtome. Sections were processed for cytochrome oxidase and Neurobiotin histochemistry according to standard protocols that have been described in detail previously (Veinante et al., 2000). Photomicrographs were taken with a Spot RT camera (Diagnostic Instruments Sterling Heights, MI) and imported in Photoshop 7.0 (Adobe Systems, San Jose, CA) for contrast and brightness adjustments.
Vibrissa stimulation and data analysis.
Vibrissae were cut at 5 mm from the skin, and we assessed the receptive field size of single units by deflecting individual vibrissae with a hand-held probe under a dissecting microscope. An audio monitor and a computer display were used to monitor the responses. The tip of the vibrissa was then inserted into the groove of a beveled straw attached to a ceramic bimorph bender (Physik Instrumente, Karlsruhe, Germany). The vibrissa was pushed in a given direction at stimulus onset but returned passively at a neutral position at stimulus offset. Care was taken to align the axis of the stimulator with that of the hair shaft. Ramp-and-hold waveforms (rise/fall times, 5 ms; total duration, 50 ms; amplitude, 0.4 mm, or ∼ 5°; angular velocity, ∼ 1000°/s; interstimulus interval, 1.2 s) were used to deflect vibrissae from their resting position in four directions spanning 360° (e.g., in 90° increments relative to the horizontal alignment of the vibrissa rows). As measured with a photodiode, resonance frequency was 180 Hz (amplitude ∼ 5% of peak displacement; i.e., ∼ 20 μm for the first period). Stimuli were repeated 20 times, the probe was rotated by 90°, and the sequence was repeated. This procedure was applied to each of the vibrissae that composed the receptive field of a cell. For ∼20% of the vibrissae, especially those situated at the edge of the receptive field, the threshold for eliciting responses required deflection amplitude (velocity) that exceeded the performance of the stimulator.
Spike events were collected in peristimulus time histograms (PSTHs) of 20 responses with a 0.2 ms bin width. For each deflection angle, the number of spikes evoked within a time window of 10 ms after stimulus onset was used to build polar plots of angular preference. This narrow time window served to exclude the potential contribution of polysynaptic inputs (cortical or intersubnuclear) to sensory-evoked responses, yet relative response magnitudes computed within this narrow time window correlated highly with those computed with a 20 ms time window (mean, r = 0.91), and yielded results of similar statistical significance. We did not subtract spontaneous activity when reporting response magnitudes because background activity was always very low (<1 Hz), and it was not clear that the number of spikes within a response window could be described accurately as the linear sum of stimulus-evoked and background activities. We did not examine off responses in this study.
The latency of response onsets was estimated as the bin corresponding to 0.5 of peak value of the PSTH after three bin smoothings with a boxcar kernel [for the rationale of this method, see Discussion in (Sosnik et al. 2001)]. Data were analyzed with Neuroexplorer (Plexon, Dallas, TX) and Excel (Microsoft, Redmond, WA) software. Unless stated otherwise, results are reported as mean ± SD.
In situ hybridization for glutamate decarboxylase 67. Three male rats (250–300 g; Harlan Sprague Dawley) were used for in situ hybridization of glutamate decarboxylase 67 (GAD67). They were deeply anesthetized by intraperitoneal injection of chloral hydrate (35 mg/100 g body weight), and perfused transcardially with 200 ml of 5 mm PBS, pH 7.4, followed by 300 ml of 4% formaldehyde in 0.1 m phosphate buffer, pH 7.4. After fixation, brainstems were cryoprotected in 30% sucrose in PBS, and horizontal sections were cut at 20 μm on a freezing microtome.
A complementary DNA fragment corresponding to a region of the GAD67 cDNA (nucleotides 276–894; GenBank accession number NM_008077) was cloned into vector pBluescript II SK(+) (Stratagene, La Jolla, CA). With the linearized plasmid as template, sense and antisense single-strand RNA probes were synthesized with a digoxigenin labeling kit (Roche Diagnostics, Basel, Switzerland). The procedure for nonradioactive in situ hybridization has been described elsewhere (Liang et al., 2000). Briefly, free-floating sections (one of every six sections) were washed in PBS for 5 min and then acetylated in freshly prepared 0.25% (v/v) acetic anhydride in 0.1 m triethanolamine for 10 min by vigorous shaking. After a rinse with 30 mm NaCl and 30 mm sodium citrate (2× SSC), sections were hybridized with 1.0 μg/ml digoxigenin-labeled sense or antisense RNA probes for GAD67 in a mixture of 50% (v/v) formamide, 5× SSC, 2% blocking reagent (Roche Diagnostics), 0.1% N-lauroylsarcosine (NLS), and 0.1% SDS for 20 h at 70°C. After washing twice in 50% formamide, 2× SSC, and 0.1% NLS for 20 min at 60°C, the sections were incubated with 20 μg/ml RNase A for 30 min at 37°C, washed twice for 20 min at 37°C in 2× SSC and 0.1% NLS, and then in 0.2× SSC and 0.1% NLS. Subsequently, the sections were incubated with 1:1000-diluted alkaline phosphatase (AP)-conjugated sheep anti-digoxigenin antibody Fab fragment (Roche Diagnostics) and developed by AP reaction with nitroblue tetrazolium/5-bromo-4-chloro-3-indolylphosphate labeling. Hybridization with the sense probe did not produce any signals. Alternate sections were stained with cresyl violet and cytochrome oxidase histochemistry. Horizontal sections midway through the dorsoventral extent of the SpVi were used for counting GAD67-positive neurons. Starting at the obex, the SpVi was divided into sectors of equal length (200 μm), and the density of GAD67-positive neurons per sector was computed.
Results
Anatomical evidence for a rostrocaudal partition of the SpVi
The SpVi is intercalated between the oralis and caudalis subnuclei of the brainstem trigeminal complex. In cytochrome oxidase-stained horizontal sections of the brainstem, the caudal boundary of SpVi is marked at the periobex region of the medulla by a sharp transition between the relatively unstained caudalis subnucleus and the intensely stained SpVi neuropil. Rostrally, however, no staining difference indicates the transition with the oralis subnucleus. We thus compared our sections with those of the atlas by (Paxinos and Watson 1998) to situate the rostral border of the SpVi 0.4 mm behind the caudal edge of the cochlear nucleus. So defined, the SpVi extends for ∼2.3 mm, between the frontal planes 11.7 and 14.0 behind the bregma.
When one examines cytochrome oxidase-stained coronal sections of the brainstem, the SpVir resembles the oralis subnucleus, in that it displays uniform staining, whereas the SpVic contains darkly stained patches that are patterned like the vibrissae on the mystacial pad (i.e., the barrelettes) (Ma and Woolsey, 1984) (Fig. 1A–C). A rostrocaudal partition of the nucleus is further indicated by in situ hybridization of the GAD67 mRNA, which revealed a much lower density of GAD67-expressing cells in the SpVir (Fig. 1D). Figure 1E (bar graph) shows the distribution of mean densities of GABAergic neurons binned at 200 μm intervals from the obex. The histogram combines counts in nine horizontal sections passing through the ventral half of the SpVi (three sections of 20 μm at 120 μm interval in three rats). Bin-by-bin comparison indicates that a significant drop in cell density (t test; p < 0.01) occurs ∼1.4 mm rostrally to the obex: the number of GAD67-expressing cells passes from >400 cells per square millimeter in the SpVic to ∼200 cells per square millimeter in the SpVir. This differential distribution of small-sized GABAergic cells likely underlies the cytoarchitectonic partition of the nucleus introduced by 1991), who divided the ventral, vibrissa-recipient territory of the nucleus into a rostral magnocellular region and a caudal parvocellular region. As shown below (Direction preference), these anatomical differences correspond to functionally distinct regions of the SpVi.
Figure 1.

Histochemical differences between the rostral and caudal regions of the SpVi. A, In cytochrome oxidase-stained horizontal sections of the brainstem, the SpVi displays uniform staining. In coronal sections, however, the caudal region distinguishes itself by the presence of darkly stained patches (the barrelettes, indicated by asterisks), which are absent from the rostral part of the nucleus (compare B, C). D, A rostrocaudal partition of the SpVi is also revealed by in situ hybridization for the GAD67 mRNA (horizontal section). E, The density of GAD-expressing cells along the rostrocaudal axis of the nucleus shows a significant drop ∼1.4 mm rostrally to the obex. SpVc, Caudalis subnucleus; SpVo, oralis subnucleus; trV, trigeminal tract; VCN, ventral cochlear nucleus.
Electrophysiological database
The borders between trigeminal nuclei are oriented obliquely with respect to the coronal plane, which makes the cross sections of neighboring nuclei coexist in the same histological sections for a variable rostrocaudal distance. Because the location of the transition zone between the rostral or caudal sectors of the SpVi displays a similar shift (as evidenced by the presence of barrelettes) in cytochrome oxidase-stained coronal sections, and to avoid ambiguous results as to cell location, recordings were performed at least 200 μm in front, or behind an estimated transition zone located at the frontal plane 12.5 mm behind the bregma.
Our database comprises 149 cells for which response magnitudes were assessed by controlled deflection of 585 vibrissae. On the basis of single-cell labeling (n = 27 neurons) and extracellular deposits of Neurobiotin (2 cases), 44% of these units (i.e., 65 cells) were located in the SpVir and 56% (i.e., 84 cells) were located in the SpVic (Fig. 2A). In accord with previous single-cell labeling studies (Jacquin et al., 1989a,b), all labeled cells that responded to multiple vibrissae were identified as projection cells, with an axon that entered into the ipsilateral inferior cerebellar peduncle or ran medially in the brainstem to join the contralateral medial lemniscus. Likewise, all labeled cells responding to a single vibrissa were identified as local circuit cells that projected locally and toward the principalis or the caudalis subnuclei. Because we labeled only 20% of the recorded cells, the possibility remains that some projection cells may respond to a single vibrissa and some local circuit cells may respond to multiple vibrissae; however, because of the close relationship found in previous studies between cell type and receptive field size (Woolston et al., 1982; Jacquin et al., 1989a,b), here we refer to multivibrissa and single-vibrissa responsive cells as projection and local circuit cells, respectively. The dendroarchitecture of projection and local circuit cells also conformed to the previous descriptions provided by Jacquinapos;s group (Jacquin et al., 1986b, 1989a,b, 1990): projection cells had large cell bodies (20–35 μm) and widespread dendritic arbors (Fig. 2B,C), whereas local circuit cells had small cell bodies (12–20 μm) with dendrites exhibiting a high degree of rostrocaudal streaming (Fig. 2D).
Figure 2.

Location and morphology of interpolaris cells that were juxtacellularly labeled in the course of electrophysiological experiments. A, Stars and open circles represent projection cells and local circuit neurons, respectively. Filled squares indicate the location of extracellular deposits of Neurobiotin. B–D, Photomicrographs show representative examples of thalamic-projecting (B), cerebellar-projecting (C), and local circuit neurons (D). Arrows indicating the orientations in B also apply to C and D. SpVc, Caudalis subnucleus; SpVo, oralis subnucleus; trV, trigeminal tract.
Projection cells
Size and topography of receptive fields
Eighty-six percent of the SpVir units responded to multiple vibrissae (average receptive field size, 9.53 ± 4.80 vibrissae; range, 2–22), and 14% were driven by a single vibrissa. In the SpVic, however, 50% of the units were monovibrissa responsive, whereas the other units were driven by 2–10 vibrissae (average receptive field size, 4.80 ± 3.30 vibrissae). The difference in receptive field size between rostral and caudal projection cells was statistically significant (t test; p < 0.001).
Regardless of the location of a cell in the nucleus, the receptive field of projection cells was asymmetric. It commonly included five to six vibrissae within a row, but rarely more than three vibrissae within an arc. To assess quantitatively this feature, we computed a receptive field symmetry index, estimated as the number of vibrissae within the longest row divided by that in the longest arc. Symmetry indices of 2.02 ± 0.78 and 1.87 ± 0.58 were obtained for rostral and caudal cells, respectively, confirming that the receptive field of projection cells contains, on average, twice as many vibrissae within a row than within an arc.
When the receptive field size of projection cells was assessed by manual deflection, one or two vibrissae were clearly more sensitive than others. Controlled deflection always revealed a gradient of response magnitude, with one of the vibrissae eliciting the largest responses. The PSTHs in Figure 3A show the total number of spikes (sum of all directions) elicited in a projection cell by each of the four vibrissae tested in the “E” row. As deflection involved vibrissae remote from the dominant vibrissa (vibrissa E1 in this case), response magnitude decreased and onset latency increased. The three-dimensional bar graphs (Fig. 3B) provide representative ensemble views of the distribution of normalized response magnitude across the receptive field of two SpVi units. For the whole population of projection cells, a significant difference in response magnitude was found between the dominant vibrissa and immediately adjacent vibrissae (Fig. 3C) (note: in the center of the pad, each vibrissa is surrounded by eight adjacent vibrissae). Furthermore, a significant difference was also found between the adjacent vibrissae and those situated one vibrissa away on the mystacial pad.
Figure 3.

Gradient of response magnitude within the receptive field of projection cells. A, PSTHs show the total number of spikes (sum of all directions) evoked in a projection cell by deflection of each of the vibrissae tested in the E row. B, Three-dimensional bar graphs of normalized response magnitudes within the receptive field of two projection cells. For each vibrissa, response magnitudes were summed across all directions. Bars with zero magnitude (D6 and E6 in the top graph, for example) indicate vibrissae of a threshold too high to be tested with the piezo stimulator. C, Histogram shows how response magnitude, as measured in B, diminishes as distance from the dominant vibrissa increases. Error bars indicate 1 SD. D, Relationship between magnitude and onset latency of vibrissa-evoked responses in three projection cells. Dots, open circles, and stars are values obtained for three different cells.
Because the decrease in response magnitude was usually associated with an increase in latency, we examined how strongly these two parameters were correlated (Fig. 3D). Among the whole population of projection cells, both parameters were strongly correlated (mean, r = −0.84 ± 0.15), confirming that the largest responses were generally those that occurred at the shortest latency. As estimated at 50% of the first peak in PSTHs, the largest responses occurred, on average, 3.95 ± 0.79 and 4.58 ± 1.62 ms after stimulus onset in SpVir and SpVic cells, respectively. This difference was statistically significant (p = 0.0231; unpaired t test).
Angular tuning
Previous studies have shown that primary afferents possess a high degree of sensitivity to the direction of vibrissa deflection (Zucker and Welker, 1969; Lichtenstein et al., 1990; Minnery and Simons, 2003). We thus explored the extent to which SpVi responses reflect the directional tuning of primary afferent inputs. Figure 4A shows normalized polar plots comparing the directional tuning of on responses elicited by 8 of the 11 vibrissae that composed the receptive field of an SpVir cell. Visual inspection makes it clear that all responses, except those to vibrissa B2, were strongly tuned, with a clear preference for upward deflection. For each vibrissa, a direction-selectivity index, D, was calculated as a measure of the directional tuning (Taylor and Vaney, 2002). D was defined as D = Σvi/Σri, where Vi are vector magnitudes pointing in the direction of the stimulus and having length, ri, equal to the number of spikes recorded during that stimulus. D can range from 0, when the responses are equal in all stimulus directions, to 1, when a response is obtained only for a single stimulus direction. Thus, values for D approaching 1 indicate asymmetric responses over a small range of angles and therefore sharper directional tuning. Direction-selectivity indices for the responses shown in Figure 4A ranged from 0.03 (no tuning; vibrissa B2) to 0.88 (sharp tuning; vibrissa D2). Within the receptive field of most projection cells, D values were similarly dispersed, with mean value of 0.49 ± 0.29 in the SpVir (n = 339 vibrissae) and 0.47 ± 0.34 in the SpVic (n = 168 vibrissae). This difference was not statistically significant.
Figure 4.

Angular tuning of vibrissal responses in the SpVi. A, Polar plots show normalized response magnitudes evoked by 8 of the 11 vibrissae that composed the receptive field of an SpVir cell. The vector sum of each plot is depicted in the bottom, right-hand polar graph. B, The vector sum of individual polar plots is superimposed on the receptive field map of six multiwhisker-responsive projection cells. C, Mean normalized responses in all directions of SpVir (n = 341 vibrissae) and SpVic cells (n = 169 vibrissae). By computing the vector sum of all vibrissa-associated vectors within the receptive field of a cell, a grand vector was obtained that represents the ensemble direction tuning of that cell. D, Distributions of grand vectors of angular preference for SpVir and SpVic projection cells.
Direction preference
The multivibrissa structure of receptive fields in the SpVi raises the issue of the consistency of angular tuning preference; that is, whether the direction of motion that elicits the largest response is the same for all the vibrissae in the receptive field of each cell. To address this question, we first built polar plots that were normalized with respect to the largest response evoked by the most effective vibrissa (Fig. 4A). We then computed the vector sum of individual polar plots and superimposed the resulting vectors on the receptive field map of each cell (Fig. 4B). Finally, by computing the vector sum of all vibrissa-associated vectors within the receptive field of a cell, a grand vector was obtained that represented the ensemble direction tuning of that cell. The consistency of direction preference was estimated by computing the absolute value of the difference in angle between each of the vibrissa-associated vectors and the grand vector. For the SpVir and SpVic projection cells, median values of angular difference were 26° and 23°, respectively, with ∼75% of the vibrissae included in the range of 0–50°.
The most unexpected finding that resulted from our analysis of angular tuning was the striking difference in angular tuning preference among projection cells in the caudal and rostral poles of the SpVi. This difference is already noticeable in the receptive field maps of Figure 4B, where all vibrissa-associated vectors within the receptive field of SpVir cells point upward, whereas those within the receptive field of SpVic neurons point upward or downward. The mean normalized responses in all directions exhibit a clear upward preference for SpVir cells (Fig. 4C), and the polar distribution of grand vectors makes this result even more patent (Fig. 4D). In caudal SpVi, grand vectors point in all directions, showing that, at a population level, all direction preferences are equally represented. In rostral SpVi, however, virtually all grand vectors point upward, revealing a clear preference for this direction.
We next examined whether the angular tuning bias, as revealed by the distribution of grand vectors, was representative of the responses elicited by vibrissae pertaining to different rows. When vector responses were sorted by row (Fig. 5), the response of SpVir cells exhibited a significant preference for the upward quadrants in all rows (0.05 > p > 0.02 for row A, and p < 0.0001 for the other rows; χ2 test). In contrast, vector response distributions for SpVic cells did not significantly differ from a 50–50 division between the upper and lower quadrants (p > 0.2 for all rows).
Figure 5.
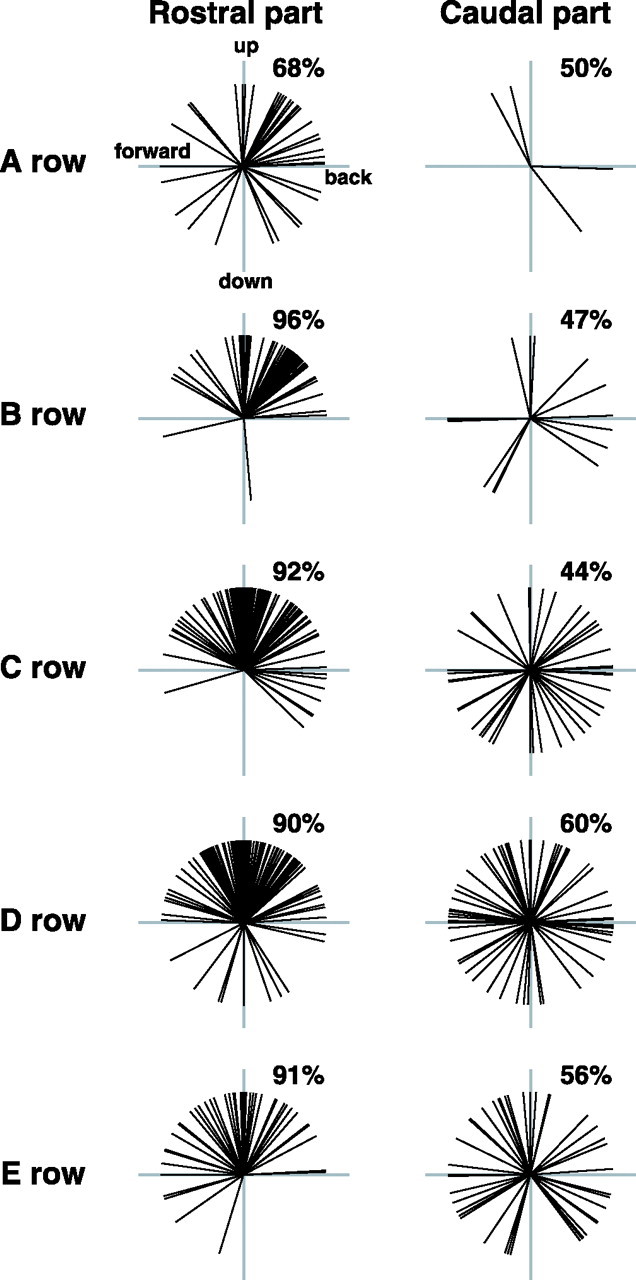
Angular tuning of the responses evoked by vibrissae pertaining to different rows. Vector responses were computed as described in Figure 4A. Percentages above each plot indicate the proportion of vectors in the top quadrants. For cells in the rostral part of the SpVi, but not those in the caudal part, all vector response distributions significantly differ from a 50–50 division between the top and bottom quadrants (0.05 > p > 0.02 for row A, and p < 0.0001 for the other rows; χ2 test).
Direction preference bias: a role for primary vibrissa afferents?
As an explanation for the angular tuning bias of SpVir cells, we examined the possibility of a preferential projection of upwardly tuned primary vibrissa afferents in the rostral pole of the nucleus. Ten primary afferent fibers were recorded in the trigeminal tract, next to the SpVi. Their directional sensitivity was assessed, and they were labeled intra-axonally with Neurobiotin. Figure 6A shows the rostrocaudal distribution of the terminal fields of two fibers: one that responded to vibrissa D5, and best responded to backward and downward deflections, and the other one that responded to vibrissa E3 and was tuned upward (Fig. 6A, polar plots). As reported previously, primary vibrissa afferents gave off several, rostrocaudally aligned clusters of terminals in the SpVi (Hayashi, 1980; Jacquin et al., 1986a). In the caudal part of the nucleus, clusters issuing from both fibers were well separated and aligned in a barrelette-like manner, whereas they tended to overlap in the rostral part of the nucleus. To assess quantitatively whether there were direction-related regional differences in the density of innervation, we counted the number of boutons given off along the rostrocaudal axis of the nucleus by three upwardly and three downwardly tuned axons. Figure 6B (horizontal bar graph) shows the grouped distribution of terminal counts binned at 400 μm intervals starting at the obex. Although both groups of fibers gave off many more boutons in the SpVic, no significant difference was found in their respective contribution to the innervation of the SpVir. Therefore, the upward tuning bias of SpVir projection cells can hardly be attributable to a differential projection of primary vibrissa afferents, which suggests that this bias may rely on synaptic efficacy (size of EPSPs) or on a direction-selective recruitment of feedforward inhibition.
Figure 6.

Distribution of primary afferent terminals in the SpVi. A, The two reconstructed fibers gave off several clusters of terminals along the rostrocaudal extent of the nucleus. The E3-responsive unit best responded to upward vibrissa displacement, whereas the other unit was best driven by backward and downward deflections of vibrissa D5 (A, polar plots). B, The horizontal bar graph shows the grouped distribution of terminal counts of six fibers that were tuned upward (n = 3) or downward (n = 3). Counts are binned at 400 μm intervals starting at the obex. SpVo, Oralis subnucleus; trV, trigeminal tract.
Local circuit cells
All single-vibrissa responsive units that were labeled with Neurobiotin (9 of 27 cells) belonged to the category of local circuit cells (Jacquin et al., 1989a). These units responded robustly to the best direction of deflection, often with a burst of four to five action potentials emitted at intervals of 1.0–1.5 ms (Fig. 7A, PSTHs). Regardless of their location in the SpVi, local circuit neurons exhibited a wide range of angular tuning index. Although 27% of these units were null responsive to at least one direction, most of them were broadly tuned (D values <0.3) (Fig. 7B). We currently ignore how many of these cells have an inhibitory function, but in situ hybridization and immunocytochemical staining suggest that GABAergic and glycinergic cells represent a sizeable proportion of these neurons (Fig. 1) (Haring et al., 1990; Avendano et al., 2005; Zeilhofer et al., 2005).
Figure 7.

Response of local circuit SpVi cells to vibrissa deflection. A, PSTHs illustrating robust burst responses of a local circuit cell to deflection of vibrissa D3 (intraburst frequency, ∼700 Hz). B, Distribution of direction selectivity indices (D) of vibrissal responses in 50 local circuit cells. C, Histogram compares the onset latency of all vibrissa-evoked responses (all directions) in local circuit cells (n = 153 PSTHs) and in projection cells (n = 1612 PSTHs). D, Histogram shows the distribution of the shortest latencies of vibrissal responses evoked in individual cells (50 local circuit cells and 86 projection cells). E, The projection cell was barely responsive to the downward motion of vibrissa C2, but the PSTH built during current injection exhibited a prominent peak of excitation followed by a period of spike suppression. In other projection cells, the application of juxtacellular current enhanced ON responses, but no inhibition was noticed (F). G, Angular tuning of vibrissal responses in 8 SpVir and 42 SpVic local circuit cells; no significant bias in angular preference was found (χ2 test).
If feedforward inhibition contributes to the angular tuning of projection cells, one would expect local circuit cells to be among the first to respond to vibrissa deflection. The comparative distribution of the onset latency of all responses evoked in both groups of cells (0.5 of the first peak in individual PSTHs) revealed that local circuit cells were activated, on average, 2.08 ms before projection cells (4.48 ± 1.53 vs 6.56 ± 2.83 ms; p < 0.001) (Fig. 7C). More importantly, however, a significant difference remained when only the shortest latency responses evoked in individual cells were taken into account (3.79 ± 1.08 vs 4.24 ± 1.28 ms; p < 0.05) (Fig. 7D), suggesting that local circuit cells may indeed contribute to the angular tuning of projection neurons.
More direct evidence for a role of feedforward inhibition in determining response magnitude was obtained when vibrissa displacement that produced little or no response in SpVir or SpVic projection cells was tested against background discharges induced by juxtacellular current injection. The presence of a statistically significant inhibitory response was assessed by comparing the firing rate within a 20 ms time window after stimulus onset (this time window was offset by 10 ms to exclude ON responses) with the prestimulus firing rate estimated over a 100 ms period (α = 0.025; one-tailed t test). Under control conditions, the unit shown in Figure 7E was barely responsive to the downward motion of vibrissa C2, but the PSTH built during current injection exhibited a prominent peak of excitation followed by a silent period, revealing that the cell received vibrissal input and that feedforward inhibition likely prevented this input from reaching spike threshold. A similar test was performed with 21 vibrissae in 18 cells; in 48% of the cases, a significant suppression of background discharges was observed. In the remaining cases, ON responses were enhanced, but no significant suppression was noticed with respect to prestimulus levels (Fig. 7F). Failure to detect spike suppression, however, does not mean an absence of feedforward inhibition. Given the extensive dendritic arbors of projection cells, negative results are likely attributable to the remote location of inhibitory synapses.
Eight of the 50 local circuit cells studied were located in the SpVir, but together these cells did not demonstrate any angular tuning bias (Fig. 7G), nor did they respond at shorter latency to downward vibrissa motion. Thus, although local circuit cells may contribute to sharpen the angular tuning of projection cells, the timing of their responses did not exhibit a downward-selective latency bias that could account for the upward tuning bias found in the SpVir.
Discussion
The present study complements those initiated by Jacquinapos;s group (Jacquin et al., 1986b, 1989a,b, 1990) by providing a detailed quantitative assessment of receptive field properties in the SpVi. Our results revealed an anisotropic organization of receptive fields with regard to topography, response magnitude, and the degree of angular tuning, but a high consistency of directional preference, with a clear upward preference bias for projection cells located in the SpVir.
Evidence for heterogeneity of SpVi projection cells was first obtained in retrograde labeling studies that revealed the existence of distinct, intermingled populations of thalamic and cerebellar-projecting cells (Jacquin et al., 1990; Phelan and Falls, 1991; Bennett-Clarke et al., 1992). It was later shown that SpVi–thalamic projections arise from two populations of neurons: large-sized cells that project to the Po and reside in the rostral, magnocellular division of the nucleus, and cells of smaller size that project to the VPMvl and occupy the caudal, parvocellular division of the nucleus (Pierret et al., 2000; Veinante et al., 2000). The present study adds to this distinction by showing that, as in the hamster (Jacquin et al., 1993), the SpVir does not display barrelettes, whereas the SpVic does, and that it contains a much lower density of GABAergic neurons. Projection cells in both divisions of the nucleus also differ with respect to the size of receptive fields and the angular tuning preference of their responses. Together, these data indicate that the SpVi, as outlined in most stereotaxic atlases, is actually composed of two anatomically and physiologically distinct subnuclei, each of which contains cells that integrate signals from multiple vibrissae and convey to the thalamus different types of messages pertaining to touch or vibrissa motion (Yu et al., 2006).
Regardless of the aforementioned differences, the receptive field structure throughout the nucleus demonstrates a marked prevalence of rows over arcs of vibrissa representation, so that the long axis of receptive fields has the same orientation as that of vibrissa trajectories during whisking. For any single vibrissa, it is possible to delineate a two-dimensional sensory field (i.e., the portion of the ratapos;s total whisking space that is scanned by the movements of that vibrissa) in which the anteroposterior component predominates (Bermejo et al., 2002). Thus, synchronized movement of a subset of vibrissae within a row generates a set of overlapping somatosensory fields that are isomorphic to the topography of receptive fields of SpVi projection cells. Together with the patterns of synaptic connections in the paralemniscal pathways, this is another piece of evidence that the SpVi is involved primarily in processing information in relation to active vibrissa motion (Veinante et al., 2000; Lavallée et al. 2005). In this context, it is worth noting that thalamic projecting cells represent a small proportion of the neuronal population in the SpVi, especially in the SpVic, which contains a much larger population of intersubnuclear projecting local circuit cells (Jacquin et al., 1990). Many of these cells likely exert an inhibitory function, as suggested by the high density of GAD-expressing cells in this subnucleus. Thus, because the SpVi [but not the principal trigeminal nucleus (PrV)] exhibits a marked deoxyglucose uptake during whisking (Sharp and Evans, 1982; Jacquin et al., 1993), GABAergic intersubnuclear projecting cells stand as potential candidates for gating the sensory stream associated with self-generated vibrissa motion in the PrV (Curtis and Kleinfeld, 2006).
Receptive field synthesis
Although the SpVi circuitry remains poorly understood, available anatomical data agree on the following points: the central terminals of vibrissa primary afferent neurons are spatially ordered in the SpVi in a highly organized manner such that a point-to-point map represents the vibrissa array (Hayashi, 1980; Jacquin et al., 1986a); the location, size, and shape of the receptive fields of trigeminal neurons depend, at least in part, on cell body location and on the spread of dendrites within the map of terminals (Jacquin et al., 1989b). Figure 8 sketches this arrangement as a framework for the present discussion. This schematic diagram makes it explicit that the receptive field size of projection and local circuit cells can be accounted for by the transverse extent of their dendrites in vibrissa-specific terminal arrays. This scheme also applies to the SpVir, although intervibrissa topography is less precise. Assuming passive dendritic conduction, one can predict that the magnitude of the responses evoked by each of the vibrissae should diminish, and their latency should increase, as inputs impact more distally on the dendrites. The size of the EPSPs at the soma should also decrease in proportion to the diminution of the dendritic surface area available to establish synaptic contacts in each vibrissa-specific terminal domain.
Figure 8.

Schematic diagram of neuronal organization in the SpVi. Compartments labeled D1–D6 represent the rostrocaudal arrangement of the orderly arrays of primary afferent terminals associated with the corresponding vibrissae in the D row. Individual primary afferents (blue) distribute several clusters of terminals within a compartment. The projection cell (black) has a receptive field that comprises all vibrissae in the D row, whereas the local circuit neuron (red) responds solely to vibrissa D5. See Discussion for a functional appraisal of this arrangement.
It should be pointed out that the dendritic field of local circuit cells is restricted to a single array of terminals, hence their monovibrissa receptive field. Given their small size and presumed higher input resistance, these cells respond vigorously at short latency when the corresponding vibrissa is deflected. This is why, as a population, local circuit neurons respond at shorter latency than projection cells. The axon of local circuit cells generates an array of terminals that lies parallel to, or in register with, those of primary afferents (Jacquin et al., 1989a), enabling feedforward inhibition to act locally to depress EPSPs in the dendrites of projection cells. Together, these factors provide a reasonable explanation for the gradients of response magnitude and onset latency observed in projection cells. They are also consistent with the observation that the receptive field size of projection cells depends strongly on a muscarinic modulation that produces a twofold increase in input resistance, so that scopolamine administration in vivo results in a marked shrinkage of receptive field size (Timofeeva et al., 2005); however, these factors alone do not explain why response magnitude depends on the direction of vibrissa displacement.
The angular tuning of vibrissal responses
One of the most salient features of primary vibrissal afferents is their sensitivity to the direction in which the vibrissae move. Directional sensitivity is also well conserved in principalis, VPM, and cortical neurons, indicating that this property plays a key role in the organization of the lemniscal pathway (Simons and Carvell, 1989; Minnery et al., 2003; Bruno et al., 2003; Timofeeva et al., 2003; Andermann and Moore, 2006). Here, we showed that angular tuning is also a fundamental feature of the paralemniscal pathways. In the VPM and barrel cortex, there is evidence for a systematic map of direction preference (Bruno et al., 2003; Timofeeva et al., 2003; Andermann and Moore, 2006), but currently there is no evidence that vibrissa direction preference is organized in a systematic anatomical map in the brainstem. The fact that sharply tuned primary afferents give off multiple clusters of terminals in the SpVi indicates clearly that, if such a map exists, it is not coextensive with the longitudinal axis of the barrelettes. Therefore, the angular tuning of SpVi cells unlikely relates to the way that they distribute dendrites in the barrelettes; however, our results show that fast feedforward inhibition can significantly depress response magnitude and therefore contribute to angular tuning. In 48% of the cases tested with juxtacellular current injection, significant spike suppression was observed when the vibrissa was deflected in a direction to which the cell was poorly or not responsive under control conditions. This is a remarkable result, considering that remote and presynaptic inhibition remains undetectable under this experimental approach.
Interpolaris projection cells demonstrate a remarkable consistency of direction preference for responses elicited by all vibrissae within their receptive field. Just as remarkable and intriguing is the upward tuning bias observed in the SpVir. We know of no structural or connectional feature that could explain these results. It is therefore possible that these properties emerge from use-dependent synaptic processes that occur early during development.
Monitoring of whisking in head-fixed animals and high-speed videographic analysis of whisking in freely moving rats revealed that, during exploratory behavior, vibrissae move in a concerted manner, describing an ellipsoid trajectory in head-centered coordinates (Bermejo et al., 2002; Prescott et al., 2005). Because in freely whisking rats vibrissa motion superimposes on a tilted head position, the nose pointing toward the ground, vibrissae actually move forward and downward with respect to the ground, much like the stick of a blind man exploring the environment (Prescott et al., 2005). Thus, the upward bias in angular preference might relate to the fact that vibrissae are most often co-deflected upward when they strike the ground or an object. Correlated inputs would mutually strengthen their synaptic efficacy, which could lead to an upward tuning bias.
Current concepts of how activity shapes the development of neural circuits are based on a model in which axons compete against one another to establish synaptic contacts onto target neurons (Shatz, 1990). In this model, initially diffuse patterns of connectivity are refined by a process in which simultaneously active inputs strengthen their connections onto common postsynaptic neurons at the expense of inputs that are weakly or non-synchronously active. According to this scheme, altering the correlational structure of neuronal activity within the vibrissal pathway should disrupt the consistency of angular preference in the receptive field of SpVi neurons.
Footnotes
This work was supported by a grant from the Canadian Institute of Health Research to M.D. and Grants 18019017 and 18700342 from the Kyoto University Foundation of Furtherance of Research and Education and from the Ministry of Education, Science, Sports, and Culture of Japan to T.F. We thank Dr. Paul de Koninck for helpful comments on a previous version of this manuscript.
References
- Andermann ML, Moore CI. A somatotopic map of vibrissa motion direction within a barrel column. Nat Neurosci. 2006;9:543–551. doi: 10.1038/nn1671. [DOI] [PubMed] [Google Scholar]
- Avendano C, Machin R, Bermejo PE, Lagares A. Neuron numbers in the sensory trigeminal nuclei of the rat: a GABA- and glycine-immunocytochemical and stereological analysis. J Comp Neurol. 2005;493:538–553. doi: 10.1002/cne.20778. [DOI] [PubMed] [Google Scholar]
- Bennett-Clarke CA, Chiaia NL, Jacquin MF, Rhoades RW. Parvalbumin and calbindin immunocytochemistry reveal distinct cell groups and vibrissa-related patterns in the trigeminal brainstem complex of the adult rat. J Comp Neurol. 1992;320:328–338. doi: 10.1002/cne.903200305. [DOI] [PubMed] [Google Scholar]
- Bermejo R, Vyas A, Zeigler HP. Topography of rodent whisking: I. Two-dimensional monitoring of whisker movements. Somatosens Mot Res. 2002;19:341–346. doi: 10.1080/0899022021000037809. [DOI] [PubMed] [Google Scholar]
- Bruno RM, Khatri V, Land PW, Simons DJ. Thalamocortical angular tuning domains within individual barrels of rat somatosensory cortex. J Neurosci. 2003;23:9565–9574. doi: 10.1523/JNEUROSCI.23-29-09565.2003. [DOI] [PMC free article] [PubMed] [Google Scholar]
- Curtis JC, Kleinfeld D. Seeing what the mouse sees with its vibrissae: a matter of behavioral state. Neuron. 2006;50:524–526. doi: 10.1016/j.neuron.2006.05.004. [DOI] [PMC free article] [PubMed] [Google Scholar]
- Haring JH, Henderson TA, Jacquin MF. Principalis- or parabrachial-projecting spinal trigeminal neurons do not stain for GABA or GAD. Somatosens Mot Res. 1990;7:391–397. doi: 10.3109/08990229009144715. [DOI] [PubMed] [Google Scholar]
- Hayashi H. Distributions of vibrissae afferent fibers collaterals in the trigeminal nuclei as revealed by intra-axonal injection of horseradish peroxidase. Brain Res. 1980;183:442–446. doi: 10.1016/0006-8993(80)90478-3. [DOI] [PubMed] [Google Scholar]
- Jacquin MF, Woerner D, Szcepanik AM, Riecker V, Mooney RD, Rhoades RW. Structure-function relationships in rat brainstem subnucleus interpolaris: 1. Vibrissa primary afferents. J Comp Neurol. 1986a;243:266–279. doi: 10.1002/cne.902430209. [DOI] [PubMed] [Google Scholar]
- Jacquin MF, Mooney RD, Rhoades RW. Morphology, response properties, and collateral projections of trigeminothalamic neurons in brainstem subnucleus interpolaris of rat. Exp Brain Res. 1986b;61:457–468. doi: 10.1007/BF00237571. [DOI] [PubMed] [Google Scholar]
- Jacquin MF, Golden J, Rhoades RW. Structure-function relationships in rat brainstem subnucleus interpolaris: III Local circuit neurons. J Comp Neurol. 1989a;282:24–44. doi: 10.1002/cne.902820104. [DOI] [PubMed] [Google Scholar]
- Jacquin MF, Barcia M, Rhoades RW. Structure-function relationships in rat brainstem subnucleus interpolaris: IV Projection neurons. J Comp Neurol. 1989b;282:45–62. doi: 10.1002/cne.902820105. [DOI] [PubMed] [Google Scholar]
- Jacquin MF, Chiaia NL, Haring JH, Rhoades RW. Intersubnuclear connections within the rat trigeminal brainstem complex. Somatosens Mot Res. 1990;7:399–420. doi: 10.3109/08990229009144716. [DOI] [PubMed] [Google Scholar]
- Jacquin MF, McCasland JS, Henderson TA, Rhoades RW, Woolsey TA. 2-DG uptake patterns related to single vibrissae during exploratory behaviors in the hamster trigeminal system. J Comp Neurol. 1993;332:38–58. doi: 10.1002/cne.903320104. [DOI] [PubMed] [Google Scholar]
- Lavallée P, Urbain N, Dufresne C, Bokor H, Acsady L, Deschênes M. Feedforward inhibitory control of sensory information in higher-order thalamic nuclei. J Neurosci. 2005;25:7489–7498. doi: 10.1523/JNEUROSCI.2301-05.2005. [DOI] [PMC free article] [PubMed] [Google Scholar]
- Liang F, Hatanaka Y, Saito H, Yamamori T, Hashikawa T. Differential expression of gamma-aminobutyric acid type B receptor-1a and -1b mRNA variants in GABA and non-GABAergic neurons of the rat brain. J Comp Neurol. 2000;416:475–495. [PubMed] [Google Scholar]
- Lichtenstein SH, Carvell GE, Simons DJ. Responses of rat trigeminal ganglion neurons to movements of vibrissae in different directions. Somatosens Mot Res. 1990;7:47–65. doi: 10.3109/08990229009144697. [DOI] [PubMed] [Google Scholar]
- Ma PM, Woolsey TA. Cytoarchitectonic correlates of the vibrissae in the medullary trigeminal complex of the mouse. Brain Res. 1984;306:374–379. doi: 10.1016/0006-8993(84)90390-1. [DOI] [PubMed] [Google Scholar]
- Minnery BS, Simons DJ. Response properties of whisker-associated trigeminothalamic neurons in rat nucleus principalis. J Neurophysiol. 2003;89:40–56. doi: 10.1152/jn.00272.2002. [DOI] [PubMed] [Google Scholar]
- Minnery BS, Bruno RM, Simons DJ. Response transformation and receptive field synthesis in the lemniscal trigeminothalamic circuit. J Neurophysiol. 2003;89:40–56. doi: 10.1152/jn.00111.2003. [DOI] [PubMed] [Google Scholar]
- Paxinos G, Watson C. The rat brain in stereotaxic coordinates. Ed 3. Sydney: Academic; 1998. [DOI] [PubMed] [Google Scholar]
- Phelan KD, Falls WM. An analysis of the cyto- and myeloarchitectonic organization of trigeminal nucleus interpolaris in the rat. Somatosens Mot Res. 1989;6:333–366. doi: 10.3109/08990228909144681. [DOI] [PubMed] [Google Scholar]
- Phelan KD, Falls WM. A comparison of the distribution and morphology of thalamic, cerebellar and spinal projection neurons in rat trigeminal nucleus interpolaris. Neuroscience. 1991;40:477–496. doi: 10.1016/0306-4522(91)90136-c. [DOI] [PubMed] [Google Scholar]
- Pierret T, Lavallée P, Deschênes M. Parallel streams for the relay of vibrissal information through thalamic barreloids. J Neurosci. 2000;20:7455–7462. doi: 10.1523/JNEUROSCI.20-19-07455.2000. [DOI] [PMC free article] [PubMed] [Google Scholar]
- Pinault D. A novel single-cell staining procedure performed in vivo under electrophysiological control: morpho-functional features of juxtacellularly labeled thalamic cells and other central neurons with biocytin or neurobiotin. J Neurosci Methods. 1996;65:113–136. doi: 10.1016/0165-0270(95)00144-1. [DOI] [PubMed] [Google Scholar]
- Prescott TJ, Mitchinson B, Redgrave P, Melhuish C, Dean P. Three-dimensional reconstruction of whisking patterns in freely moving rats. Soc Neurosci Abstr. 2005;31:625–3. [Google Scholar]
- Sharp FR, Evans K. Regional (14C)2-deoxyglucose uptake during vibrissae movements evoked by rat motor cortex stimulation. J Comp Neurol. 1982;208:255–287. doi: 10.1002/cne.902080305. [DOI] [PubMed] [Google Scholar]
- Shatz CJ. Impulse activity and the patterning of connections during CNS development. Neuron. 1990;5:745–756. doi: 10.1016/0896-6273(90)90333-b. [DOI] [PubMed] [Google Scholar]
- Simons DJ, Carvell GE. Thalamocortical response transformation in the rat vibrissa/barrel system. J Neurophysiol. 1989;61:311–330. doi: 10.1152/jn.1989.61.2.311. [DOI] [PubMed] [Google Scholar]
- Sosnik R, Haidarliu S, Ahissar E. Temporal frequency of whisker movement: I Representations in brain stem and thalamus. J Neurophysiol. 2001;86:339–353. doi: 10.1152/jn.2001.86.1.339. [DOI] [PubMed] [Google Scholar]
- Taylor WR, Vaney DI. Diverse synaptic mechanisms generate direction selectivity in the rabbit retina. J Neurosci. 2002;22:7712–7720. doi: 10.1523/JNEUROSCI.22-17-07712.2002. [DOI] [PMC free article] [PubMed] [Google Scholar]
- Timofeeva E, Mérette C, Emond C, Lavallée P, Deschênes M. A map of angular tuning preference in thalamic barreloids. J Neurosci. 2003;23:10717–10723. doi: 10.1523/JNEUROSCI.23-33-10717.2003. [DOI] [PMC free article] [PubMed] [Google Scholar]
- Timofeeva E, Dufresne C, Sik A, Zhang ZW, Deschênes M. Cholinergic modulation of vibrissal receptive fields in trigeminal nuclei. J Neurosci. 2005;25:9135–9143. doi: 10.1523/JNEUROSCI.3073-05.2005. [DOI] [PMC free article] [PubMed] [Google Scholar]
- Veinante P, Deschênes M. Single- and multi-whisker channels in the ascending projections from the principal trigeminal nucleus in the rat. J Neurosci. 1999;19:5085–5095. doi: 10.1523/JNEUROSCI.19-12-05085.1999. [DOI] [PMC free article] [PubMed] [Google Scholar]
- Veinante P, Jacquin MF, Deschênes M. Thalamic projections from the whisker-sensitive regions of the spinal trigeminal complex in the rat. J Comp Neurol. 2000;420:233–243. doi: 10.1002/(sici)1096-9861(20000501)420:2<233::aid-cne6>3.0.co;2-t. [DOI] [PubMed] [Google Scholar]
- Williams MN, Zahm DS, Jacquin MF. Differential foci and synaptic organization of the principal and spinal trigeminal projections to the thalamus in the rat. Eur J Neurosci. 1994;6:429–453. doi: 10.1111/j.1460-9568.1994.tb00286.x. [DOI] [PubMed] [Google Scholar]
- Woolston DC, La Londe JR, Gibson JM. Comparison of response properties of cerebellar- and thalamic-projecting interpolaris neurons. J Neurophysiol. 1982;48:160–173. doi: 10.1152/jn.1982.48.1.160. [DOI] [PubMed] [Google Scholar]
- Yu C, Derdikman D, Haidarliu S, Ahissar E. Parallel thalamic pathways for whisking and touch signals in the rat. PLoS Biol. 2006;4:e124. doi: 10.1371/journal.pbio.0040124. [DOI] [PMC free article] [PubMed] [Google Scholar]
- Zeilhofer HU, Studler B, Arabadzisz D, Scheizer C, Ahmadi S, Layh B, Bosl MR, Fritschy JM. Glycinergic neurons expressing enhanced green fluorescent protein in bacterial artificial chromosome transgenic mice. J Comp Neurol. 2005;482:123–141. doi: 10.1002/cne.20349. [DOI] [PubMed] [Google Scholar]
- Zucker E, Welker WI. Coding of somatic sensory input by vibrissae in the ratapos;s trigeminal ganglion. Brain Res. 1969;12:138–156. doi: 10.1016/0006-8993(69)90061-4. [DOI] [PubMed] [Google Scholar]