

Abstract
Large individual differences characterize the changes induced by sleep deprivation on neurobehavioral functions and rhythmic brain activity. To investigate adenosinergic mechanisms in these differences, we studied the effects of prolonged waking and the adenosine receptor antagonist caffeine on sustained vigilant attention and regional electroencephalogram (EEG) power in the ranges of theta activity (6.25–8.25 Hz) in waking and the slow oscillation (<1 Hz) in sleep. Activity in these frequencies is functionally related to sleep deprivation. In 12 subjectively caffeine-sensitive and 10 -insensitive young men, psychomotor vigilance task (PVT) performance and EEG were assessed at 3 h intervals before, during, and after one night without sleep. After 11 and 23 h waking, subjects received 200 mg caffeine and placebo in double-blind, cross-over manner. In the placebo condition, sleep deprivation impaired PVT speed more in caffeine-sensitive than in caffeine-insensitive men. This difference was counteracted by caffeine. Theta power in waking increased more in a frontal EEG derivation than in a posterior derivation. Caffeine attenuated this power gradient in caffeine sensitive subjects. Sleep loss also differently affected the power distribution <1 Hz in non-rapid eye movement sleep between caffeine sensitive and insensitive subjects. Also, this difference was mirrored by the action of caffeine. The effects of sleep deprivation and caffeine on sustained attention and regional EEG power in waking and sleep were inversely related. These findings suggest that adenosinergic mechanisms contribute to individual differences in waking-induced impairment of neurobehavioral performance and functional aspects of EEG topography associated with sleep deprivation.
Keywords: attention, electroencephalogram, caffeine, human, frontal cortex, circadian
Introduction
Sleep deprivation affects subjective and objective alertness and performance on neurobehavioral tasks without clear relationships (Leproult et al., 2003; Van Dongen et al., 2003). The interindividual variation in sleep deprivation-induced performance decline is large and stable, and substantial when compared with sleep duration before an experiment (Leproult et al., 2003; Van Dongen et al., 2004). Such findings suggest that the magnitude of performance impairment from sleep loss could reflect trait-like individual vulnerability (Van Dongen et al., 2004). Whereas the neurobiological mechanisms underlying intraindividual and interindividual differences are unknown, local cerebral changes of adenosine might underlie performance decrements by sleep deprivation (Basheer et al., 2004).
A recent study identified three distinct dimensions of neurobehavioral vulnerability to sleep deprivation (Van Dongen et al., 2004): subjective sleepiness, fatigue and mood; cognitive processing capability such as working memory; and behavioral alertness as measured by sustained attention. The psychomotor vigilance task (PVT) is highly sensitive to wakefulness-induced impairments of sustained attention (Dorrian et al., 2005). PVT performance dose-dependently improves with previous sleep (Jewett et al., 1999), reflects the circadian facet of sleep-wake regulation (Graw et al., 2004; Wyatt et al., 2004), is sensitive to interindividual differences related to age, gender, and sleep-related disease (Sforza et al., 2004; Adam et al., 2006; Blatter et al., 2006), and is influenced by alertness stimulation in healthy adults (Phipps-Nelson et al., 2003; Czeisler et al., 2005).
Prolonged waking also affects the electrical activity of the brain (Borbély and Achermann, 2005). Electroencephalogram (EEG) activity in the theta (∼5–9 Hz) range increases during wakefulness (Cajochen et al., 1995; Lorenzo et al., 1995; Aeschbach et al., 1999; Dumont et al., 1999), and the rise rate correlates with the enhancement of δ (0.75–4.5 Hz) activity in the first non-rapid eye movement (non-REM) sleep episode of recovery sleep (Finelli et al., 2000). Both effects are larger over anterior than over posterior cortical areas (Finelli et al., 2000), indicating that theta activity in waking and δ activity in non-REM sleep are correlates of a sleep-wake dependent, homeostatic process of sleep regulation. Supporting a role of adenosine in sleep homeostasis, the adenosine receptor antagonist caffeine improved waking-related deterioration of PVT performance (Wyatt et al., 2004). Moreover, 2 × 200 mg caffeine intake during 40 h without sleep attenuated the EEG markers of sleep homeostasis across the wakefulness-sleep continuum (Landolt et al., 2004).
We hypothesized that adenosinergic mechanisms play a role for interindividual differences in neurobehavioral function during prolonged wakefulness, and that these differences are accompanied by distinct changes in EEG activity in waking and sleep. We investigated the combined effects of sleep deprivation and caffeine on PVT speed and the EEG in subjectively caffeine-sensitive and caffeine-insensitive men. Subjective differences in the psychostimulant effects of caffeine might reflect genetically determined differences in the adenosinergic system (Goldstein et al., 1965; Alsene et al., 2003). We thus predicted that subjects from both ends of the caffeine-sensitivity spectrum not only react differently to caffeine, but also show different sleep-deprivation induced changes in neurobehavioral function and the EEG.
Materials and Methods
Study participants.
The study protocol and all experimental procedures were approved by the local ethics committees for research on human subjects. An internet questionnaire about subjective caffeine sensitivity and sleep habits was distributed among 20,343 university students. A total of 4329 individuals (2308 men, 2021 women) responded, and 121 individuals were selected for studies of possible associations between caffeine sensitivity, genetic polymorphisms in the adenosinergic system, and individual differences in sleep–wake regulation (Rétey et al., 2005). Thirteen subjectively caffeine-sensitive and 10 subjectively caffeine-insensitive healthy men participated in this study on the effects of sleep deprivation and caffeine on PVT performance and EEG topography in wakefulness and sleep. The participants include those of a previous report (Landolt et al., 2004), in which all recruitment, pre-experimental, and experimental procedures are described in detail. All subjects consumed moderate amounts of caffeine on a regular basis. Individuals reporting nocturnal sleep disturbances after caffeine intake in the afternoon were classified as caffeine sensitive, individuals reporting no problems sleeping after caffeine in the afternoon were considered as caffeine insensitive. Existence of poor sleep efficiency and sleep disorders such as sleep apnea and nocturnal myoclonus was excluded by a screening night in the sleep laboratory. Because one caffeine-sensitive subject did not comply with task instructions and protocol requirements, his data were excluded from all analyses. The demographic characteristics of the other subjects are summarized in Table 1.
Table 1.
Demographic characteristics of caffeine-sensitive and -insensitive men
| Sensitive (n = 12) | Insensitive (n = 10) | p value | |
|---|---|---|---|
| Age (years) | 24.1 ± 0.9 | 25.5 ± 0.7 | 0.26 |
| Body-mass index (kg/m2) | 22.6 ± 0.4 | 23.6 ± 0.8 | 0.26 |
| Epworth sleepiness score | 7.5 ± 1.0 | 6.5 ± 0.9 | 0.48 |
| Habitual sleep duration (h) | 7.4 ± 0.2 | 7.3 ± 0.2 | 0.63 |
| Habitual alcohol consumption (drinks/week) | 2.5 ± 0.5 | 3.1 ± 0.7 | 0.50 |
| Habitual caffeine consumption (mg/d) | 58.3 ± 24.4 | 96.0 ± 27.1 | 0.31 |
Data represent mean values ± SEM. p values: one-way ANOVA with factor “sensitivity.”
Pre-experimental procedure.
During 2 weeks before the study, the participants were asked to abstain from all sources of caffeine, to wear a wrist activity monitor, and to keep a sleep–wake and caffeine diary. During 3 d before the study, they were instructed to also abstain from alcohol and to maintain a regular sleep–wake cycle with 8 h time in bed. The timing of the nocturnal sleep was not allowed to deviate more than 1 h from the scheduled sleep periods [either from 12:00 A.M. to 8:00 A.M. (n = 19) or from 11:00 P.M. to 7:00 A.M. (n = 3)] in the laboratory. Compliance with these instructions was verified by inspection of the rest–activity plots and sleep–wake diaries.
Study protocol.
Each subject performed two experimental blocks separated by 1 week consisting of four nights and 2 d in the sleep laboratory. After two consecutive 8 h nocturnal sleep recordings (adaptation and baseline nights), the subjects were kept awake for 40 h under constant supervision by members of the research team. During the prolonged wakefulness period, they completed at 3 h intervals, 14 sessions of an 8 min waking EEG recording (3 min eyes closed and 5 min eyes open) followed by 10 min trials (∼100 stimuli per trial) of a PVT (Dinges and Powell, 1985) and a random number generation (RNG) (Brugger et al., 1996) task. Eleven and 23 h into sleep deprivation, subjects received a capsule with either 200 mg caffeine or placebo according to a randomized, double-blind, cross-over design. A 10.5 h recovery night followed by a final waking EEG, PVT, and RNG session concluded each experimental block.
The effects of sleep deprivation and caffeine on RNG performance were published previously (Gottselig et al., 2006). To quantify the effect of prolonged wakefulness on the 10th percentile of PVT speed (i.e., one/reaction time) within a PVT session (referred to as optimal performance) (Jewett et al., 1999; Graw et al., 2004), the data of three test sessions occurring at analogous times of the day (at 11:00 A.M., 2:00 P.M., and 5:00 P.M.) before [baseline (BL)] and after [sleep deprivation (SLD)] the night without sleep were averaged. Because of the possible influence of sleep inertia on the PVT (Van Dongen et al., 2001), the first test session after awakening from the baseline night and the corresponding session after sleep deprivation were not included in this calculation. Different PVT metrics improve at a comparable rate with sleep (Jewett et al., 1999). This finding may suggest that different aspects of visual psychomotor vigilance are governed by the same underlying processes.
Waking and sleep EEG recordings.
The waking EEG and all-night polysomnographic data [EEG, bipolar electrooculogram (EOG), submental electromyogram (EMG), and electrocardiogram (ECG)] were recorded with a polygraphic amplifier (PSA24; Braintronics, Almere, The Netherlands). The analog signals were conditioned by a high-pass filter (−3 dB at 0.16 Hz), a low-pass filter (−3 dB at 102 Hz and approximately −40 dB at 256 Hz), and a notch filter (50 Hz), digitized and transmitted via fiber-optic cables to a personal computer. Data were sampled with a frequency of 512 Hz, digitally filtered (EEG and EOG: low-pass FIR filter, −3 dB at 49 Hz; EMG: bandpass FIR filter, −3 dB at 15.6 and 54 Hz) and stored on a hard disk with a resolution of 128 Hz. Artifacts in the waking EEG were visually identified, and the power spectra of artifact-free 2 s epochs were computed by an fast Fourier transform (FFT) routine (linear detrending, Hanning window; MATLAB; MathWorks, Natick, MA) yielding a 0.5 Hz frequency resolution. The spectral values between 0 and 20 Hz derived from homologous bipolar frontocentral (FC; F3C3 and F4C4) and parieto-occipital (PO; P3O1 and P4O2) EEG derivations were averaged. The power spectra of the 5 min periods with eyes open are reported. Because of severe artifacts, the data recorded at 5:00 P.M. had to be excluded from calculating the average spectra in one caffeine-sensitive and one caffeine-insensitive subject, and the data of only the left hemisphere could be used in another caffeine sensitive subject.
Continuous polysomnographic recordings (EEG, EOG, EMG, ECG) were performed during all experimental nights. Sleep stages were visually scored for 20 s epochs (C3A2 derivation) according to the rules of Rechtschaffen and Kales (1968). Power spectra of consecutive 20 s epochs (FFT; Hanning window; average of five 4 s epochs; 0–20 Hz) were computed for all bipolar EEG derivations. Artifacts were identified by visual inspection and a semiautomatic algorithm (moving average threshold) to separately exclude high- (20–40 Hz) and low- (0.0–0.5 Hz) frequency artifacts in each derivation. For calculation of the all-night power spectra in non-REM sleep, all artifact-free 20 s spectral values of sleep stages 2, 3, and 4 were averaged. For the computation of anteroposterior gradients in EEG power, the spectral values of homologous derivations of the left and right hemispheres (FC, F3C3 and F4C4; PO, P3O1 and P4O2) were averaged. In the recovery nights, only the first 8 h of the 10.5 h sleep opportunity were considered. Because of a computer breakdown, the data of the recovery nights of two caffeine-sensitive and one caffeine-insensitive subject were lost.
Data analyses and statistics.
The 10th percentile of PVT speed, EEG power spectra in wakefulness and sleep, and power ratios between FC and PO derivations were analyzed. All statistical analyses were performed with SAS 8.02 software (SAS Institute, Cary, NC) and the significance level was set at α < 0.05. To approximate a normal distribution, absolute EEG power densities were log-transformed before statistical testing. One-, two-, and three-way repeated-measures ANOVA (rANOVA, general linear model) with the between-subjects factor “sensitivity” (caffeine sensitive, caffeine insensitive) and the within-subjects factors “session” (recording sessions 1–14 across sleep deprivation), “deprivation” (BL; SLD), “caffeine” (caffeine; placebo), and EEG “derivation” (FC; PO) were performed to estimate the effects of sleep deprivation and caffeine. For factors with more than two levels, the Huynh–Feldt-corrected degrees of freedom were computed, but the original degrees of freedom are reported. If not stated otherwise, only significant effects of factors and interactions are mentioned. Power was computed for consecutive 0.5 Hz (waking) and 0.25 Hz (sleep) bins and for specific frequency bands. The frequency bins and bands will be indicated by the encompassing frequency range (i.e., the 1.0 Hz bin denotes 0.75–1.25 Hz in waking and 0.875–1.125 in non-REM sleep).
To estimate the possible associations between the effects of sleep deprivation and caffeine on PVT speed and changes in EEG topography in waking and sleep, regression analyses were performed and Spearman rank correlation coefficients were calculated.
Results
Effects of sleep deprivation and caffeine on neurobehavioral performance
To study the evolution of vigilant attention during sleep deprivation, optimal performance within consecutive PVT sessions was analyzed. Both caffeine-sensitive and -insensitive subjects maintained stable performance across the first 16 h of wakefulness (Fig. 1). Afterward, reaction speed decreased (session: F(13,260) = 14.4; p < 0.001) and was slowest in the placebo condition in the test session coinciding with the circadian trough of performance after 24 h waking. To quantify the degree of neurobehavioral impairment from sleep loss, PVT sessions at analogous time of day in BL and after SLD were compared (Fig. 1). Optimal performance in BL did not differ between the placebo and caffeine conditions and was averaged. Although the two groups performed similarly in BL (F(1,21) = 0.0; p > 0.9), sleep deprivation impaired performance (SLD vs BL) particularly in the caffeine sensitive group (Fig. 1).
Figure 1.

A, B, Time course of the 10th percentile of speed on the PVT across 40 h waking in caffeine-sensitive (A) and caffeine-insensitive men (B). Ten minute PVT sessions were administered every 3 h beginning 30–45 min after awakening. Gray shading indicates the PVT sessions at analogous times of day in BL and after SLD, which were averaged to quantify the effects of sleep deprivation and caffeine. Each PVT session was preceded by an 8 min waking EEG recording. Data are plotted at the respective beginning of the waking EEG recording. Data represent means ± SEM. Caffeine (200 mg) was administered 11 and 23 h into the scheduled waking period (vertical dashed lines). Filled circles, Caffeine condition; open circles, placebo condition. Asterisks indicate the time intervals in which optimal PVT speed in the caffeine condition differed from the placebo condition (p < 0.05, two-tailed paired t tests).
To quantify the effect of caffeine on neurobehavioral performance, optimal PVT speed after sleep deprivation in the caffeine condition was compared with that in the placebo condition. Caffeine improved PVT speed. This effect, however, was mainly observed in the caffeine sensitive men (Fig. 1), although the pharmacokinetics of caffeine in saliva did not differ between the groups (data not shown). Correlation analyses revealed a significant negative association between the effects of sleep deprivation and caffeine (Fig. 2). In other words, regardless of caffeine sensitivity, those subjects with the largest impairment from sleep deprivation showed the largest benefit from caffeine.
Figure 2.

Relationship between the effects of sleep deprivation and caffeine on the 10th percentile of PVT speed in caffeine-sensitive (n = 12, white triangles) and caffeine-insensitive (n = 10, black triangles) men. To quantify the effect of sleep deprivation, the 10th percentile after sleep deprivation in the placebo condition was expressed as a percentage of the corresponding mean baseline values. To quantify the effect of caffeine, the 10th percentile after sleep deprivation in the caffeine condition was expressed as a percentage of the corresponding values after sleep deprivation in the placebo condition. A linear regression line was fitted through 22 individual data points. rp, Pearson's product-moment correlation coefficient; rs, Spearman rank correlation coefficient.
Effects of sleep deprivation and caffeine on regional EEG power distribution in waking
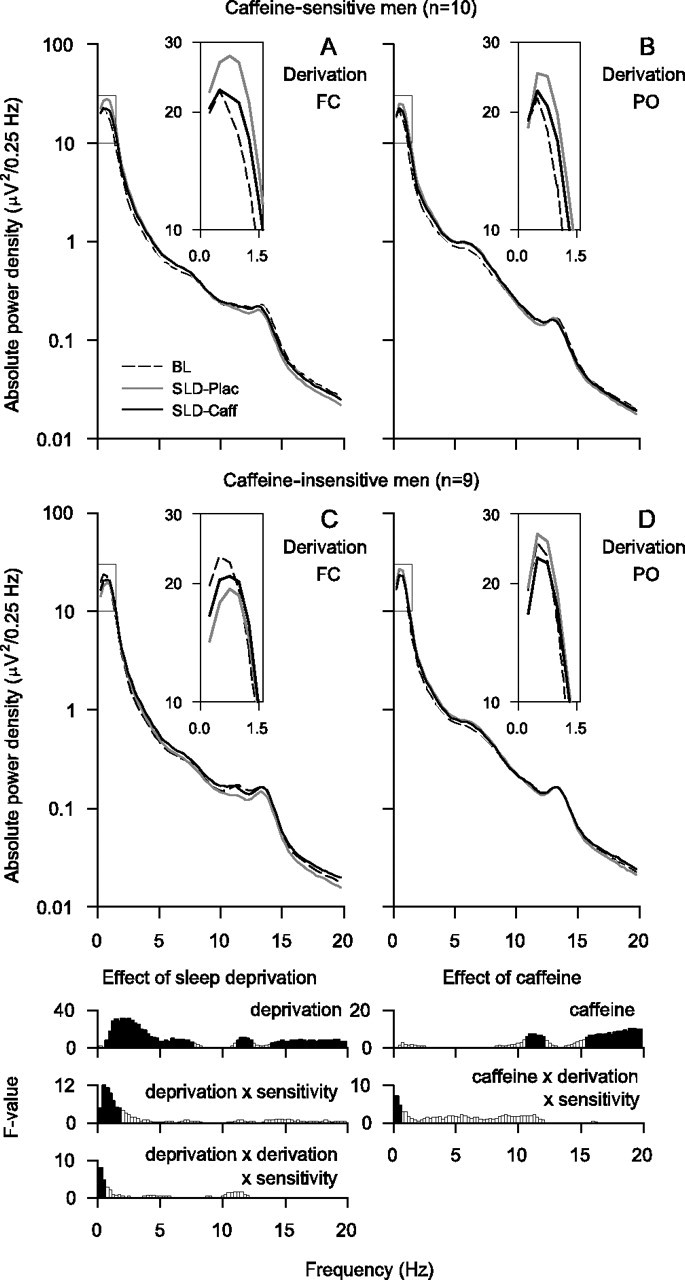
The waking EEG in BL was similar in the placebo and caffeine conditions, and the spectral values were averaged over the two conditions. In both groups, the waking EEG in BL showed two peaks of power, one within the low-δ (0.25–1.75 Hz) and one within the α (7.75–11.75 Hz) range (Figs. 3A,D). Absolute power was higher in the parietooccipital derivation than in the frontocentral derivation in most frequency bins in the 2.75–15.75 Hz range. Moreover, power differed between caffeine-sensitive subjects and caffeine-insensitive subjects in the 3.25–4.75 Hz range, and some bins within the δ and theta ranges showed a significant derivation by sensitivity interaction (0.25–1.25 and 5.25–7.25 Hz). The latter finding reflects a posterior predominance of EEG theta power in the caffeine-insensitive group, which was not present in the caffeine-sensitive group.
Figure 3.

A–F, EEG power density in waking (eyes open) in FC (white triangles) and PO (black triangles) bipolar derivations in subjectively caffeine-sensitive (A–C; n = 12) and caffeine-insensitive (D–F; n = 10) men. A, D, Baseline EEG. Absolute EEG power densities (0.25–19.75 Hz) in BL (average of 5-min recordings at 3, 6, and 9 h waking) were averaged over the placebo and caffeine conditions. B, E, Effect of sleep deprivation. In the placebo condition, absolute power densities (0.25–19.75 Hz) in SLD (average of 5-min recordings at 27, 30, and 33 h waking) were expressed as a percentage of the corresponding mean baseline values. C, F, Effect of caffeine. Absolute power densities (0.25–19.75 Hz) in the caffeine condition after sleep deprivation were expressed as a percentage of the corresponding values after sleep deprivation in the placebo condition. Geometric mean values are plotted at the center of the 0.5 Hz frequency bins. Note the different scaling of the y-axes in the panels illustrating the effects of sleep deprivation and caffeine. Bottom, Significant (p < 0.05, black) and nonsignificant (white, p > 0.05) F values of two- and three-way rANOVA. Left, Two-way rANOVA with the factors sensitivity (sensitive, insensitive) and derivation (FC; PO). Middle and right, Three-way rANOVA with the factors sensitivity, derivation, deprivation (baseline, sleep deprivation), and caffeine (caffeine, placebo), respectively. Vertical lines delimit the theta frequency band chosen for more detailed analyses.
The prolongation of wakefulness increased power in all frequency bins between 0.25 and 8.25 Hz and in the 12.25–15.25 Hz range (Figs. 3B,E). In the 6.25–8.25 Hz band, this increase was more pronounced in the frontocentral derivation than in the parieto-occipital derivation. Moreover, the differences in the regional EEG power distribution in high-δ/theta frequencies between the groups were further accentuated by sleep deprivation. Specifically, an anteroposterior power gradient between 4.25 and 7.75 Hz was prominent after sleep deprivation in caffeine-sensitive subjects when compared with caffeine-insensitive subjects. In the β range (12.25–17.75 Hz), an increase of power after sleep deprivation was restricted to the frontocentral derivation, and a significant deprivation by derivation by sensitivity interaction was present in the 6.75–7.25 and 18.75–19.75 Hz ranges.
Opposing the effect of sleep deprivation, caffeine reduced EEG power in the 5.25–10.25 Hz range, as well as in the 16.25–17.25 Hz band (Figs. 3C,F). In the 4.75–5.25 and 6.25–7.25 Hz ranges, the reduction differed between the derivations depending on caffeine sensitivity.
To examine whether sleep deprivation and caffeine induced opposite changes in the regional EEG power distribution, the 6.25–8.25 Hz band was further analyzed (hereafter referred to as theta power). Prominent effects of sleep deprivation and caffeine were present in this frequency range. Sleep deprivation induced a larger increase of theta power in the frontocentral derivation than in the parieto-occipital derivation (Fig. 4A). Moreover, caffeine-sensitive subjects tended to contribute more to this effect than caffeine-insensitive subjects.
Figure 4.
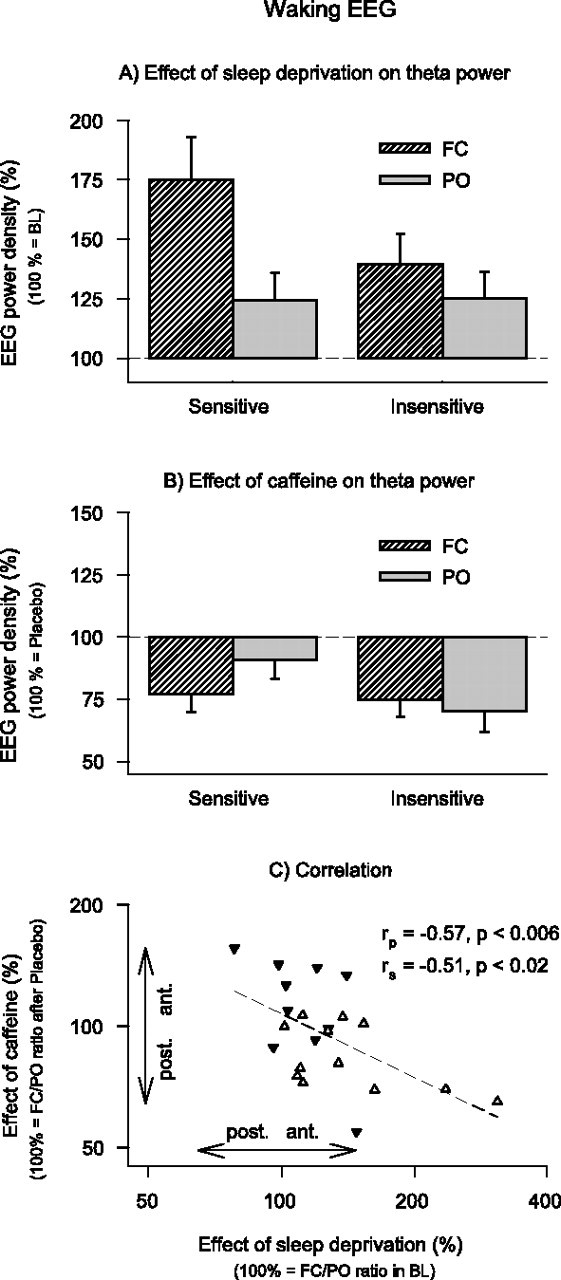
Effects of sleep deprivation and caffeine on theta power (6.25–8.25 Hz) in the waking EEG (eyes open) in FC (striped bars) and PO (gray bars) derivations in caffeine-sensitive (n = 12) and caffeine-insensitive (n = 10) men. A, To quantify the effect of sleep deprivation, power after sleep deprivation in the placebo condition was expressed as a percentage of the corresponding mean baseline values. Data represent means ± SEM. Three-way rANOVA with factors deprivation, derivation and sensitivity is shown (deprivation, F(1,20) = 18.6, p < 0.001; deprivation by derivation interaction, F(1,20) = 14.3, p < 0.002; deprivation by derivation by sensitivity interaction, F(1,20) = 3.9, p < 0.07). B, To quantify the effect of caffeine, power after sleep deprivation in the caffeine condition was expressed as a percentage of the corresponding values after sleep deprivation in the placebo condition. Data represent means ± SEM. Three-way rANOVA with factors caffeine, derivation, and sensitivity is shown (caffeine, F(1,20) = 22.6, p < 0.001; caffeine by derivation by sensitivity interaction, F(1,20) = 6.3, p < 0.03). C, Relationship between the effects of sleep deprivation and caffeine on FC/PO power ratios. Values >100% indicate a shift of power in an anterior direction, values <100% indicate a shift of power in a posterior direction. Data are plotted on a double-logarithmic scale. White triangles, Caffeine-sensitive individuals; black triangles, caffeine-insensitive individuals. A regression line was fitted through 22 individual data points. rp, Pearson's product-moment correlation coefficient; rs, Spearman rank correlation coefficient.
Although caffeine attenuated theta power in both groups, the effect on the regional power distribution differed between caffeine-sensitive and caffeine-insensitive men (Fig. 4B). Specifically, caffeine reduced power in the caffeine sensitive group predominantly in the frontocentral derivation (caffeine by derivation interaction: F(1,11) = 11.0; p < 0.007), whereas the reduction was equally prominent in frontocentral and parieto-occipital derviations in the caffeine insensitive group (caffeine by derivation interaction: F(1,9) = 0.9; p > 0.3). A regression analysis revealed an inverse relation between the effects of sleep deprivation and caffeine on the FC/PO ratio (Fig. 4C). This finding indicates that in those subjects in whom sleep deprivation induced the largest increase in the FC/PO ratio in the theta range of the waking EEG, caffeine most potently reduced this gradient.
Effects of sleep deprivation and caffeine on regional EEG power distribution in non-REM sleep
During the baseline nights, EEG power in low-δ (0.875–2.375 Hz) and σ frequencies (11.375–14.875 Hz) exhibited an anterior predominance, whereas power in the theta/low-α range (3.875–10.125 Hz) exhibited a posterior predominance. To quantify the effect of sleep deprivation on the EEG in non-REM sleep, the power values in the recovery night after placebo were compared with the corresponding mean values of the two baseline nights. Power was increased in the recovery night in the 0.625–7.625 Hz range and reduced in the 11.125–12.375 and 13.875–19.875 Hz ranges (Fig. 5). Although these effects of sleep deprivation were similar in FC and PO derivations, they differed in the 0.125–1.875 Hz range between caffeine-sensitive and caffeine-insensitive subjects. Moreover, a significant deprivation by derivation by sensitivity interaction was present in the 0.125–0.625 Hz range.
Figure 5.
Absolute EEG power density (0.125–19.875 Hz) in non-REM sleep in FC and PO bipolar derivations in subjectively caffeine-sensitive and caffeine-insensitive men. A, B, Caffeine-sensitive subjects (n = 10). C, D, Caffeine-insensitive subjects (n = 9). Interrupted lines, Baseline (mean of two baseline nights); gray lines, recovery night after 40 h waking and intake of placebo (SLD-Plac); black lines, recovery night after 40 h waking and intake of 2 × 200 mg caffeine (SLD-Caff). Geometric mean values are plotted at the center of the 0.25 Hz frequency bins. The frequency range between 0 and 1.5 Hz was expanded for better visualization (insets). Bottom, Significant (p < 0.05, black) and nonsignificant (white, p > 0.05) F values of rANOVA. Left, Three-way rANOVA with the factors sensitivity, derivation, and deprivation. Right, Three-way rANOVA with the factors sensitivity, derivation, and caffeine.
Caffeine attenuated the sleep deprivation-induced decrease of power in non-REM sleep in α/low-σ (10.625–12.125 Hz) and β (15.375–19.875 Hz) frequencies regardless of caffeine sensitivity and with no regional specificity. In contrast, a significant caffeine by derivation by sensitivity interaction demonstrates that the power distribution in the 0.125–0.625 Hz range was differently affected by caffeine in caffeine-sensitive and caffeine-insensitive subjects (Fig. 5).
To examine whether sleep deprivation and caffeine induced opposite changes in the regional distribution of EEG power within the frequency range of the sleep slow oscillation (<1 Hz), the following analyses focused on the three bins encompassing the 0.125–0.875 Hz range. The effect of sleep deprivation differed between caffeine-sensitive and -insensitive subjects, as well as between the anterior and posterior EEG derivations (Fig. 6A). Differences between the groups and derivations were also present in the action of caffeine (Fig. 6B). Correlation analyses revealed a significant inverse association between the effects of sleep deprivation and caffeine on the FC/PO ratio in the <1 Hz range in non-REM sleep (Fig. 6C).
Figure 6.
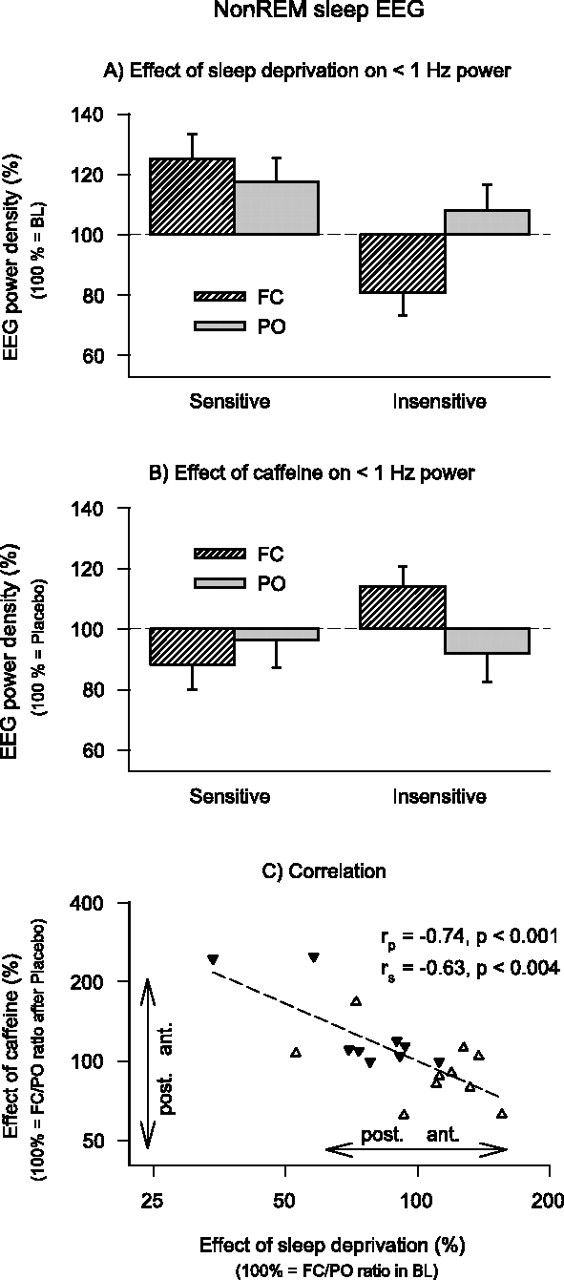
Effects of sleep deprivation and caffeine on EEG power in non-REM sleep (< 1 Hz) in FC (striped bars) and PO (gray bars) derivations in caffeine-sensitive (n = 10) and caffeine-insensitive (n = 9) men. A, To quantify the effect of sleep deprivation, power after sleep deprivation in the placebo condition was expressed as a percentage of the corresponding mean baseline values. Data represent means ± SEM. Three-way rANOVA with factors deprivation, derivation, and sensitivity is shown (deprivation by sensitivity interaction, F(1,17) = 12.5, p < 0.003; deprivation by derivation by sensitivity interaction, F(1,17) = 5.5, p < 0.04). B, To quantify the effect of caffeine, power after sleep deprivation in the caffeine condition was expressed as a percentage of the corresponding values after sleep deprivation in the placebo condition. Data represent means ± SEM. Three-way rANOVA with factors caffeine, derivation and sensitivity is shown (caffeine by derivation by sensitivity interaction, F(1,17) = 5.2, p < 0.04). C, Relationship between the effects of sleep deprivation and caffeine on FC/PO power ratios. Values >100% indicate a shift of power in anterior direction, values <100% indicate a shift of power in posterior direction. Data are plotted on a double-logarithmic scale. White triangles, Caffeine-sensitive individuals; black triangles, caffeine-insensitive individuals. A regression line was fitted through 19 individual data points. rp, Pearson's product-moment correlation coefficient; rs, Spearman rank correlation coefficient.
Discussion
Interindividual differences in the impairment of neurobehavioral functions from sleep loss and in the effectiveness of common pharmacological countermeasures such as caffeine have recently attracted increased attention (Leproult et al., 2003; Van Dongen et al., 2003, 2004; Balkin et al., 2004). The elucidation of the mechanisms underlying these differences is of high scientific interest because they reveal insights into the neurophysiological regulation of human wakefulness and sleep. In addition, they are also of clinical importance because they may identify persons at elevated risk for impaired neurobehavioral performance and reduced health associated with prolonged wakefulness and shift work (Rajaratnam and Arendt, 2001). Here, we show that sustained vigilant attention in healthy men who consider themselves as being caffeine sensitive was more impaired by one night without sleep than in subjectively caffeine insensitive men. Correlation analyses revealed that those individuals with the largest neurobehavioral impairment from sleep loss benefited the most from the stimulant action of caffeine. Similarly, the effects of sleep deprivation and caffeine on anteroposterior EEG power ratios in the theta range in waking and the <1 Hz range in non-REM sleep were inversely related. Together, these data support the hypothesis that the adenosinergic system contributes to interindividual differences in the impairment of neurobehavioral function associated with prolonged waking, as well as to sleep deprivation-induced changes in the EEG power distribution in distinct frequency ranges in wakefulness and non-REM sleep, which are relevant for sleep regulation (Borbély and Achermann, 2005). Our correlation analyses indicate that between 25 and 50% of the variance in the effects of sleep deprivation may be explained by adenosinergic mechanisms. Thus, unidentified other influences must also contribute to the observed differential vulnerability to sleep loss in young men.
Adenosine was previously proposed to provide a neurochemical substrate of impaired performance, reduced vigilance, and altered EEG characteristics after sleep deprivation (for review, see Benington and Heller, 1995; Porkka-Heiskanen et al., 2002; Basheer et al., 2004). The competitive antagonist at adenosine A1 and A2A receptors, caffeine, attenuated the wake-dependent deterioration in cognitive performance (Wyatt et al., 2004), as well as the increase in EEG theta and δ power in wakefulness and sleep (Landolt et al., 2004). In the absence of baseline differences in optimal PVT performance between subjectively caffeine-sensitive and -insensitive men, we found differences in the regional EEG power distribution between these groups in the theta range in waking after a baseline night of sleep. Sleep deprivation accentuated these differences in the anteroposterior power gradients in the waking EEG and also induced differences in the PVT. These observations are consistent with recent functional imaging studies suggesting that the vulnerability to sleep deprivation-induced performance decline in working memory is associated with baseline differences in task-related cortical activation (Caldwell et al., 2005; Mu et al., 2005; Chee et al., 2006). Together, these findings indicate that physiological variables obtained under baseline conditions could be identified in the future as useful predictors of individual vulnerability to sleep deprivation. Caffeine counteracted the PVT differences between the groups. Moreover, the effects of elevated sleep propensity and caffeine were negatively correlated. Optimal PVT performance activates a cortical sustained attention network and the motor system including the striatum (Drummond et al., 2005). The striatum shows prominent expression of adenosine A2A receptors (Martinez-Mir et al., 1991; Ishiwata et al., 2005). This adenosine receptor subgroup was shown to be responsible for the wakefulness-promoting effect of caffeine (Huang et al., 2005). We recently found a common c.1976T>C polymorphism of the A2A receptor gene to be associated with interindividual differences in EEG theta power during wakefulness and sleep (Rétey et al., 2005). Together with the previous findings, the present study may suggest that this adenosine receptor subtype plays a role for interindividual differences in the vulnerability of neurobehavioral performance to sleep loss.
According to the two-process model of sleep regulation (Borbély, 1982), a sleep–wake dependent, sleep regulatory process referred to as sleep homeostasis increases during wakefulness and dissipates during sleep (Daan et al., 1984). Activity in distinct EEG frequency bands in wakefulness and non-REM sleep reflects reliable physiological markers of homeostatic sleep propensity (for review, see Borbély and Achermann, 2005). We found that the overall effect of sleep loss on the waking EEG was consistent with previous studies (Aeschbach et al., 1999; Cajochen et al., 2001). Interesting differences between the individuals emerged when the regional power distributions between frontocentral and parietooccipital EEG derivations were analyzed. Specifically, both the effects of sleep loss and caffeine on anteroposterior power gradients in the theta range tended to be more prominent in caffeine-sensitive subjects when compared with caffeine-insensitive subjects. These differences mirrored the interindividual differences in the effects of sleep deprivation and caffeine on sustained vigilant attention as measured by optimal PVT performance. Frontal theta activity reflects the alternative activation of the prefrontal cortex and anterior cingulate cortex, brain areas associated with continuous attention (Asada et al., 1999). Moreover, a combined EEG/functional magnetic resonance imaging (fMRI) study suggested a positive correlation between theta activity (5–9.5 Hz) in waking and the fMRI signal of the right dorsolateral prefrontal and superior parietal cortices (Foucher et al., 2004). Consistent with the interpretation that these regions are involved not only in arousal, but also in the maintenance of attention, it was recently reported that optimal PVT speed after sleep deprivation depends on activation of a frontoparietal sustained attention network and frontal cortical regions involved in executive functions (Drummond et al., 2005). Our EEG data thus support brain imaging studies showing that changes in activation after sleep deprivation in frontoparietal regions are related to individual differences in cognitive impairment from sleep loss (for discussion, see Chee et al. 2006). Moreover, they suggest that adenosinergic mechanisms contribute to these differences.
The prolongation of wakefulness increased EEG power in non-REM sleep in δ and theta frequencies (0.625–7.625 Hz) in the recovery night. It was recently shown in mice that the frontal predominance in the 0.75–1.0 Hz bin was determined by the increase in sleep propensity, whereas the frontoparietal power ratio in higher δ frequencies was not related to waking (Vyazowskiy et al., 2006). Our finding of a significant negative association between the effects of sleep deprivation and caffeine on the anteroposterior power ratio <1 Hz in non-REM sleep after sleep deprivation may indicate that these processes involve adenosinergic mechanisms. In deep non-REM sleep, which is prominent in conditions of high sleep propensity such as after sleep deprivation, the EEG slow oscillation <1 Hz is the main source of δ activity (Amzica and Steriade, 1998; Massimini et al., 2004). It is interesting to note that the generation of the slow oscillation in rat hippocampal brain slices was shown to require an adenosine-dependent inhibition of glutamatergic transmission (Zhang et al., 1998). Nevertheless, it should be considered that our method reflects EEG power and not necessarily the slow oscillation in non-REM sleep.
In summary, we found a marked inverse relationship between the individual effects induced by sleep deprivation and the adenosine receptor antagonist caffeine on vigilant attention and anteroposterior power ratios in EEG theta activity in waking and <1 Hz activity in non-REM sleep. We thus suggest that adenosinergic mechanisms contribute to individual differences in the vulnerability to sleep deprivation-induced changes in neurobehavioral function and the regional distribution of EEG power relevant for sleep regulation and attentional processes. Further elucidation of these mechanisms will help in the identification of persons at risk for impaired performance after sleep loss and in the development of agents to reduce the detrimental effects of prolonged waking on cognition and behavior.
Footnotes
This work was supported by Swiss National Science Foundation Grants 3100-067060.01, 3100A0-107874 (H.P.L.), and 3100A0-10567 (P.A.).We thank K. Tönz, J. Buckelmüller, E. Honegger, and A. Gerber for their help with collection and preanalyses of the data, and Prof. A. A. Borbély and Dr. C. Kopp for comments on this manuscript. The authors declare that they have no competing interests, financial or otherwise.
References
- Adam M, Rétey JV, Khatami R, Landolt HP. Age-related changes in the time course of vigilant attention during 40 hours without sleep in men. Sleep. 2006;29:55–57. doi: 10.1093/sleep/29.1.55. [DOI] [PubMed] [Google Scholar]
- Aeschbach D, Matthews JR, Postolache TT, Jackson MA, Giesen HA, Wehr TA. Two circadian rhythms in the human electroencephalogram during wakefulness. Am J Physiol. 1999;277:R1771–R1779. doi: 10.1152/ajpregu.1999.277.6.R1771. [DOI] [PubMed] [Google Scholar]
- Alsene K, Deckert J, Sand P, de Wit H. Association between A2a receptor gene polymorphisms and caffeine-induced anxiety. Neuropsychopharmacology. 2003;28:1694–1702. doi: 10.1038/sj.npp.1300232. [DOI] [PubMed] [Google Scholar]
- Amzica F, Steriade M. Electrophysiological correlates of sleep delta waves. Electroencephalogr Clin Neurophysiol. 1998;107:69–83. doi: 10.1016/s0013-4694(98)00051-0. [DOI] [PubMed] [Google Scholar]
- Asada H, Fukuda Y, Tsunoda S, Yamaguchi M, Tonoike M. Frontal midline theta rhythms reflect alternative activation of prefrontal cortex and anterior cingulate cortex in humans. Neurosci Lett. 1999;274:29–32. doi: 10.1016/s0304-3940(99)00679-5. [DOI] [PubMed] [Google Scholar]
- Balkin TJ, Kamimori GH, Redmond DP, Vigneulle RM, Thorne DR, Belenky G, Wesensten NJ. On the importance of countermeasures in sleep and performance models. Aviat Space Environ Med. 2004;75:A155–A157. [PubMed] [Google Scholar]
- Basheer R, Strecker RE, Thakkar MM, McCarley RW. Adenosine and sleep-wake regulation. Prog Neurobiol. 2004;73:379–396. doi: 10.1016/j.pneurobio.2004.06.004. [DOI] [PubMed] [Google Scholar]
- Benington JH, Heller HC. Restoration of brain energy metabolism as the function of sleep. Prog Neurobiol. 1995;45:347–360. doi: 10.1016/0301-0082(94)00057-o. [DOI] [PubMed] [Google Scholar]
- Blatter K, Graw P, Münch M, Knoblauch V, Wirz-Justice A, Cajochen C. Gender and age differences in psychomotor vigilance performance under differential sleep pressure conditions. Behav Brain Res. 2006;168:312–317. doi: 10.1016/j.bbr.2005.11.018. [DOI] [PubMed] [Google Scholar]
- Borbély AA. A two process model of sleep regulation. Hum Neurobiol. 1982;1:195–204. [PubMed] [Google Scholar]
- Borbély AA, Achermann P. Sleep homeostasis and models of sleep regulation. In: Kryger MH, Roth T, Dement WC, editors. Principles and practice of sleep medicine. 4 Ed. Philadelphia: Elsevier Saunders; 2005. pp. 405–417. [Google Scholar]
- Brugger P, Monsch AU, Salmon DP, Butters N. Random number generation in dementia of the Alzheimer type: a test of frontal executive functions. Neuropsychologia. 1996;34:97–103. doi: 10.1016/0028-3932(95)00066-6. [DOI] [PubMed] [Google Scholar]
- Cajochen C, Brunner DP, Krauchi K, Graw P, Wirz-Justice A. Power density in theta/alpha frequencies of the waking EEG progressively increases during sustained wakefulness. Sleep. 1995;18:890–894. doi: 10.1093/sleep/18.10.890. [DOI] [PubMed] [Google Scholar]
- Cajochen C, Knoblauch V, Kräuchi K, Renz C, Wirz-Justice A. Dynamics of frontal EEG activity, sleepiness and body temperature under high and low sleep pressure. NeuroReport. 2001;12:2277–2281. doi: 10.1097/00001756-200107200-00046. [DOI] [PubMed] [Google Scholar]
- Caldwell JA, Mu QW, Smith JK, Mishory A, Caldwell JL, Peters G, Brown DL, George MS. Are individual differences in fatigue vulnerability related to baseline differences in cortical activation? Behav Neurosci. 2005;119:694–707. doi: 10.1037/0735-7044.119.3.694. [DOI] [PubMed] [Google Scholar]
- Chee MW, Chuah LY, Venkatraman V, Chan WY, Philip P, Dinges DF. Functional imaging of working memory following normal sleep and after 24 and 35 h of sleep deprivation. NeuroImage. 2006;31:419–428. doi: 10.1016/j.neuroimage.2005.12.001. [DOI] [PubMed] [Google Scholar]
- Czeisler CA, Walsh JK, Roth T, Hughes RJ, Wright KP, Kingsbury L, Arora S, Schwartz JR, Niebler GE, Dinges DF, Black JE, Bogan RK, Bonnet MH, Carskadon MA, Cook JS, Corser BC, Erman MK, Feldman NT, Ferguson JM, Furman Y, et al. Modafinil for excessive sleepiness associated with shift-work sleep disorder. N Engl J Med. 2005;353:476–486. doi: 10.1056/NEJMoa041292. [DOI] [PubMed] [Google Scholar]
- Daan S, Beersma DGM, Borbély AA. Timing of human sleep: recovery process gated by a circadian pacemaker. Am J Physiol. 1984;246:R161–R178. doi: 10.1152/ajpregu.1984.246.2.R161. [DOI] [PubMed] [Google Scholar]
- Dinges DF, Powell JW. Microcomputer analyses of performance on a portable, simple visual reaction task during sustained operations. Behav Res Meth Instr Comp. 1985;17:652–655. [Google Scholar]
- Dorrian J, Rogers NL, Dinges DF. Psychomotor vigilance performance: neurocognitive assay sensitive to sleep loss. In: Kushida CA, editor. Sleep deprivation: clinical issues, pharmacology and sleep loss effects. New York: Marcel Dekker; 2005. pp. 39–70. [Google Scholar]
- Drummond SPA, Bischoff-Grethe A, Dinges DF, Ayalon L, Mednick SC, Meloy MJ. The neural basis of the psychomotor vigilance task. Sleep. 2005;28:1059–1068. [PubMed] [Google Scholar]
- Dumont M, Macchi MM, Carrier J, Lafrance C, Hebert M. Time course of narrow frequency bands in the waking EEG during sleep deprivation. NeuroReport. 1999;10:403–407. doi: 10.1097/00001756-199902050-00035. [DOI] [PubMed] [Google Scholar]
- Finelli LA, Baumann H, Borbély AA, Achermann P. Dual electroencephalogram markers of human sleep homeostasis: correlation between theta activity in waking and slow-wave activity in sleep. Neuroscience. 2000;101:523–529. doi: 10.1016/s0306-4522(00)00409-7. [DOI] [PubMed] [Google Scholar]
- Foucher JR, Otzenberger H, Gounot D. Where arousal meets attention: a simultaneous fMRI and EEG recording study. NeuroImage. 2004;22:688–697. doi: 10.1016/j.neuroimage.2004.01.048. [DOI] [PubMed] [Google Scholar]
- Goldstein A, Warren R, Kaizer S. Psychotropic effects of caffeine in man. I. Individual differences in sensitivity to caffeine-induced wakefulness. J Pharmacol Exp Ther. 1965;149:156–159. [PubMed] [Google Scholar]
- Gottselig JM, Adam M, Retey JV, Khatami R, Achermann P, Landolt HP. Random number generation during sleep deprivation: Effects of caffeine on response maintenance and stereotypy. J Sleep Res. 2006;15:31–40. doi: 10.1111/j.1365-2869.2006.00497.x. [DOI] [PubMed] [Google Scholar]
- Graw P, Kräuchi K, Knoblauch V, Wirz-Justice A, Cajochen C. Circadian and wake-dependent modulation of fastest and slowest reaction times during the psychomotor vigilance task. Physiol Behav. 2004;80:695–701. doi: 10.1016/j.physbeh.2003.12.004. [DOI] [PubMed] [Google Scholar]
- Huang ZL, Qu WM, Eguchi N, Chen JF, Schwarzschild MA, Fredholm BB, Urade Y, Hayaishi O. Adenosine A2(A), but not A(1), receptors mediate the arousal effect of caffeine. Nat Neurosci. 2005;8:858–859. doi: 10.1038/nn1491. [DOI] [PubMed] [Google Scholar]
- Ishiwata K, Mishina M, Kimura Y, Oda K, Sasaki T, Ishii K. First visualization of adenosine A(2A) receptors in the human brain by positron emission tomography with [C-11]TMSX. Synapse. 2005;55:133–136. doi: 10.1002/syn.20099. [DOI] [PubMed] [Google Scholar]
- Jewett ME, Dijk DJ, Kronauer RE, Dinges DF. Dose-response relationship between sleep duration and human psychomotor vigilance and subjective alertness. Sleep. 1999;22:171–179. doi: 10.1093/sleep/22.2.171. [DOI] [PubMed] [Google Scholar]
- Landolt HP, Rétey JV, Tönz K, Gottselig JM, Khatami R, Buckelmüller I, Achermann P. Caffeine attenuates waking and sleep electroencephalographic markers of sleep homeostasis in humans. Neuropsychopharmacology. 2004;29:1933–1939. doi: 10.1038/sj.npp.1300526. [DOI] [PubMed] [Google Scholar]
- Leproult R, Colecchia EF, Berardi AM, Stickgold R, Kosslyn SM, Van Cauter E. Individual differences in subjective and objective alertness during sleep deprivation are stable and unrelated. Am J Physiol. 2003;284:R280–R290. doi: 10.1152/ajpregu.00197.2002. [DOI] [PubMed] [Google Scholar]
- Lorenzo I, Ramos J, Arce C, Guevara MA, Corsicabrera M. Effect of total sleep-deprivation on reaction-time and waking EEG activity in man. Sleep. 1995;18:346–354. [PubMed] [Google Scholar]
- Martinez-Mir MI, Probst A, Palacios JM. Adenosine-A2 receptors: selective localization in the human basal ganglia and alterations with disease. Neuroscience. 1991;42:697–706. doi: 10.1016/0306-4522(91)90038-p. [DOI] [PubMed] [Google Scholar]
- Massimini M, Huber R, Ferrarelli F, Hill S, Tononi G. The sleep slow oscillation as a traveling wave. J Neurosci. 2004;24:6862–6870. doi: 10.1523/JNEUROSCI.1318-04.2004. [DOI] [PMC free article] [PubMed] [Google Scholar]
- Mu QW, Mishory A, Johnson KA, Nahas Z, Kozel FA, Yamanaka K, Bohning DE, George MS. Decreased brain activation during a working memory task at rested baseline is associated with vulnerability to sleep deprivation. Sleep. 2005;28:433–446. doi: 10.1093/sleep/28.4.433. [DOI] [PubMed] [Google Scholar]
- Phipps-Nelson J, Redman JR, Dijk DJ, Rajaratnam SM. Daytime exposure to bright light, as compared to dim light, decreases sleepiness and improves psychomotor vigilance performance. Sleep. 2003;26:695–700. doi: 10.1093/sleep/26.6.695. [DOI] [PubMed] [Google Scholar]
- Porkka-Heiskanen T, Alanko L, Kalinchuk A, Stenberg D. Adenosine and sleep. Sleep Med Rev. 2002;6:321–332. doi: 10.1053/smrv.2001.0201. [DOI] [PubMed] [Google Scholar]
- Rajaratnam SM, Arendt J. Health in a 24-h society. Lancet. 2001;358:999–1005. doi: 10.1016/S0140-6736(01)06108-6. [DOI] [PubMed] [Google Scholar]
- Rechtschaffen A, Kales A. Bethesda, MD: National Institutes of Health; 1968. A manual of standardized terminology, techniques and scoring system for sleep stages of human subjects. [Google Scholar]
- Rétey JV, Adam M, Honegger E, Khatami R, Luhmann UFO, Jung HH, Berger W, Landolt HP. A functional genetic variation of adenosine deaminase affects the duration and intensity of deep sleep in humans. Proc Natl Acad Sci USA. 2005;102:15676–15681. doi: 10.1073/pnas.0505414102. [DOI] [PMC free article] [PubMed] [Google Scholar]
- Sforza E, Haba-Rubio J, De Bilbao F, Rochat T, Ibanez V. Performance vigilance task and sleepiness in patients with sleep-disordered breathing. Eur Respir J. 2004;24:279–285. doi: 10.1183/09031936.04.00091903. [DOI] [PubMed] [Google Scholar]
- Van Dongen HPA, Price NJ, Mullington JM, Szuba MP, Kapoor SC, Dinges DF. Caffeine eliminates psychomotor vigilance deficits from sleep inertia. Sleep. 2001;24:813–819. doi: 10.1093/sleep/24.7.813. [DOI] [PubMed] [Google Scholar]
- Van Dongen HPA, Maislin G, Mullington JM, Dinges DF. The cumulative cost of additional wakefulness: dose-response effects on neurobehavioral functions and sleep physiology from chronic sleep restriction and total sleep deprivation. Sleep. 2003;26:117–126. doi: 10.1093/sleep/26.2.117. [DOI] [PubMed] [Google Scholar]
- Van Dongen HPA, Baynard MD, Maislin G, Dinges DF. Systematic interindividual differences in neurobehavioral impairment from sleep loss: Evidence of trait-like differential vulnerability. Sleep. 2004;27:423–433. [PubMed] [Google Scholar]
- Wyatt JK, Cajochen C, Ritz-De Cecco A, Czeisler CA, Dijk DJ. Low-dose repeated caffeine administration for circadian-phase-dependent performance degradation during extended wakefulness. Sleep. 2004;27:374–381. doi: 10.1093/sleep/27.3.374. [DOI] [PubMed] [Google Scholar]
- Zhang Y, Velazquez JL, Tian GF, Wu CP, Skinner FK, Carlen PL, Zhang L. Slow oscillations (≤1 Hz) mediated by GABAergic interneuronal networks in rat hippocampus. J Neurosci. 1998;18:9256–9268. doi: 10.1523/JNEUROSCI.18-22-09256.1998. [DOI] [PMC free article] [PubMed] [Google Scholar]