

Abstract
Much of our current evidence concerning of the role of calcium (Ca2+) as a second messenger comes from its interaction with fluorescent probes; however, many Ca2+ probes also have a higher affinity for another divalent cation: zinc (Zn2+). In this study, using a selective Zn2+ probe (Newport Green), we investigated the accumulation of intracellular Zn2+ transients in acute rat hippocampal slices during ischemia, simulated by oxygen and glucose deprivation (OGD). Subsequent reperfusion with glucose-containing oxygenated medium resulted in an additional increase in intracellular Zn2+. Such observations compelled us to investigate the contribution of Zn2+ to the alleged intracellular Ca2+ overload occurring in ischemia and reperfusion. Using confocal fluorescent microscopy of Calcium Green-1, a widely used Ca2+ indicator, we detected increases in fluorescence intensity during OGD and reperfusion. However, application of a Zn2+ chelator, at the peak of the fluorescence elevation (interpreted as Ca2+ overload), resulted in a significant drop in intensity, suggesting that rising Zn2+ is the primary source of the increasing Calcium Green-1 fluorescence. Finally, staining with the cell viability indicator propidium iodide revealed that Zn2+ is responsible for the ischemic neuronal cell death, because Zn2+ chelation prevented cells from sustaining ischemic damage. Current cellular models of ischemic injury center on Ca2+-mediated excitotoxicity. Our results indicate that Zn2+ elevation contributes to conventionally recognized Ca2+ overload and also suggest that the role of Ca2+ in neurotoxicity described previously using Ca2+ probes may need to be re-examined to determine whether effect previously attributed to Ca2+ could, in part, be attributable to Zn2+.
Keywords: zinc, calcium, fluorescence, ischemia, nitric oxide, cell death
Introduction
The transition metal ion Zn2+, an essential cofactor for many enzymes and other proteins (Vallee and Falchuk, 1993), has recently emerged as a possible cellular messenger in physiological and cytotoxic signaling (Bossy-Wetzel et al., 2004; Frederickson et al., 2005). In the CNS, Zn2+ is important for brain development, and the maintenance of an appropriate Zn2+ concentration is critical to brain function. Moreover, exposure of neurons to excessive Zn2+ can be toxic (Yokoyama et al., 1986), inducing apoptosis at lower concentrations (Manev et al., 1997; Lobner et al., 2000) and necrosis at higher concentrations (Tonder et al., 1990; Choi and Koh, 1998). A growing body of evidence also demonstrates Zn2+ accumulation during oxygen and glucose deprivation (OGD), followed by reperfusion (Tonder et al., 1990; Koh et al., 1996; Snider et al., 2000; Lee et al., 2002; Wei et al., 2004). The Zn2+ chelating agent CaEDTA (Koh et al., 1996; Frederickson et al., 2002) and metal-binding proteins (van Lookeren Campagne et al., 1999) have been demonstrated to prevent the ischemia-induced injury.
Ca2+ plays an important role in the regulation of a variety of neuronal processes including excitability, associativity, neurotransmitter release, gene transcription, cell proliferation, and synaptic plasticity (Clapham, 1995; Berridge, 1998; Verkhratsky, 2005). Many studies have implicated Ca2+ as a mediator or trigger of neuronal damage and neurotoxicity. For example, the role of excessive Ca2+ influx or Ca2+ overloading in neuronal death after ischemic insults or brain trauma has been studied extensively (Benveniste et al., 1988; Paschen, 1996; Perez Velazquez et al., 1997; Nishizawa, 2001). Nevertheless, treatments or clinical drug trials designed to alter Ca2+ influx or Ca2+ homeostasis have met with limited success in reducing the volume or severity of neuronal damage (White et al., 1996; National Institute of Neurological Disorders and Stroke, 2002).
Because much of the current knowledge about the roles of Ca2+ elevation is derived from its interaction with fluorescent indicators, the evidence for increases in intracellular Zn2+ during ischemic neural damage thereby poses a dilemma. This dilemma is particularly apparent when one considers that nearly all fluorescent Ca2+ indicators also bind Zn2+ with a high affinity (Grynkiewicz et al., 1985; Tsien and Pozzan, 1989). In essence, the elevation of intracellular Zn2+ may comprise part of, or the entirety of, conventionally measured intracellular Ca2+ signals. For example, although best known as an excitation wavelength ratiometric indicator for Ca2+, fura-2 is actually a 100-fold more sensitive as an indicator for Zn2+ than Ca2+. The potential problems arising from such sensitivity of fluorescent indicators to Zn2+ and of interference by Zn2+ have been essentially ignored, attributable in part to the assumption that intracellular concentrations of Zn2+ are very low (Haugland, 2001). Here, we demonstrate that ischemia simulated by OGD, followed by reperfusion, result in an increase in [Zn2+]i in global hippocampal slices. Furthermore, when a classic calcium indicator (Calcium Green-1) was used to monitor intracellular Ca2+ rises, it turned out that a significant amount of the purported Ca2+ fluorescent signal was actually caused by an elevation of Zn2+.
Materials and Methods
Preparations of brain slices and solutions.
Male Sprague Dawley rats (200–250 g) were anesthetized with ketamine HCl and decapitated; the brain was then quickly removed and submerged in ice-cold artificial CSF (ACSF). Coronal slices, 250 μm in thickness, were made using a Vibratome (Series 3000 with 900R refrigeration; The Vibratome Company, St. Louis, MO). ACSF in the slicing chamber was kept ice cold and contained the following (in mm): 121 NaCl, 1.75 KCl, 5 MgCl2, 1.25 KH2PO4, 26 NaHCO3, and 10 glucose, gassed with 95%O2/5% CO2. After equilibrium, slices were transferred to a dye incubation chamber containing 2 ml of ACSF used in experiments (to which 2.5 mm CaCl2 was added and MgCl2 was 1.3 mm rather than 5 mm) at 32°C and bubbled with 95% O2/5% CO2. Care was taken to minimize potential Zn2+ contamination (Martin et al., 2006). All solutions were kept in Teflon bottles, and solutions/chemicals were transferred with metal-free pipette tips or spatulas coated with polymethylpentene. The testing buffer/solution was made with puriss grade salts [Sigma (St. Louis, MO) or Fluka (Neu-Ulm, Germany)] and, in some experiments (see Fig. 3), also stripped of divalent metal ions by treatment with Chelex-100 beads (5%; Bio-Rad, Richmond, CA).
Figure 3.

Zn2+ chelator TPEN reduces Calcium Green-1 fluorescence. A, Calcium Green-1 detecting zinc and ameliorated by TPEN. A graph of fluorescence intensity from Calcium Green-1 with the addition of Zn2+ at 10 and 100 μm with signal abatement when 50 μm TPEN was applied is shown. The experiments were conducted in ACSF adjusted to pH 7.4. The concentration of Calcium Green-1 is 1 μm. SE at 1 μm Zn2+ is ±2 intensity units and at 100 μm is ±4 intensity units; n = 5. The y-axis represents the fluorescence emission intensity (F) of the dye/ion complex minus the fluorescence of the baseline (F0). ΔF = F − F0. B, Detecting cellular Zn2+ with membrane-permeable Calcium Green-1 AM (10 μm). A 5 min exposure to 300 μm Zn2+ produced no change in Calcium Green-1 fluorescence. The subsequent addition of 100 μm Na+ pyrithione, a Zn2+ ionophore, with Zn2+ resulted in a progressive increase in fluorescence. No Ca2+ was added in the perfusate. Finally, Calcium Green-1 fluorescence was reduced by the addition of 100 μm TPEN. The y-axis represents the fluorescence emission intensity of the dye/ion complex in arbitrary units.
Intracellular Zn2+ measurements.
To monitor intracellular Zn2+ ([Zn2+]i), hippocampal slices were loaded with 10 μm Newport Green (NG) DCF diacetate (excitation λ, 505 nm; emission λ, 535 nm) or 10 μm Calcium Green-1 AM (excitation λ, 506 nm; emission λ, 531 nm) in 0.05% DMSO and 0.01 Pluronic F-127 from a 20% w/v stock solution of Pluronic F-127 dissolved in DMSO. Slices were maintained in the incubation chamber for 45 min at 32°C. Slices were then washed three times with ACSF and incubated for an additional 30 min in ACSF before imaging. All experiments were performed at 32°C, maintained at temperature with an SC-20 in-line heater equipped with a CL-100 temperature controller (Warner Instruments, Hamden, CT) under constant perfusion (2 ml/min) maintained by a Peristar peristaltic pump (World Precision Instruments, Sarasota, FL) in a 35 mm glass-bottomed chamber (MatTek, Ashland, MA) on the stage of an inverted laser-scanning confocal microscope (Axiovert LSM510; Zeiss, Oberkochen, Germany) or a Motic inverted microscope equipped with an Olympus (Tokyo, Japan) 10×, 1.1 numerical aperture lens and a CCD camera (Retiga 1300i; QImaging, Burnaby, British Columbia, Canada). The images were digitized, and analysis was performed using Zeiss imaging software or Image-Pro Plus software (Media Cybernetics, Silver Spring, MD).
OGD of slices.
All oxygen–glucose-deprived slice manipulations were performed in 35 mm glass-bottomed chambers (MatTek) where slices were fully submerged in circulated oxygen–glucose-deprived ACSF and held in position using a circular platinum wire with a nylon grid that allowed for solution exchange. All solutions were prebubbled with either 95% O2/5% CO2 or 95 N2/5% CO2 gas for 30 min before slice immersion to ensure O2 saturation or O2 removal was achieved as desired. Baseline measurements were recorded for 10–20 min before oxygen–glucose-deprived exposure. Oxygen–glucose-deprived exposure was implemented for 30 min, and slices were subsequently reperfused with normal ACSF for 40 min. N,N,N′,N′-tetrakis(2-pyridylmethyl)ethylenediamine (TPEN), a membrane-permeable Zn2+ chelator, was administered in the perfusate–ACSF at a concentration of 100 μm during reperfusion as indicated.
Cell viability analysis.
To analyze cell death resulting from ischemia and reperfusion and to assess the effect of [Zn2+]i chelation on cell survival, slices were divided into three groups the same way in each of four iterations: control, ischemia, and ischemia with TPEN. After their respective treatments, as detailed below, slices were stained with propidium iodide (PI). The control groups were equilibrated and maintained in room-temperature ACSF bubbled with oxygen for 3 h. The ischemic groups were equilibrated in room-temperature ACSF for 30 min after slicing, subjected to 30 min oxygen–glucose-deprived insult, and reperfused in normal ACSF for 2 h. The TPEN/ischemia groups were equilibrated in room-temperature ACSF for 30 min, exposed to 100 μm TPEN/oxygen–glucose-deprived ACSF for 30 min, and reperfused with 100 μm TPEN/normal ACSF for 2 h. The implementation of a 2 h post-insult time duration was used to allow sufficient time for membrane damage to register and promote the detection of ischemically damaged cells by PI. PI staining was performed by incubating the sections with PI (5 μg/ml in ACSF) for 30 min at room temperature after the respective treatments. PI fluorescence (excitation, 545 nm; emission, 645 nm) was analyzed and expressed as relative fluorescent intensity differences between experimental groups and control groups. PI fluorescence was recorded using a Zeiss Axiovert LSM 510 inverted microscope (laser scanning microscope). A one-way ANOVA was used to analyze the relative fluorescent intensity differences between the three groups tested, and a two-tailed t test was used as a test for significance (α = 0.01).
Colocalization analysis.
Colocalization of PI and NG staining was accomplished by performing two-channel laser scans of slices using confocal microscopy. A 488 nm krypton argon laser line was used for excitation of NG with a 505 nm emission filter. A 545 nm helium neon laser line with an excitation filter of 545 nm was used for excitation of PI with a 645 nm emission filter. After scanning, Zeiss imaging software produced single-channel results and a composite image compiled by fluorescent overlay. Colocalization experiments were conducted with minimal laser intensity and exposure time to minimize photobleaching.
Data analyses.
For time-lapse ischemia experiments, baseline intensity was recorded and expressed as the mean stable fluorescence intensity of a slice region over the 10–20 min period preceding oxygen–glucose-deprived perfusion. Background intensity was determined from tissue-free regions (i.e., next to the slice) in images, and this background was subtracted from baseline recordings. Oxygen–glucose-deprived and reperfusion-induced fluorescence change for each individual slice region was expressed as the change in fluorescence intensity relative to the baseline signal of each region. For time-lapse recordings, the effect of photobleaching was corrected by applying a least-squares curve-fit regression function derived from measurements of extended baseline slice behavior (data not shown) recorded from control experiments in which ischemia was not induced. Changes in cell fluorescence intensity were measured through simple two-group comparisons and analyzed by Student's paired t tests (α = 0.05) or single-factor ANOVA.
Materials.
The fluorescent dyes Calcium Green-1 AM, NG DCF diacetate, TPEN, and Pluronic F-127 (20% w/v in DMSO) were obtained from Invitrogen (Carlsbad, CA). All other chemicals were obtained from Sigma or Fluka.
Results
Intracellular Zn2+ transients during ischemia, as simulated by OGD and reperfusion
Intracellular Zn2+ elevation during OGD and reperfusion
In this study, we loaded hippocampal slices with the Zn2+-selective fluorescent indicator NG diacetate ester to determine and to characterize increases in intracellular Zn2+. Another reason for choosing NG for this study is that its fluorescence is not appreciable in the presence of physiological levels of Ca2+ and Mg2+ (Canzoniero et al., 1999; Li et al., 2001a,b; Martin et al., 2006). This property in a Zn2+ indicator is critical for this experiment, particularly in differentiating Zn2+ signals from Ca2+ signals. The CA1 region of the hippocampus was chosen as the region of interest because of its increased vulnerability to ischemic damage when compared with other regions and because it has been studied extensively. After recording baseline fluorescence, hippocampal slices were subjected to 30 min of OGD. A duration of 30 min OGD was chosen because [Zn2+]i reached a maximum concentration after a prolonged exposure of 30–40 min (Wei et al., 2004). The oxygen–glucose-deprived exposures were followed by reperfusion with normal oxygenated ACSF. The data indicated gradual increases in [Zn2+]i with increasing oxygen–glucose-deprived time. Subsequent reperfusion resulted in an additional increase in intracellular Zn2+ (Fig. 1). The amplitudes of fluorescence intensity were depicted in arbitrary units, and were measured from the baseline to the peak of fluorescent responses. The amplitudes were 6.6 ± 1.1 (mean ± SE) in OGD and 16.3 ± 1.7 (mean ± SE) in reperfusion; fluorescent values were significantly higher in reperfusion (p < 0.01; n = 10).
Figure 1.
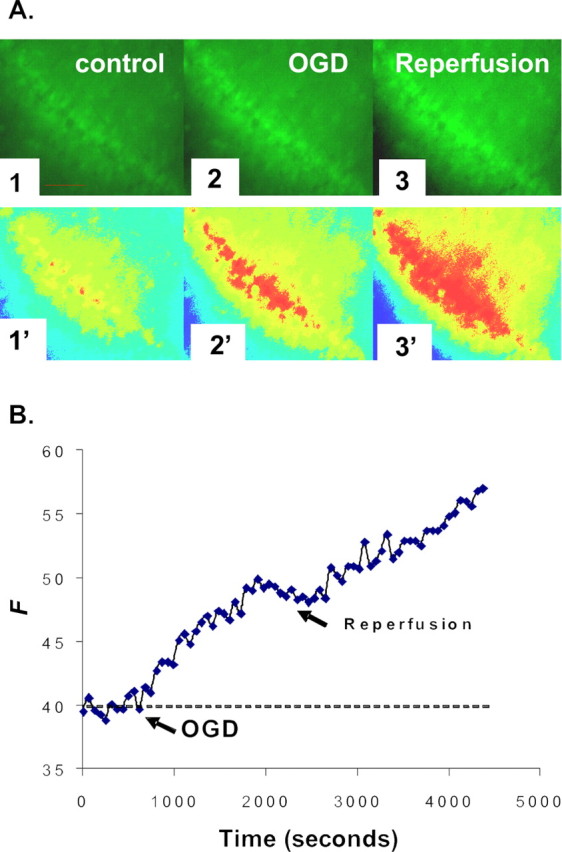
NG detection of [Zn2+]i increase during OGD and reperfusion. A, Images of the CA1 region of a hippocampal slice preloaded with NG diacetate ester as described in Materials and Methods. The fluorescence intensities of CA1 pyramidal cells were examined for at least 10 min before (1), during (2), and after (3) perfusion with oxygen–glucose-deprived ACSF bubbled with 95% N2/5% CO2. The oxygen–glucose-deprived insult was administered for 30 min, and the slice was reperfused with normal oxygenated ACSF for 40 min. Images 1′–3′ are pseudocolor images of images 1–3. Scale bars, 100 μm. B, A representative graph shows the measured change of NG fluorescence intensity, indicating increases in intracellular Zn2+ during the course of OGD and reperfusion. Arrows show the start of OGD-simulated ischemia and reperfusion, respectively. The y-axis represents the fluorescence emission intensity of the dye/ion complex in arbitrary units.
Nitric oxide induced the increase in [Zn2+]i in neurons
Figure 2 shows evidence that nitric oxide (NO) can induce accumulation of [Zn2+]i. The application of the NO donor (Fig. 2A,C), spermine-NONOate, released exogenous NO and resulted in Zn2+-specific fluorescence increase. When 500 μm spermine-NONOate was dissolved, NO was liberated in a time-dependent manner (5–10 min.), leaving the polyamine, spermine, as a by-product. Control tests were done with spermine (500 μm, 20 min) to ensure that the Zn2+ release by spermine-NONOate resulted from the action of NO itself, and not a property of the polyamine remaining after the liberation of NO. There was no change of NG fluorescence in control hippocampal slices incubated in the presence or in the absence of spermine (Fig. 2B,D). Spermine-NONOate produced a significant enhancement in [Zn2+]i detected with NG, suggesting a mechanism for the regulation of Zn2+ homeostasis under OGD and reperfusion. These data support NO as a causal agent in the fluorescence changes, as has been documented previously (Cuajungco and Lees, 1998; Frederickson et al., 2002; Bossy-Wetzel et al., 2004). Furthermore, these results support the previous observation that the NO synthase inhibitor L-NAME inhibited 60–70% of the accumulation of Zn2+ in both OGD and reperfusion (Wei et al., 2004).
Figure 2.

Spermine-NONOate, an NO donor, produces a significant enhancement in [Zn2+]i. A, Images indicate that NO released from spermine-NONOate caused an increase in [Zn2+]i detected with NG in the CA1 region of a hippocampal slice. The left image (1) is the control. The middle (2) and right (3) images were taken 10 and 20 min, respectively, after the start of perfusion with spermine-NONOate. P, Pyramidal cell layer. Scale bars, 100 μm. B, Images of the control experiment with spermine showing no change in NG fluorescence in the absence of spermine (1) or in the presence of 500 μm spermine (2). KCl (60 mm), which increased the fluorescence (3), was applied at the end of the experiment to verify the viability of the hippocampal slice. Scale bars, 100 μm. C, An individual graph shows that NO increased in [Zn2+]i detected with NG. D, A graph shows that spermine does not increase NG fluorescence in control hippocampal slices.
Elevated Zn2+ contributes to signals previously interpreted as Ca2+ under ischemic conditions
Selectivity of Ca2+ fluorescent indicator Calcium Green-1
Although most Ca2+ indicators have a higher affinity for Zn2+ than for Ca2+ (Grynkiewicz et al., 1985; Tsien and Pozzan, 1989), it has been assumed that the presence of physiologically relevant Ca2+ in the sample will prevent Zn2+ from binding to fluorescent Ca2+ indicators, possibly by surrounding the indicator with a sufficient number of Ca2+ molecules. We investigated metal ion responses by screening Calcium Green-1 for Zn2+ in physiological solutions containing various metal ion concentrations (Martin et al., 2006). We also studied Zn2+ selectivity over Ca2+ by the measurement of Zn2+ responses in the presence of a relatively large Ca2+ concentration. Even when saturating the probe with Ca2+ before the addition of Zn2+, the indicator continued to report zinc concentrations with fidelity. Our recent work (Martin et al., 2006) shows how Calcium Green-1, a widely used fluorescent calcium indicator, was still capable of detecting Zn2+ in the presence of a physiologically relevant Ca2+ concentration (2 mm). In these experiments, the baseline fluorescence was set after the addition of Ca2+ and was readjusted before adding Zn2+ to account for the background fluorescence caused by Ca2+. There was no difference in the concentration–response relationship to Zn2+ sensing obtained with or without Ca2+ being present. These data show these fluorescent Ca2+ probes to be sensitive to Zn2+, in such a way that the presence of physiological Ca2+ minimally disturbs their response to changes in [Zn2+].
Calcium Green-1 is a fluorescent indicator designed to bind free Ca2+ ions and fluoresce. This binding is considered to be mediated by the lone pair of electrons from four carboxylate oxygens and two nitrogen atoms of its 1,2-bis(o-aminophenoxy)ethane N,N,N′,N′-tetraacetic acid (BAPTA) motif. It is known that such tetracarboxylate Ca2+ indicators also bind to zinc ions, and empirically, if Ca2+ and Zn2+ compete for a binding site on Calcium Green-1, then one would expect not to see a change in fluorescence as Zn2+ is added to a Ca2+/Calcium Green-1 solution. However, this is not the case; our Calcium Green-1 fluorescence for Zn2+ and Ca2+ detection indicates that the molecule can continue to detect changes in Zn2+ even when [Ca2+] is two orders of magnitude larger than the KD. To explore our observations of the interactions of Calcium Green-1 with Zn2+, we used molecular mechanical methods to model the binding dynamics of the indicator (data not shown). Our model showed that additional coordination of a Zn2+ ion to the carboxylate oxygen and the amide carbonyl on the central ring of the indicator may occur even when Ca2+ is already bound. Such binding created a Zn2+-carboxylate in the syn configuration, the dominant mode of bonding interaction seen in carboxylate metal–ligand interaction (Holm et al., 1996). The second bond interaction through the amide carbonyl oxygen atom is in agreement with sites of amide–metal ion coordination in many proteins (Holm et al., 1996). In this model, the bond distance is 2.51 Å, which is greater than the average Zn-donor atom distance, although 2.5 Å is considered the average bond distance for Zn–OGlutamate interaction (Hammes and Carrano, 1999). This bond distance of 2.51 Å is also seen in the transition state of farnesyltransferase, a zinc metalloenzyme (Sousa et al., 2005). All molecular calculations were performed using ArgusLab 4.0 (Planaria Software, Seattle, WA).
Fluorescent Ca2+ probe detecting cellular Zn2+
Next, we studied whether a commonly used fluorescent Ca2+ indicator such as Calcium Green-1 can detect Zn2+ in situ. To test this speculation, cultured neurons were preloaded with Calcium Green-1 AM and placed in a recording chamber on the microscope stage with continuous perfusion of ACSF (without added Ca2+). To investigate whether Zn2+ can be detected in situ with a fluorescent Ca2+ probe, 300 μm Zn2+ and 100 μm Na-pyrithione, a Zn2+ ionophore that facilitates ion influx into cells, were added to the perfusate. In the presence of Zn2+ alone, minimal change of intracellular fluorescence of Calcium Green-1 was observed (Fig. 3B). Pyrithione, when administered alone without Zn2+, also resulted in minimal change of fluorescence. Increases in [Zn2+]i were detected when both Zn2+ and pyrithione were perfused, and the fluorescent signal was reversible with the addition of TPEN, a membrane-permeable Zn2+ chelator. TPEN (Fig. 3A) has a very high affinity for Zn2+ (KD = 2.6 × 10⁻¹⁶ m) but a relatively low affinity for Ca2+ (KD = 4.0 × 10⁻⁵ m) and Mg2+ (KD = 2.0 × 10⁻² m). This result indicated that the influx of Zn2+ and a rise in [Zn2+]i changed the fluorescent intensity of Calcium Green-1 and demonstrated that these fluorescent Ca2+ indicators can effectively measure the dynamic change of cytosolic Zn2+ in situ.
Calcium Green-1 AM detection of [Zn2+]i increase during ischemia and reperfusion
Our results raise the important issue of whether Zn2+ transients can contribute to the Ca2+ transients conventionally detected with fluorescent probes. This question has become logical recently because growing evidence has demonstrated an increase in [Zn2+]i in concomitance with various neural activities (Frederickson et al., 2005) (Fig. 1). When the hippocampal slice was loaded with cell-permeable Calcium Green-1, as expected, a steady increase in fluorescence intensity was detected during OGD and reperfusion (Fig. 4). Because Calcium Green-1 is also sensitive to Zn2+, as indicated above, we examined the extent to which Zn2+ signals contributed to the Ca2+ signal. The zinc chelator TPEN was then added at the peak of the fluorescence intensity to reveal the Zn2+ signal component. In these experiments, the addition of TPEN after reperfusion with normal ACSF reduced the amplitude of Calcium Green-1 fluorescence. The peak fluorescence intensity in arbitrary units was 10.3 ± 2.03 (mean ± SE) in OGD, 16.78 ± 2.78 (mean ± SE) in reperfusion, and 4.44 ± 2.52 (mean ± SE) in TPEN (p < 0.01 compared with baseline value; n = 9). TPEN did not always diminish the fluorescence to the baseline value. The remaining fluorescence in the presence of TPEN may be the Ca2+ component. These data show that Zn2+ ions contribute significantly to rising fluorescence intensity measured with Ca2+ indicators in OGD and reperfusion.
Figure 4.
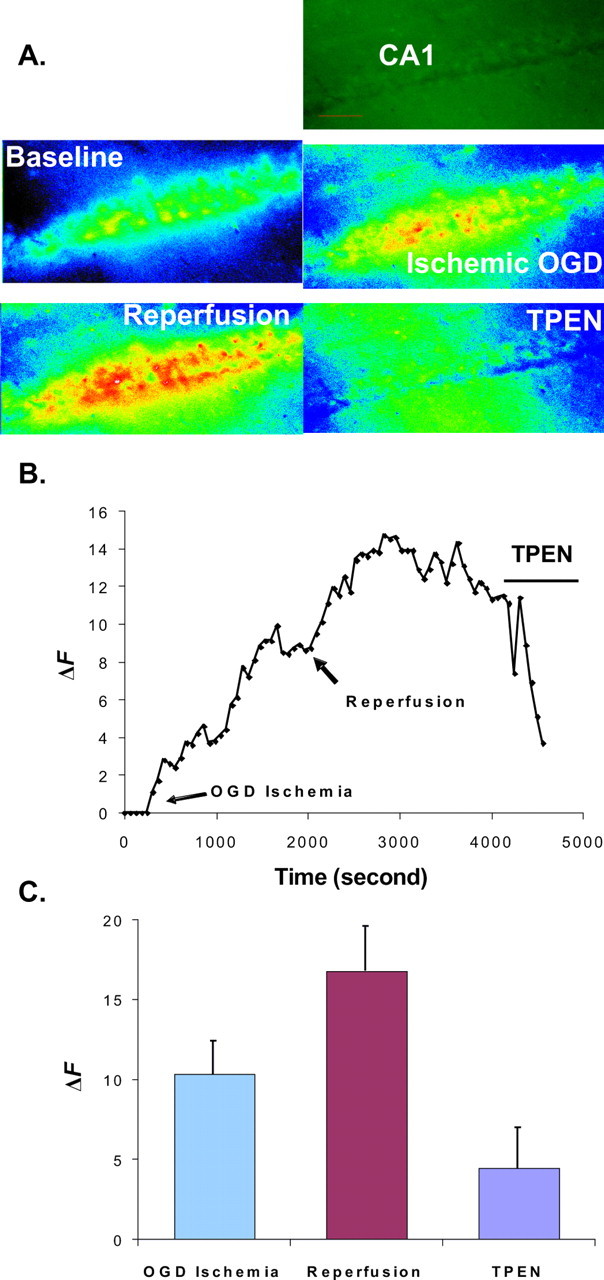
Calcium Green-1 detects [Zn2+]i elevation during ischemia and reperfusion. A, Sequential pseudocolor images of the CA1 region of a hippocampal slice loaded with cell-permeable Calcium Green-1 taken at baseline, OGD, reperfusion, and with the addition of 100 μm TPEN. Images were taken through a 10× Plan-Neofluar objective. The first image is an original image of the baseline. B, Graph showing the typical increases in Calcium Green-1 fluorescence during OGD and reperfusion in a rat hippocampal slice. Arrows show the start of OGD-simulated ischemia and reperfusion, followed by the addition of 100 μm TPEN. TPEN reduced fluorescence intensity. C, Histogram showing the relative fluorescent changes during ischemia, reperfusion, and the addition of TPEN (means ± SE; n = 9). The y-axes in B and C represent the fluorescence emission intensity (F) of the dye/ion complex minus the fluorescence of the baseline (F0). ΔF = F − F0.
Elevated Zn2+ is a major factor in neuronal cell death during ischemic stroke
TPEN prevents pyramidal neurons from sustaining ischemic damage
We examined the extent of CA1 pyramidal neuronal injury resultant after oxygen–glucose-deprived exposure. These experiments used the fluorescent cell-death marker PI to assess injury. PI is a cell membrane-impermeant dye that becomes brightly fluorescent after binding to DNA in dead cells. It enters injured neurons in which the plasma membrane is disrupted and is shown to preferentially accumulate in the nucleus of dying neurons. Hippocampal slices were grouped into control (incubation with normal ACSF), OGD/reperfusion (30 min OGD), and TPEN-treated groups. After OGD, the slices were incubated for 2 h in oxygenated media. In the TPEN treatment groups, TPEN was present in the perfusate of OGD and reperfusion and was then withdrawn from ACSF 30 min after reperfusion. The slices in the control groups were incubated in normal ACSF for the same time duration as both of the other groups. PI was added during the final 30 min of the incubation, followed by fixation and subsequent visualization of PI fluorescence using confocal microscopy. Images were obtained deep (75–100 μm) within the slice, where injury resulting from the trauma of slicing is minimized. A set of examinations was stopped if >5% of cells stained in the control slice. Figure 5 shows that little PI fluorescence was seen in pyramidal cell layers of the control group, but a strong signal was present in the OGD/reperfusion group. Subsequent experiments examined the effect of TPEN on the extent of pyramidal neuronal injury resulting from oxygen–glucose-deprived exposure. PI labeling was decreased significantly (p < 0.05; n = 6 slices per group) by TPEN. Post hoc analysis using the Bonferroni method showed the ischemia group to be different from the TPEN and control groups (95% confidence level). Expressed as percentage difference of fluorescence intensity from control (control intensity considered to be 1.0, or 100%), the OGD/reperfusion group was measured at 2.07 times higher average fluorescence or 207% of control, and the TPEN treatment during OGD/reperfusion was measured at 1.22 times average higher fluorescence or 122% of control. These observations indicate that the Zn2+ buildup in pyramidal neurons during OGD and reperfusion is a causal factor in the resultant ischemic injury. Furthermore, the removal of [Zn2+]i by chelation prevents pyramidal neurons from sustaining extensive ischemic damage.
Figure 5.
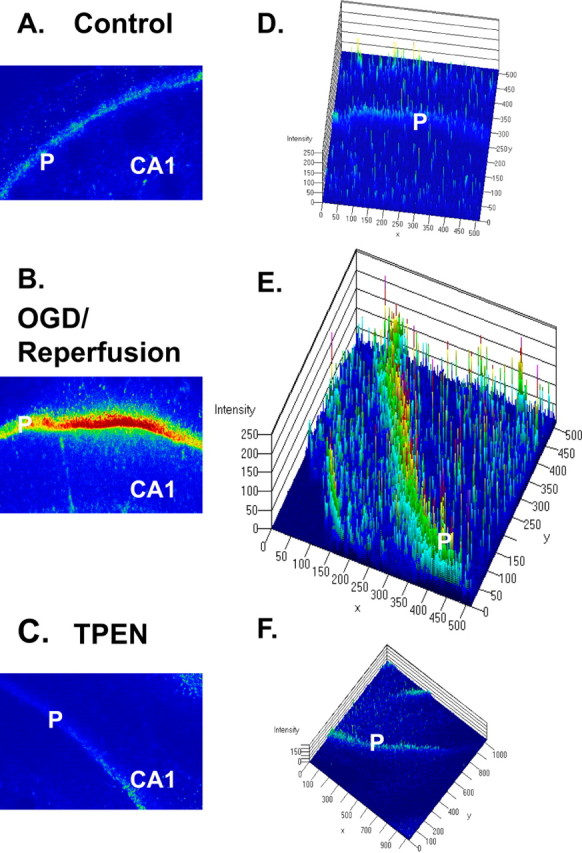
PI-stained photomicrographs by confocal microscopy show PI staining of degenerating neurons after OGD and reperfusion in the CA1 region of hippocampus. A–C, Images of the CA1 region acquired with confocal microscopy. Images were taken through a 10× Plan-Neofluar objective. P, Pyramidal cell layer. D–F, Three-dimensional analyses with LSM 5 Image software (Carl Zeiss AIM; Zeiss). The fluorescence intensity is analyzed against distance of the slice in two dimensions. Little PI fluorescence was seen in pyramidal cell layers of the normal condition (A, D), but a strong signal was present in the condition of OGD/reperfusion (B, E). Strong PI labeling was prevented by the addition of 100 μm TPEN in ACSF (C, F).
Colocalization of the increase in [Zn2+]i and neuronal cell death
In a separate experiment, cell viability was comparatively determined with dual staining of PI and cell-impermeant NG in hippocampal slices that were subjected to OGD/reperfusion. When viewed using a fluorescence microscope (645 nm filter), cells that lost membrane integrity showed contrasting red PI staining throughout the nuclei (Fig. 6A) in the same tissue sections that also stained initially with cell-impermeant NG (Fig. 6B). Therefore, the dual fluorescent staining, or colocalization, of PI and NG staining showed agreement between endogenous increases in [Zn2+]i and indications of neuronal damage (Fig. 6C) with Pearson's correlation coefficient r = .743 (n = 28) (Stork and Li, 2006). These data suggested that cells labeled with NG were damaged and becoming necrotic or undergoing apoptotic cell death. Signal overlap was ruled out as a factor responsible for the higher intensity of NG nuclear fluorescence by examining slices stained only with PI and performing scans using the same NG examination parameters as during colocalization experiments; results showed only minimal background intensity. Conversely, using excitation and emission wavelengths for NG, we did not observe PI staining (data not shown) in slices stained only with PI.
Figure 6.

Microscopic fluorescence images of rat hippocampal sections stained with PI and NG. Images of pyramidal cells of a hippocampal CA1 section after OGD and reperfusion viewed at 40× are shown. A, PI-stained nuclei red with emission at 630 nm. B, NG-stained cell bodies green with emission at 505 nm. C, Composite overlay fluorescence images showing colocalization of PI nuclei within cell bodies labeled with NG. Scale bars, 20 μm.
Discussion
First, our results indicate that there is a rapid Zn2+ accumulation in acute rat hippocampus slices during OGD and reperfusion, which demonstrates that the divalent cation Zn2+ accumulates in concomitance with cerebral ischemic insults. The second, and major, finding is that intracellular Zn2+ elevation can contribute to signals previously interpreted as Ca2+ overload conventionally identified by using “Ca2+-specific” fluorescent indicators. Finally, the progressive rise in [Zn2+]i levels during ischemic insult corresponds with neuronal death in the hippocampal slice, and Zn2+ chelation prevents hippocampal neurons from developing injury during OGD/reperfusion.
Fluorescent Ca2+ probes
Most of these fluorescent indicators are derivatives of the Ca2+ chelators BAPTA, EGTA, and aminophenol triacetic acid (APTRA) (Tsien and Pozzan, 1989; Haugland, 2001), which also bind Zn2+ with significantly higher affinity. The KD values of BAPTA are as follows (Grynkiewicz et al., 1985; Haugland, 2001): Ca2+, 160 nm; Zn2+, 8.nm. The KD values of EGTA are as follows: Ca2+, 0.38 nm; Zn2+, 7.8 pm. The KD values of APTRA are as follows: Ca2+, 12 μm; Zn2+, 19 nm. Therefore, a critically relevant fact, often ignored in the past, is that almost all Ca2+ fluorescent indicators are also sensitive to Zn2+ with an even higher affinity. For example, Zn2+ binds to most BAPTA-based Ca2+ indicators with substantially higher affinity than Ca2+. Calcium Green-1, a widely used Ca2+ indicator, uses the BAPTA chelator motif, which is shown to bind Zn2+ with a KD that is nearly two orders of magnitude lower (higher affinity) than that of Ca2+ (see above). As another example, the ubiquitous Ca2+ indicator fura-2 exhibits a KD for Zn2+ (in the absence of Ca2+) of 3 nm (Grynkiewicz et al., 1985; Haugland, 2001).
We have tested the responses of BAPTA-based Ca2+ indicators, including Calcium Green-1, fluo-3, and fura-2 to a series of concentrations of Ca2+ or Zn2+ in a physiological saline (ACSF). All three probes showed an affinity for both Ca2+ and Zn2+, and the response curves representing detection parameters for each divalent ion were very similar (Martin et al., 2006). Fura-2, because of its sensitivity to Zn2+, has even been used to detect intracellular Zn2+ influx via voltage-gated Ca2+ channels (Atar et al., 1995; Aizenman et al., 2000). Although it has been recognized that most Ca2+ indicators have a higher affinity toward Zn2+ rather than Ca2+, it has been assumed that the presence of physiologically relevant Ca2+ in the sample will prevent Zn2+ from binding to fluorescent Ca2+ indicators, possibly by surrounding the indicator with a sufficient number of molecules of Ca2+. As our previous experiments showed, not only are these fluorescent Ca2+ probes sensitive to Zn2+, but the presence of physiologically relevant Ca2+ minimally perturbs their response to Zn2+ (Martin et al., 2006). The evidence clearly supports the use of such probes as effective and efficient Zn2+ indicators. Results such as these reinforce the necessity for a reanalysis of the evidence in which the ionic identities responsible for Ca2+ signals under conditions in which causality has been derived from the detection of Ca2+ by fluorescent indicators.
The binding affinities of Ca2+ and Zn2+ for Calcium Green-1 may be a critical factor in interpreting the data presented in this study. Evidence on the binding activity of 5-F-BAPTA (a chelator very closely related to the BAPTA group of Calcium Green-1) presented by Csermely et al. (1989) describes a large difference in the binding lifetimes of Zn2+ and Ca2+. They found that Ca2+ binding occurs with a lifetime of ∼5 ms, whereas it was found that Zn2+-binding lifetimes lasted approximately five to six times longer, ∼32 ms (Csermely et al., 1989). Considering that the energy transitions that produce fluorescence occur when the fluorophore is in the bound state, and that photons are produced during a given binding according to duration of binding, the much longer lifetime of a Zn2+–Calcium Green-1 complex would be expected to result in an increased photon emission for a given binding event and would necessarily be interpreted as an increased intensity of emission. Second, our molecular modeling indicates the possibility of an alternate Zn2+-binding mechanism occurring when Calcium Green-1 is already bound to Ca2+ (see Results).
Zn2+ overload versus Ca2+ overload
Since the theory of calcium mediated excitotoxicity was introduced, large volumes of fluorescent-based evidence has supported this notion of [Ca2+]i elevation during and after ischemic insult. However, therapeutic strategies based on calcium antagonism have met with little success (National Institute of Neurological Disorders and Stroke, 2002). Although transition metal cations like Zn2+ can dominate Ca2+ measurements made with fluorescent indicators and although the Zn2+ sensitivity of fluorescent Ca2+ probes such as fura-2 and Calcium Green-1 has been reported in detail previously (Grynkiewicz et al., 1985; Tsien and Pozzan, 1989), the information concerning Zn2+ sensitivity has essentially been ignored. This has led to the status quo, in which Zn2+ has received comparatively far less study in physiological systems. It has been believed that intracellular concentrations of Zn2+, a trace element in the biological system, are very low (Haugland, 2001).
The present study shows that the calcium indicator Calcium Green-1 detects [Zn2+]i elevation during in vitro ischemia and that chelation of [Zn2+]i during ischemia and reperfusion results in reduced cellular death. Because both Zn2+ and Ca2+ appear to be “overloaded” in ischemia and reperfusion, we ask why there are two such similar signals and what the relationship is between them in ischemia and reperfusion. When hippocampal slices were loaded with cell-permeable Calcium Green-1, as expected, a steady increase in fluorescence intensity was detected during OGD and reperfusion. Application of the selective Zn2+ chelator TPEN diminishes the Calcium Green-1 fluorescence during OGD and reperfusion. These data strongly suggest that Zn2+ contributes predominantly to rising fluorescence intensity measured with Ca2+ indicators in OGD and reperfusion. Furthermore, the data from Zn2+ chelation revealed that Ca2+ signals detected with fluorescent Ca2+ indicators are less significant than previously thought. If results previously attributed to Ca2+ could, in part, be attributed to Zn2+, then the “calcium overload” that has been described in the past, using Ca2+-sensitive indicators, needs to be re-examined to determine whether Ca2+ signals are, in fact, a cause of neuronal damage. Such evidence shows the urgent need for the development of truly selective fluorescent Ca2+ indicators, which we consider integral to furthering the understanding of the role that Ca2+ plays in cellular signaling and pathology.
Zinc homeostasis
It is well known that 85–90% of Zn2+ in the body is tightly bound to proteins and is composed mostly of metalloenzyme- and metalloprotein-bound zinc (Choi and Koh, 1998). Metallothioneins can serve as intracellular reservoirs for release of Zn2+ during signaling or during deficiency states. Recently, evidence from our group and others suggested that the reactive-free radical species NO may be involved in the regulation of Zn2+ homeostasis (Cuajungco and Lees, 1998; Snider et al., 2000; Frederickson et al., 2002; St Croix et al., 2002; Bossy-Wetzel et al., 2004; Wei et al., 2004; Zhang et al., 2004). In particular, results in which the NO synthase inhibitor L-NAME reduced 60–70% of the accumulation of Zn2+ in both OGD and reperfusion (Wei et al., 2004) show significant support for this theory. Additionally, the present study shows that NO directly liberates Zn2+ from its intracellular stores (Fig. 2). The mechanism of NO-mediated Zn2+ release is not entirely understood, but evidence points toward a release from metallothionein and zinc-finger proteins by S-nitrosylation of cysteine clusters that bind Zn2+ (Aravindakumar et al., 1999; Maret et al., 1999; Hong and Maret, 2003). In addition to metallothioneins, Zn2+ can be also released from a specific subset of glutamatergic nerve terminals throughout the mammalian cortex of the brain. The released Zn2+ has been shown to then translocate into postsynaptic neurons through Zn2+-permeable channels (Li et al., 2001b, 2003), thereby creating a [Zn2+]i transient. Free intracellular Zn2+ can produce mitochondrial membrane permeability transitions, inhibit respiratory complex I, and cause cytochrome c release (considered a critical step leading toward apoptosis) (Noh et al., 1999; Truong-Tran et al., 2001; Dineley et al., 2003; Bossy-Wetzel et al., 2004). Because it is well known that NO is generated during ischemia and reperfusion (Beckman, 1991; Moncada and Higgs, 1993; Dawson and Dawson, 2000), these results suggest that NO may be involved in the release of Zn2+during ischemia and reperfusion.
Conclusion
It is known that changes in ionic concentration have a fundamental effect on numerous physiological processes related to brain function. Given the results presented in this study, we are convinced that only when truly selective Ca2+ probes are developed can investigators unmitigatingly define the role of Ca2+ signaling in biological processes. On the other hand, the indications that both Zn2+ and Ca2+ appear to be overloaded in ischemic conditions should compel more studies to address the distinctions between Zn2+ and Ca2+. Are there redundant roles and/or separable roles for Ca2+ and Zn2+, and what are these specific functions? We hope that additional investigations with the current results in mind can lead to the realignment of current thinking and the production of a workable ischemic therapy.
Footnotes
This work was supported in part by grants from the American Heart Association (Y.V.L.) and the National Institutes of Health (Y.V.L). We thank Klaus Himmeldirk for critical comments on the molecular modeling of fluorescent indicators and Rengarajan Balaji for review of this manuscript.
References
- Aizenman E, Stout AK, Hartnett KA, Dineley KE, McLaughlin B, Reynolds IJ. Induction of neuronal apoptosis by thiol oxidation: putative role of intracellular zinc release. J Neurochem. 2000;75:1878–1888. doi: 10.1046/j.1471-4159.2000.0751878.x. [DOI] [PubMed] [Google Scholar]
- Aravindakumar CT, Ceulemans J, De Ley M. Nitric oxide induces Zn2+ release from metallothionein by destroying zinc-sulphur clusters without concomitant formation of S-nitrosothiol. Biochem J. 1999;344:253–258. doi: 10.1042/0264-6021:3440253. [DOI] [PMC free article] [PubMed] [Google Scholar]
- Atar D, Backx PH, Appel MM, Gao WD, Marban E. Excitation-transcription coupling mediated by zinc influx through voltage-dependent calcium channels. J Biol Chem. 1995;270:2473–2477. doi: 10.1074/jbc.270.6.2473. [DOI] [PubMed] [Google Scholar]
- Beckman JS. The double-edged role of nitric oxide in brain function and superoxide-mediated injury. J Dev Physiol. 1991;15:53–59. [PubMed] [Google Scholar]
- Benveniste H, Jorgensen MB, Diemer NH, Hansen AJ. Calcium accumulation by glutamate receptor activation is involved in hippocampal cell damage after ischemia. Acta Neurol Scand. 1988;78:529–536. doi: 10.1111/j.1600-0404.1988.tb03697.x. [DOI] [PubMed] [Google Scholar]
- Berridge MJ. Neuronal calcium signaling. Neuron. 1998;21:13–26. doi: 10.1016/s0896-6273(00)80510-3. [DOI] [PubMed] [Google Scholar]
- Bossy-Wetzel E, Talantova MV, Lee WD, Scholzke MN, Harrop A, Mathews E, Gotz T, Han J, Ellisman MH, Perkins GA, Lipton SA. Crosstalk between nitric oxide and zinc pathways to neuronal cell death involving mitochondrial dysfunction and p38-activated K+ channels. Neuron. 2004;41:351–365. doi: 10.1016/s0896-6273(04)00015-7. [DOI] [PubMed] [Google Scholar]
- Canzoniero LM, Turetsky DM, Choi DW. Measurement of intracellular free zinc concentrations accompanying zinc-induced neuronal death. J Neurosci. 1999;19:RC31. doi: 10.1523/JNEUROSCI.19-19-j0005.1999. (1–6) [DOI] [PMC free article] [PubMed] [Google Scholar]
- Choi DW, Koh JY. Zinc and brain injury. Annu Rev Neurosci. 1998;21:347–375. doi: 10.1146/annurev.neuro.21.1.347. [DOI] [PubMed] [Google Scholar]
- Clapham DE. Calcium signaling. Cell. 1995;80:259–268. doi: 10.1016/0092-8674(95)90408-5. [DOI] [PubMed] [Google Scholar]
- Csermely P, Sandor P, Radics L, Somogyi J. Zinc forms complexes with higher kinetical stability than calcium, 5-F-BAPTA as a good example. Biochem Biophys Res Commun. 1989;165(2):838–844. doi: 10.1016/s0006-291x(89)80042-7. [DOI] [PubMed] [Google Scholar]
- Cuajungco MP, Lees GJ. Nitric oxide generators produce accumulation of chelatable zinc in hippocampal neuronal perikarya. Brain Res. 1998;799:118–129. doi: 10.1016/s0006-8993(98)00463-6. [DOI] [PubMed] [Google Scholar]
- Dawson VL, Dawson TM. Neuronal ischaemic preconditioning. Trends Pharmacol Sci. 2000;21:423–424. doi: 10.1016/s0165-6147(00)01560-1. [DOI] [PubMed] [Google Scholar]
- Dineley KE, Votyakova TV, Reynolds IJ. Zinc inhibition of cellular energy production: implications for mitochondria and neurodegeneration. J Neurochem. 2003;85:563–570. doi: 10.1046/j.1471-4159.2003.01678.x. [DOI] [PubMed] [Google Scholar]
- Frederickson CJ, Cuajungco MP, LaBuda CJ, Suh SW. Nitric oxide causes apparent release of zinc from presynaptic boutons. Neuroscience. 2002;115:471–474. doi: 10.1016/s0306-4522(02)00399-8. [DOI] [PubMed] [Google Scholar]
- Frederickson CJ, Koh JY, Bush AI. The neurobiology of zinc in health and disease. Nat Rev Neurosci. 2005;6:449–462. doi: 10.1038/nrn1671. [DOI] [PubMed] [Google Scholar]
- Grynkiewicz G, Poenie M, Tsien RY. A new generation of Ca2+ indicators with greatly improved fluorescence properties. J Biol Chem. 1985;260:3440–3450. [PubMed] [Google Scholar]
- Hammes BS, Carrano CJ. Synthesis and characterization of pseudotetrahedral N(2)O and N(2)S zinc(II) complexes of two heteroscorpionate ligands: models for the binding sites of several zinc metalloproteins. Inorg Chem. 1999;38:4593–4600. doi: 10.1021/ic990233v. [DOI] [PubMed] [Google Scholar]
- Haugland HP. Handbook of fluorescent probes and research chemicals. Ed 6. Eugene, OR: Molecular Probes; 2001. [Google Scholar]
- Holm RH, Kennepohl P, Solomon EI. Structural and functional aspects of metal sites in biology. Chem Rev. 1996;96:2239–2314. doi: 10.1021/cr9500390. [DOI] [PubMed] [Google Scholar]
- Hong SH, Maret W. A fluorescence resonance energy transfer sensor for the beta-domain of metallothionein. Proc Natl Acad Sci USA. 2003;100:2255–2260. doi: 10.1073/pnas.0438005100. [DOI] [PMC free article] [PubMed] [Google Scholar]
- Koh JY, Suh SW, Gwag BJ, He YY, Hsu CY, Choi DW. The role of zinc in selective neuronal death after transient global cerebral ischemia. Science. 1996;272:1013–1016. doi: 10.1126/science.272.5264.1013. [DOI] [PubMed] [Google Scholar]
- Lee JM, Zipfel GJ, Park KH, He YY, Hsu CY, Choi DW. Zinc translocation accelerates infarction after mild transient focal ischemia. Neuroscience. 2002;115:871–878. doi: 10.1016/s0306-4522(02)00513-4. [DOI] [PubMed] [Google Scholar]
- Li Y, Hough CJ, Frederickson CJ, Sarvey JM. Induction of mossy fiber→Ca3 long-term potentiation requires translocation of synaptically released Zn2+ J Neurosci. 2001a;21:8015–8025. doi: 10.1523/JNEUROSCI.21-20-08015.2001. [DOI] [PMC free article] [PubMed] [Google Scholar]
- Li Y, Hough CJ, Suh SW, Sarvey JM, Frederickson CJ. Rapid translocation of Zn(2+) from presynaptic terminals into postsynaptic hippocampal neurons after physiological stimulation. J Neurophysiol. 2001b;86:2597–2604. doi: 10.1152/jn.2001.86.5.2597. [DOI] [PubMed] [Google Scholar]
- Li YV, Hough CJ, Sarvey JM. Do we need zinc to think? Sci STKE 2003. 2003:pe19. doi: 10.1126/stke.2003.182.pe19. [DOI] [PubMed] [Google Scholar]
- Lobner D, Canzoniero LM, Manzerra P, Gottron F, Ying H, Knudson M, Tian M, Dugan LL, Kerchner GA, Sheline CT, Korsmeyer SJ, Choi DW. Zinc-induced neuronal death in cortical neurons. Cell Mol Biol (Noisy-le-grand) 2000;46:797–806. [PubMed] [Google Scholar]
- Manev H, Kharlamov E, Uz T, Mason RP, Cagnoli CM. Characterization of zinc-induced neuronal death in primary cultures of rat cerebellar granule cells. Exp Neurol. 1997;146:171–178. doi: 10.1006/exnr.1997.6510. [DOI] [PubMed] [Google Scholar]
- Maret W, Jacob C, Vallee BL, Fischer EH. Inhibitory sites in enzymes: zinc removal and reactivation by thionein. Proc Natl Acad Sci USA. 1999;96:1936–1940. doi: 10.1073/pnas.96.5.1936. [DOI] [PMC free article] [PubMed] [Google Scholar]
- Martin JL, Stork CJ, Li YV. Determining zinc with commonly used calcium and zinc fluorescent indicators, a question on calcium signals. Cell Calcium. 2006;40:393–402. doi: 10.1016/j.ceca.2006.04.008. [DOI] [PubMed] [Google Scholar]
- Moncada S, Higgs A. The l-arginine-nitric oxide pathway. N Engl J Med. 1993;329:2002–2012. doi: 10.1056/NEJM199312303292706. [DOI] [PubMed] [Google Scholar]
- National Institute of Neurological Disorders and Stroke . Report of the Stroke Progress Review Group. Bethesda, MD: 2002. [Google Scholar]
- Nishizawa Y. Glutamate release and neuronal damage in ischemia. Life Sci. 2001;69:369–381. doi: 10.1016/s0024-3205(01)01142-0. [DOI] [PubMed] [Google Scholar]
- Noh KM, Kim YH, Koh JY. Mediation by membrane protein kinase C of zinc-induced oxidative neuronal injury in mouse cortical cultures. J Neurochem. 1999;72:1609–1616. doi: 10.1046/j.1471-4159.1999.721609.x. [DOI] [PubMed] [Google Scholar]
- Paschen W. Glutamate excitotoxicity in transient global cerebral ischemia. Acta Neurobiol Exp (Wars) 1996;56:313–322. doi: 10.55782/ane-1996-1136. [DOI] [PubMed] [Google Scholar]
- Perez Velazquez JL, Frantseva MV, Carlen PL. In vitro ischemia promotes glutamate-mediated free radical generation and intracellular calcium accumulation in hippocampal pyramidal neurons. J Neurosci. 1997;17:9085–9094. doi: 10.1523/JNEUROSCI.17-23-09085.1997. [DOI] [PMC free article] [PubMed] [Google Scholar]
- Snider BJ, Choi J, Turetsky DM, Canzoniero LM, Sensi SL, Sheline CT, Wang X, Yu SP, Choi DW. Nitric oxide reduces Ca(2+) and Zn(2+) influx through voltage-gated Ca(2+) channels and reduces Zn(2+) neurotoxicity. Neuroscience. 2000;100:651–661. doi: 10.1016/s0306-4522(00)00311-0. [DOI] [PubMed] [Google Scholar]
- Sousa SF, Fernandes PA, Ramos MJ. Farnesyltransferase–new insights into the zinc-coordination sphere paradigm: evidence for a carboxylate-shift mechanism. Biophys J. 2005;88:483–494. doi: 10.1529/biophysj.104.048207. [DOI] [PMC free article] [PubMed] [Google Scholar]
- St Croix CM, Wasserloos KJ, Dineley KE, Reynolds IJ, Levitan ES, Pitt BR. Nitric oxide-induced changes in intracellular zinc homeostasis are mediated by metallothionein/thionein. Am J Physiol Lung Cell Mol Physiol. 2002;282:L185–L192. doi: 10.1152/ajplung.00267.2001. [DOI] [PubMed] [Google Scholar]
- Stork CJ, Li YV. Measuring cell viability with membrane impermeable zinc fluorescent indicator. J Neurosci Methods. 2006;155:180–186. doi: 10.1016/j.jneumeth.2005.12.029. [DOI] [PubMed] [Google Scholar]
- Tonder N, Johansen FF, Frederickson CJ, Zimmer J, Diemer NH. Possible role of zinc in the selective degeneration of dentate hilar neurons after cerebral ischemia in the adult rat. Neurosci Lett. 1990;109:247–252. doi: 10.1016/0304-3940(90)90002-q. [DOI] [PubMed] [Google Scholar]
- Truong-Tran AQ, Carter J, Ruffin RE, Zalewski PD. The role of zinc in caspase activation and apoptotic cell death. Biometals. 2001;14:315–330. doi: 10.1023/a:1012993017026. [DOI] [PubMed] [Google Scholar]
- Tsien R, Pozzan T. Measurement of cytosolic free Ca2+ with quin2. Methods Enzymol. 1989;172:230–262. doi: 10.1016/s0076-6879(89)72017-6. [DOI] [PubMed] [Google Scholar]
- Vallee BL, Falchuk KH. The biochemical basis of zinc physiology. Physiol Rev. 1993;73:79–118. doi: 10.1152/physrev.1993.73.1.79. [DOI] [PubMed] [Google Scholar]
- van Lookeren Campagne M, Thibodeaux H, van Bruggen N, Cairns B, Gerlai R, Palmer JT, Williams SP, Lowe DG. Evidence for a protective role of metallothionein-1 in focal cerebral ischemia. Proc Natl Acad Sci USA. 1999;96:12870–12875. doi: 10.1073/pnas.96.22.12870. [DOI] [PMC free article] [PubMed] [Google Scholar]
- Verkhratsky A. Physiology and pathophysiology of the calcium store in the endoplasmic reticulum of neurons. Physiol Rev. 2005;85:201–279. doi: 10.1152/physrev.00004.2004. [DOI] [PubMed] [Google Scholar]
- Wei G, Hough CJ, Li Y, Sarvey JM. Characterization of extracellular accumulation of Zn2+ during ischemia and reperfusion of hippocampus slices in rat. Neuroscience. 2004;125:867–877. doi: 10.1016/j.neuroscience.2004.03.011. [DOI] [PubMed] [Google Scholar]
- White BC, Grossman LI, O'Neil BJ, DeGracia DJ, Neumar RW, Rafols JA, Krause GS. Global brain ischemia and reperfusion. Ann Emerg Med. 1996;27:588–594. doi: 10.1016/s0196-0644(96)70161-0. [DOI] [PubMed] [Google Scholar]
- Yokoyama M, Koh J, Choi DW. Brief exposure to zinc is toxic to cortical neurons. Neurosci Lett. 1986;71:351–355. doi: 10.1016/0304-3940(86)90646-4. [DOI] [PubMed] [Google Scholar]
- Zhang Y, Wang H, Li J, Jimenez DA, Levitan ES, Aizenman E, Rosenberg PA. Peroxynitrite-induced neuronal apoptosis is mediated by intracellular zinc release and 12-lipoxygenase activation. J Neurosci. 2004;24:10616–10627. doi: 10.1523/JNEUROSCI.2469-04.2004. [DOI] [PMC free article] [PubMed] [Google Scholar]