

Abstract
We can discriminate visual objects at multiple levels, from coarse categorization to individual identification. It is not known how the brain adapts to the varying levels of discrimination required in different behavioral contexts. In the present study, we investigated whether the stimulus selectivity of neuronal responses in the monkey inferotemporal cortex, which is the final unimodal stage in the ventral visual pathway, changes with the varying levels of discrimination required for different task conditions. Responses of each inferotemporal cell to the same set of nine object images were examined in two different task conditions. The task alternated between coarse and fine discriminations in the first experiment, and the rule alternated between categorization and individual object identification in the second experiment. Despite these changes in the task requirements and the resulting differences in the monkeys' behavior, we found that the responses of inferotemporal cells were largely unchanged in both experiments. Our results suggest that representation of object images in the inferotemporal cortex is stable and rather insensitive to these kinds of shifts in behavioral context. Neuronal adaptations to behavioral context may occur downstream of the inferotemporal cortex.
Keywords: monkey, visual cortex, inferotemporal cortex, object discrimination, stimulus selectivity, task dependence
Introduction
Neurons in the anterior part of the macaque inferotemporal cortex selectively respond to object images. The responses are selective for complex features of the object images (Logothetis and Sheinberg, 1996; Tanaka, 1996), and this selectivity changes with long-term experience of the stimuli, i.e., long-term learning of association, discrimination, and categorization of visual stimuli (Sakai and Miyashita, 1991; Kobatake et al., 1998; Baker et al., 2002; Sigala and Logothetis, 2002). However, it remains unknown whether the stimulus selectivity of inferotemporal cells immediately changes when task requirements change. Neuronal responses to visual stimuli in the prefrontal cortex immediately change with switches in the on-going task requirement (Sakagami and Tsutsui, 1999; Sakagami et al., 2001). Therefore, cells in the inferotemporal cortex, which is reciprocally connected with the prefrontal cortex, may immediately change their tuning properties when the task requirement switches.
Changes in the task requirement often cause changes in selective attention. In area V4, which is located along the afferent pathway to the inferotemporal cortex, neuronal activity is modulated by attention to spatial location (Moran and Desimone, 1985; Motter, 1993; Connor et al., 1997; Luck et al., 1997; McAdams and Maunsell, 1999; Reynolds et al., 1999, 2000; Reynolds and Chelazzi, 2004). Human functional magnetic resonance imaging studies have shown that attention to an object enhances responses to the object and suppresses responses to other objects overlapping with the attended object (O'Craven et al., 1999; Serences et al., 2004). Attention to one of the attributes of a stimulus, such as color or shape (Ogawa and Komatsu, 2004), or to particular examples of the attribute (Haenny and Schiller, 1988; Maunsell et al., 1991; Motter, 1994) also modulates responses of V4 cells. In this study, we investigated whether responses of inferotemporal cells change with differing levels of visual discrimination when there were no changes in attention on these stimulus aspects.
Humans can discriminate visual objects at multiple levels, and the discrimination level can switch instantaneously according to the behavioral context (Tarr and Cheng, 2003). Different levels of discrimination may require different ways of processing stimulus images. However, it is not known how the brain adapts to such changes. One possibility is that the stimulus selectivity of neuronal responses in the inferotemporal cortex changes in accordance with the currently required discrimination level. For example, the tuning for certain stimulus features may become sharper during a fine discrimination and broader during a coarse discrimination.
To investigate whether stimulus selectivity of responses in inferotemporal cells changes according to the discrimination requirements in the currently engaged task, we examined their responses to the same set of object stimuli while the monkey made different types of judgments about the stimuli. Only the discrimination level changed in the first experiment, whereas the rule changed in the second experiment. We found that responses of inferotemporal cells remained largely unchanged despite these changes in the task. Preliminary results of the present study have been reported as an abstract (Suzuki et al., 2001). There is also a related abstract (Pauls and Logothetis, 2002).
Materials and Methods
Subjects
Two Japanese monkeys (Macaca fuscata), weighing 8.5 and 6.4 kg, participated in the experiments. The experimental plan was approved by the Experimental Animal Committee of RIKEN, and the monkeys were cared for in accordance with the “Guiding Principles of the Care and Use of Animals in the Field of Physiological Science” of the Japanese Physiological Society.
Stimuli
The stimulus set consisted of nine animal-like objects that were characterized by 57 parameters. Each of the parameters defined a local shape parameter such as arm length, torso width, leg angle, and so on (Sugihara et al., 1998). We first made three objects, and then we made the other objects by interpolating these three in the parameter space spanned by the 57 parameters. A position in the space represents an object. The new objects were located at the positions on the lines connecting the original objects and a quarter of the distance away from one of the original objects. Thus, the stimulus set consisted of three groups, each of which comprised three similar members (Fig. 1). Objects in the three groups were similar in appearance to dogs, monkeys, and mice, respectively.
Figure 1.

Stimulus set composed of three groups of three similar object images. The objects were specified by 57 shape parameters. The figure plane represents a plane of the space spanned by the 57 parameters. One point in the feature space indicates an object shape. We first made three objects (1, 5 and 9) and then made the other six by interpolating two of the three. New objects were determined by the positions on the lines connecting the original objects and a quarter of the distance away from one of the original objects. Thus, the objects made three groups of similar objects. Objects in the three groups appeared similar in shape to dogs, monkeys, and mice. All of the stimuli had the same surface color and were illuminated by the same point source of light from the top.
All of the objects had the same surface color, and they were illuminated by the same point light source from the top. The images seen from the same view point were used as stimuli. The stimuli were presented at the center of gaze. The maximum size of a viewed stimulus was 6 deg in visual angle. The background was a homogeneous black field.
Behavioral tasks
Experiment 1.
The monkeys were trained to detect a repetition of identical object images (Fig. 2a). A trial started with the monkey's lever press, which turned on a fixation spot (0.5 deg in diameter) at the center of screen. After an eye fixation for 900 ms, the first stimulus (A) appeared for 800 ms. After a 500 ms delay, a second stimulus appeared for 800 ms. When the second stimulus was identical to the first one (AA trial), the monkey had to release the lever. The lever response had to be withheld until 500 ms after the onset of the second stimulus in monkey 1. Monkey 2 was allowed to respond immediately after the onset of the second stimulus. The response had to be made within 1300 ms of the onset of the second stimulus in both monkeys. When the second stimulus was different from the first one (ABB trial), the monkey had to keep pressing the lever for another 500 ms delay until a third stimulus appeared. The third stimulus was always identical to the second one, and thus the subject always had to release the lever. A drop of water was given after a correct response. When the monkey made an incorrect response or broke the eye fixation, the trial was aborted, and a visual error signal (a green circle of 3.5 deg in diameter) was presented for 1000 ms. The first stimulus was selected from the nine object images in a quasi-random order. The second stimulus was also selected from the nine stimuli in a quasi-random order but followed a rule described below. AA and ABB trials were intermixed in a quasi-random order.
Figure 2.

Behavioral task. a, Experiment 1. The task began with central fixation after which the first stimulus appeared for 800 ms. After a 500 ms delay, a second stimulus appeared. When the second stimulus was identical to the first stimulus (AA trial), the monkey had to release the lever. When the two stimuli were different, the monkey had to continue pressing the lever and wait for another 500 ms until a third stimulus appeared. The third stimulus was always identical to the second one; thus, the monkey had to release the lever. When the second stimulus was different from the first one, it was selected either from a group other than that of the first stimulus (Easy condition) or from the same group (Difficult condition). b, Experiment 2. Instead of the Easy condition used in experiment 1, the Grouping condition was used. When the second stimulus belonged to the same group as the first stimulus, the monkey had to release the lever (AA′ trial). When the two stimuli belonged to different groups (ABB′ trial), the monkey had to continue pressing the lever and wait for another 500 ms until a third stimulus appeared. The third stimulus always came from the same group as the second stimulus; thus, the subject had to release the lever. The condition alternated between blocks composed of ∼100 trials.
In some blocks of trials, the second stimulus in ABB trials was selected from a group different from the first stimulus (Easy condition), and in other blocks the first and second stimulus were from the same group (Difficult condition). We will denote the latter type of trial as AA′A′ to make clear the difference between two conditions. A′ is another member of the same group of A, and B is a member of other groups. The discrimination of AA from AB sequences is easier than that of AA from AA′. The condition was consistent within a block of ∼100 trials and alternated between blocks. The change of condition was explicitly indicated by a pause in the task for several seconds. Each of the nine stimuli was presented as the first stimulus in at least nine trials, with correct responses of the monkey in each block.
AA trials were given slightly more frequently in both conditions (55–60%) in several sessions in which monkey 2 showed a general bias to keep pressing the lever at the second stimulus presentation. For monkey 2, we also made the following two modifications to allow the monkey be more aware of the difference in condition. First, we excluded from the Easy condition the pairs of stimuli in different groups with the shortest distances in the parameter space (object pairs 2/4, 6/8, and 3/7). This increased the difference in required discrimination between the two conditions. Secondly, we gave nine ABB or AA′A′ trials consecutively at the beginning of each block. Because the difference between the two conditions existed only in ABB and AA′A′ trials but not in AA trials, this repetition likely helped the monkeys notice the new condition.
Experiment 2.
After experiment 1 recordings were completed, monkey 1 was re-trained for another pair of tasks (Fig. 2b). One task was identical to the Difficult condition in experiment 1. The other task required the monkeys to respond to a repetition of stimulus group (Grouping condition). The time course of the task was identical to that of the Easy and Difficult conditions. When the second stimulus belonged to the same group as the first stimulus (AA′ trial), the monkey had to release the lever. When the second stimulus belonged to a different group (ABB′ trial), the monkey had to continue pressing the lever for a second 500 ms delay until a third stimulus appeared. The third stimulus was always selected from the same group as the second stimulus. We did not repeat the presentation of an identical stimulus in this condition.
In experiment 2, the task condition (Difficult or Grouping) was consistent within a block, and it alternated between blocks. In addition to the indication of the condition change by an intermission in task performance as in experiment 1, we explicitly indicated the condition throughout the block by the color of the fixation spot (red during the Difficult condition and gray during the Grouping condition). Note that the monkeys had to respond differently depending on the condition when the stimulus sequence was AA′. The monkey had to release the lever in the Grouping condition, whereas it had to continue pressing the lever in the Difficult condition. The constraints on the numbers of trials were the same as those in experiment 1.
Preparation and recordings
The monkeys were first trained to perform the repetition-detection task under the Easy condition without head fixation and gaze control. Images of natural objects, such as human faces and fruits, were used as the stimuli at the beginning, and then they were gradually replaced with the nine animal-like object images. After the monkey had learned the task, magnetic resonance images of the monkey's brain were taken, and the head holder and recording chamber were implanted in an aseptic surgery. The surgery was conducted under anesthesia introduced by intramuscular injection of ketamine hydrochloride (12 mg/kg), after an intramuscular injection of atropine sulfate (0.1 mg/kg), and maintained with intraperitoneal injection of sodium pentobarbital (35 mg/kg followed by 10 mg/kg when necessary).
After a week of recovery, training was resumed but now with head fixation and gaze control. Eye position was measured by an infrared system (http://staff.aist.go.jp/k.matsuda/eye/). The Difficult condition was introduced after the monkey had learned the task under the Easy condition with head fixation and gaze control. It took several weeks for the monkeys to learn to make correct responses in the Difficult condition.
After the training was completed, extracellular single-cell recordings were made from the anterior part of the inferotemporal cortex with tungsten electrodes (FHC, Bowdoinham, ME) while the monkeys were performing the task under the Easy and Difficult conditions (experiment 1). Cells were recorded from the right hemisphere of monkey 1 and from both the left and right hemispheres of monkey 2 in experiment 1. An Evarts type manipulator (Narishige, Tokyo, Japan) lowered the electrode from the dorsal surface of the brain through a guide tube. Cells were recorded from the ventrolateral surface of the anterior inferotemporal cortex, from the ventral lip of the superior temporal sulcus to the medial bank of the anterior middle temporal sulcus in the posterior-anterior range between 15 and 21 mm anterior to the ear bar position. Action potentials of single cells were isolated online using a template matching method (MSD; Alpha Omega, Nazareth, Israel). If an isolated cell did not appear to be responding to any of the nine stimuli, the electrode was advanced to another cell. At the end of daily recording, we determined the position of the dura at the ventral surface of the brain by detecting the characteristic noise in the recorded voltage that occurs when the electrode tip contacts the dura. The timing of single-cell action potentials and behavioral and task events (stimulus onset, reward delivery, and so on) were recorded and stored with 1 ms resolution on a computer. The vertical synchronization signals of the monitor for visual stimulus presentation were recorded to register the exact timing of cell responses with respect to stimulus presentation.
After the single-cell recordings in experiment 1 were completed, monkey 1 was re-trained in the Grouping condition and then for the alternation between Grouping and Difficult conditions. A second series of recordings were made from the left hemisphere after the training had been completed (experiment 2).
The positions of recorded cells were determined in reference to the MR images, the shape of gray matter as determined during electrode penetration, and the positions of the ventral surface of the brain. The traces of the guide tubes and electrodes were later observed in Nissl-stained sections of 50 μm thickness to confirm the estimated positions of the electrode tracks.
Analyses of behavioral data
We classified error trials into the following three groups.
Miss.
Error trials in which the monkey did not release the lever within the response window after the second stimulus presentation in AA trials under Easy and Difficult conditions and in AA′ trials under Grouping condition.
False alarm.
Error trials in which the monkey released the lever within the response window after second stimulus presentation in ABB trials under Easy condition, AA′A′ trials under Difficult condition, and ABB′ trials under Grouping condition.
Fixation break.
Error trials in which the monkey broke the eye fixation.
Trials with other types of errors, including those in which the monkey released the lever at an incorrect time or continuously pressed the lever through the response window after the third stimulus presentation were very rare, in all three conditions, after the training had been completed (<2.2% of trials). We use the following three calculations to compare the monkeys' performance between the different conditions. (1) Overall rate of selection errors = (number of miss and false alarm)/(number of correct trials, miss and false alarm). (2) Miss rate in AA trials (Easy and Difficult conditions) or AA′ trials (Grouping condition) = (number of miss)/(number of correct trials and miss in AA or AA′ trials). (3) False alarm rate in ABB (Easy and Grouping conditions) or AA′A′ trials (Difficult condition) = (number of false alarm)/(number of correct trials and false alarm in ABB or AA′A′ trials). (4) Fixation break rate = (number of fixation break)/(number of all trials).
Analyses of single-cell responses
We analyzed mainly neuronal responses to the first stimulus presentation in the trial, because the analyses of the responses to the second and third stimuli had several potential problems. The interstimulus interval (500 ms) was not long enough for the firing rate to complete transient changes after the offset of the previous stimulus and achieve a steady state (see Figs. 9, 14). The elevated baseline activity at the onset of the stimulus, which could be either a part of pure sensory responses to the previous stimulus or activity representing memory of the previous stimulus, might have facilitated the responses to the following stimulus. Moreover, the third stimulus was not relevant to the task. Responses of each analyzed cell were recorded in two or three successive blocks. Responses in the initial nine correct trials of each block and responses in error trials were removed from the analyses. At least eight trials remained for each stimulus in each condition and each cell.
Figure 9.

Comparison of the time course of stimulus selectivity between Easy (top) and Difficult (bottom) conditions in monkey 1 (left) and monkey 2 (right). The difference in firing rate was calculated between the best and worst stimuli in a 40 ms window sliding with 40 ms steps. Time 0 represents the onset of the first stimulus. The best and worst stimuli were determined for individual cells in the fixed large window from 80 to 580 ms after the stimulus onset. Only cells that showed significant stimulus selectivity contributed. Error bars represent the SEM.
Figure 14.

Comparison of the time course of stimulus selectivity between Grouping (top) and Difficult (bottom) conditions. Only cells that showed significant stimulus selectivity were included. The procedure of analysis was the same as that for Figure 9.
The significance of response to each stimulus in each cell was examined by comparing the mean firing rate in the window from 80 to 580 ms after the onset of the first stimulus, with the spontaneous firing rate averaged over the 500 ms period immediately before the stimulus onset by paired t test. A cell was put into additional analyses when its responses to at least one stimulus were significant in at least one condition [p < 0.05 after Bonferroni's correction for multiple comparison (p < 0.006)]. The magnitude of response to each stimulus in each trial was defined as the averaged firing rate during the window from 80 to 580 ms after the stimulus onset subtracted by the spontaneous firing rate in the 500 ms window immediately before the onset of the first stimulus within the trial.
Differences in responses of each cell between the two combined conditions were examined by applying a two-way factorial ANOVA (with stimulus and condition as factors) to the magnitudes of responses. A significant interaction would mean that the cell changed its stimulus selectivity between the two conditions.
The sharpness of the stimulus selectivity of each cell was quantified by two measures for responses in each condition. One is the number of stimuli that evoked a response >50% of the maximum response of the cell (half-width). It was determined to the first digit by interpolating responses just above and below 50% of the maximum response. We did not determine the half-width for cells in which all of the stimuli evoked >50% of the maximum response. Such cells were not included in the comparison of the half-width between two conditions. The second measure is the sparseness (Rolls and Tovee, 1995; Olshausen and Field, 2004) defined by the following formula:
 |
where ri is the averaged magnitude of responses to the ith stimulus. This ratio will take a maximum value of 1.0 when all stimuli evoke responses of equal magnitude and a small value close to 0.11 when only one stimulus elicits big responses (maximum sparsity). The differences in these sharpness measures between the two conditions were examined in the cell population by using paired Wilcoxon rank test.
The differences in the stimulus selectivity between the two conditions were also examined in the cell population by aligning responses against the stimulus rank order and applying a two-way repeated-measures ANOVA (with cell population and stimulus rank as within-subjects factors) to the aligned data. The spontaneous firing rate was not subtracted from the responses in this analysis. The rank order was determined for individual cells according to the responses averaged across the two conditions. Cells that did not show stimulus selectivity (lack of stimulus main effect in a two-way factorial ANOVA applied to individual cells) were excluded from this analysis.
Stimuli had to be discriminated from one another within each group in the Difficult condition, whereas discrimination was necessary only between groups in the Easy and Grouping conditions. In the Grouping condition, differences between stimuli within a group had to be neglected. These different demands of the task conditions might change the degree of diversity in mean responses to individual stimuli within a group relative to differences between responses to stimuli in different groups. To test this possibility, we calculated the intragroup variance, intergroup variance, and the ratio of the intragroup variance to the total variance of mean responses to individual stimuli for each cell in each condition, by the following formulas:
 |
 |
 |
where Rij represents the magnitude of mean response to the jth stimulus of the ith group, R̄i is the average of mean response magnitude over stimuli within the ith group, and  is the average of mean response magnitude over all stimuli. For these formulas, each stimulus was labeled using the group number and the number within each group (both 1–3). If a cell yielded similar magnitudes of responses to stimuli within a group, the intragroup variance would be small and the ratio would approach 0. In contrast, if a cell differentially responded to stimuli within individual groups while its mean responses to the three groups completely overlapped with one another, the ratio would be 4:3. The differences between the two combined conditions were examined in the cell population by a paired Wilcoxon rank test. The spontaneous firing rate was not subtracted from the responses in this analysis.
The time course of stimulus selectivity could be different between the two conditions. We calculated the difference in firing rate between responses to the best and worst stimuli for each cell at a small window of 40 ms width, sliding with 40 ms steps, and compared the values between the two combined conditions. The best and worst stimuli were determined in a fixed long window from 80 to 580 ms after the stimulus onset for responses of each cell averaged between the two conditions.
One possible mechanism for adaptation to different discrimination requirements is to selectively facilitate responses of cells with certain properties depending on the condition. For example, cells with sharp selectivity would be facilitated in the Difficult condition and those with broad selectivity would be facilitated in the Easy and Grouping conditions. Alternatively, cells discriminating stimuli within each group would be facilitated in the Difficult condition and those only discriminating between groups would be facilitated in the Easy and Grouping conditions. These possibilities were tested by examining differences in the degree of stimulus selectivity and differences in the variance ratio among cells that showed larger responses in the Easy or Grouping condition, those showing larger responses in the Difficult condition, and those with no significant differences between the two combined conditions. Experiments 1 and 2 and the Easy and Grouping conditions were combined in these analyses, and the cell classification was made based on the raw firing rate during the response window (from 80 to 580 ms after the stimulus onset) without a subtraction of spontaneous firing rate. The half-width, sparseness, tuning curves against stimulus rank, and the ratio of intragroup variance to the total variance of mean responses to individual stimuli were calculated based on responses averaged between the combined conditions. Differences in the half-width, sparseness, and the variance ratio were examined by one-way factorial ANOVA, and those in the tuning curves were examined by two-way repeated-measures ANOVA (with cell population and stimulus rank as within-subjects factors). For this analysis, the half-width was noted to be 9 for cells that showed >50% of the maximum responses to all nine stimuli.
Results
Experiment 1
The monkeys performed a task to detect repetition of an identical stimulus image under two conditions. In the trials in which an identical object image was presented as the first and second stimuli (AA trials), the monkey had to release the lever at the second stimulus presentation. In the trials in which the second stimulus was different from the first one, the second stimulus was selected from either the same group (Difficult condition, AA′A′ trials) or a different group (Easy condition, ABB trials) as the first stimulus. The monkey had to keep pressing the lever until the third stimulus appeared, which was always identical to the second stimulus. The Difficult condition required fine discrimination of stimuli within a group (A vs A′), whereas the Easy condition required only coarse discrimination of stimuli between groups (A vs B). The monkeys conducted the task under the two conditions in alternative blocks, each of which consisted of ∼100 trials. We will first compare the monkeys' behavior and then responses of inferotemporal cells between the two conditions.
Behavioral data
Behavioral data were taken from the sessions in which responses of inferotemporal cells were recorded (115 sessions for monkey 1 and 190 sessions for monkey 2). As expected, the monkeys made more selection errors in the Difficult condition than in the Easy condition. The overall rate of selection errors was significantly larger in the Difficult condition in both monkey 1 (25. 8 vs 11.3%, p < 0.0001 by paired t test) and monkey 2 (17.9 vs 2.4%, p < 0.0001) (Fig. 3a). More informative was the fact that the rate of selection errors in AA trials (miss) was significantly larger in the Difficult condition than it was in the Easy condition in both monkey 1 (27.4 vs 13.3%, p < 0.0001) and monkey 2 (16.7% vs 3.5%, p < 0.0001) (Fig. 3b). AA trials were completely identical, in both stimulus sequence and correct response, between the two conditions. Therefore, the difference in the rate of selection errors in AA trials indicates the presence of a difference in some internal state of the monkeys depending on the overall structure of the blocks. The false alarm rate was also larger in the Difficult condition than that in the Easy condition (Fig. 3c). Moreover, the false alarm rate was roughly equal to the miss rate in each condition (Fig. 3b,c). The best overall performance was achieved around this balance point. Therefore, these results suggest that the monkeys' behavior adapted to the frequent change in task condition.
Figure 3.
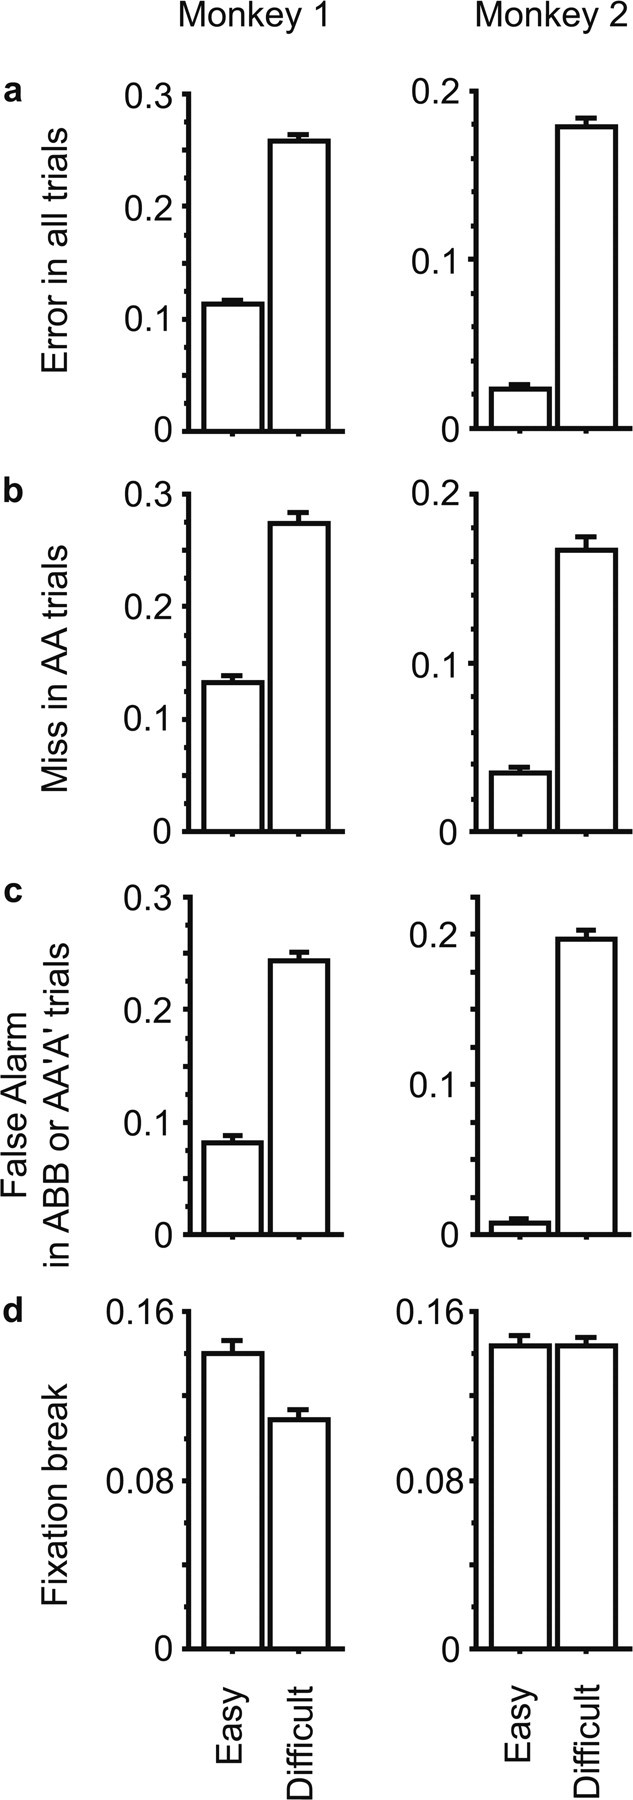
Comparison of the frequency of error trials between Easy and Difficult conditions in monkey 1 (left) and monkey 2 (right). a, Averaged error rates in all trials. b, Averaged miss rate in AA trials. c, Averaged false alarm rate in ABB or AA′A′ trials. d, Averaged fixation break rates. Error bars represent the SEM.
Another difference between the conditions was found in monkey 1 in the fixation break rate (Fig. 3d). It was significantly smaller in the Difficult condition than in the Easy condition (10.9 vs 14.0%, p < 0.0001). There was no such difference in monkey 2 (p = 0.98).
Single-cell responses
We recorded responses of 305 inferotemporal cells for at least two consecutive blocks of the Easy and Difficult conditions (115 cells from monkey 1 and 190 cells from monkey 2). We first focused on responses to the first stimulus in individual trials. Results regarding responses to the second stimulus will be briefly described at the end of the section. Among the 305 cells, 161 cells showed significant excitatory responses to at least one of the nine stimuli (p < 0.05 by paired t test after Bonferroni's correction for multiple comparison, 66 cells in monkey 1, and 95 cells in monkey 2). The responses of 145 of the 161 cells were stimulus selective (determined by a significant (p < 0.05) main effect of stimulus in a two-way factorial ANOVA with stimulus and condition as factors). Different cells maximally responded to different stimuli, and the best stimuli of the 145 cells as a whole covered all nine stimuli.
Selectivity of responses among the nine stimuli was essentially identical between the Easy and Difficult conditions in most of the 161 cells. There was no significant interaction between condition and stimulus in these cells (p > 0.05, two-way factorial ANOVA with stimulus and condition as factors). Figure 4 shows responses of one example cell in the two conditions. Figure 5 shows responses of another example cell, which was recorded in three consecutive blocks. A significant (p < 0.05) interaction, which means a change in stimulus selectivity between the two conditions, was found only in 11% of the cells (18 of 161 cells). Figure 6 shows responses of one example of such minor cells.
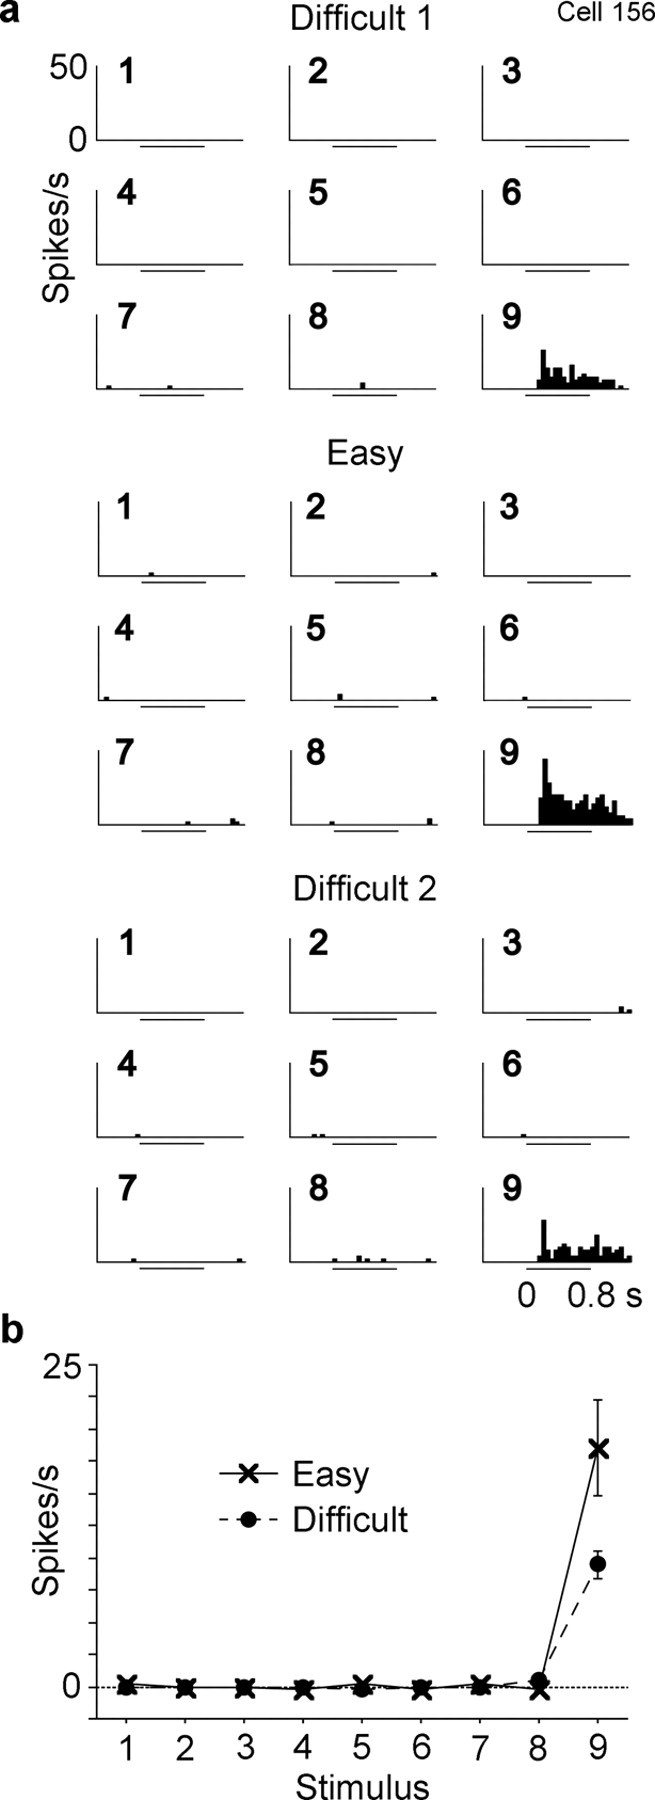
Figure 4.
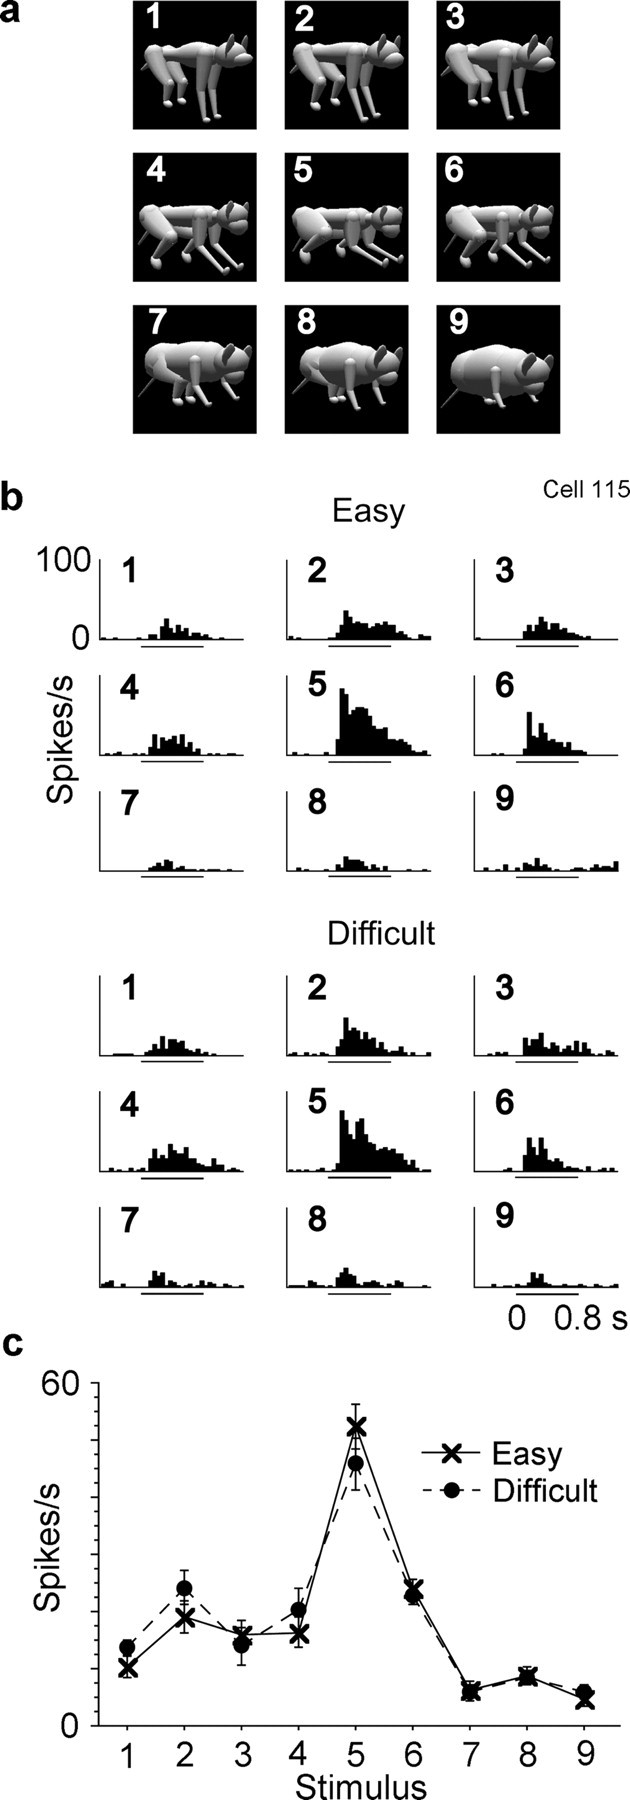
Response of an inferotemporal cell to the nine stimuli. a, The nine stimuli in the same arrangement as those of the PSTH histograms in b. b, PSTH histograms of responses under Easy and Difficult conditions. The numbers in individual histograms correspond to the numbers of the stimuli in a and Figure 1. The lines under the graphs indicate the stimulus presentation period. c, mean firing rate within a window from 80 to 580 ms after the onset of the first stimulus subtracted by the spontaneous firing rate immediately before the stimulus onset. Error bars represent the SEM.
Figure 5.
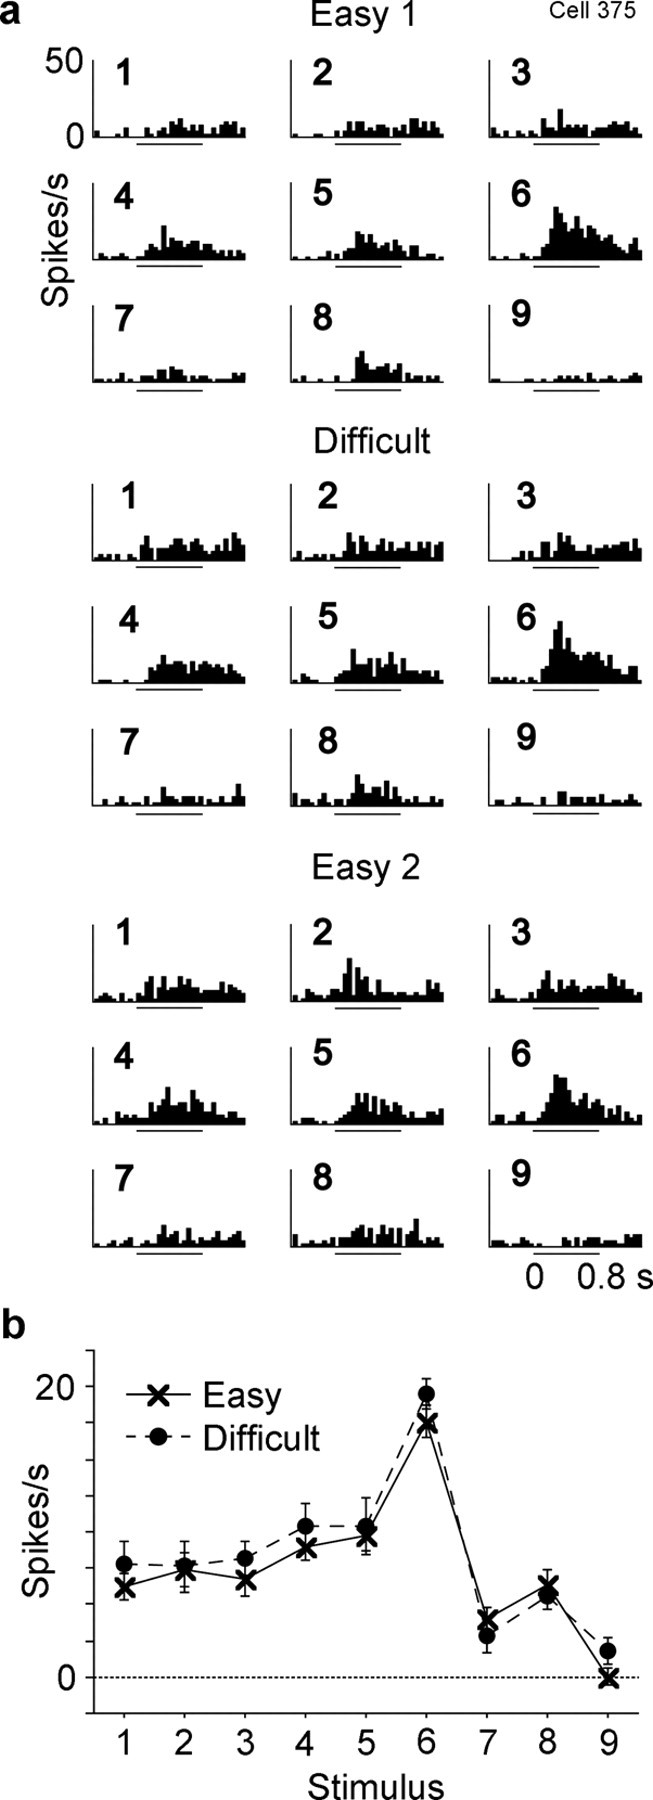
Response of a second inferotemporal cell to the nine stimuli. The activity of this cell was recorded in the order of Easy 1, Difficult, and Easy 2. Conventions are same as those used in Figure 4.
Figure 6.
Responses of a third inferotemporal cell to the nine stimuli. The activity of this cell was recorded in the order of Difficult 1, Easy, and Difficult 2. Conventions are same as those used in Figures 4 and 5. Both the main effect of condition (p = 0.003) and interaction (p < 0.0001) were significant in a factorial ANOVA (with stimulus and condition as factors).
The number of stimuli that evoked >50% of the maximum response in individual cells (half-width) and the sparseness were comparable between Easy and Difficult conditions (Fig. 7). There were no significant differences in either monkey 1 (p = 0.52 for the half-width, and p = 0.56 for the sparseness, paired Wilcoxon rank test) or monkey 2 (p = 0.62 for the half-width, and p = 0.51 for the sparseness). The tuning curve plotted against the rank order of stimulus was also similar between the Easy and Difficult conditions (Fig. 8). A difference in the shape of tuning curve should appear as a significant interaction between the stimulus rank order and condition. There was no significant interaction in either the curves of original magnitudes (Fig. 8a, p = 0.40 for monkey 1, and p = 0.36 for monkey 2, two-way repeated-measures ANOVA) or the curves of magnitudes normalized by the magnitude of the maximal responses in individual cells (Fig. 8b, p = 0.19 for monkey 1, and p = 0.65 for monkey 2). There were also no significant main effects of condition in either the curves of original magnitudes (p = 0.38 for monkey 1, and p = 0.71 for monkey 2) or the curves of normalized magnitudes (p = 0.92 for monkey 1, and p = 0.90 for monkey 2).
Figure 7.

Comparison of selectivity sharpness measures between the Difficult and Easy conditions in monkey 1 (left) and monkey 2 (right). a, The number of stimuli that evoked >50% of the maximum response in individual cells (half-width). A dot represents a cell, and its x and y positions represent the half-width in the Easy and Difficult conditions, respectively. b, The sparseness.
Figure 8.
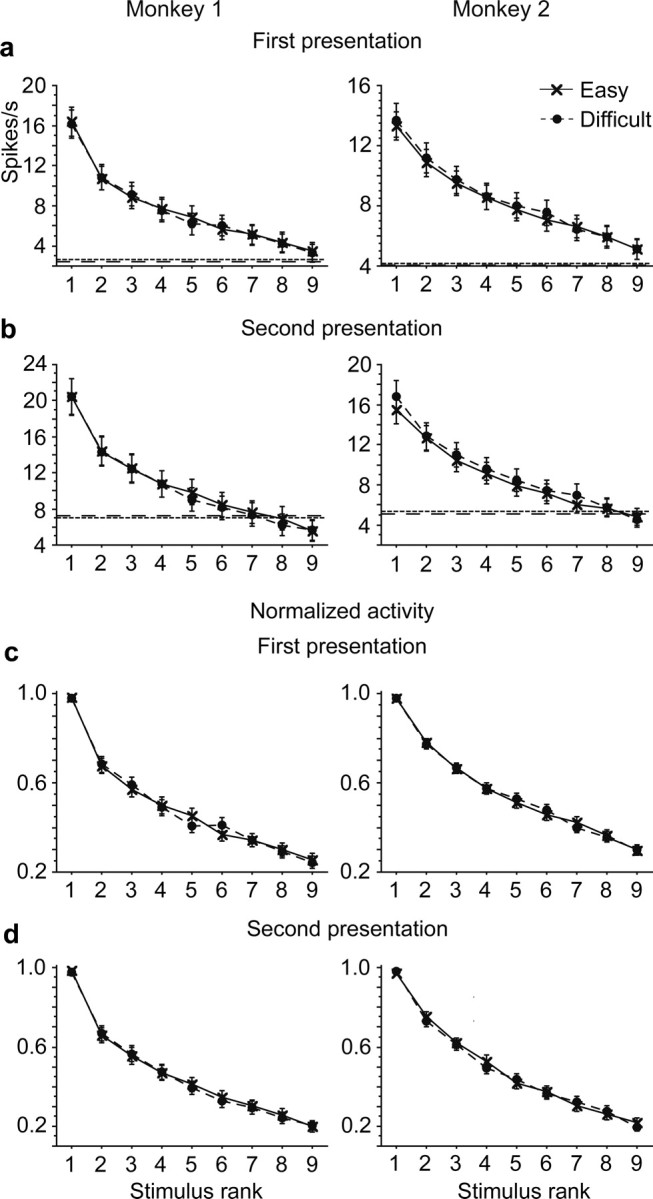
Comparison of tuning curves against stimulus rank in monkey 1 (left) and monkey 2 (right). a, Original magnitudes of responses to the first stimulus were averaged for the stimulus rank order. The spontaneous firing rate was not subtracted in this analysis. The stimulus rank order was determined in individual cells based on the responses averaged between Easy and Difficult conditions. The response magnitudes were aligned according to the stimulus rank order before they were averaged across cells. b, Original magnitudes of responses to the second stimulus. c, The magnitudes of the responses to the first stimulus were normalized by the maximal responses of individual cells before they were averaged across cells. d, The magnitudes of the responses to the second stimulus normalized before averaging across cells. Only cells that showed significant stimulus selectivity contributed in a–d. Error bars represent the SEM.
Stimuli had to be discriminated from one another within each group in the Difficult condition, whereas discrimination was necessary only between groups in the Easy condition. These different demands might be met by changing the degree of diversity in mean responses to individual stimuli within each group relative to differences in responses between groups. However, the ratio of intragroup variance to the total variance of mean responses to individual stimuli was comparable between the Easy and Difficult conditions [0.74 ± 0.03 (mean ± SEM) and 0.73 ± 0.03 for monkey 1; 0.65 ± 0.04 and 0.66 ± 0.03 for monkey 2] with no significant difference (p = 0.94 for monkey 1, and p = 0.89 for monkey 2, paired Wilcoxon rank test). The raw value of the intragroup variance was also comparable between the Easy and Difficult conditions [16.4 ± 2.4 (spikes/s)2 in the Easy, and 16.4 ± 2.1 in the Difficult, p = 0.81 for monkey 1; 6.5 ± 0.9 in the Easy, and 7.7 ± 1.3 in the Difficult, p = 0.68 for monkey 2]. The same was true for the raw value of the intergroup variance (17.6 ± 3.4 in the Easy, and 17.6 ± 3.4 in the Difficult, p = 0.83 for monkey 1; 7.9 ± 1.2 in the Easy, and 8.6 ± 1.3 in the Difficult, p = 0.35 for monkey 2).
Thus far, responses in the two conditions have been compared only for the mean firing rate averaged over the whole response window. There might be a difference in the time course of responses between the two conditions. The time course of stimulus selectivity of each cell in each condition was examined by calculating the difference between responses to the best and worst stimuli in a 40 ms time window shifted with 40 ms steps. The best and worst stimuli were determined in the fixed large window from 80 to 580 ms after the stimulus onset. The time course of stimulus selectivity in the Easy condition was similar to that in the Difficult condition (Fig. 9). There was a significant difference only at one position (at 840 ms after the stimulus onset) (p < 0.05, paired t test) in monkey 1 and none in monkey 2 within the response (from 80 to 1120 ms after the stimulus onset). A significant difference at one of 26 bins is within the range of chance (p = 0.62, binominal test).
The results thus far described have been regarding responses to the first stimulus in individual trials. Similar results were obtained for responses to the second stimulus. We used only responses to the second stimulus of AA trials, because the sequence of the first and second stimuli in these trials, but not in other types of trials, was identical between the Easy and Difficult conditions. The magnitude of response to the second stimulus was determined by the averaged firing rate during the window from 80 to 580 ms after the onset of the second stimulus subtracted by the spontaneous firing rate in the 500 ms window immediately before the onset of the first stimulus. Because the firing rate did not reach a steady state within the delay period after the offset of the first stimulus (500 ms), we could not use the firing rate immediately before the onset of the second stimulus for the subtraction of spontaneous activity. When a two-way ANOVA was applied to the responses, a significant interaction was found only in 10% of the cells (16 of 159 cells). The half-width and sparseness were comparable between the two conditions. There were no significant differences in either monkey 1 (p = 0.86 for the half-width and p = 0.26 for the sparseness) or monkey 2 (p = 0.06 for the half-width and p = 0.19 for the sparseness). The magnitude of responses plotted against the stimulus rank order also showed essentially identical shapes between the two conditions. In monkey 1, there was no significant interaction nor significant main effect of condition [p = 0.63 and p = 0.25, respectively, for raw firing rates (Fig. 8b, left); p = 0.88 and p = 0.55 for normalized firing rates (Fig. 8d, left)]. In monkey 2, although responses were slightly larger in the Difficult condition (main effect of condition, p = 0.04 for raw firing rates, and p = 0.72 for normalized firing rates), there was no shape change in the tuning curve [interaction, p = 0.63 for raw firing rates, and p = 0.61 for normalized firing rates (Fig. 8b,d, right)].
Experiment 2
Only monkey 1 participated in experiment 2, which consisted of two tasks. One task was to detect a repetition of stimulus group (Grouping condition). If the second stimulus belonged to the same group as the first stimulus, the monkey had to release the lever. The other task was to detect a repetition of an identical stimulus, as in experiment 1. The second stimulus was always selected from the same group as the first one, as in the Difficult condition of experiment 1. Therefore, the correct response was different between the two tasks when the second stimulus was different from the first one but belonged to the same group as the first one (AA′ sequence). In these trials, the monkey had to release the lever in the Grouping condition but keep pressing the lever until the third stimulus presentation in the Difficult condition. The monkey conducted the two tasks in alternative blocks, each of which comprised ∼100 trials. We will first compare the monkey's behavior and then responses of inferotemporal cells between the two conditions.
Behavioral data
Behavioral data were taken from the sessions in which responses of inferotemporal cells were recorded (112 sessions). The overall rate of selection errors was significantly larger in the Difficult condition than in the Grouping condition [29.1% vs 12.6%, p < 0.0001 by paired t test (Fig. 10a)]. Both miss and false alarm rates were significantly larger in the Difficult condition [p < 0.0001 and p < 0.0001, respectively (Fig. 10b,c)]. The fixation break rate was significantly smaller in the Difficult condition than in the Grouping condition [10.2 vs 13.3%, p < 0.0001 (Fig. 10d)].
Figure 10.

Comparison of the frequency of error trials between the Grouping and Difficult conditions. a, Averaged error rates in all trials. b, Averaged miss rate in AA′ (Grouping) or AA (Difficult) trials. c, Averaged false alarm rate in ABB′ (Grouping) or AA′A′ (Difficult) trials. d, Averaged fixation break rates. Only monkey 1 contributed to this experiment (experiment 2). Error bars represent the SEM.
Single-cell responses
We recorded responses of 112 inferotemporal cells for at least two consecutive blocks of the Grouping and Difficult conditions. We first focus on responses to the first stimulus. Results regarding responses to the second stimulus will be briefly described at the end of the section. Among the 112 cells, 51 cells showed significant excitatory responses to at least one of the nine stimuli in at least one block (p < 0.05 by paired t test after Bonferroni's correction for multiple comparison). Forty-two of the 51 cells showed stimulus-selective responses [determined by a significant (p < 0.05) main effect of stimulus in a two-way factorial ANOVA with stimulus and condition as factors].
Selectivity of responses among the nine stimuli was essentially identical between the Grouping and Difficult conditions in most of the 51 cells. There was no significant interaction between condition and stimulus in these cells (p < 0.05, two-way factorial ANOVA with stimulus and condition as factors). Figure 11 shows responses of one example cell in the two conditions. A significant interaction between condition and stimulus was found only in 10% of the cells (5 of 51 cells).
Figure 11.
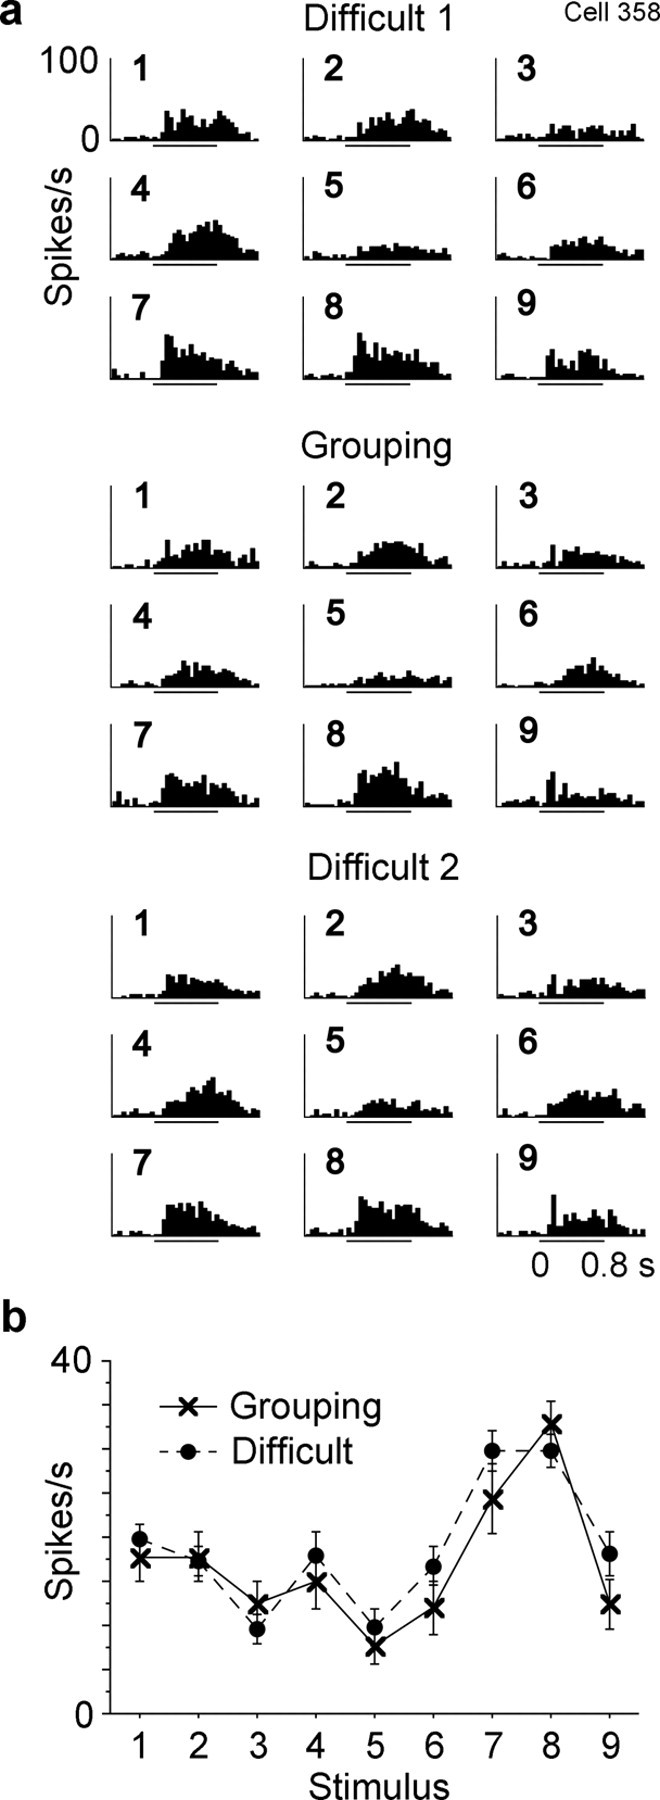
Response of a forth inferotemporal cell to the nine stimuli. The activity of this cell was recorded in the following order: Difficult 1, Grouping and Difficult 2. Conventions are the same as those in Figures 4–6.
In the cell population, the half-width and sparseness were comparable between the Grouping and Difficult conditions [p = 0.64 and p = 0.71, respectively (Fig. 12)]. The magnitude of responses plotted against the stimulus rank order also showed essentially identical shapes between the two conditions. The original magnitude of responses was slightly larger in the Difficult condition than it was in the Grouping condition (main effect of condition, p = 0.01, two-way repeated-measures ANOVA), but the difference was not specific to particular ranks [interaction between condition and stimulus, p = 0.93 (Fig. 13a, left)]. There was neither a significant main effect of condition (p = 0.92) nor a significant interaction (p = 0.84) in the normalized magnitude of responses (Fig. 13b, left).
Figure 12.

Comparison of selectivity sharpness measures between the Grouping and Difficult conditions. a, The half-width. b, The sparseness.
Figure 13.

Comparison of tuning curves against stimulus rank. a, Original magnitudes of responses to the first (left) and second (right) stimuli were averaged for the stimulus rank order. The spontaneous firing rate was not subtracted in this analysis. b, The magnitudes of responses were normalized by the maximal responses of individual cells before they were averaged across cells. Only cells that showed significant stimulus selectivity were included in both a and b. Error bars represent the SEM.
The ratio of intragroup variance to the total variance of mean responses to individual stimuli was also comparable between the Grouping (0.80 ± 0.04, mean ± SEM) and Difficult (0.83 ± 0.04) conditions, with no significant difference (p = 0.30, paired Wilcoxon rank test). The raw values of the intragroup variance were also comparable between the two conditions [15.8 ± 3.9 (spikes/s)2 in the Grouping and 14.7 ± 2.8 in the Difficult, p = 0.55]. The same was true for the raw values of the intergroup variance (10.8 ± 2.2 in the Grouping and 11.2 ± 2.7 in the Difficult, p = 0.79). The time course of stimulus selectivity was also very similar between the two conditions (Fig. 14). There was no significant difference at any position within the response (from 80 to 1120 ms after the stimulus onset, paired t test).
Similar results were obtained for responses to the second stimulus in individual trials. We used only responses to the second stimulus of AA′ trials, because the sequence of the first and second stimuli in these trials, but not in other types of trials, was identical between the Grouping and Difficult conditions. In individual cells, a significant interaction between stimuli and condition was found only in 6% of the cells (3 of 51 cells). The half-width and sparseness were comparable between the two conditions (p = 0.84 for the half-width, and p = 0.68 for the sparseness). The magnitude of responses plotted against the stimulus rank order also showed essentially identical shapes between the two conditions [main effect of condition, p = 0.32 and interaction, p = 0.82 for the raw firing rates (Fig. 13a, right); main effect of condition, p = 0.60 and interaction, p = 0.65 for the normalized firing rates (Fig. 13b, right)].
Test of possibility that different cell groups were facilitated in different conditions
Finally, we examined whether there was any selective facilitation of cells with different tuning properties in different conditions. The simplest hypothesis is that cells with sharp selectivity were facilitated in the Difficult condition, whereas those with broad selectivity were facilitated in the Easy and Grouping conditions. This possibility was tested by examining differences in the degree of stimulus selectivity among cells that showed larger responses (p < 0.05, two-way factorial ANOVA) in the Easy or Grouping condition (28 cells), those showing larger responses (p < 0.05) in the Difficult condition (35 cells), and those with no significant differences (p > 0.05) between the two combined conditions (149 cells). In this analysis, experiments 1 and 2 and the Easy and Grouping conditions were combined because of the sparsity of cells that showed significant differences in the magnitude of responses between the two conditions. The cell classification was made based on the raw firing rate during the whole response window without a subtraction of spontaneous firing rate, because the hypothesized facilitation of particular cells would likely be present even before the stimulus presentation. The subtraction might cancel out the facilitation. Responses to the first stimulus were used here.
There was no significant difference in any of the half-width [p = 0.55, one-way factorial ANOVA (Fig. 15a)], sparseness [p = 0.86 Fig. 15b)], or tuning curve plotted against the stimulus rank [main effect of population, p = 0.15; interaction between population and stimulus rank, p = 0.67, two-way repeated-measures ANOVA (Fig. 15d)]. Even the numerical differences in the half-width and sparseness were opposite to those expected from the above-described hypothesis. For example, the hypothesis predicts that cells with sharp selectivity would be facilitated in the Difficult condition, but actually cells that showed larger responses in the Difficult condition had slightly broader selectivity.
Figure 15.

Comparison of selectivity among cells with larger responses in the Easy or Grouping condition (E/G; n = 22), those with no significant difference between two combined conditions (n; n = 167) and those with larger responses in the Difficult condition (D; n = 23). Cells were classified based on the raw firing rate in the response window without a subtraction of spontaneous firing rate. a, The half-width. b, The sparseness. c, The ratio of intragroup variance to the total variance of mean responses to individual stimuli. d, The tuning curves against stimulus rank. Error bars represent the SEM.
Effects of feature-based attention, i.e., attention to particular example features, such as upward direction of motion and white stimuli, have been found in responses of cells in V4 and MT (Haenny et al., 1988; Maunsell et al., 1991; Motter, 1994; Treue and Martinetz-Trujillo, 1999; Martinetz-Trujillo and Treue, 2004). For example, attention to upward direction of motion facilitates responses of cells tuned in an upward direction in MT. In our task, the monkeys might attend to features useful for intragroup discrimination in the Difficult condition, whereas attention would be directed to features useful for intergroup discrimination in the Easy and Grouping conditions. To examine this possibility, we compared the ratio of intragroup variance to the total variance of mean responses to individual stimuli among the three groups of cells (Fig. 15c). There were no significant differences (p = 0.66, one-way factorial ANOVA). The numerical differences were in the opposite direction from those expected from the hypothesis. Similar results were obtained when cells were classified based on the data with the subtraction of spontaneous firing rate. Thus, there was no evidence for selective facilitation of cells having different degrees of selectivity nor for that of cells tuned to different features.
General increase of responses from one condition to another in individual cells
When a two-way factorial ANOVA was applied to the responses of each cell to the nine stimuli in two combined conditions, a significant main effect of condition without significant interaction would mean that the responses of the cell were nonselectively larger in one condition than in the other condition. For responses to the first stimuli in experiment 1, 16% of the cells (25 of 161 cells) showed such nonselective response changes. Eleven of 25 cells showed larger responses in the Easy condition, and 13 cells showed larger responses in the Difficult condition. The remaining one cell showed inconsistent, but significant, differences among the three blocks. The proportion of the cells that showed such nonselective changes was 12% for responses to the second stimuli in experiment 1 (19 of 159 cells, with 8 and 11 cells showing larger responses in Easy and Difficult conditions, respectively), 20% for responses to the first stimuli in experiment 2 (10 of 51 cells, with 4 and 6 cells showing larger responses in Grouping and Difficult conditions, respectively), and 14% for responses to the second stimuli in experiment 2 (7 of 51 cells, with 2 and 5 cells showing larger responses in Grouping and Difficult conditions, respectively). These numbers of cells with significant main effects of condition were likely overestimates, because the effects could reflect changes in general excitability along time unrelated with the change in task condition.
Discussion
The monkeys performed a task with different conditions (experiment 1) or alternated between tasks of different rules (experiment 2). Both experiments used visual object stimuli from the same stimulus set, which consisted of three groups of three similar object images. The coarseness of the required discrimination varied in experiment 1: only coarse intergroup discriminations were required in the Easy condition, whereas stimuli within the same group had to be finely discriminated in the Difficult condition. The monkeys made more miss as well as more false alarm under the Difficult condition than they did under the Easy condition. Moreover, the miss rate was roughly equal to false alarm rate in each condition. These results suggest that the monkeys sensed the task change and optimally behaved in each task. In experiment 2, the required response on the same stimulus sequence was opposite in half of the trials. When the first and second stimuli were different but selected from a single group (AA′), the monkey had to continue pressing the lever in the Difficult condition but release the lever in the Grouping condition.
Despite these differences in the behavior of the monkeys, selectivity of neuronal responses in the anterior part of the inferotemporal cortex largely remained unchanged between the two conditions in both experiment 1 and experiment 2. Cells that showed changes in stimulus selectivity between the two conditions were only ∼10% in either experiment. The inferotemporal cells as a population did not show any consistent change from one condition to another in either the sharpness measures or more detailed shape of the tuning curve in either experiment. Depending on the task requirement, responses of inferotemporal cells might be adjusted in more specific ways; e.g., responses to stimuli within each group might become more diverse in the Difficult condition. However, the ratio of the intragroup variance to the total variance of mean responses to individual stimuli did not increase from the Easy or Grouping condition to the Difficult condition. Some previous studies show that the information at different discrimination levels appears with different time courses in responses of inferotemporal cells (Sugase et al., 1999; Tsao et al., 2006) (but see Hung et al., 2005). Therefore, the time course of stimulus selectivity might change with changes in the coarseness of the required stimulus discrimination. However, the time course of stimulus selectivity was similar between the two conditions.
There are several possible model mechanisms that could be used to adapt to the changes in task requirement. One simple way is to tune cells more sharply for finer discrimination and more broadly for coarser discrimination or categorization. Another way is to shift the threshold for mapping input representations to a motor response, depending on the task. We found no evidence of these changes occurring in the inferotemporal cortex. Therefore, if these are the mechanisms underlying the behavioral differences, changes in tuning sharpness or the shift of threshold probably occur downstream of the inferotemporal cortex.
Another possible mechanism for adaptation is to facilitate different groups of cells in different task conditions. For example, cells tuned to features useful for intragroup discrimination would be facilitated in the Difficult condition, whereas those tuned to features useful for intergroup discrimination would be facilitated in the Easy and Grouping conditions. However, we detected no such tendency: the sharpness measures and the ratio of intragroup variance to the total variance were not significantly different between cells that showed larger responses in the Difficult condition and those that showed larger responses in the Easy or Grouping condition. There was no sign evidence for the above-described mechanism working in the inferotemporal cortex in our paradigm.
Yet another way to adapt to the changes in task requirement is to specifically facilitate different cortical areas that have different properties. Several lesion studies in monkeys have suggested that the perirhinal cortex, which is located medial to the inferotemporal cortex, is essential for discrimination of complex object images (for review, see Buckley and Gaffan, 2006). More relevant to the subject in this paper is the finding from a recent human imaging study: the human perirhinal cortex was activated only during fine discrimination of object images, whereas the fusiform gyrus, which may correspond to the monkey inferotemporal cortex, was activated during both coarse and fine levels of discrimination (Tyler et al., 2004). It might be the case that the monkey's decision relied more on neuronal activities in the inferotemporal or perirhinal cortex depending on the condition. However, there was no direct evidence in the present study to support this notion. There were no overall differences in the magnitude of responses of inferotemporal cells between Difficult and Easy conditions in experiment 1. Although there was a slight general increase of responses in the Difficult condition compared with responses in the Grouping condition in experiment 2, this direction of change is opposite to that expected from the above-described hypothesis.
The largely stable neuronal responses in the inferotemporal cortex found in the present study are not inconsistent with previous findings of the effects of selective attention on neuronal responses in the ventral visual pathway. Selective attention to a particular spatial location, particular object, and particular sensory dimension (e.g., color, orientation, or moving direction) facilitates responses to stimuli at the attended position, those to the attended object, and those to features of the attended dimension (Moran and Desimone, 1985; Connor et al., 1997; Reynolds and Chelazzi, 2004; Ogawa and Komatsu, 2004). In the present study, we found that changes in the coarseness of discrimination and the rule of motor responses made on the same attended object did not change responses of inferotemporal cells to the object. Responses of cells in the ventral visual pathway are sensitive to selective attention but they may be much less sensitive to the behavioral rule made on the shape of attended objects.
Selective attention modulates the magnitude of responses but not their selectivity. With selective attention to spatial position, the tuning curves for the orientation and moving direction change in multiplicative ways, i.e., keeping the shape of the tuning curve unchanged (McAdams and Maunsell, 1999; Treue and Martinetz-Trujillo, 1999; Reynolds and Chelazzi, 2004). Selective attention to particular sensory dimension (e.g., color) and to a particular feature in one dimension (e.g., upward motion) also changes tuning curves in multiplicative ways (McAdams and Maunsell, 1999; Martinetz-Trujillo and Treue, 2004). Therefore, the selectivity of cells, in terms of the shape of tuning curves, is also unchanged by selective attention.
Such stability of selectivity is not inconsistent with the previous findings of long-term changes in selectivity through long-term learning (Sakai and Miyashita, 1991; Kobatake et al., 1998; Baker et al., 2002; Sigala and Logothetis, 2002). The time scale of changes that were detected in these previous studies ranged from several days to weeks, whereas in the present study we focused on instantaneous changes with switches of task requirements. The difference may be said to be one between “learning” and “switch.” The stimulus selectivity of inferotemporal cells is subject to learning, but it does not appear to be sensitive to switches in behavioral rule or selective attention. The insensitivity of neuronal selectivity to behavioral switches may be useful for accumulating information about objects in different behavioral contexts. The inferotemporal cortex sends object information to many brain sites. This insensitivity may also be useful for these downstream brain sites to use the object information in divergent behavioral contexts. However, we cannot generalize the present results to any type of changes in behavioral responses. The range of behavioral responses that we examined was limited. Koida and Komatsu (2005) reported that a small, but definite, number of monkey inferotemporal cells showed significant differences in the magnitude of responses to color stimuli between a task of stimulus-position mapping and that of stimulus-stimulus matching. However, they did not find changes in the shape of stimulus selectivity, which is consistent with the present results.
In conclusion, responses of cells in the monkey inferotemporal cortex were largely unchanged when the task changed in discrimination level or in rule without changes in selective attention. We suggest that adaptation to changes in behavioral rule for object discrimination tasks may occur downstream of the inferotemporal cortex.
Footnotes
This work was partly supported by a Grant-in-Aid for Scientific Research on Priority Areas 17022047 from Ministry of Education, Culture, Sports, Science, and Technology. We thank Shimon Edelman for providing the computer program to create animal-like objects; Allen R. Waggoner for performing MRIs; Noritaka Ichinohe, Hiromi Mashiko, Yoshiko Abe, and Adrian Knight for help in histology; and Hidehiko Komatsu for discussion.
References
- Baker IC, Behrmann M, Olson CR. Impact learning on representation of parts and wholes in monkey inferotemporal cortex. Nat Neurosci. 2002;5:1210–1216. doi: 10.1038/nn960. [DOI] [PubMed] [Google Scholar]
- Buckley MJ, Gaffan D. Perirhinal cortical contributions to object perception. Trends Cogn Sci. 2006;10:100–107. doi: 10.1016/j.tics.2006.01.008. [DOI] [PubMed] [Google Scholar]
- Connor CE, Preddie DC, Gallant JL, Van Essen DC. Spatial attention effects in macaque area V4. J Neurosci. 1997;17:3201–3214. doi: 10.1523/JNEUROSCI.17-09-03201.1997. [DOI] [PMC free article] [PubMed] [Google Scholar]
- Haenny PE, Maunsell JHR, Schiller PH. State dependent activity in monkey visual cortex. II. Retinal and extraretinal factors in V4. Exp Brain Res. 1988;69:245–259. doi: 10.1007/BF00247570. [DOI] [PubMed] [Google Scholar]
- Hung CP, Kreiman G, Poggio T, DiCarlo JJ. Fast readout of object identity from macaque inferior temporal cortex. Science. 2005;310:863–866. doi: 10.1126/science.1117593. [DOI] [PubMed] [Google Scholar]
- Kobatake E, Wang G, Tanaka K. Effects of shape-discrimination training on the selectivity of inferotemporal cells in adult monkeys. J Neurophysiol. 1998;80:324–330. doi: 10.1152/jn.1998.80.1.324. [DOI] [PubMed] [Google Scholar]
- Koida K, Komatsu H. Effect of task demand on the response of color selective TE neurons of the monkey. Soc Neurosci Abstr. 2005;31 743.6. [Google Scholar]
- Logothetis NK, Sheinberg DL. Visual object recognition. Annu Rev Neurosci. 1996;19:577–621. doi: 10.1146/annurev.ne.19.030196.003045. [DOI] [PubMed] [Google Scholar]
- Luck SJ, Chelazzi L, Hillyard SA, Desimone R. Neural mechanisms of spatial selective attention in areas V1, V2, and V4 of macaque visual cortex. J Neurophysiol. 1997;77:24–42. doi: 10.1152/jn.1997.77.1.24. [DOI] [PubMed] [Google Scholar]
- Martinetz-Trujillo JC, Treue S. Feature-based attention increases the selectivity of population responses in primate visual cortex. Curr Biol. 2004;14:744–751. doi: 10.1016/j.cub.2004.04.028. [DOI] [PubMed] [Google Scholar]
- Maunsell JHR, Sclar G, Nealey TA, DePriest DD. Extraretinal representations in area V4 in the macaque monkey. Vis Neurosci. 1991;7:561–573. doi: 10.1017/s095252380001035x. [DOI] [PubMed] [Google Scholar]
- McAdams C, Maunsell JHR. Effects of attention on orientation-tuning functions of single neurons in macaque cortical area V4. J Neurosci. 1999;19:431–441. doi: 10.1523/JNEUROSCI.19-01-00431.1999. [DOI] [PMC free article] [PubMed] [Google Scholar]
- Moran J, Desimone R. Selective attention gates visual processing in the extrastriate cortex. Science. 1985;299:782–784. doi: 10.1126/science.4023713. [DOI] [PubMed] [Google Scholar]
- Motter BC. Focal attention produces spatially selective processing in visual cortical areas V1, V2, and V4 in the presence of competing stimuli. J Neurophysiol. 1993;70:909–919. doi: 10.1152/jn.1993.70.3.909. [DOI] [PubMed] [Google Scholar]
- Motter BC. Neuronal correlates of attentive selection for color or luminance in extrastriate area V4. J Neurosci. 1994;14:2178–2189. doi: 10.1523/JNEUROSCI.14-04-02178.1994. [DOI] [PMC free article] [PubMed] [Google Scholar]
- O'Craven KM, Downing PE, Kanwisher N. fMRI evidence for objects as the units of attentional selection. Nature. 1999;401:584–587. doi: 10.1038/44134. [DOI] [PubMed] [Google Scholar]
- Ogawa T, Komatsu H. Target selection in area V4 during a multidimensional visual search task. J Neurosci. 2004;24:6371–6382. doi: 10.1523/JNEUROSCI.0569-04.2004. [DOI] [PMC free article] [PubMed] [Google Scholar]
- Olshausen BA, Field DJ. Sparse coding of sensory inputs. Curr Opin Neurobiol. 2004;14:481–487. doi: 10.1016/j.conb.2004.07.007. [DOI] [PubMed] [Google Scholar]
- Pauls JM, Logothetis NK. Activity of inferior temporal (IT) neurons changes with task context: a comparison of classification and identification. Soc Neurosci Abstr. 2002;28 160.15. [Google Scholar]
- Reynolds JH, Chelazzi L. Attentional modulation of visual processing. Annu Rev Neurosci. 2004;27:611–647. doi: 10.1146/annurev.neuro.26.041002.131039. [DOI] [PubMed] [Google Scholar]
- Reynolds JH, Chelazzi L, Desimone R. Competitive mechanisms subserve attention in macaque areas V2 and V4. J Neurosci. 1999;19:1736–1753. doi: 10.1523/JNEUROSCI.19-05-01736.1999. [DOI] [PMC free article] [PubMed] [Google Scholar]
- Reynolds JH, Pasternak T, Desimone R. Attention increases sensitivity of V4 neurons. Neuron. 2000;26:703–714. doi: 10.1016/s0896-6273(00)81206-4. [DOI] [PubMed] [Google Scholar]
- Rolls ET, Tovee MJ. Sparseness of the neuronal representation of stimuli in the primate temporal visual cortex. J Neurophysiol. 1995;73:713–726. doi: 10.1152/jn.1995.73.2.713. [DOI] [PubMed] [Google Scholar]
- Sakagami M, Tsutsui K. The hierarchical organization of decision making in the primate prefrontal cortex. Neurosci Res. 1999;34:79–89. doi: 10.1016/s0168-0102(99)00038-3. [DOI] [PubMed] [Google Scholar]
- Sakagami M, Tsutsui K, Lauwereyns J, Koizumi M, Kobayashi S, Hikosaka O. A code for behavioral inhibition on the basis of color, but not motion, in ventrolateral prefrontal cortex of macaque monkey. J Neurosci. 2001;21:4801–4808. doi: 10.1523/JNEUROSCI.21-13-04801.2001. [DOI] [PMC free article] [PubMed] [Google Scholar]
- Sakai K, Miyashita Y. Neural organization for the long-term memory of paired associates. Nature. 1991;354:152–155. doi: 10.1038/354152a0. [DOI] [PubMed] [Google Scholar]
- Serences JT, Schwarzbach J, Courtney SM, Golay X, Yantis S. Control of object-based attention in human cortex. Cereb Cortex. 2004;14:1346–1357. doi: 10.1093/cercor/bhh095. [DOI] [PubMed] [Google Scholar]
- Sigala N, Logothetis NK. Visual categorization shapes feature selectivity in the primate temporal cortex. Nature. 2002;415:318–320. doi: 10.1038/415318a. [DOI] [PubMed] [Google Scholar]
- Sugase Y, Yamane S, Ueno S, Kawano K. Global and fine information coded by single neurons in the temporal visual cortex. Nature. 1999;400:869–873. doi: 10.1038/23703. [DOI] [PubMed] [Google Scholar]
- Sugihara T, Edelman S, Tanaka K. Representation of objective similarity among three-dimensional shapes in the monkey. Biol Cybern. 1998;78:1–7. doi: 10.1007/s004220050407. [DOI] [PubMed] [Google Scholar]
- Suzuki W, Matsumoto K, Tanaka K. Neuronal responses of monkey inferior temporal cortex (IT) at different levels of discrimination difficulty. Soc Neurosci Abstr. 2001;27 722.15. [Google Scholar]
- Tanaka K. Inferotemporal cortex and object vision. Annu Rev Neurosci. 1996;19:109–139. doi: 10.1146/annurev.ne.19.030196.000545. [DOI] [PubMed] [Google Scholar]
- Tarr MJ, Cheng YD. Learning to see faces and objects. Trends Cogn Sci. 2003;7:23–30. doi: 10.1016/s1364-6613(02)00010-4. [DOI] [PubMed] [Google Scholar]
- Treue S, Martinetz-Trujillo JC. Feature-based attention influences motion processing gain in macaque visual cortex. Nature. 1999;399:575–579. doi: 10.1038/21176. [DOI] [PubMed] [Google Scholar]
- Tsao DY, Freiwald WA, Tootell RB, Livingstone MS. A cortical region consisting entirely of face-selective cells. Science. 2006;311:670–674. doi: 10.1126/science.1119983. [DOI] [PMC free article] [PubMed] [Google Scholar]
- Tyler LK, Stamatakis EA, Bright P, Acres K, Abdallah S, Rodd JM, Moss HE. Processing objects at different levels of specificity. J Cogn Neurosci. 2004;16:351–362. doi: 10.1162/089892904322926692. [DOI] [PubMed] [Google Scholar]