

Abstract
Thalamic interneurons and thalamic reticular nucleus (TRN) neurons provide inhibitory innervation of thalamocortical cells that significantly influence thalamic gating. The local interneurons in the dorsal lateral geniculate nucleus (dLGN) give rise to two distinct synaptic outputs: classical axonal and dendrodendritic. Activation of metabotropic glutamate receptors (mGluRs) by agonists or optic tract stimulation increases the output of these presynaptic dendrites leading to increased inhibition of thalamocortical neurons. The present study was aimed to evaluate the actions of specific mGluRs on inhibitory GABA-mediated signaling. We found that the group I mGluR (mGluR1,5) agonist (RS)-3,5-dihydroxyphenylglycine (DHPG) or optic tract stimulation produced a robust increase in spontaneous IPSCs (sIPSCs) in thalamocortical neurons that was attenuated by the selective mGluR5 antagonist 2-methyl-6-(phenylethynyl)pyridine hydrochloride (MPEP). In contrast, the group II mGluR (mGluR2,3) agonists (2R, 4R)-4-aminopyrrolidine-2,4-dicarboxylate (APDC) or (2S,2′R,3′R)-2-(2′3′-dicarboxycyclopropyl)glycine (DCG-IV) suppressed the frequency of sIPSCs. In addition, mGluR1,5 agonist DHPG produced depolarizations and mGluR2/3 agonists APDC or L-CCG-I [(2S,1′S,2′S)-2-(carboxycyclopropyl)glycine] produced hyperpolarizations in dLGN interneurons. Furthermore, the enhanced sIPSC activity by optic tract stimulation was reduced when paired with corticothalamic fiber stimulation. The present data indicate that activation of specific mGluR subtypes differentially regulates inhibitory activity via different synaptic pathways. Our results suggest that activation of specific mGluR subtypes can upregulate or downregulate inhibitory activity in thalamic relay neurons, and these actions likely shape excitatory synaptic integration and thus regulate information transfer through thalamocortical circuits.
Keywords: inhibition, interneuron, lateral geniculate, LGN, metabotropic glutamate receptor, presynaptic, thalamus
Introduction
Thalamocortical neurons play an obligate role in the transfer of sensory information to the neocortex. Despite this critical role, nonprimary sensory afferents provide the overwhelming majority of synaptic inputs (>90%) onto thalamocortical relay neurons and can modulate information transfer through the thalamus, thereby suggestive that thalamic gating is a dynamic rather than a passive process (McCormick, 1992; Steriade et al., 1993; Sherman and Guillery, 1998; Guillery and Sherman, 2002; Govindaiah and Cox, 2005, 2006b). Inhibitory mechanisms play an important role in the integration of ascending sensory signals by altering the time course of sensory responses and modifying sensory receptive field properties (Sillito and Kemp, 1983; Berardi and Morrone, 1984; Holdefer et al., 1989; Norton and Godwin, 1992; Uhlrich et al., 1995; Zhu and Uhlrich, 1997; Zhu and Lo, 1998). Inhibitory mechanisms are also critical constituents in the synchronization and maintenance of intrathalamic oscillatory activities associated with various arousal states and certain pathophysiological conditions (Steriade et al., 1993; von Krosigk et al., 1993; Huguenard and Prince, 1994; Cox et al., 1997).
In the visual system, GABA-containing inhibitory interneurons in the dorsal lateral geniculate nucleus (dLGN) innervate thalamocortical relay neurons by classical axodendritic synapses (F1 terminals) and dendrodendritic synapses (F2 terminals) (Guillery, 1969; Ralston, 1971; Famiglietti and Peters, 1972; Hamos et al., 1985; Montero, 1986). F2 terminals are usually involved in “triadic” arrangements in which retinogeniculate fibers provide monosynaptic excitatory inputs onto the thalamocortical relay neuron dendrites as well as F2 terminals (see Fig. 1A). These F2 terminals in turn form inhibitory synaptic contacts onto the dendrites of thalamic relay neurons giving rise to localized disynaptic inhibitory pathway. The physiological role of F2 terminals is not clearly understood but is of significant interest considering their anatomical arrangements. Considering their close proximity to the retinogeniculate innervation of thalamocortical relay neurons, it is speculated that F2 terminals could focally regulate retinogeniculate transmission (Ralston, 1971; Paré et al., 1991; Cox and Sherman, 2000; Munsch et al., 2003; Govindaiah and Cox, 2004). Furthermore, activity of F2 terminals could occur independent of ongoing somatic activity in the interneuron, and thus these F2 terminals may act as independent, local processors allowing the interneurons to serve as multiplexers (Ralston, 1971; Bloomfield and Sherman, 1989; Cox et al., 1998).
Figure 1.
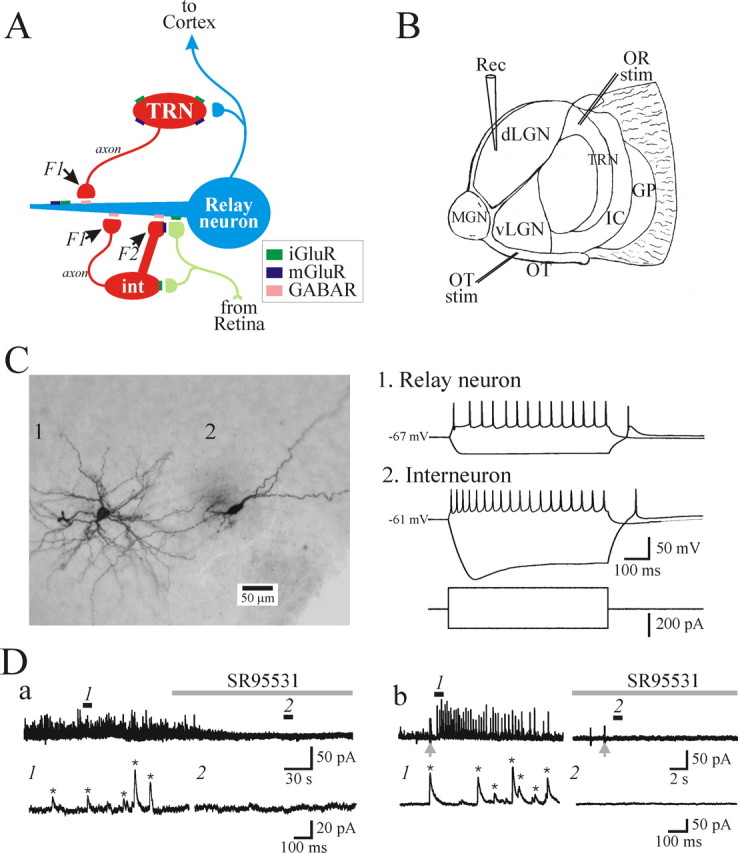
Characterization of GABAergic circuitry in the thalamus. A, Schematic diagram illustrating known inhibitory circuitry in the dLGN. Retinogeniculate axons form excitatory synapses onto relay neurons and dendrites of interneurons (int). These presynaptic dendrites of interneurons (F2 terminals) in turn form inhibitory synapses onto the relay neuron dendrites. Retinogeniculate axons also synapse near the interneuron cell body. Relay neurons also receive conventional axonal inputs (F1 terminals) from dLGN interneurons and TRN neurons. GABAR, GABA receptor. B, Schematic of the thalamic slice preparation used in the present study in which there are intact retinogeniculate and corticothalamic fibers. Retinal and cortical fibers were stimulated by placing the stimulation (stim) electrodes in optic tract (OT) and TRN, respectively. Rec, Recording electrode; OR, optic radiation; GP, globus pallidus; IC, internal capsule; MGN, medial geniculate nucleus; vLGN, ventral lateral geniculate nucleus. C, Representative cytoarchitecture (left) and electrophysiological responses (right) of an identified dLGN relay neuron (1) and interneuron (2). D, Current traces illustrating spontaneous (a) and optic tract-evoked (b) IPSCs recorded from dLGN relay neurons. The bottom traces are faster time bases referring to numbered regions above. The IPSC frequency and amplitude were quantified using Minianalysis software (Synaptosoft). The software detected events based on their amplitude, threshold, and decay time as indicated by the asterisk. Note that no events were detected in the presence of the GABAA receptor antagonist SR95531 (10 μm).
Activation of metabotropic glutamate receptors (mGluRs) located on presynaptic dendrites of interneurons (F2 terminals) by agonists or synaptic activation of retinogeniculate axons increase GABA-mediated inhibition in dLGN relay neurons (Cox et al., 1998; Cox and Sherman, 2000; Govindaiah and Cox, 2004). This increase in inhibitory activity resulting from mGluR activation of F2 terminals is insensitive to the Na+-channel blocker tetrodotoxin (TTX) and occurs independent of somatic membrane potential changes in the interneuron (Cox and Sherman, 2000). Considering the diversity of mGluR distribution and variety of mGluR-mediated actions in the thalamus (Godwin et al., 1996; Liu et al., 1998; Cox and Sherman, 1999; Tamaru et al., 2001), we investigated whether specific mGluR subtypes mediate alterations in inhibitory synaptic transmission in the thalamus. Our data suggest that activation of group I mGluRs (mGluR1,5) and group II mGluRs (mGluR2,3) produce distinct physiological actions within the thalamus. These diverse actions likely play a critical role in integrating cortical and sensory inputs onto thalamocortical relay neurons, thereby influencing thalamic gating.
Materials and Methods
Slice preparation.
Thalamic slices were prepared from young Sprague Dawley rats [postnatal day 11 (P11) to P20] as described previously (Govindaiah and Cox, 2004). Briefly, animals were deeply anesthetized with sodium pentobarbital (50 mg/kg) and decapitated, and brains were removed and placed into cold (4°C) oxygenated (95% O2/5% CO2) slicing solution containing the following (in mm): 2.5 KCl, 26 NaHCO3, 1.25 NaH2PO4, 10.0 MgCl2, 2.0 CaCl2, 234.0 sucrose, and 11.0 glucose. Parasagittal slices (250–300 μm thickness) at the level of dLGN were cut using a vibrating tissue slicer (Turner and Salt, 1998; Govindaiah and Cox, 2004). The slices were incubated at 32°C for at least 60 min before recording. Individual slices were then transferred to the recording chamber that was maintained at 32°C, and slices were continuously superfused (3.0 ml/min) with oxygenated (95% O2/5%CO2) physiological solution containing the following (in mm): 126.0 NaCl, 26.0 NaHCO3, 2.5 KCl, 1.25 NaH2PO4, 2.0 MgCl2, 2.0 CaCl2, and 10.0 glucose.
Whole-cell recording procedures.
Intracellular recordings, using the whole-cell configuration, were obtained with the visual aid of a microscope (Axioskop 2FS; Zeiss, Thornwood, NY) equipped with differential interference contrast optics. A low-power objective (4×) was used to identify nuclei within the slice, and a high-power water immersion objective (63×) was used to visualize individual thalamic neurons. Recording pipettes had tip resistances of 3–5 MΩ when filled with a solution containing the following (in mm) 117.0 K-gluconate, 13.0 KCl, 1.0 MgCl2, 0.07 CaCl2, 0.1 EGTA, 10.0 HEPES, 2.0 Na-ATP, 0.4 Na-GTP, and 0.3% biocytin. The pH and osmolarity of the internal solution were adjusted to 7.3 and 290 mOsm, respectively. In voltage-clamp experiments, electrodes were filled with Cs-gluconate based intracellular solution that contained the following (in mm): 117.0 Cs-gluconate, 13.0 CsCl, 1.0 MgCl2, 0.07 CaCl2, 0.1 EGTA, 10.0 HEPES, 2.0 Na2-ATP, 0.4 Na-GTP, and 0.3% biocytin. Recordings were obtained using a Multiclamp 700A amplifier (Molecular Devices, Sunnyvale, CA). Signals were sampled at 2.5–5 kHz, low-pass filtered at 10 kHz using a Digidata 1320 digitizer, and stored on computer for subsequent analyses using pClamp software (Molecular Devices). Specific cell types, relay or interneurons, were distinguished by their size and electrophysiological properties and subsequent morphological characteristics with biocytin injections that were used to confirm the morphology of cells types (see Fig. 1C). After recording, slices were fixed overnight in 4% paraformaldehyde in 0.1 m phosphate buffer, pH 7.4. Slices were then reacted with avidin–biotin–peroxidase complex (ABC Elite; Vector Laboratories, Burlingame, CA). The neuronal morphology was examined under a light microscope.
Concentrated stock solutions of the different pharmacological agents were prepared and stored as recommended and diluted in physiological saline to a final concentration before use. Agonists were typically applied via a short bolus into the input line of the recording chamber using a syringe pump (Cox and Sherman, 1999; Govindaiah and Cox, 2005). All antagonists were bath applied for at least 5 min before subsequent experimental tests. All compounds were purchased from either Tocris Cookson (Ellisville, MO) or Sigma (St. Louis, MO).
Optic tract or optic radiation stimulation was accomplished with monopolar electrodes using square wave constant current pulses (200–500 μA, 100 μs duration, 200 Hz, 10 pulses) as described previously with minor modifications (Govindaiah and Cox, 2004). Retinogeniculate and corticothalamic fibers were stimulated by placing the electrodes in either optic tract or thalamic reticular nucleus (TRN), respectively (Fig. 1B) (Turner and Salt, 1998; von Krosigk et al., 1999; Govindaiah and Cox, 2004). IPSCs were recorded from dLGN relay neurons and ventrobasal (VB) relay neurons using a cesium-based pipette solution at a 0 mV holding potential to optimize IPSC recordings and to attenuate postsynaptic actions of mGluR agonists on relay neurons (McCormick and von Krosigk, 1992; Cox and Sherman, 2000; Govindaiah and Cox, 2006a). After forming the whole-cell configuration, the recording was allowed to stabilize for at least 5 min before data acquisition.
Data analyses.
Inhibitory currents were detected and analyzed using MiniAnalysis software program (Synaptosoft, Leonia, NJ). The threshold for IPSC detection was 10 pA, and the automatic detection was verified post hoc by visual analysis (see Fig. 1D). This detection criterion was originally established using spontaneous baseline recorded in the presence of the GABAA receptor antagonist 2-(3-carboxypropyl)-3-amino-6-(4-methoxyphenyl)-pyridazinium bromide (SR95531) (10 μm) to avoid false positive responses. With these detection parameters, no events were detected in the presence of SR95531 (see Fig. 1D). For quantification of spontaneous IPSCs (sIPSCs), the average IPSC frequency and amplitude were calculated from 120 s windows 1 min before agonist application and 30 s after agonist application. Quantification of the synaptically evoked sIPSC activity was performed on two consecutive sweeps of 25 s duration for each experimental condition. The agonist-induced membrane potential changes were calculated using Clampfit software (Molecular Devices). The baseline membrane potential was calculated as a 15 s average before drug application, and the peak depolarization/hyperpolarization was calculated as the maximum membrane potential change from a sliding window of 2 s duration. A change in the apparent input resistance of the neuron during agonist application was determined by alterations in the membrane potential responses to single-intensity hyperpolarizing current pulses (10 pA, 500 ms, 0.2 Hz). To reduce voltage-dependent changes in apparent input resistance, we manually adjusted the membrane potential using current injection at the peak of the agonist-induced depolarization to the preagonist level and then obtained amplitude measures in response to the hyperpolarizing current pulses. Summarized data are expressed as mean ± SD (SD), unless noted otherwise. p values <0.05 were considered statistically significant.
Results
Intracellular recordings using the whole-cell configuration were obtained from relay neurons and interneurons in dLGN slices (Govindaiah and Cox, 2004). The specific neuronal subtypes were distinguished by electrophysiological and morphological properties (Fig. 1C) (Hamos et al., 1985; Pape and McCormick, 1995; Williams et al., 1996; Govindaiah and Cox, 2006b). sIPSCs were recorded from dLGN relay neurons using voltage-clamp recording techniques with a holding potential of 0 mV and cesium-containing pipette solution to attenuate postsynaptic actions of mGluR activation (Cox et al., 1998; Cox and Sherman, 2000). In some experiments, high-frequency, short duration, tetanic stimulation of optic tract was used to evoke changes in sIPSC activity (Fig. 1Db). These sIPSCs were completely blocked by the GABAA receptor antagonist SR95531 (10 μm), indicating that these synaptic responses are mediated by GABAA receptors (Fig. 1D).
Activation of mGluR5 increases inhibition in dLGN relay neurons
Consistent with our previous findings (Cox et al., 1998; Cox and Sherman, 2000; Govindaiah and Cox, 2004), the mGluR1,5 agonist (RS)-3,5-dihydroxyphenylglycine (DHPG) produced a robust increase in sIPSC activity in the presence of the sodium channel blocker TTX (1 μm) in a subpopulation of neurons (62%; 28 of 45 neurons) (Fig. 2). This increase in TTX-insensitive sIPSC activity in the dLGN has been attributed previously to selective activation of presynaptic dendrites of the interneurons (i.e., F2 terminals), ultimately leading to increased inhibitory activity onto the relay neurons (Cox et al., 1998; Cox and Sherman, 2000; Govindaiah and Cox, 2004).
Figure 2.

Activation of mGluR5 increases GABAA receptor-mediated sIPSCs in dLGN relay neurons. A, Spontaneous IPSCs recorded from a relay neuron at holding potential of 0 mV in the presence of TTX (1 μm). The mGluR1,5 agonist DHPG (25 μm) increases the frequency of sIPSCs (b) relative to baseline levels (a). The increase in sIPSC activity by DHPG is attenuated in the presence of the specific mGluR5 antagonist MPEP (50 μm; d). The expanded traces on the right correspond to the underlined region in the left traces. B, The graph illustrates the time course of the DHPG-mediated alterations in sIPSC frequency. Each bar represents the number of events in consecutive 30 s bins. C, Cumulative probability (Cum. Prob.) graphs showing a significant decrease in interevent interval by DHPG. D, Population data illustrating the concentration-dependent increase in sIPSC frequency by DHPG and subsequent attenuation by MPEP. Numbers within the bar graph indicate the number of cells tested. Values are plotted as mean ± SD (*p < 0.05; paired t test).
As illustrated in Figure 2, DHPG (25 μm) produced a robust increase in the sIPSC activity in dLGN relay neurons that persisted for several minutes before returning to baseline levels (Fig. 2A,B). As shown in Figure 2C, DHPG produces a significant decrease in the sIPSC interevent intervals (p < 0.001; Kolmogorov–Smirnov test). The population data reveal that DHPG (10–100 μm) produced a significant concentration-dependent increase in sIPSC frequency by 158 ± 60% (n = 4), 320 ± 99% (n = 6), 636 ± 276% (n = 6), and 731 ± 382% (n = 5) at 10, 25, 50, and 100 μm, respectively (Fig. 2D) (p < 0.01; one-way ANOVA). The actions of DHPG (50 μm) were significantly attenuated by the selective mGluR5 antagonist 2-methyl-6-(phenylethynyl) pyridine hydrochloride (MPEP; 30–100 μm) (Fig. 2). In control conditions, DHPG produced an average increase in sIPSC frequency of 417 ± 94% of control, but in the presence of MPEP, the DHPG-mediated increase in sIPSCs was reduced to 133 ± 64% of control (Fig. 2D) (n = 5; p < 0.001; paired t test). The sIPSCs were blocked by the GABAA receptor antagonist SR95531 (10 μm), indicating that these events were GABAA receptor-mediated IPSCs (Fig. 2Ae, SR95531). These data suggest that the TTX-insensitive increase in GABAA receptor-mediated IPSCs in dLGN relay neurons is mediated via mGluR5 receptors.
Activation of mGluR2,3 suppresses inhibition in thalamocortical neurons
In contrast to the mGluR1,5 agonist DHPG, the selective mGluR2,3 agonist (2R,4R)-4-aminopyrrolidine-2,4-dicarboxylate (APDC; 2–100 μm) suppressed sIPSC activity in the presence of TTX (1 μm) in dLGN relay neurons (Fig. 3A,B). APDC produced a concentration-dependent reduction in sIPSC frequency by 37 ± 20% (n = 3), 47 ± 11% (n = 5), 63 ± 21% (n = 6), 60 ± 21% (n = 7), and 54 ± 12% (n = 4) at 2, 10, 25, 50, and 100 μm, respectively (Fig. 3Da) (*p < 0.05; paired t tests). However, APDC did not significantly alter sIPSC amplitudes at any concentration (Fig. 3Db) (p values >0.1; paired t tests). A different mGluR2,3 agonist, (2S, 2′R,3′R)-2-(2′3′-dicarboxycyclopropyl)glycine (DCG-IV) (1–5 μm) also decreased sIPSC activity (n = 4) in a similar manner as APDC. The suppressive actions of APDC on sIPSC activity in the dLGN were blocked by the selective mGluR2,3 antagonist (2S)-2-amino-2-[(1S, 2S)-2-carboxycycloprop-1-yl]-3-xanth-9-yl) propanoic acid (LY341495) (Fig. 3). In TTX (1 μm), APDC (50 μm) produced a 67% reduction in sIPSC activity (predrug, 6.1 ± 2.4 Hz; APDC, 1.9 ± 0.9 Hz; n = 5; p < 0.01; paired t test). In the presence of LY341495 (100–200 nm), the APDC-mediated suppression of sIPSCs was completely blocked (predrug, 6.3 ± 2.3 Hz; APDC, 6.5 ± 2.3 Hz; n = 5; p > 0.5; paired t test).
Figure 3.

Activation of mGluR2,3 suppresses sIPSC activity in dLGN relay neurons. A, Representative current recording from a dLGN relay neuron in the presence of TTX (1 μm) illustrating the suppressive action of mGluR2,3. The mGluR2,3 agonist APDC (10 μm) reduces the IPSC frequency (b) compared with baseline activity (a) in a reversible manner (c). The APDC-mediated reduction in sIPSC activity is blocked in the presence of a specific mGluR2,3 antagonist, LY341495 (200 nm, d). Representative current traces in each condition are shown in an expanded time scale in the left panel. The expanded traces on the right correspond to the underlined region in the left traces. B, The graph illustrates the time course of the APDC-mediated alterations in sIPSC frequency in the absence and presence of LY341495. Each bar represents the number of events in consecutive 30 s bins. C, Cumulative probability (Cum. Prob.) graphs reveal a significant increase in interevent intervals (a) by APDC without altering the sIPSC amplitude (b). D, Population data illustrating the concentration-dependent decrease in sIPSC frequency by APDC (a), but there is no change in sIPSC amplitude (b). Numbers within the bar graph indicate the number of cells tested. The data are plotted as mean ± SD (*p < 0.05).
We next tested whether the facilitatory actions of DHPG could be occluded by pretreatment of APDC. In these neurons, DHPG (25 μm) alone increased the sIPSC frequency from 5.2 ± 2.5 to 15.2 ± 2.1 Hz (n = 3). In the presence of APDC (50 μm), the DHPG-mediated increase in sIPSC frequency was reduced to 7.5 ± 1.8 Hz, which is significantly less than DHPG alone (Fig. 4A) (n = 3; p < 0.01; paired t test). These data suggest that activation of distinct mGluR subtypes, namely mGluR5 and mGluR2/3, can either increase or decrease inhibitory activity in thalamic relay neurons in a TTX-insensitive manner.
Figure 4.
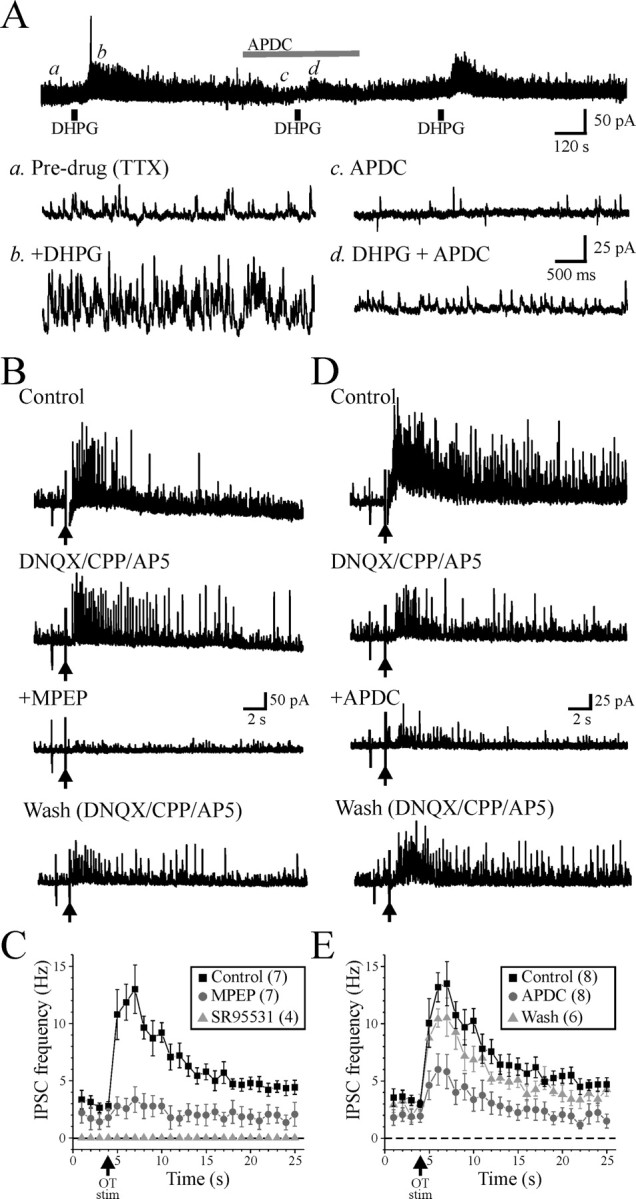
Regulation of inhibitory activity by mGluRs. A, Activation of mGluR2,3 blocks the increased inhibitory actions by mGluR5. Representative current recording from a dLGN relay neuron in TTX (1 μm). The mGluR1,5 agonist DHPG (25 μm) increases the IPSC frequency (b) compared with baseline activity (a) in a reversible manner. In the presence of the mGluR2,3 agonist APDC (50 μm; c), the DHPG-mediated increase in sIPSC activity is significantly reduced (d). Representative current traces for each condition are shown in an expanded time scale. B, In a dLGN relay neuron, optic tract stimulation (350 μA, 200 Hz, 10 pulses; arrow) increases sIPSC activity that persists in the presence of NMDA and non-NMDA glutamate receptor antagonists CPP (25 μm), DNQX (40 μm), and AP-5 (100 μm; DNQX/CPP/AP5). +MPEP, The selective mGluR5 antagonist MPEP (50 μm) significantly reduces the optic tract-mediated increase in sIPSC activity in a reversible manner (wash). C, Population data illustrating the IPSC frequency (hertz) over time starting 3 s before and 22 s after optic tract stimulation in three different conditions: control (■), +MPEP (•), and SR95531 (▴). D, The mGluR2,3 agonist APDC (25 μm) strongly suppresses the increase in sIPSCs produced by optic tract stimulation. E, Population data illustrating the IPSC frequency (hertz) over time starting 3 s before and 22 s after optic tract stimulation (arrow) in three different conditions: control (■), +APDC (•), and wash (▴). The data are plotted as mean ± SEM in B and D.
Activation of mGluR2,3 suppresses synaptically evoked increases in inhibitory activity in thalamocortical neurons
Short duration, high-frequency tetanic stimulation of optic tract can produce the mGluR-mediated increase in sIPSC activity in dLGN relay neurons (Govindaiah and Cox, 2004). Considering our pharmacological data in the present study indicating the role of mGluR5, we tested whether tetanic optic tract stimulation can activate mGluR5 thereby increasing sIPSC activity in relay neurons. Optic tract stimulation (200–450 μA, 200 Hz, 10 pulses) evoked a robust increase in sIPSC activity (Fig. 4B). In the presence of NMDA and non-NMDA glutamate receptor antagonists [(+/−)-3-(2-carboxypiperazin-4-yl)-propyl-1-phosphonic acid (CPP; 25 μm), dl-2-amino-5-phosphonovaleric acid (AP-5; 100 μm), and 6,7-dinitroquinoxaline-2,3-dione (DNQX; 40–60 μm), which will block retinogeniculate activation of local circuit interneurons at the somatic level (Fig. 1A), optic tract stimulation still produced a robust increase in sIPSC activity (Fig. 4) (Govindaiah and Cox, 2004). The selective mGluR5 antagonist MPEP (25–50 μm) attenuated the synaptically evoked increase in sIPSC activity indicating the involvement of mGluR5 (Fig. 4B,C). The peak synaptically evoked increase in sIPSC activity was significantly reduced from 13.0 ± 5.6 Hz in control conditions to 3.3 ± 2.9 Hz in MPEP (Fig. 4C) (n = 7; p < 0.01; paired t test). The subsequent addition of SR95531 (10 μm) completely blocked the sIPSCs, thereby indicating that all of these events are GABAA receptor-mediated IPSCs (Fig. 4C). Our data indicate that the mGluR5 antagonist MPEP attenuates not only the mGluR agonist induced increase in sIPSC activity but also the optic tract evoked increase in sIPSC activity.
Considering mGluR2,3 agonists strongly reduced sIPSC activity, we next tested whether mGluR2,3 agonists reduce optic tract-evoked mGluR5-mediated increases in sIPSC activity. As illustrated in Figure 4D, optic tract stimulation produced an increase in sIPSC activity in the presence of CPP (25 μm), AP-5 (100 μm), and DNQX (40–60 μm). Application of selective mGluR2,3 APDC (25 μm) reduced the optic tract-evoked increase in sIPSC activity in all cells tested. Population data indicate that APDC significantly reduced the peak increase in sIPSC activity produced by optic tract stimulation from 13.5 ± 5.4 to 5.8 ± 4.2 Hz (Fig. 4E) (n = 8; p < 0.01; paired t test). These findings were confirmed by using a different mGluR2,3 agonist, DCG-IV (1 μm), which mimicked the actions of APDC by reducing the optic tract evoked increase in sIPSC activity (n = 3). These data are consistent with the reduction of DHPG-mediated increase in sIPSC activity illustrated in Figure 4A. Because mGluR2,3 agonists reduce the optic tract-mediated increase in sIPSC activity, we next tested whether optic tract stimulation may also activate mGluR2,3, the suppressive actions of which may be masked by the mGluR5-mediated increase in sIPSC activity. In the presence of the mGluR2,3 antagonist LY341495 (200–500 nm), the peak increase in sIPSC activity evoked by optic tract stimulation was not significantly altered (predrug, 14.0 ± 3.0 Hz; LY341495, 18.5 ± 3.0; n = 4; p > 0.1; paired t test). These findings are consistent with our results in which MPEP did not unmask an underlying inhibitory action on sIPSC activity (Fig. 4B,C), further supporting the lack of mGluR2,3 activation by optic tract stimulation. In addition, the selective group III mGluR agonist, l-AP-4 (100–300 μm), which produces presynaptic inhibition of excitatory corticothalamic transmission (Turner and Salt, 1999), did not alter the sIPSC activity in any cells tested (predrug, 5.8 ± 3.5 Hz; l-AP-4, 5.4 ± 3.3 Hz; n = 7; p > 0.3; paired t test).
Differential actions of mGluRs on membrane potential of dLGN interneurons
To test whether selective mGluR agonists alter the membrane potentials of dLGN interneurons, current-clamp recordings of interneurons were made using a K+-based internal solution. Previous studies demonstrated that the general mGluR agonist ACPD or optic tract stimulation in the presence of ionotropic glutamate receptor (iGluR) antagonists do not significantly alter the membrane potential of dLGN interneurons (Pape and McCormick, 1995; Cox et al., 1998; Govindaiah and Cox, 2004). This observation is consistent with the hypothesis that alterations in F2 outputs can occur independent of somatic activity of the interneurons (Bloomfield and Sherman, 1989; Cox et al., 1998). In agreement with these previous reports, ACPD (150 μm) produced a negligible effect on the membrane potential of dLGN interneurons (0.8 ± 1.7 mV; n = 16; p > 0.1; t test). Surprisingly, exposure to selective mGluR1,5 and mGluR2,3 agonists, DHPG and APDC, respectively, produced differential effects on the membrane potential of dLGN interneurons. DHPG (50 μm) produced a robust membrane depolarization that averaged 8.6 ± 3.6 mV (Fig. 5Aa,b) (n = 10; p < 0.01; t test). This depolarization was associated with an increase in input resistance that averaged 130 ± 21% (n = 4) of control levels. The depolarizing actions of DHPG were significantly attenuated by the mGluR5 antagonist MPEP (50 μm) in three of five neurons (Fig. 5Ad) (control, 10.7 ± 1.9 mV; MPEP, 3.2 ± 1.0 mV; n = 3; p < 0.02; paired t test), indicating that the depolarization results from the activation of mGluR5 as well as mGluR1s. In contrast, the mGluR2,3 agonist APDC (25–50 μm) produced a membrane hyperpolarization that averaged 5.2 ± 3.1 mV (Fig. 5Aa) (n = 6; p < 0.01; t test). In these cells, the hyperpolarization was associated with a 24 ± 5% (n = 5) decrease in input resistance. Similar results were obtained with (2S,1′S,2′S)-2-(carboxycyclopropyl)glycine (L-CCG-I) (10 μm), a different mGluR2,3 agonist that produced a hyperpolarization that averaged 6.0 ± 2.5 mV (Fig. 5Ab) (n = 4; p < 0.02; t test). The hyperpolarizing actions of APDC were blocked by the mGluR2,3 antagonist LY341495 (200 nm; n = 4) (Fig. 5Ac). Our results suggest that the apparent lack of effect by ACPD results from the combined actions of mGluR2,3 and mGluR5. In a subset of neurons, ACPD (150 μm) produced an average depolarization of 1.5 ± 1.5 mV (n = 7). In the presence of the mGluR2,3 antagonist LY341495 (200 nm), ACPD produced a significantly larger depolarization averaging 5.6 ± 3.1 mV (Fig. 5Ae) (n = 7; p < 0.01; paired t test). This depolarization was associated with an increase in input resistance that averaged 138 ± 22% (n = 4) of control levels. Conversely, in a different subset of neurons, ACPD produced a negligible change in the membrane potential (−0.4 ± 1.9 mV; n = 5). In the presence of mGluR5 antagonist MPEP (50 μm), ACPD produced a hyperpolarization that averaged −8.3 ± 3.5 mV (Fig. 5Af) (n = 5; p < 0.01; paired t test). This hyperpolarization was associated with a decrease in input resistance that averaged 71 ± 9% (n = 4) of control levels. In contrast to our results in the interneurons, APDC (50–100 μm) did not alter the membrane potential of thalamic relay neurons tested (n = 5) (Fig. 5C). The hyperpolarizing action of mGluR2,3 activation could ultimately reduce the axonal output (F1 terminals) of interneurons, but such an effect would be TTX-sensitive, an effect in addition to the TTX-insensitive response illustrated in Figure 3.
Figure 5.
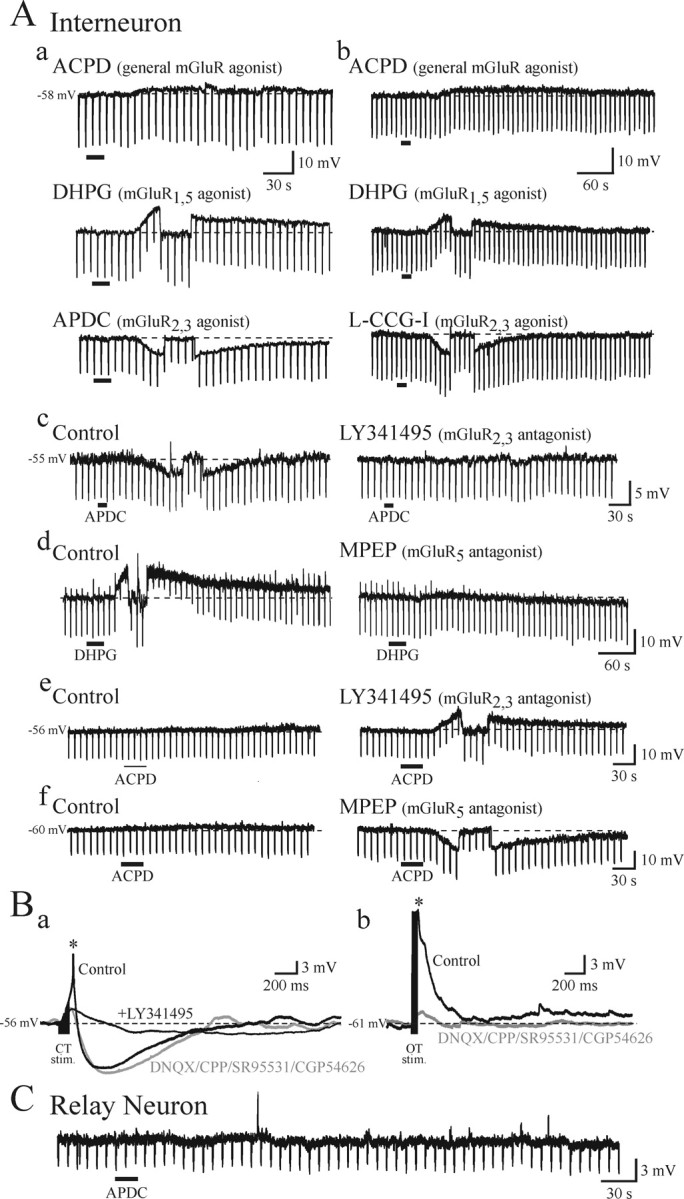
Differential actions of mGluRs on thalamic interneurons. A, Representative voltage traces from dLGN interneurons. The transient downward deflections in these recordings are the membrane responses to short hyperpolarizing current steps used to assess alterations in apparent input resistance. a, ACPD, The general mGluR agonist ACPD (150 μm) has minimal effect on the membrane potential. DHPG, The selective mGluR1,5 agonist DHPG (50 μm) produces a membrane depolarization. Short transient hyperpolarizing potentials are membrane responses to hyperpolarizing current steps (10 pA, 500 ms, 0.5 Hz). At the peak of the DHPG-mediated depolarization, hyperpolarizing current was manually injected to return the membrane potential to predrug levels to test for voltage-independent alterations in input resistance (see Materials and Methods). Similar manipulations were performed in b–f. In contrast, the mGluR2,3 agonist APDC (25 μm) produces a membrane hyperpolarization in the same interneuron (APDC). b, ACPD, In a different interneuron, ACPD (150 μm) produces a negligible depolarization. DHPG, DHPG (50 μm) produces a depolarization in the same neuron, whereas a different mGluR2,3 agonist l-CCG-I (10 μm) produces a membrane hyperpolarization (L-CCG-I). c, The hyperpolarizing action of APDC (25 μm; left trace) is attenuated in the presence of the selective mGluR2,3 antagonist LY341495 (200 nm; right trace). d, The depolarizing action of DHPG (50 μm; left trace) is attenuated in the presence of the mGluR5 antagonist MPEP (50 μm; right trace). e, The general mGluR agonist ACPD (150 μm) produces no apparent change in the membrane potential of an interneuron; however, in the presence of mGluR2,3 antagonist LY341495 (200 nm), the subsequent ACPD application produces a membrane depolarization. f, In a different interneuron, ACPD (150 μm) produces a small depolarization, and in the presence of mGluR5 antagonist MPEP (50 μm), the subsequent ACPD application produces a membrane hyperpolarization. B, Corticothalamic stimulation produces a mGluR2,3-mediated hyperpolarization in interneurons. a, Tetanic stimulation (200 Hz, 10 pulses) of optic radiation (corticothalamic fibers) evokes an early depolarization followed by a longer-lasting hyperpolarization in dLGN interneurons (control). DNQX, CPP, SR95531, CGP54626, In the presence of DNQX (50 μm), CPP (40 μm), SR95531 (10 μm), and CGP54626 (10 μm), the tetanic stimulation produces a long-lasting hyperpolarization. +LY341495, The mGluR2,3 antagonist LY341495 (200 nm) attenuates the hyperpolarization evoked by optic radiation stimulation. b, Tetanic stimulation of optic tract (200 Hz, 10 pulses) does not alter the membrane potential of interneurons in the presence of iGluR antagonists. C, The mGluR2,3 agonist APDC (50 μm) has no apparent effect on the membrane potential of dLGN relay neurons.
Corticothalamic fiber stimulation hyperpolarizes dLGN interneurons
In addition to the retinogeniculate pathway, the other major glutamatergic input to dLGN interneurons arises from corticothalamic neurons. We next tested whether tetanic stimulation of corticothalamic fibers could produce mGluR-mediated synaptic responses in dLGN interneurons. Corticothalamic fiber stimulation (300–500 μA, 200 Hz, 10 pulses) produced a short duration excitation that could lead to action potential discharge (Fig. 5Ba, asterisk), followed by a long-lasting hyperpolarization (Fig. 5Ba). The placement of the stimulating electrode in addition to activating corticothalamic axons that form monosynaptic innervation of relay neurons but may also activate corticothalamic innervation of TRN neurons as well. To avoid confounding effects from TRN neurons and direct iGluR effects on the relay neurons, we applied an antagonist mixture containing DNQX (50 μm), CPP (40 μm), SR95531 (10 μm), and [S-(R*,R*)]-[3-[[[1-(3,4-dichlorophenyl)ethyl]amino]-2-hydroxypropyl](cyclohexyl methyl)phosphinic acid (CGP54626; 10 μm) to block AMPA, NMDA, GABAA, and GABAB receptors, respectively. Under these conditions, corticothalamic stimulation evoked a long-lasting hyperpolarization that averaged 5.0 ± 2.8 mV (n = 4). This synaptically evoked hyperpolarization was significantly attenuated by the mGluR2,3 antagonist LY341495 (Fig. 5Ba) (200 nm; predrug, 5.0 ± 2.8 mV; LY341495, 0.3 ± 0.5 mV; n = 4; p < 0.05; paired t test). In contrast, optic tract stimulation did not produce any lasting membrane potential changes in the presence of the iGluR and GABA antagonists (Fig. 5Bb) (n = 4) (Govindaiah and Cox, 2004).
Decreased inhibition by corticothalamic fiber stimulation
Based on the possible differential long-lasting synaptic actions produced by optic tract stimulation (i.e., increased sIPSC activity) and optic radiation stimulation (i.e., inhibition of interneurons), we next tested the consequences of simultaneous activation of these pathways on the regulation of inhibition in thalamic relay neurons. In the presence of iGluR antagonists, CPP (40 μm) and DNQX (50 μm), optic tract stimulation (200–400 μA, 200 Hz, 10 pulses) produced a robust increase in sIPSC activity (Fig. 6A) (n = 4). The population data reveal that optic tract stimulation alone produced a significant increase in sIPSC activity from 3.8 ± 0.2 to 18.1 ± 1.7 Hz (Fig. 6C, filled square) (n = 4; p < 0.01; paired t test). In contrast, optic radiation stimulation (200–500 μA, 200 Hz, 10 pulses) produced a short-lasting suppression of sIPSC activity (Fig. 6A). Optic radiation stimulation reduced sIPSC frequency from 3.3 ± 0.9 to 1.5 ± 0.6 Hz (Fig. 6C, filled star) (n = 4; p < 0.05; paired t test). Simultaneous stimulation of optic tract and optic radiation led to a suppression of sIPSC activity (Fig. 6A). There was a significant reduction in the sIPSC frequency by the combined stimulation of optic tract and optic radiation compared with optic tract stimulation alone (Fig. 6B) (p < 0.01; Kolmogorov–Smirnov test) but no alteration in sIPSC amplitude (p > 0.2; Kolmogorov–Smirnov test). With the combined stimulation, the peak activity was reduced to 11.5 ± 1.5 Hz, which was significantly lower than the peak activity produced by optic tract stimulation alone (Fig. 6C, filled circle) (n = 4; p < 0.05; paired t test). In these neurons, the subsequent application of APDC mimicked the optic radiation stimulation by also reducing the sIPSC frequency evoked by optic tract stimulation (Fig. 6C, filled triangle) (n = 4).
Figure 6.
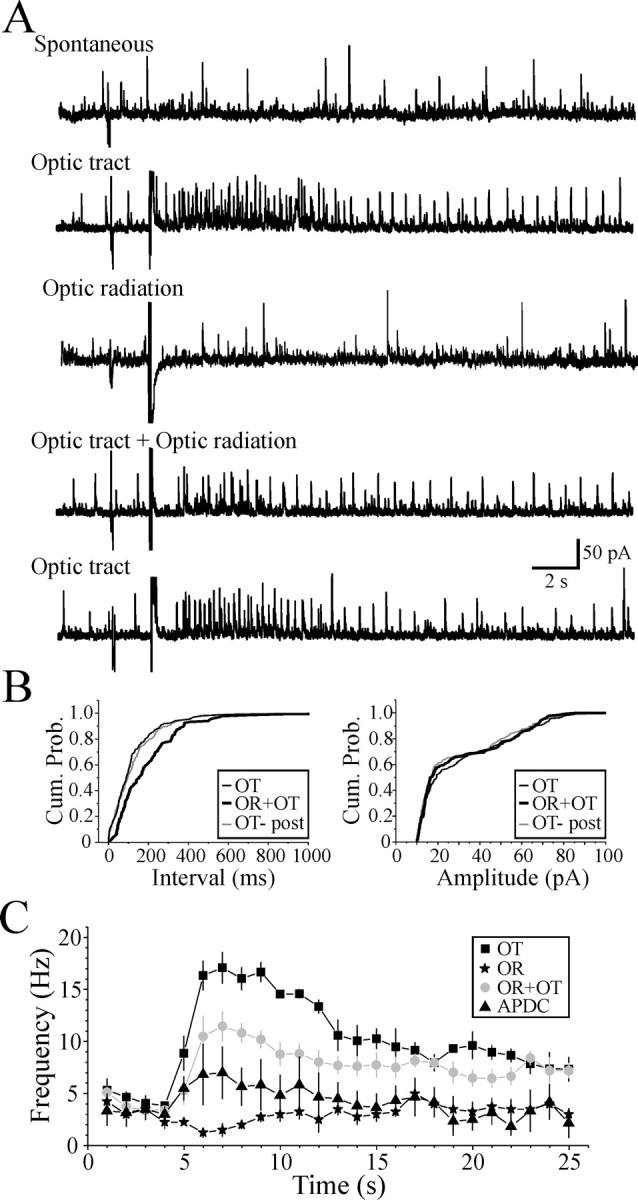
Corticothalamic regulation of GABA-mediated inhibition. A, Optic tract, In the presence of DNQX (45 μm) and CPP (25 μm), optic tract stimulation (300 μA, 200 Hz, 10 pulses) produces a robust increase in sIPSC activity above baseline in a dLGN relay neuron (cf., Spontaneous). Optic radiation, The sIPSC activity is reduced after optic radiation (corticothalamic fibers) stimulation (500 μA, 200 Hz, 10 pulses). Optic tract + Optic radiation, Pairing of optic tract and optic radiation stimulation strongly reduces sIPSC activity compared with optic tract stimulation alone. B, Cumulative probability (Cum. Prob.) plots illustrating the increase in the interevent interval (decreased frequency) of sIPSC activity when optic radiation stimulation is paired with optic tract stimulation (left; p < 0.01; n = 4; Kolmogorov–Smirnov test). The sIPSC amplitude is not significantly altered by the paired stimulation (right). C, Population data illustrating that optic tract stimulation produces a robust increase in sIPSC activity (■). In contrast, optic radiation stimulation produces a subtle decrease in sIPSC activity (★). The pairing of optic radiation and optic tract stimulation leads to a reduction in the increased sIPSC activity produced by optic tract stimulation alone (•). Subsequent application of the mGluR2,3 agonist APDC (25 μm) further reduces the frequency of IPSCs evoked by optic tract stimulation (▴). Data are plotted as mean ± SEM.
Our present data indicate that activation of mGluR2,3 can decrease sISPC activity. We found that mGluR2,3 agonists can reduce sIPSC activity in the presence of TTX, presumably acting on presynaptic terminals. Unfortunately, we cannot distinguish between F1 or F2 type terminals, because both terminal types are present in the rodent dLGN, so we next tested the actions of APDC in a thalamic nucleus that contain very few interneurons. The VB thalamic nucleus contains very few GABAergic interneurons, so this nucleus receives almost exclusive F1 terminal innervation that arises from TRN neurons (Ottersen and Storm-Mathisen, 1984; Arcelli et al., 1997). In the presence of TTX (1 μm), APDC (50 μm) significantly suppressed sIPSC activity by 61 ± 20% in VB relay neurons (Fig. 7) (predrug, 5.2 ± 1.6 Hz; APDC, 2.0 ± 1.1 Hz; n = 8; p < 0.01; paired t test) similar to that observed in dLGN relay neurons. In contrast, the mGluR1,5 agonist DHPG (50 μm) did not alter the sIPSC activity in the VB relay neurons (Fig. 7) (predrug, 4.5 ± 1.7 Hz; DHPG, 5.1 ± 1.7 Hz; n = 8; p > 0.1; paired t test). This latter observation is consistent with the lack of F2 terminals within the VB nucleus.
Figure 7.
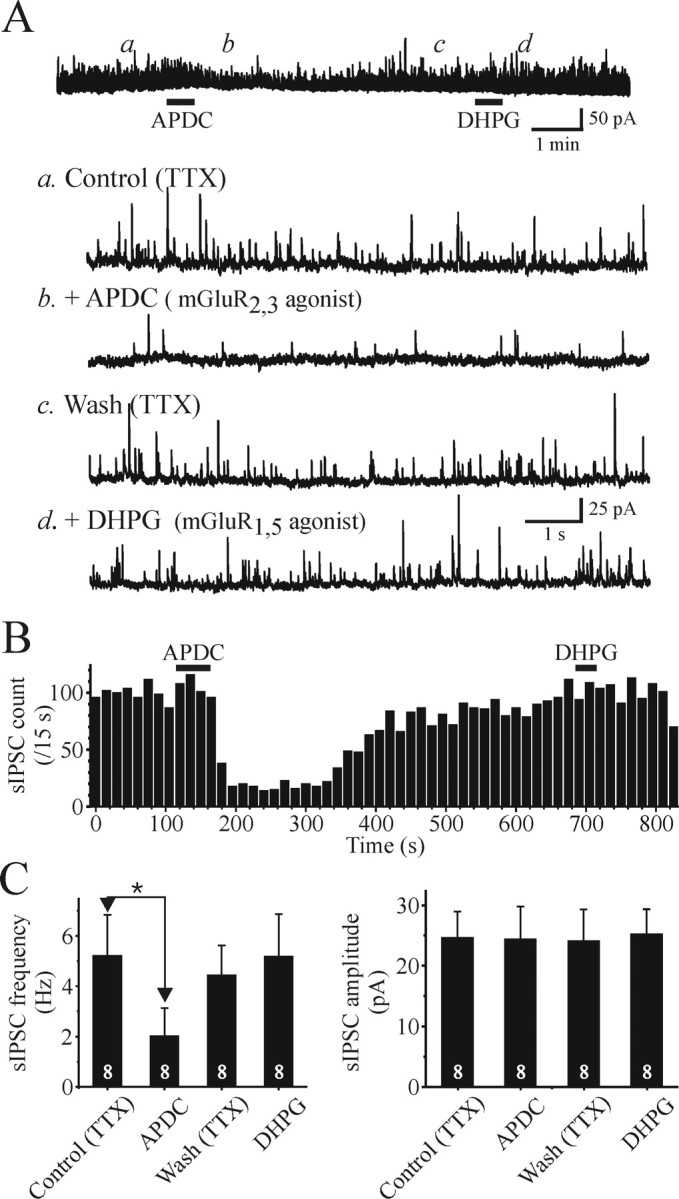
Activation of mGluR2,3 suppresses sIPSC activity in VB relay neurons. A, The mGluR2,3 APDC (25 μm) reduces the frequency of sIPSCs (b) compared with baseline (a) in a reversible manner (c). After recovery, the mGluR1,5 agonist DHPG (50 μm) does not alter the sIPSC activity. B, The graph illustrates the time course of sIPSC frequency in response to the mGluR agonists. Each bar represents the number of events during 15 s bins. C, Graph of population data that illustrates the effects of mGluR agonists on frequency (left) and amplitude (right) of sIPSCs. The numbers within the bar graph indicate the number of cells tested. Values are plotted as mean ± SD (*p < 0.05; paired t test).
Discussion
Our study clearly indicates that mGluRs play a complex role in the regulation of thalamic inhibitory circuitry. Our results provide three fundamental findings. First, the output of GABA-containing presynaptic dendrites (F2 terminals) is upregulated via mGluR5 activation and may be downregulated by mGluR2,3 activation. The alterations occur independent of any membrane potential changes at the interneuron somata. Second, mGluR1,5 activation depolarizes interneurons, whereas mGluR2,3 activation hyperpolarizes interneurons at the somatic level and thus can influence axonal output (F1 terminals) of interneurons. Finally, specific mGluR subtypes and their subsequent influence on inhibitory outputs can be selectively activated by distinct pathways. Optic tract stimulation produces an increase in sIPSC activity in relay neurons via selective mGluR5 activation of F2 terminals. In contrast, corticothalamic fiber stimulation attenuates mGluR5-mediated increases in sIPSC activity and produces a long-lasting hyperpolarization in dLGN interneurons via activation of mGluR2,3.
Inhibitory mechanisms not only play an important role in information transfer through thalamocortical circuits but also serve a critical role in intrathalamic oscillatory activities associated with sleep/wake states and certain pathophysiological conditions such as absence epilepsy (Steriade et al., 1993; von Krosigk et al., 1993; Huguenard and Prince, 1994; Cox et al., 1997; Huntsman et al., 1999; Sherman, 2004; Steriade, 2004). Thalamic interneurons provide inhibition of relay neurons via two distinct outputs: classical axonal outputs (F1 terminals) and presynaptic dendritic outputs (F2 terminals) (Fig. 8). F2 terminals have been of great interest, because they may serve to focally regulate retinogeniculate transmission (Cox and Sherman, 2000; Sherman, 2004; Steriade, 2004). The activity of F2 terminals are thought to occur independently of ongoing activity at the somatic level of the interneuron because of their electrotonic distance from the soma and thus may act as independent, local processors (Ralston, 1971; Bloomfield and Sherman, 1989; Paré et al., 1991; Cox et al., 1998; Govindaiah and Cox, 2004). In contrast to F2 terminals, activation of axonal outputs (F1 terminals) of either interneurons or TRN neurons could produce widespread inhibitory influences on thalamocortical neurons.
Figure 8.
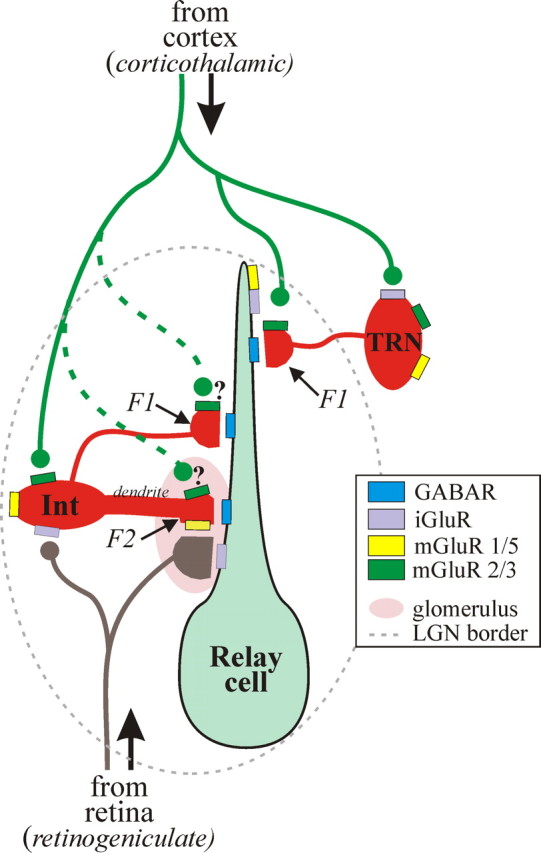
The schematic diagram of thalamic circuitry summarizes our findings regarding the corticothalamic and retinogeniculate innervation of the thalamic circuitry and the neurotransmitter receptors associated with specific synaptic innervation. The solid lines represent circuitry that is strongly supported by data, whereas the dashed green lines remain speculative and cannot be ruled out in the present study. GABAR, GABA receptor; Int, interneuron.
We previously found that activation of mGluRs increases inhibitory activity through the activation of F2 terminals (Cox et al., 1998; Cox and Sherman, 2000). This increased inhibition is insensitive to TTX indicating that the effect was independent of action potential discharge of interneurons (Cox et al., 1998). Furthermore, tetanic stimulation of retinogeniculate fibers, but not corticothalamic fibers, mimicked this increase in inhibition (Govindaiah and Cox, 2004). In this study, we clearly demonstrate that type 5 mGluRs are responsible for this action, which is consistent with anatomical data indicating mGluR5 localization on F2 terminals (Godwin et al., 1996).
In contrast to the mGluR5-mediated increase in inhibition, we found that activation of mGluR2,3 decreased sIPSCs in a TTX-insensitive manner. This decreased sIPSC activity could result from reduced output of F1 (axon terminals) and/or F2 (presynaptic dendrites) terminals, independent of action potential discharge of either interneurons or TRN neurons. To address this issue, we obtained recording from relay neurons in the VB thalamic nucleus, a structure containing very few interneurons and thus consists of virtually only F1 terminal innervation from TRN neurons (Ottersen and Storm-Mathisen, 1984; Arcelli et al., 1997). In VB neurons, mGluR2,3 agonists produced a robust suppression of sIPSC activity similar to dLGN relay neurons. Our findings in the dLGN are consistent with previous reports demonstrating a reduction in TRN inhibitory output through activation of mGluR2,3 and group III mGluRs in VB (Salt and Eaton, 1995; Turner and Salt, 2003); however, we did not detect any group III mGluR-mediated suppression of sIPSCs in dLGN. Furthermore, in the same VB neurons, the mGluR1,5 agonist did not increase sIPSC activity as we had reported previously (Cox and Sherman, 2000). Our data strongly support the conclusion that activation of mGluR2,3 can decrease the output of TRN axon terminals (F1 terminals) in both VB and dLGN.
In previous studies, the general mGluR agonist, ACPD, produces little or no change in the membrane potential of thalamic interneurons, and thus it was concluded that there are minimal mGluR-mediated somatic changes in thalamic interneurons (Pape and McCormick, 1995; Cox et al., 1998; Cox and Sherman, 2000). However, we found that selective mGluR1,5 and mGluR2,3 agonists produce robust membrane depolarizations or hyperpolarizations in dLGN interneurons (Fig. 5). These opposing actions are strikingly similar to that in TRN neurons in which mGluR1,5 activation via a decreased leak K+ current hyperpolarizes TRN neurons. In contrast, activation of mGluR2,3 hyperpolarizes TRN neurons by increasing a leak K+ current (Cox and Sherman, 1999). These membrane potential changes in the interneurons likely influence the discharge properties of the cells and therefore regulate axonal output (F1 terminal). In previous studies, the general mGluR agonist stimulated both mGluR1,5 and mGluR2,3 resulting in minimal overall changes in interneurons (Pape and McCormick, 1995; Cox and Sherman, 2000). It is important to note that these somatic-level alterations occur independent of mGluR5 activation of F2 terminals considering that optic tract stimulation evokes a robust mGluR5-mediated increase in sIPSC activity, but that same stimulation does not produce mGluR-mediated synaptic responses in interneuron recordings (Figs. 5, 6) (Govindaiah and Cox, 2004). We provide evidence that tetanic stimulation of corticothalamic fibers produces a long-lasting hyperpolarization of interneurons via mGluR2,3 activation. Functionally, corticothalamic stimulation can produce a strong excitation of thalamic relay neurons via a disinhibitory action of mGluR2,3 on the interneurons (present study) coupled with the direct excitatory action on thalamic relay neurons via mGluR1,5 (McCormick and von Krosigk, 1992; Govindaiah and Cox, 2006b). As for the endogenous origin of the mGluR1,5-mediated depolarization of interneurons at the somatic level, it remains unknown. Neither retinogeniculate nor corticothalamic stimulation evokes mGluR-mediated depolarizations in interneurons (Fig. 5).
Although agonist-induced actions provide important information regarding potential actions on the overall circuit, perhaps the most intriguing aspect of our study involves the synaptic activation of two different glutamatergic pathways in the thalamus, retinogeniculate and corticothalamic, and how these different pathways engage distinct alterations in inhibitory activity. As illustrated in Figure 8, retinogeniculate stimulation activates mGluR5 leading to increased F2 terminal output independent of somatic changes in interneurons. These “triadic arrangements” (Fig. 8) are contained within glomeruli structures and are usually associated with proximal dendrites of thalamic relay neurons (Guillery, 1969; Ralston, 1971; Wilson et al., 1984; Sherman and Guillery, 2002). Within the cat and primate dLGN, F2 terminals are typically associated with X-type (type II), but not Y-type (type I), relay neurons; however, such a distinction in the rodent is unclear.
Based on previous anatomical evidence and our present data, the TTX-insensitive mGluR2,3-mediated actions on TRN neurons (F1 terminals) may be analogous to F2 terminal output of interneurons. Axonal outputs of TRN neurons (F1 terminals) are primarily located on distal dendrites of thalamic relay neurons and not associated with glomeruli (Wang et al., 2001; Sherman and Guillery, 2002). Corticothalamic fibers primarily innervate distal dendrites of relay neurons, thereby overlapping with TRN innervation (Erisir et al., 1997; Wang et al., 2001). Our data indicate that activation of mGluR2,3 can suppress axonal output of TRN neurons. Unlike the mGluR5-mediated increase in inhibitory activity, which occurs in a subpopulation of relay neurons associated with triadic innervation, mGluR2,3-mediated suppression was observed in almost all relay cells tested. We speculate that mGluR2,3-mediated suppression of F1 terminal output may serve to refine monosynaptic corticothalamic excitation of thalamic relay neurons. Ultimately, mGluR2,3 activation would reduce F1 terminal output and thereby allow greater excitation via the monosynaptic innervation of the relay cell dendrite by glutamate-containing corticothalamic fibers (Fig. 8).
In addition to suppressing TRN axon terminal output, corticothalamic fiber stimulation produces postsynaptic hyperpolarization of dLGN interneurons via mGluR2,3 activation that reduces axonal output (F1 terminals) by decreasing the action potential discharge probability of the interneuron. F1 terminals of interneurons tend to localize outside glomeruli, on the proximal region of relay cell dendrites (Wang et al., 2001; Sherman and Guillery, 2002). Thus, mGluR2,3 activation may produce disinhibition and thereby facilitate the integration of excitatory responses in relay cell dendrites. A key issue to address is under what physiological conditions are mGluR2,3 activated. We have shown that short, high-frequency stimuli, similar to that during burst discharge, is sufficient to activate the mGluR2,3-mediated response, whereas single stimuli do not.
Our results clearly suggest that mGluR-mediated actions occur at multiple sites, resulting in somewhat distinct actions on interneurons and subsequent inhibitory influence on thalamic relay neurons. The overall integration of afferent excitatory synaptic activity onto thalamic relay neurons can be influenced by both focal and widespread inhibitory activity. We hypothesize that focal inhibitory influences on proximal retinogeniculate excitation in thalamic relay neurons would be achieved by the presynaptic F2 terminals of interneurons (via mGluR5), whereas regulation of distal corticothalamic excitation would be influenced by F1 terminals of TRN neurons (via mGluR2,3). In addition, corticothalamic innervation could also influence proximal synaptic integration of relay neurons via the mGluR2,3-mediated hyperpolarization of interneurons and decreased axonal output, and this would be a relatively widespread effect because it would involve the entire axonal arbor of the interneuron. Albeit, these multiple pathways and mechanisms indicate that glutamate, via mGluR activation, can significantly influence synaptic integration and subsequent information gating in thalamocortical circuits. Thus, the ultimate influence of inhibitory actions not only depends on the pathway activated but the specific mGluRs involved, and these different pathways may lead to overall fine-tuning or sculpting that are likely crucial for thalamocortical function.
Footnotes
This work was supported by National Institutes of Health Grant EY014024.
References
- Arcelli P, Frassoni C, Regondi MC, De Biasi S, Spreafico R. GABAergic neurons in mammalian thalamus: a marker of thalamic complexity? Brain Res Bull. 1997;42:27–37. doi: 10.1016/s0361-9230(96)00107-4. [DOI] [PubMed] [Google Scholar]
- Berardi N, Morrone MC. The role of gamma-aminobutyric acid mediated inhibition in the response properties of cat lateral geniculate nucleus neurones. J Physiol (Lond) 1984;357:505–523. doi: 10.1113/jphysiol.1984.sp015514. [DOI] [PMC free article] [PubMed] [Google Scholar]
- Bloomfield SA, Sherman SM. Dendritic current flow in relay cells and interneurons of the cat's lateral geniculate nucleus. Proc Natl Acad Sci USA. 1989;86:3911–3914. doi: 10.1073/pnas.86.10.3911. [DOI] [PMC free article] [PubMed] [Google Scholar]
- Cox CL, Sherman SM. Glutamate inhibits thalamic reticular neurons. J Neurosci. 1999;19:6694–6699. doi: 10.1523/JNEUROSCI.19-15-06694.1999. [DOI] [PMC free article] [PubMed] [Google Scholar]
- Cox CL, Sherman SM. Control of dendritic outputs of inhibitory interneurons in the lateral geniculate nucleus. Neuron. 2000;27:597–610. doi: 10.1016/s0896-6273(00)00069-6. [DOI] [PubMed] [Google Scholar]
- Cox CL, Huguenard JR, Prince DA. Peptidergic modulation of intrathalamic circuit activity in vitro: actions of cholecystokinin. J Neurosci. 1997;17:70–82. doi: 10.1523/JNEUROSCI.17-01-00070.1997. [DOI] [PMC free article] [PubMed] [Google Scholar]
- Cox CL, Zhou Q, Sherman SM. Glutamate locally activates dendritic outputs of thalamic interneurons. Nature. 1998;394:478–482. doi: 10.1038/28855. [DOI] [PubMed] [Google Scholar]
- Erisir A, Van Horn SC, Bickford ME, Sherman SM. Immunocytochemistry and distribution of parabrachial terminals in the lateral geniculate nucleus of the cat: a comparison with corticogeniculate terminals. J Comp Neurol. 1997;377:535–549. [PubMed] [Google Scholar]
- Famiglietti EV, Jr, Peters A. The synaptic glomerulus and the intrinsic neuron in the dorsal lateral geniculate nucleus of the cat. J Comp Neurol. 1972;144:285–334. doi: 10.1002/cne.901440304. [DOI] [PubMed] [Google Scholar]
- Godwin DW, Van Horn SC, Erisir A, Sesma M, Romano C, Sherman SM. Ultrastructural localization suggests that retinal and cortical inputs access different metabotropic glutamate receptors in the lateral geniculate nucleus. J Neurosci. 1996;16:8181–8192. doi: 10.1523/JNEUROSCI.16-24-08181.1996. [DOI] [PMC free article] [PubMed] [Google Scholar]
- Govindaiah G, Cox CL. Synaptic activation of metabotropic glutamate receptors regulates dendritic outputs of thalamic interneurons. Neuron. 2004;41:611–623. doi: 10.1016/s0896-6273(04)00013-3. [DOI] [PubMed] [Google Scholar]
- Govindaiah G, Cox CL. Excitatory actions of dopamine via D1-like receptors in the rat lateral geniculate nucleus. J Neurophysiol. 2005;94:3708–3718. doi: 10.1152/jn.00583.2005. [DOI] [PubMed] [Google Scholar]
- Govindaiah G, Cox CL. Depression of retinogeniculate synaptic transmission by presynaptic D(2)-like dopamine receptors in rat lateral geniculate nucleus. Eur J Neurosci. 2006a;23:423–434. doi: 10.1111/j.1460-9568.2005.04575.x. [DOI] [PubMed] [Google Scholar]
- Govindaiah G, Cox CL. Excitatory actions of synaptically released catecholamines in the rat lateral geniculate nucleus. Neuroscience. 2006b;137:671–683. doi: 10.1016/j.neuroscience.2005.09.021. [DOI] [PubMed] [Google Scholar]
- Guillery RW. The organization of synaptic interconnections in the laminae of the dorsal lateral geniculate nucleus of the cat. Zeitschrift Fur Zellforschung Und Mikroskopische Anatomie. 1969;96:1–38. doi: 10.1007/BF00321474. [DOI] [PubMed] [Google Scholar]
- Guillery RW, Sherman SM. Thalamic relay functions and their role in corticocortical communication: generalizations from the visual system. Neuron. 2002;33:163–175. doi: 10.1016/s0896-6273(01)00582-7. [DOI] [PubMed] [Google Scholar]
- Hamos JE, Van Horn SC, Raczkowski D, Uhlrich DJ, Sherman SM. Synaptic connectivity of a local circuit neurone in lateral geniculate nucleus of the cat. Nature. 1985;317:618–621. doi: 10.1038/317618a0. [DOI] [PubMed] [Google Scholar]
- Holdefer RN, Norton TT, Godwin DW. Effects of bicuculline on signal detectability in lateral geniculate nucleus relay cells. Brain Res. 1989;488:341–347. doi: 10.1016/0006-8993(89)90727-0. [DOI] [PubMed] [Google Scholar]
- Huguenard JR, Prince DA. Clonazepam suppresses GABAB-mediated inhibition in thalamic relay neurons through effects in nucleus reticularis. J Neurophysiol. 1994;71:2576–2581. doi: 10.1152/jn.1994.71.6.2576. [DOI] [PubMed] [Google Scholar]
- Huntsman MM, Porcello DM, Homanics GE, DeLorey TM, Huguenard JR. Reciprocal inhibitory connections and network synchrony in the mammalian thalamus. Science. 1999;283:541–543. doi: 10.1126/science.283.5401.541. [DOI] [PubMed] [Google Scholar]
- Liu XB, Muñoz A, Jones EG. Changes in subcellular localization of metabotropic glutamate receptor subtypes during postnatal development of mouse thalamus. J Comp Neurol. 1998;395:450–465. doi: 10.1002/(sici)1096-9861(19980615)395:4<450::aid-cne3>3.0.co;2-0. [DOI] [PubMed] [Google Scholar]
- McCormick DA. Neurotransmitter actions in the thalamus and cerebral cortex and their role in neuromodulation of thalamocortical activity. Prog Neurobiol. 1992;39:337–388. doi: 10.1016/0301-0082(92)90012-4. [DOI] [PubMed] [Google Scholar]
- McCormick DA, von Krosigk M. Corticothalamic activation modulates thalamic firing through glutamate “metabotropic” receptors. Proc Natl Acad Sci USA. 1992;89:2774–2778. doi: 10.1073/pnas.89.7.2774. [DOI] [PMC free article] [PubMed] [Google Scholar]
- Montero VM. Localization of gamma-aminobutyric acid (GABA) in type 3 cells and demonstration of their source to F2 terminals in the cat lateral geniculate nucleus: a Golgi-electron-microscopic GABA-immunocytochemical study. J Comp Neurol. 1986;254:228–245. doi: 10.1002/cne.902540207. [DOI] [PubMed] [Google Scholar]
- Munsch T, Freichel M, Flockerzi V, Pape HC. Contribution of transient receptor potential channels to the control of GABA release from dendrites. Proc Natl Acad Sci USA. 2003;100:16065–16070. doi: 10.1073/pnas.2535311100. [DOI] [PMC free article] [PubMed] [Google Scholar]
- Norton TT, Godwin DW. Inhibitory GABAergic control of visual signals at the lateral geniculate nucleus. Prog Brain Res. 1992;90:193–217. doi: 10.1016/s0079-6123(08)63615-8. [DOI] [PubMed] [Google Scholar]
- Ottersen OP, Storm-Mathisen J. GABA-containing neurons in the thalamus and pretectum of the rodent An immunocytochemical study. Anat Embryol. 1984;170:197–207. doi: 10.1007/BF00319005. [DOI] [PubMed] [Google Scholar]
- Pape H-C, McCormick DA. Electrophysiological and pharmacological properties of interneurons in the cat dorsal lateral geniculate nucleus. Neurosci. 1995;68:1105–1125. doi: 10.1016/0306-4522(95)00205-w. [DOI] [PubMed] [Google Scholar]
- Paré D, Curró Dossi R, Steriade M. Three types of inhibitory postsynaptic potentials generated by interneurons in the anterior thalamic complex of cat. J Neurophysiol. 1991;66:1190–1204. doi: 10.1152/jn.1991.66.4.1190. [DOI] [PubMed] [Google Scholar]
- Ralston HJ. Evidence for presynaptic dendrites and a proposal for their mechanism of action. Nature. 1971;230:585–587. doi: 10.1038/230585a0. [DOI] [PubMed] [Google Scholar]
- Salt TE, Eaton SA. Distinct presynaptic metabotropic receptors for L-AP4 and CCG1 on GABAergic terminals: pharmacological evidence using novel α-methyl derivative mGluR antagonists, MAP4 and MCCG, in the rat thalamus in vivo. Neuroscience. 1995;65:5–13. doi: 10.1016/0306-4522(94)00464-g. [DOI] [PubMed] [Google Scholar]
- Sherman SM. Interneurons and triadic circuitry of the thalamus. Trends Neurosci. 2004;27:670–675. doi: 10.1016/j.tins.2004.08.003. [DOI] [PubMed] [Google Scholar]
- Sherman SM, Guillery RW. On the actions that one nerve cell can have on another: distinguishing “drivers” from “modulators.”. Proc Natl Acad Sci USA. 1998;95:7121–7126. doi: 10.1073/pnas.95.12.7121. [DOI] [PMC free article] [PubMed] [Google Scholar]
- Sherman SM, Guillery RW. The role of the thalamus in the flow of information to the cortex. Philos Trans R Soc Lond B Biol Sci. 2002;357:1695–1708. doi: 10.1098/rstb.2002.1161. [DOI] [PMC free article] [PubMed] [Google Scholar]
- Sillito AM, Kemp JA. The influence of GABAergic inhibitory processes on the receptive field structure of X and Y cells in cat dorsal lateral geniculate nucleus (dLGN) Brain Res. 1983;277:63–77. doi: 10.1016/0006-8993(83)90908-3. [DOI] [PubMed] [Google Scholar]
- Steriade M. Local gating of information processing through the thalamus. Neuron. 2004;41:493–494. doi: 10.1016/s0896-6273(04)00076-5. [DOI] [PubMed] [Google Scholar]
- Steriade M, McCormick DA, Sejnowski TJ. Thalamocortical oscillations in the sleeping and aroused brain. Science. 1993;262:679–685. doi: 10.1126/science.8235588. [DOI] [PubMed] [Google Scholar]
- Tamaru Y, Nomura S, Mizuno N, Shigemoto R. Distribution of metabotropic glutamate receptor mGluR3 in the mouse CNS: differential location relative to pre- and postsynaptic sites. Neuroscience. 2001;106:481–503. doi: 10.1016/s0306-4522(01)00305-0. [DOI] [PubMed] [Google Scholar]
- Turner JP, Salt TE. Characterization of sensory and corticothalamic excitatory inputs to rat thalamocortical neurones in vitro. J Physiol (Lond) 1998;510:829–843. doi: 10.1111/j.1469-7793.1998.829bj.x. [DOI] [PMC free article] [PubMed] [Google Scholar]
- Turner JP, Salt TE. Group III metabotropic glutamate receptors control corticothalamic synaptic transmission in the rat thalamus in vitro. J Physiol (Lond) 1999;519:481–491. doi: 10.1111/j.1469-7793.1999.0481m.x. [DOI] [PMC free article] [PubMed] [Google Scholar]
- Turner JP, Salt TE. Group II and III metabotropic glutamate receptors and the control of the nucleus reticularis thalami input to rat thalamocortical neurones in vitro. Neuroscience. 2003;122:459–469. doi: 10.1016/j.neuroscience.2003.08.014. [DOI] [PubMed] [Google Scholar]
- Uhlrich DJ, Tamamaki N, Murphy PC, Sherman SM. Effects of brain stem parabrachial activation on receptive field properties of cells in the cat's lateral geniculate nucleus. J Neurophysiol. 1995;73:2428–2447. doi: 10.1152/jn.1995.73.6.2428. [DOI] [PubMed] [Google Scholar]
- von Krosigk M, Bal T, McCormick DA. Cellular mechanisms of a synchronized oscillation in the thalamus. Science. 1993;261:361–364. doi: 10.1126/science.8392750. [DOI] [PubMed] [Google Scholar]
- von Krosigk M, Monckton JE, Reiner PB, McCormick DA. Dynamic properties of corticothalamic excitatory postsynaptic potentials and thalamic reticular inhibitory postsynaptic potentials in thalamocortical neurons of the guinea-pig dorsal lateral geniculate nucleus. Neuroscience. 1999;91:7–20. doi: 10.1016/s0306-4522(98)00557-0. [DOI] [PubMed] [Google Scholar]
- Wang S, Bickford ME, Van Horn SC, Erisir A, Godwin DW, Sherman SM. Synaptic targets of thalamic reticular nucleus terminals in the visual thalamus of the cat. J Comp Neurol. 2001;440:321–341. doi: 10.1002/cne.1389. [DOI] [PubMed] [Google Scholar]
- Williams SR, Turner JP, Anderson CM, Crunelli V. Electrophysiological and morphological properties of interneurones in the rat dorsal lateral geniculate nucleus in vitro. J Physiol (Lond) 1996;490:129–147. doi: 10.1113/jphysiol.1996.sp021131. [DOI] [PMC free article] [PubMed] [Google Scholar]
- Wilson JR, Friedlander MJ, Sherman SM. Fine structural morphology of identified X- and Y-cells in the cat's lateral geniculate nucleus. Proc R Soc Lond B Biol Sci. 1984;221:411–436. doi: 10.1098/rspb.1984.0042. [DOI] [PubMed] [Google Scholar]
- Zhu JJ, Lo FS. Control of recurrent inhibition of the lateral posterior-pulvinar complex by afferents from the deep layers of the superior colliculus of the rabbit. J Neurophysiol. 1998;80:1122–1131. doi: 10.1152/jn.1998.80.3.1122. [DOI] [PubMed] [Google Scholar]
- Zhu JJ, Uhlrich DJ. Nicotinic receptor-mediated responses in relay cells and interneurons in the rat lateral geniculate nucleus. Neuroscience. 1997;80:191–202. doi: 10.1016/s0306-4522(97)00095-x. [DOI] [PubMed] [Google Scholar]