

Abstract
It is not known how the brain decides to act on moving objects. We demonstrated previously that neurons in the macaque supplementary eye field (SEF) reflect the rule of ocular baseball, a go/nogo task in which eye movements signal the rule-guided interpretation of the trajectory of a target. In ocular baseball, subjects must decide whether to pursue a moving spot target with an eye movement after discriminating whether the target will cross a distal, visible line segment. Here we identify cortical regions active during the ocular baseball task using event-related human functional magnetic resonance imaging (fMRI) and concurrent eye-movement monitoring. Task-related activity was observed in the SEF, the frontal eye field (FEF), the superior parietal lobule (SPL), and the right ventrolateral prefrontal cortex (VLPFC). The SPL and right VLPFC showed heightened activity only during ocular baseball, despite identical stimuli and oculomotor demands in the control task, implicating these areas in the decision process. Furthermore, the right VLPFC but not the SPL showed the greatest activation during the nogo decision trials. This suggests both a functional dissociation between these areas and a role for the right VLPFC in rule-guided inhibition of behavior. In the SEF and FEF, activity was similar for ocular baseball and a control eye-movement task. We propose that, although the SEF reflects the ocular baseball rule, both areas in humans are functionally closer to motor processing than the SPL and the right VLPFC. By recording population activity with fMRI during the ocular baseball task, we have revealed the cortical substrate of an oculomotor decision process.
Keywords: smooth pursuit, eye movements, supplementary eye fields, frontal eye fields, ventrolateral prefrontal cortex, superior parietal lobule
Introduction
Imaging and electrophysiological studies have established that the middle temporal area (MT; or its human homolog, hMT+) is involved in determining the speed and direction of visual motion (Albright, 1984; Tootell et al., 1995; Huk et al., 2001; Perrone and Thiele, 2001; Martinez-Trujillo et al., 2005; Nover et al., 2005). In tasks in which monkeys must discriminate the direction of a random-dot stimulus, the response of MT neurons both predicts and influences monkeys' choices (Britten et al., 1996). However, MT is not the end point of motion processing. Motion discrimination studies have implicated a number of cortical regions that appear to process signals arising from MT. For example, neurons in the monkey lateral intraparietal lobe (LIP) also predict motion discrimination performance (Shadlen and Newsome, 1996, 2001; Huk and Shadlen, 2005). Furthermore, most real-world evaluations of moving objects require a range of cognitive functions beyond simple direction discrimination. The neural substrates of these functions have yet to be identified. For example, it is not known how the brain interprets trajectories in the context of a rule and decides on an appropriate action.
In this study, we examined the cortical areas linking motion discrimination to rule-guided action using a version of the “ocular baseball” paradigm (Kim and Heinen, 2001). In ocular baseball, subjects judge whether the extrapolated trajectory of a moving target will cross a distant visible line segment (the “strike zone”). If they decide it will, subjects follow the target with eye movements. If not, they must withhold eye movements and maintain fixation. We have shown previously that activity in the monkey supplementary eye field (SEF) reflects the rule-evaluation component of the decision process in this task (Kim et al., 2005; Yang et al., 2005).
Based on this previous result, here we ask whether activity related to this task could also be found in human cortical eye fields. To answer this question, we used an event-related functional magnetic resonance imaging (fMRI) design that allowed us to measure population activity that is difficult with single-cell recording and also reveal for the first time other cortical areas involved in ocular baseball. We first determined the location of the SEF and frontal eye fields (FEFs) using a localizer task. Event-related scans were then performed with three conditions: “always-nogo,” in which subjects maintained fixation on every trial; “always-go,” in which they made eye movements to the target on every trial; and ocular baseball. Eye movements were measured in the scanner, and baseball trials were separated into two categories: “decided-nogo,” in which subjects chose to maintain fixation; and “decided-go,” in which subjects chose to make an ocular response.
In all subjects, consistent activity in ocular baseball relative to control conditions was observed in the FEF, SEF, bilateral superior parietal lobule (SPL), and right ventrolateral prefrontal cortex (VLPFC). In addition, in the right VLPFC but not in the SPL, activity was greater during decided-nogo trials than during decided-go trials. Our results suggest that these areas comprise a cortical pathway involved in rule-based oculomotor decision making.
Materials and Methods
Subjects
Subjects were six individuals: three right-handed males (subjects JB, RM, SY), two right-handed females (subjects AV, CI), and one left-handed female (subject NT). The subjects' ages ranged from 20 to 37 years. Protocols were approved by both the Stanford and the Smith-Kettlewell Eye Research Institute Review Boards, and informed consent was obtained from all subjects.
Data acquisition.
Functional data were collected on a 3T GE Signa fMRI scanner (GE Healthcare, Waukesha, WI) using a single-shot spiral K-space sampling trajectory (Noll et al., 1995). Whole-head data were acquired in 30 axial slices with an inplane resolution of 3.1 × 3.1 mm, a slice thickness of 4 mm, and a repetition time of 2 s. Eye movements were recorded during all scan sessions using custom video-based EyeTracker hardware linked to a commercial analysis package (Viewpoint; Arrington Research, Scottsdale, AZ). Eye-movement traces had a temporal resolution of 30 Hz and a measured spatial accuracy of better than 0.25°. Stimuli were presented using a liquid crystal display-based projector system combined with a long-throw lens to place an image on a ground-glass screen mounted on the headcoil that the subjects viewed through a mirror. The optical distance to the screen was 24 cm, and the effective field of view of the display was 24 × 20° in diameter. The entire display system was calibrated photometrically using a photospectrometer (Ocean Optics, Dummelin, FL) and temporally using a photodiode connected to an oscilloscope. All stimuli generated were within display tolerances of the system. Stimuli were generated on a Macintosh Powerbook under OS9 using the Psychophysics toolbox (Brainard, 1997; Pelli, 1997) and Matlab (MathWorks, Natick, MA).
Experimental design.
Scanning sessions began with the eye-field localizer experiment, which consisted of alternating 18 s blocks of fixation and 18 s blocks of saccades. During movement blocks, subjects made self-paced saccades from a central fixation point to a 10° eccentric location. During control blocks, they fixated on the central target. Six cycles were repeated for the duration of the scan.
For the main experiment, an event-related fMRI paradigm was used to determine activity in three conditions: always-nogo, always-go, and ocular baseball. Trials for each condition were balanced and randomly ordered for the duration of each scan. The total number of trials per scan was 40. A 9 s pause was inserted between the beginning of the scan and the onset of stimuli so that the magnetic field could reach equilibrium. Total scan length was 289 s. All subjects completed eight scans during one session, except subject SY, who completed a total of nine scans in one session.
On each trial, subjects were asked to focus on a blue [Commission Internationale de l'Eclairage (CIE) coordinates 12.9, 0.201, 0.155] central fixation point (Fig. 1). The duration of this fixation point was jittered to improve the power of the blood oxygenation level-dependent (BOLD) analysis (Dale, 1999; Liu et al., 2001). The amount of jitter was chosen on each trial randomly from a uniform distribution of values between 0.54 and 3.46 s, with an average of 2 s. After the fixation period, the fixation point would change color for 1 s to indicate the task to be performed: green (CIE coordinates 8.57, 0.285, 0.403) indicated an always-go trial; red (CIE coordinates 13.8, 0.368, 0.310) indicated an always-nogo trial; and white (CIE coordinates 22.1, 0.281, 0.304) indicated ocular baseball. Except for this brief change of fixation color, stimuli in all conditions were identical.
Figure 1.

a, Baseball configuration, showing eight possible strike-zone locations, bluish fixation, and target moving from the center toward the strike zone (trajectory indicated by arrow, not part of stimulus display). b, Subjects fixate on a blue central fixation point between 0.54 and 3.46 s. The fixation point then changes color and increases in size for 1 s to inform the subject of the task to be performed. Green, Always-go; red, always-nogo; white, ocular baseball. Next, the fixation point returns to its original size and color, and a target begins to move away from this central fixation point at an average speed of 1.75°/s (see Materials and Methods). A strike zone appears in a pseudorandomly determined location 10° from the fixation point. Subjects were instructed to maintain fixation during this phase for all trial types. Three seconds after stimulus onset, a green response cue at fixation appears, informing subjects to respond. Subjects then continue to fixate or pursue for the remainder of the trial (1 s). The target never crosses the strike zone, reaching only 7° eccentricity from the fixation point.
After the 1 s preparatory phase, the fixation point turned blue again, and a target spot began to move away from the central fixation point at an average speed of 1.75°/s. Noise was added to the target spot trajectory to make the task more difficult and to force the subjects to integrate motion information over the entire target presentation duration, by wobbling both x and y target positions randomly between the range of +3 and −3 pixels (approximately +3 to −3 arcmin) per frame. On each trial, a strike zone, defined by a 2° line oriented perpendicular to a virtual line that would bisect it and intersect the fixation point (Fig. 1), appeared in a pseudorandom location 10° eccentric from the fixation point.
Subjects were instructed to maintain fixation during all trials until the fixation point changed to green after 3 s of stimulus presentation. This was the cue for subjects to respond. On ocular baseball trials, subjects had to decide whether the trajectory of the target would cross the strike zone or not. Subjects were instructed to respond with an eye movement to the target if they thought it would cross the strike zone (decided-go trials). If they thought it would miss the strike zone, they were instructed to maintain fixation for the duration of the trial (decided-nogo trials). In control tasks, subjects were instructed to either maintain fixation for the duration of the trial in the always-nogo condition (mimicking the motor behavior of a decided-nogo trial) or to follow the target with an eye movement in the always-go condition (mimicking the motor behavior of a decided-go trial). The fixation point remained green for 1 s until the trial was finished. The target only ever reached 7° eccentricity and therefore never reached the strike zone, forcing subjects to make their decision based on an extrapolated trajectory.
We analyzed eye movements to ensure that subjects were performing the ocular baseball task and to further separate ocular baseball trials into the decided-go and decided-nogo conditions. Figure 2 shows representative decided-go and decided-nogo trials for subject SY. In these trials, he either followed the target with an eye movement (Fig. 2a) or maintained fixation (Fig. 2b).
Figure 2.

Eye movements during ocular baseball in the scanner. a, b, Two-dimensional eye trace indicating a decided-go judgment (a) and decided-nogo judgment (b). Green, Strike zone location; black, target location from beginning of target onset to end of trial; red “X,” extrapolated location for target crossing; red line, two-dimensional eye trace after the “go” cue. c, d, Horizontal eye position (h. eye pos.) and vertical eye position (v. eye pos.) for the corresponding two-dimensional eye trace over the entire trial duration is plotted in c for the decided-go trial and in d for the decided-nogo trial. The green line represents the onset of the go cue.
Data analysis.
Eye records were analyzed using Matlab to determine that subjects had performed the task, and also to distinguish their responses in ocular baseball. Saccades during the response phase were identified automatically by detecting points in the eye trace where eye position changed by >2° in a single 33 ms sampling period. Although, in theory, we could not have detected rapid refixation saccades that occurred entirely within the 33 ms sampling period (leaving the fixation position unchanged), other experiments conducted with the same eye-tracking system running at 60 Hz identified no such events. Eye traces were manually rechecked by an expert operator to ensure the accuracy of the saccade-detection routine. If fixation remained unchanged during the response phase, the trial was labeled decided-nogo (Fig. 2).
Imaging data were analyzed using the Stanford VISTASOFT package (http://white.stanford.edu/software/) running under Matlab 7.0. For each session, anatomical T1-weighted scans were performed in the same location as the functional data. These anatomical “inplanes” were coregistered with a high-resolution structural anatomy scan acquired in a separate session using a magnetization-prepared rapid acquisition gradient echo sequence to optimize gray/white matter contrast. The resulting registration transform was applied to the functional data and statistical maps so that these could be analyzed in a standard reference frame. The reference points for the Talairach transform were then specified in this standard reference frame, and the Talairach coordinates for any point in this frame could therefore be computed.
High-resolution anatomical images.
The high-resolution structural images were acquired at a resolution of 1.2 × 0.9 × 0.9 mm. Our standard procedure is to acquire three high-resolution data sets in different orientations. Each dataset is preprocessed using the FSL toolbox to remove global gradients in intensity and resampled using a sinc interpolation to a 1 × 1 × 1 mm isotropic voxel size. The three datasets are then averaged together to improve the image quality.
Anatomical datasets are segmented using a semiautomatic procedure. An estimate of the white-matter volume for each subject is first made automatically using a maximum-likelihood procedure that accounts for three-dimensional topology. This segmentation is then refined by an expert human operator to remove topological defects (“handles”) in the volume. The surface of the white matter can then be rendered as a mesh, and the location of the gray matter can be inferred. Full details of this procedure are described by Teo et al. (1997) and Wandell et al. (2000).
The purpose of the high-resolution anatomical datasets is threefold. Most importantly, it provides a standard reference frame to which many functional scans can be aligned. This allows us to compare activation in individual subjects across scanning sessions. Second, by localizing the cortical gray matter, we can restrict our analysis to a small subset of the voxels in the dataset (those that intersect the gray matter). This simplifies and improves our functional analysis. Third, the two-dimensional representation of the cortical surface allows us to render functional activity in three dimensions to assist the data visualization.
Anatomical inplanes.
During each functional imaging session, we acquire anatomical inplanes in the same locations as the functional data. These anatomical images are T1-weighted spoiled gradient-recalled acquisition in a steady state with a resolution of ∼1.5 × 1.5 × 4.0 mm and the same field of view as the subsequent functional datasets. The purpose of the inplane images is to simplify the registration of the functional data to the high-resolution anatomical datasets (see above). Coregistration of two T1-weighted datasets is easier than registering a T2* dataset to a T1-weighted set because T1-weighted datasets have higher resolution, and their tissue intensities are the same.
Functional data analysis
For the block-design localizer experiments, the coherence of the response with a reference sine wave was computed. This is a robust and conservative measure of the correspondence between the actual BOLD signal response and the approximately harmonic waveform generated by convolving the block-design stimulus matrix with a realistic hemodynamic response function. It is equivalent to a voxel-by-voxel computation of the power at the stimulus frequency divided by the total power (Engel et al., 1997; Press et al., 2001). For these scans, a coherence threshold of 0.4 corresponds to a p value of <0.001 (Bandettini et al., 1993).
Our event-related analysis methods are similar to those described by Grill-Spector et al. (2006). Event-related analyses, including application of general linear models (GLMs) and hypothesis tests to generate contrast maps, were performed using the VISTASOFT event-related fMRI analysis toolbox as outlined by Dale and Buckner (1997) and Burock and Dale (2000). This package implements a standard GLM to estimate the average BOLD response to each event type using a least-squares fitting procedure. Mathematically, this is similar to averaging sections of the time series in a stimulus-locked manner. A baseline estimate from each prestimulus epoch and the cortical response to each stimulus type were then defined as the mean amplitude of the BOLD response during a 6 s window beginning 3 s after the stimulus onset.
The group analysis was performed using SPM99 in a standard manner. Functional data from each subject was convolved using a three-dimensional Gaussian kernel (full-width at half-maximum = 8 × 8 × 8 mm). Statistical significance was set to p < 0.001 with a cluster size of >10 voxels.
Results
We first performed a block-design localizer scan to define regions of interest (ROIs) for the frontal cortical eye fields (the SEF and FEF). The SEF and FEF could be localized in five of the six subjects in regions consistent with previous imaging studies (Grosbas et al., 1999; Petit and Haxby, 1999; Koyama et al., 2004; Connolly et al., 2005) (Fig. 3; Table 1). The sixth subject (CI, a right-handed subject) did not show activity in the localizer task that could be clearly attributed to either the SEF or FEF and was removed from additional analysis of the eye fields.
Figure 3.

Representative fMRI localizer activity, showing FEF and SEF activity in an axial slice from subject JB. The self-paced saccade task is more than fixation. Activation was thresholded at p < 0.001. Regions shown were more activated during self-paced saccades than during fixation.
Table 1.
Average Talairach coordinates (in millimeters) (Talairach and Tournoux, 1988) for the frontal cortical eye fields as defined by our localizer task, by subject
| Subjects | Right hemisphere |
Left hemisphere |
||||
|---|---|---|---|---|---|---|
| x | y | z | x | y | z | |
| SEF | ||||||
| JB | 5 | −1 | 53 | −7 | −2 | 57 |
| AV | 5 | −11 | 63 | −5 | −13 | 63 |
| SY | 2 | −6 | 59 | −4 | −7 | 62 |
| RM | 4 | 0 | 55 | −3 | −5 | 56 |
| NT | 2 | −12 | 63 | −4 | −11 | 64 |
| FEF | ||||||
| JB | 34 | −5 | 49 | −29 | −10 | 52 |
| AV | 30 | −14 | 58 | −30 | −13 | 53 |
| SY | 28 | −14 | 58 | −41 | −19 | 44 |
| RM | 28 | −7 | 53 | −30 | −9 | 52 |
| NT | 28 | −14 | 48 | −43 | −11 | 49 |
In the event-related experiment, the SEF and FEF, as defined by the localizer, were significantly active in most experimental conditions except the always-nogo condition, based on a comparison of BOLD response amplitude during the task (p < 0.05, one-tailed t test) (Fig. 4). The only exception was that the always-go condition only reached marginal significance in the FEF (p = 0.059). Although significant activity in the eye fields may be unsurprising for tasks involving eye movements (the decided-go and always-go conditions), we noted that activity in the decided-nogo condition was also significantly greater than baseline in both the SEF and FEF (p < 0.05, one-tailed t test) (Fig. 4), despite identical motor behavior as in the nonsignificant always-nogo condition.
Figure 4.

Mean amplitude (percentage of BOLD signal) for SEF and FEF ROIs in each of the four experimental conditions (decided-go, decided-nogo, always-go, and always-nogo) averaged across ROIs for all subjects. The baseline average of amplitude is represented by 0%. Error bars indicate SEM. *p < 0.05.
We also analyzed imaging data outside of these eye field ROIs to determine which other areas cooperate with the cortical eye fields during performance in ocular baseball. Because each baseball condition (decided-go and decided-nogo) and its corresponding control (always-go and always-nogo, respectively) involve the same perceptual and motor elements, and vary only according to their cognitive demands, a comparison of each baseball condition with its control should yield activated regions involved in baseball task-related processing.
We first analyzed data for individual subjects. The average BOLD signal amplitude was calculated for each condition based on a GLM applied to event-related whole-brain activity for each subject. We then compared individual subjects' whole-brain activity in the always-nogo or always-go conditions with activity in the corresponding ocular baseball conditions (decided-nogo and decided-go, respectively) by generating whole-brain contrast maps indicating statistical differences between the two conditions being compared. Consistently higher baseball-related activation was found for all subjects in the SPL [approximately Brodmann's area (BA) 7] and right VLPFC (p < 0.01). Activity in the VLPFC for individual subjects was found at the intersection of the right inferior frontal gyrus and insula and covered parts of Brodmann's areas BA47 and BA13. The Talairach coordinates for each subject's ROIs for these regions are listed in Table 2. We then plotted the mean amplitude of each condition for each subject in these regions (Fig. 5a,b).
Table 2.
Average Talairach coordinates (in millimeters) for the three ocular baseball-related ROIs outside of the eye fields, by subject
| Subjects | x | y | z |
|---|---|---|---|
| SPL, right | |||
| JB | 12 | −73 | 53 |
| AV | 15 | −73 | 49 |
| SY | 13 | −77 | 43 |
| CI | 18 | −70 | 47 |
| RM | 15 | −67 | 56 |
| NT | 14 | −73 | 49 |
| VLPFC, right | |||
| JB | 31 | 25 | −3 |
| AV | 28 | 25 | 12 |
| SY | 34 | 21 | 13 |
| CI | 28 | 25 | 6 |
| RM | 26 | 22 | 5 |
| NT | 29 | 20 | 11 |
Figure 5.
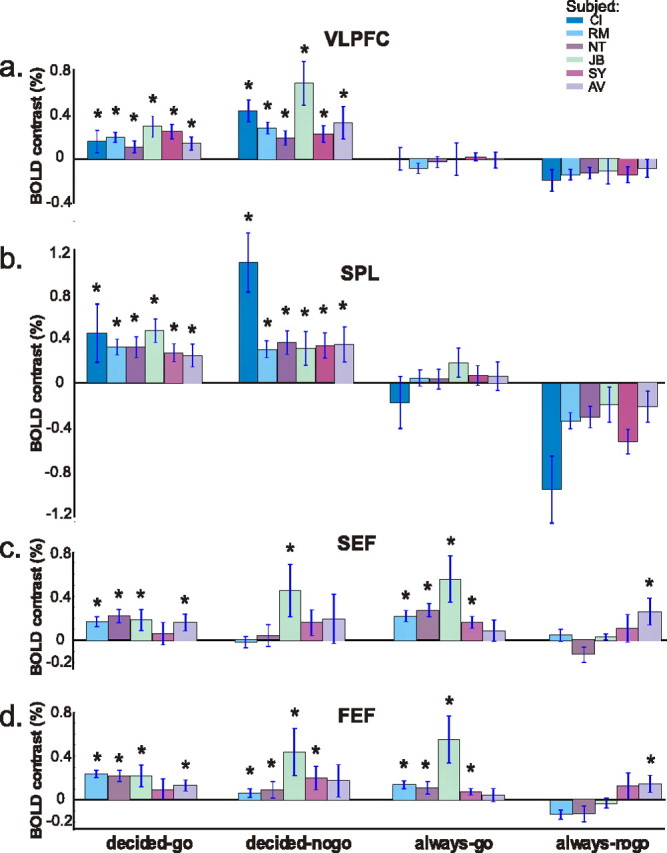
Mean amplitude percentage of signal for the right VLPFC (a), SPL (b), SEF (c), and FEF (d) ROIs, grouped by condition for each subject. The baseline average of amplitude from a period preceding the start of a trial is represented by 0%. Asterisks indicate significance above baseline (p < 0.05).
The individual subject analysis also allowed us to detect more subtle differences in the dynamic characteristics of these regions. Activity from the right VLPFC and the SPL (Fig. 5a,b) were averaged across subjects, showing that the mean amplitude difference between decided-nogo and decided-go was significant in the right VLPFC (p < 0.01, two-tailed t test) but not in the SPL (p = 0.4177, two-tailed t test). The difference between activity in each baseball condition and their respective control conditions was significant for both areas (p < 0.002 for all comparisons, two-tailed t test). Interestingly, the SPL showed reduced activity in the always-nogo condition compared with the baseline, whereas the right VLPFC did not.
Individual measurements obtained from the SEF and FEF (Fig. 5c,d) reveal heightened activity in all conditions except always-nogo, although not as markedly or as consistently as significant responses from the right VLPFC or SPL (Fig. 5). Also note that, whereas the SEF and FEF show significant activity for the always-go condition (p < 0.05) (Figs. 4, 5c,d), the right VLPFC and SPL do not (Fig. 5a,b).
Whole-brain group averaging was then performed to further quantify the activity seen in the different conditions. When contrasting activity in the always-nogo and decided-nogo conditions, group averaging revealed three strong loci of activity in the decided-nogo condition: a parietal locus covering the bilateral SPL, right VLPFC, and right frontolateral cortex BA6 (p < 0.001; extent threshold = 10 voxels) (Fig. 6). All sites were consistent with results from the individual subject analysis. The result from BA6 overlaps individual subjects' ROIs for the FEF and probably represents the heightened FEF activity found for the group ROI analysis. The SEF, however, was not found in this analysis. This is not surprising, considering the small size and variable location of individual SEFs (Grosbas et al., 1999). As in the individual subject analysis, VLPFC activity was specific to the intersection of the right inferior frontal gyrus and insula. Although SPL was activated bilaterally, the right-hemisphere locus reached a greater level of significance and had a broader activation than the left (Fig. 6).
Figure 6.

Group average of whole-brain activity indicating regions where activity is greater in the decided-nogo condition than the always-nogo condition. Functional activity is superimposed on T1 structural images in axial slices, from z = −8 to z = 64, spaced 8 mm apart. The color bar represents t values thresholded at p < 0.001, and the extent threshold = 10 voxels. Group average reveals activity in the bilateral SPL (the two parietal loci), right VLPFC (the inferior frontal loci), and right BA6 (the superior frontal loci). R-L, Right–left.
A group comparison between activity in the decided-go and always-go conditions should reflect differential activity related to processing components of the baseball task. When comparing the group average for the decided-go condition versus the always-go condition, the right VLPFC again showed significant activation (p < 0.001; extent threshold = 10 voxels), whereas the SPL was slightly below statistical threshold (p < 0.005; extent threshold = 10 voxels). No other areas showed significant or near-threshold activation. The fact that the two group comparisons yielded similar activated regions suggests that the decided-go/always-go contrast was merely a less powerful comparison than the decided-nogo/always-nogo contrast.
To force subjects to concentrate on the task, ocular baseball difficulty was set to a level such that subjects performed between 63 and 81% correct in the scanner. To investigate the possibility that error trials resulted in a different pattern of activation, we analyzed errors during ocular baseball. Baseball trials were categorized into post hoc conditions “decided-go error” (in which subjects decided to go when the target trajectory would not have hit the strike zone) and “decided-nogo error” (in which subjects decided not to go when the target trajectory would have hit the strike zone). We likewise grouped the correctly performed trials into “correct decided-go” and “correct decided-nogo” conditions. We then compared the mean amplitude of the BOLD signal for each error condition to the mean amplitude of the respective correct condition for each subject in the SPL, FEF, and SEF, and right VLPFC. This analysis showed no systematic differences for error trials compared with correct trials within each condition.
Discussion
It is known that tasks involving visuospatial attention and saccade planning activate a network of frontoparietal areas (Muri, 2005). We have isolated the FEF, SEF, SPL, and right VLPFC as cortical regions active during performance of an ocular baseball task. As expected, activity in the SEF and FEF was greater during both baseball and always-go trials than during always-nogo trials, consistent with the role that these areas play in saccade planning and execution. However, the SPL and right VLPFC were more active in baseball trials than either the always-go or always-nogo control conditions. This is likely attributable to cognitive task-related processing, because the control trials and the baseball trials were conducted with identical stimuli and required identical behavioral responses. Finally, in the right VLPFC, but not the SPL, activity was greatest during baseball trials involving active eye movement inhibition.
Heightened activity observed in the SEF during the baseball task is consistent with previous single-cell recording results from monkeys showing that SEF neurons reflect the trajectory of an ocular baseball target in the context of the task rule (Kim et al., 2005). Together, these results suggest that monkey and human SEF have similar functions during this task, and that human SEF could be either involved directly in making the decision to pursue the target or merely reflects the decision as it is converted to action. Although our results cannot discriminate between these alternatives, the SEF was also active in the always-go condition, evidence that it is minimally involved in some aspect of movement preparation or execution. Additional support for this comes from the localizer that defined this area as saccade related and from work describing saccadic and smooth-pursuit neurons in monkey SEF (Schlag and Schlag-Rey, 1987; Heinen, 1995). A large body of fMRI and TMS data also implicates the SEF in saccade preparation (Pierrot-Deseilligny et al., 2004).
Significant activation for the decided-nogo condition within the SEF is surprising, because the motor behavior (fixation) was the same as in the nonsignificant always-nogo condition. Even assuming fixation neurons exist in human SEF as they do in monkey SEF (Schlag et al., 1992; Park et al., 2006), it is puzzling that activity during the decided-nogo condition was greater than activity during passive fixation in the always-nogo condition. One possibility is that SEF neurons in humans are involved in actively suppressing ocular behavior, as reported in monkeys during antisaccade generation (Amador et al., 2004) or during go/nogo tasks (Mann et al., 1988). Such neurons might be active during the decided-nogo condition but not the always-nogo condition. Another possibility is that there are “preparatory set” neurons in human SEF like those found in monkey SEF that are active before planned movement even when the movement is withheld (Schall, 1991a).
Heightened FEF activity during ocular baseball suggests that this structure is also involved in cognitive aspects of baseball. Although activity during the decided-go condition might represent movement neurons that are known to exist in monkeys (Bruce and Goldberg, 1985; Gottlieb et al., 1994; Tanaka and Lisberger, 2002), we also observed greater FEF activation for the decided-nogo condition. Even if simple fixation neurons existed in human FEF as they do in monkeys (Hanes et al., 1998), it would not explain our finding, because subjects also fixated during the nonactivated always-nogo condition. However, like the SEF, the FEF has been implicated in the suppression of voluntary eye movements. Neurons in monkey FEF are active during countermanding (Hanes et al., 1998). Human lesion studies have also implicated this area in antisaccade generation (Guitton et al., 1985). Preparatory set neurons, as found in monkey FEF (Schall, 1991b), could also account for this higher activity, because functional imaging has implicated human FEF in the preparatory set (DeSouza et al., 2003; Connolly et al., 2005).
Unlike the SEF and FEF, the SPL was more active during ocular baseball than it was during the always-go or the always-nogo conditions, suggesting a cognitive role for this structure. One possible function of the SPL in ocular baseball is that it extrapolates the trajectory of the target to determine whether it will cross the strike zone, a function necessary for the decision process. Supporting this is evidence from fMRI work suggesting this area in humans is the analog to monkey LIP (Koyama et al., 2004). Although area MT determines the speed and direction of motion (Albright, 1984; Nover et al., 2005), neurons in monkey LIP are thought to take information from MT and integrate motion signals over time for directional decision making (Huk and Shadlen, 2005). This type of computation could enable human SPL, as a putative homolog to monkey LIP, to calculate and extrapolate the trajectory of a target. Other imaging studies support a role for SPL in ocular baseball by suggesting that human posterior parietal cortex as a whole is involved in spatial imagery (Formisano et al., 2002; Gauthier et al., 2002), spatial attention (Schluppeck et al., 2005), and attentional tracking of motion trajectories (Culham et al., 1998).
Surprisingly, SPL activity during the always-nogo condition was reduced below baseline (Fig. 5). It is possible subjects were ignoring visual input altogether in this condition, to remove the temptation to execute erroneous saccades. We hypothesize that this reduction in SPL activity reflects active inhibition of neural firing in this region. Such a reduction in baseline neural firing has previously been shown to reduce the BOLD signal (Shmuel et al., 2006).
In our study, the right VLPFC, like the SPL, was more active for baseball than either control condition, but the right VLPFC, unlike the SPL, showed higher activity for decided-nogo trials than for decided-go trials. This finding is consistent with several imaging studies that have implicated the right inferior prefrontal cortex (PFC), in which the VLPFC resides, as a locus of an inhibitory mechanism in go/no-go tasks (Garavan et al., 1999; Konishi et al., 1999; Menon et al., 2001; Rubia et al., 2003). Furthermore, patients with lesions that overlap the right VLPFC show deficits in performance on countermanding tasks, which require inhibition of planned movement (Aron et al., 2003). However, the right VLPFC does not appear to be simply an inhibitory, nogo structure because this area was also active during the decided-go condition in our study. In a wide range of tasks and measures, the human right VLPFC is also active in rule processing (Bunge, 2004). Neurophysiological studies in monkeys (Miller, 2000) and research in humans (Baddeley and Della Sala, 1998) suggests that PFC is a key structure for cognitive control and rule encoding. Because ocular baseball is a rule-based go/nogo task, our results provide a bridge between the work, suggesting that the right VLPFC is related to suppressing movement and that PFC is involved in rule encoding. Our results also indicate that suppressing behavior under rule-guided situations might require greater cortical activity than does allowing eye movements to occur.
We propose that the right VLPFC receives trajectory-related information from cortical areas that process motion and visuospatial attention, such as hMT+ and the SPL. It is the PFC that then decides whether or not to generate a response based on the ocular baseball rule. Processed information from the right VLPFC is then relayed to the FEF and SEF to generate appropriate eye movements. The PFC has connections to the SEF through the premotor cortex (Wallis and Miller, 2003), and the SEF has strong reciprocal connections with the FEF (Huerta and Kaas, 1990; Barbas and Pandya, 1991). Additional evidence for a functional relationship between the PFC and the SEF comes from our previous work in which single neurons were recorded from the SEF of monkeys during ocular baseball (Kim et al., 2005). In that study, some neurons were active during eye movements. However, well before the movement began, other neurons reflected the task rule (i.e., whether the trajectory of the target would cross the strike zone or not). Therefore, the right VLPFC may form the decision in the context of the rule, and a conversion between the decision and the movement preparation and execution might begin in the SEF.
Our findings of increased baseball activity in the right VLPFC, SPL, FEF, and SEF cannot simply be attributable to global arousal or attention because no areas outside of these showed significant activation for the baseball conditions. Furthermore, higher activity occurred in the right VLPFC for the decided-nogo condition compared with the decided-go condition, a difference we did not observe in the SPL or any other area. If this differential activity in the right VLPFC were caused by general arousal or attention (e.g., if the no-go trials were simply more difficult), then we might have expected to see increased activity in other ROIs, which did not occur.
In conclusion, the FEF, SEF, SPL, and right VLPFC all showed activity specific to ocular baseball. Because our control conditions contained identical stimuli, and placed the same motor demands on observers as ocular baseball, these regions appear to be more involved in the process of making an oculomotor decision than in the sensory or motor components of the task.
Footnotes
This work was supported by the Smith-Kettlewell Eye Research Institute and National Institutes of Health Grant EY117720. We thank Jeremy Badler, Rory Sayres, and the Stanford Lucas Center.
References
- Albright TD. Direction and orientation selectivity of neurons in visual area MT of the macaque. J Neurophysiol. 1984;52:1106–1130. doi: 10.1152/jn.1984.52.6.1106. [DOI] [PubMed] [Google Scholar]
- Amador N, Schlag-Rey M, Schlag J. Primate antisaccade. II. Supplementary eye field neuronal activity predicts correct performance. J Neurophysiol. 2004;91:1672–1689. doi: 10.1152/jn.00138.2003. [DOI] [PubMed] [Google Scholar]
- Aron AR, Fletcher PC, Bullmore ET, Sahakian BJ, Robbins TW. Stop-signal inhibition disrupted by damage to right inferior frontal gyrus in humans. Nat Neurosci. 2003;6:115–116. doi: 10.1038/nn1003. [DOI] [PubMed] [Google Scholar]
- Baddeley A, Della Sala S. Working memory and executive control. In: Roberts AC, Robbins TW, Weiskrantz L, editors. The prefrontal cortex: executive and cognitive functions. New York: Oxford UP; 1998. pp. 9–21. [Google Scholar]
- Bandettini PA, Jesmanowicz A, Wong EC, Hyde JS. Processing strategies for time-course data sets in functional MRI of the human brain. Magn Reson Med. 1993;30:161–173. doi: 10.1002/mrm.1910300204. [DOI] [PubMed] [Google Scholar]
- Barbas H, Pandya D. Patterns of connections of the prefrontal cortex in the rhesus monkey associated with cortical architecture. In: Levin HS, Eisenberg HM, Benton AL, editors. Frontal lobe function and dysfunction. New York: Oxford UP; 1991. pp. 35–58. [Google Scholar]
- Brainard DH. The psychophysics toolbox. Spat Vis. 1997;10:433–436. [PubMed] [Google Scholar]
- Britten KH, Newsome WT, Shadlen MN, Celebrini S, Movshon JA. A relationship between behavioral choice and the visual responses of neurons in macaque MT. Vis Neurosci. 1996;13:87–100. doi: 10.1017/s095252380000715x. [DOI] [PubMed] [Google Scholar]
- Bruce CJ, Goldberg ME. Primate frontal eye fields. 1. Single neurons discharging before saccades. J Neurophysiol. 1985;53:603–635. doi: 10.1152/jn.1985.53.3.603. [DOI] [PubMed] [Google Scholar]
- Bunge SA. How we use rules to select actions: a review of evidence from cognitive neuroscience. Cogn Affect Behav Neurosci. 2004;4:564–579. doi: 10.3758/cabn.4.4.564. [DOI] [PubMed] [Google Scholar]
- Burock MA, Dale AM. Estimation and detection of event-related fMRI signals with temporally correlated noise: a statistically efficient and unbiased approach. Hum Brain Mapp. 2000;11:249–260. doi: 10.1002/1097-0193(200012)11:4<249::AID-HBM20>3.0.CO;2-5. [DOI] [PMC free article] [PubMed] [Google Scholar]
- Connolly JD, Goodale MA, Goltz HC, Munoz DP. fMRI activation in the human frontal eye field is correlated with saccadic reaction time. J Neurophysiol. 2005;94:605–611. doi: 10.1152/jn.00830.2004. [DOI] [PubMed] [Google Scholar]
- Culham JC, Brandt SA, Cavanagh P, Kanwisher NG, Dale AM, Tootell RB. Cortical fMRI activation produced by attentive tracking of moving targets. J Neurophysiol. 1998;80:2657–2670. doi: 10.1152/jn.1998.80.5.2657. [DOI] [PubMed] [Google Scholar]
- Dale AM. Optimal experimental design for event-related fMRI. Hum Brain Mapp. 1999;8:109–114. doi: 10.1002/(SICI)1097-0193(1999)8:2/3<109::AID-HBM7>3.0.CO;2-W. [DOI] [PMC free article] [PubMed] [Google Scholar]
- Dale AM, Buckner RL. Selective averaging of rapidly presented individual trials using fMRI. Hum Brain Mapp. 1997;5:329–340. doi: 10.1002/(SICI)1097-0193(1997)5:5<329::AID-HBM1>3.0.CO;2-5. [DOI] [PubMed] [Google Scholar]
- DeSouza JF, Menon RS, Everling S. Preparatory set associated with pro-saccades and anti-saccades in humans investigated with event-related FMRI. J Neurophysiol. 2003;89:1016–1023. doi: 10.1152/jn.00562.2002. [DOI] [PubMed] [Google Scholar]
- Engel SA, Glover GH, Wandell BA. The spatial properties of the fMRI signal in human visual cortex. Cereb Cortex. 1997;7:181–192. doi: 10.1093/cercor/7.2.181. [DOI] [PubMed] [Google Scholar]
- Formisano E, Linden DE, Di Salle F, Trojano L, Esposito F, Sack AT, Grossi D, Zanella FE, Goebel R. Tracking the mind's image in the brain I: time-resolved fMRI during visuospatial mental imagery. Neuron. 2002;35:185–194. doi: 10.1016/s0896-6273(02)00747-x. [DOI] [PubMed] [Google Scholar]
- Garavan H, Ross TJ, Stein EA. Right hemisphere dominance of inhibitory control: an event-related functional MRI study. Proc Natl Acad Sci USA. 1999;96:8301–8306. doi: 10.1073/pnas.96.14.8301. [DOI] [PMC free article] [PubMed] [Google Scholar]
- Gauthier I, Hayward WG, Tarr MJ, Anderson AW, Skudlarski P, Gore JC. BOLD activity during mental rotation and viewpoint-dependent object recognition. Neuron. 2002;34:161–171. doi: 10.1016/s0896-6273(02)00622-0. [DOI] [PubMed] [Google Scholar]
- Gottlieb JP, MacAvoy MG, Bruce CJ. Neural responses related to smooth-pursuit eye movements and their correspondence with electrically elicited smooth eye movements in the primate frontal eye field. J Neurophysiol. 1994;72:1634–1653. doi: 10.1152/jn.1994.72.4.1634. [DOI] [PubMed] [Google Scholar]
- Grosbas MH, Lobel E, Van de Moortele PF, LeBihan D, Berthoz A. An anatomical landmark for the supplementary eye fields in human revealed with functional magnetic resonance imaging. Cereb Cortex. 1999;9:705–711. doi: 10.1093/cercor/9.7.705. [DOI] [PubMed] [Google Scholar]
- Grill-Spector K, Sayres R, Ress D. High-resolution imaging reveals highly selective nonface clusters in the fusiform face area. Nat Neurosci. 2006;9:1177–1185. doi: 10.1038/nn1745. [DOI] [PubMed] [Google Scholar]
- Guitton D, Buchtel HA, Douglas RM. Frontal lobe lesions in man cause difficulties in suppressing reflexive glances and in generating goal-directed saccades. Exp Brain Res. 1985;58:455–472. doi: 10.1007/BF00235863. [DOI] [PubMed] [Google Scholar]
- Hanes DP, Patterson WF, II, Schall JD. Role of frontal eye fields in countermanding saccades: visual, movement, and fixation activity. J Neurophysiol. 1998;79:817–834. doi: 10.1152/jn.1998.79.2.817. [DOI] [PubMed] [Google Scholar]
- Heinen SJ. Single-neuron activity in dorsomedial frontal cortex during smooth pursuit eye movements. Exp Brain Res. 1995;104:357–361. doi: 10.1007/BF00242022. [DOI] [PubMed] [Google Scholar]
- Huerta MF, Kaas JH. Supplementary eye fields as defined by intracortical microstimulation: connection in macaques. J Comp Neurol. 1990;293:299–330. doi: 10.1002/cne.902930211. [DOI] [PubMed] [Google Scholar]
- Huk AC, Shadlen MN. Neural activity in macaque parietal cortex reflects temporal integration of visual motion signals during perceptual decision making. J Neurosci. 2005;25:10420–10436. doi: 10.1523/JNEUROSCI.4684-04.2005. [DOI] [PMC free article] [PubMed] [Google Scholar]
- Huk AC, Ress D, Heeger DJ. Neuronal basis of the motion aftereffect reconsidered. Neuron. 2001;32:161–172. doi: 10.1016/s0896-6273(01)00452-4. [DOI] [PubMed] [Google Scholar]
- Kim YG, Heinen SJ. Decision coding in the supplementary eye fields (SEF) of monkeys during the baseball task. Soc Neurosci Abstr. 2001;27:784–10. [Google Scholar]
- Kim YG, Badler JB, Heinen SJ. Trajectory interpretation by supplementary eye field neurons during ocular baseball. J Neurophysiol. 2005;94:1385–1391. doi: 10.1152/jn.00109.2005. [DOI] [PubMed] [Google Scholar]
- Konishi S, Nakajima K, Uchida I, Kikyo H, Kameyama M, Miyashita Y. Common inhibitory mechanism in human inferior prefrontal cortex revealed by event-related functional MRI. Brain. 1999;122:981–991. doi: 10.1093/brain/122.5.981. [DOI] [PubMed] [Google Scholar]
- Koyama M, Hasegawa I, Osada T, Adachi Y, Nakahara K, Miyashita Y. Functional magnetic resonance imaging of macaque monkeys performing visually guided saccade tasks: comparison of cortical eye fields with humans. Neuron. 2004;41:795–807. doi: 10.1016/s0896-6273(04)00047-9. [DOI] [PubMed] [Google Scholar]
- Liu TT, Frank LR, Wong EC, Buxton RB. Detection power, estimation efficiency, and predictability in event-related fMRI. NeuroImage. 2001;13:759–773. doi: 10.1006/nimg.2000.0728. [DOI] [PubMed] [Google Scholar]
- Mann SE, Thau R, Schiller PH. Conditional task-related responses in monkey dorsomedial frontal cortex. Exp Brain Res. 1988;69:460–468. doi: 10.1007/BF00247300. [DOI] [PubMed] [Google Scholar]
- Martinez-Trujillo JC, Tsotsos JK, Simine E, Pomplun M, Wildes R, Treue S, Heinze HJ, Hopf JM. Selectivity for speed gradients in human area MT/V5. NeuroReport. 2005;4:435–438. doi: 10.1097/00001756-200504040-00004. [DOI] [PubMed] [Google Scholar]
- Menon V, Adleman NE, White CD, Glover GH, Reiss AL. Error-related brain activation during a go/nogo response inhibition task. Hum Brain Mapp. 2001;12:131–143. doi: 10.1002/1097-0193(200103)12:3<131::AID-HBM1010>3.0.CO;2-C. [DOI] [PMC free article] [PubMed] [Google Scholar]
- Miller EK. The prefrontal cortex and cognitive control. Nat Rev Neurosci. 2000;1:59–65. doi: 10.1038/35036228. [DOI] [PubMed] [Google Scholar]
- Muri RM. MRI and fMRI analysis of oculomotor function. Prog Brain Res. 2005;151:503–526. doi: 10.1016/S0079-6123(05)51016-1. [DOI] [PubMed] [Google Scholar]
- Noll DC, Cohen JD, Meyer CH, Schneider W. Spiral K-space MR imaging of cortical activation. J Magn Reson Imaging. 1995;5:49–56. doi: 10.1002/jmri.1880050112. [DOI] [PubMed] [Google Scholar]
- Nover H, Anderson CH, DeAngelis GC. A logarithmic, scale-invariant representation of speed in macaque middle temporal area accounts for speed discrimination performance. J Neurosci. 2005;25:10049–10060. doi: 10.1523/JNEUROSCI.1661-05.2005. [DOI] [PMC free article] [PubMed] [Google Scholar]
- Park J, Schlag-Rey M, Schlag J. Frames of reference for saccadic command tested by saccade collision in the supplementary eye field. J Neurophysiol. 2006;95:159–170. doi: 10.1152/jn.00268.2005. [DOI] [PubMed] [Google Scholar]
- Pelli DG. The VideoToolbox software for visual psychophysics: transforming numbers into movies. Spat Vis. 1997;10:437–442. [PubMed] [Google Scholar]
- Perrone JA, Thiele A. Speed skills: measuring the visual speed analyzing properties of primate MT neurons. Nat Neurosci. 2001;4:526–532. doi: 10.1038/87480. [DOI] [PubMed] [Google Scholar]
- Petit L, Haxby JV. Functional anatomy of pursuit eye movements in humans as revealed by fMRI. J Neurophysiol. 1999;81:463–471. doi: 10.1152/jn.1999.82.1.463. [DOI] [PubMed] [Google Scholar]
- Pierrot-Deseilligny C, Milea D, Muri RM. Eye movement control by the cerebral cortex. Curr Opin Neurol. 2004;17:17–25. doi: 10.1097/00019052-200402000-00005. [DOI] [PubMed] [Google Scholar]
- Press WA, Brewer AA, Dougherty RF, Wade AR, Wandell BA. Visual areas and spatial summation in human visual cortex. Vision Res. 2001;41:1321–1332. doi: 10.1016/s0042-6989(01)00074-8. [DOI] [PubMed] [Google Scholar]
- Rubia K, Smith AB, Brammer MJ, Taylor E. Right inferior prefrontal cortex mediates response inhibition while mesial prefrontal cortex is responsible for error detection. NeuroImage. 2003;20:351–358. doi: 10.1016/s1053-8119(03)00275-1. [DOI] [PubMed] [Google Scholar]
- Schall JD. Neuronal activity related to visually guided saccadic eye movements in the supplementary motor area of rhesus monkeys. J Neurophysiol. 1991a;66:530–558. doi: 10.1152/jn.1991.66.2.530. [DOI] [PubMed] [Google Scholar]
- Schall JD. Neuronal activity related to visually guided saccades in the frontal eye fields of rhesus monkeys: comparison with supplementary eye fields. J Neurophysiol. 1991b;66:559–579. doi: 10.1152/jn.1991.66.2.559. [DOI] [PubMed] [Google Scholar]
- Schlag J, Schlag-Rey M. Evidence for a supplementary eye field. J Neurophysiol. 1987;57:179–200. doi: 10.1152/jn.1987.57.1.179. [DOI] [PubMed] [Google Scholar]
- Schlag J, Schlag-Rey M, Pigarev I. Supplementary eye field: influence on neural signals of fixation. Exp Brain Res. 1992;90:302–306. doi: 10.1007/BF00227242. [DOI] [PubMed] [Google Scholar]
- Schluppeck D, Glimcher P, Heeger DJ. Topographic organization for delayed saccades in human posterior parietal cortex. J Neurophysiol. 2005;94:1372–1384. doi: 10.1152/jn.01290.2004. [DOI] [PMC free article] [PubMed] [Google Scholar]
- Shadlen MN, Newsome WT. Motion perception: seeing and deciding. Proc Natl Acad Sci USA. 1996;93:628–633. doi: 10.1073/pnas.93.2.628. [DOI] [PMC free article] [PubMed] [Google Scholar]
- Shadlen MN, Newsome WT. Neural basis of a perceptual decision in the parietal cortex (area LIP) of the rhesus monkey. J Neurophysiol. 2001;86:1916–1936. doi: 10.1152/jn.2001.86.4.1916. [DOI] [PubMed] [Google Scholar]
- Shmuel A, Augath M, Oeltermann A, Logothetis NK. Negative functional MRI response correlates with decreases in neuronal activity in monkey visual area V1. Nat Neurosci. 2006;9:569–577. doi: 10.1038/nn1675. [DOI] [PubMed] [Google Scholar]
- Talairach J, Tournoux P. New York: Thieme; 1988. Co-planar stereotaxic atlas of the human brain. [Google Scholar]
- Tanaka M, Lisberger SG. Role of arcuate frontal cortex of monkeys in smooth pursuit eye movements. I. Basic response properties to retinal image motion and position. J Neurophysiol. 2002;87:2684–2699. doi: 10.1152/jn.2002.87.6.2684. [DOI] [PMC free article] [PubMed] [Google Scholar]
- Teo PC, Sapiro G, Wandell BA. Creating connected representations of cortical gray matter for functional MRI visualization. IEEE Trans Med Imaging. 1997;16:852–863. doi: 10.1109/42.650881. [DOI] [PubMed] [Google Scholar]
- Tootell RB, Reppas JB, Kwong KK, Malach R, Born RT, Brady TJ, Rosen BR, Belliveau JW. Functional analysis of human MT and related visual cortical areas using magnetic resonance imaging. J Neurosci. 1995;15:3215–3230. doi: 10.1523/JNEUROSCI.15-04-03215.1995. [DOI] [PMC free article] [PubMed] [Google Scholar]
- Wallis JD, Miller EK. From rule to response: neuronal processes in the premotor and prefrontal cortex. J Neurophysiol. 2003;90:1790–1806. doi: 10.1152/jn.00086.2003. [DOI] [PubMed] [Google Scholar]
- Wandell BA, Chial S, Backus BT. Visualization and measurement of the cortical surface. J Cogn Neurosci. 2000;12:739–752. doi: 10.1162/089892900562561. [DOI] [PubMed] [Google Scholar]
- Yang S, Badler JB, Heinen SJ. Neural activity in supplementary eye field reflects visuomotor decisions. Soc Neurosci Abstr. 2005;31 857.19. [Google Scholar]