

Abstract
Although hippocampal interneurons typically do not show discrete regions of elevated firing in an environment, such as seen in pyramidal cell place fields, they do exhibit significant spatial modulation (McNaughton et al., 1983a). Strong monosynaptic coupling between pyramidal neurons and nearby interneurons in the CA1 stratum pyramidale has been strongly implicated on the basis of significant, short-latency peaks in cross-correlogram plots (Csicsvari et al., 1998). Furthermore, interneurons receiving a putative monosynaptic connection from a simultaneously recorded pyramidal cell appear to inherit the spatial modulation of the latter (Marshall et al., 2002). Buzsaki and colleagues hypothesize that interneurons may also adopt the firing phase dynamics of their afferent place cells, which show a phase shift relative to the hippocampal theta rhythm as a rat passes through the place field (“phase precession”). This study confirms and extends the previous reports by showing that interneurons in the dorsal and middle hippocampus with putative monosynaptic connections with place cells recorded on the same tetrode share other properties with their pyramidal cell afferents, including the spatial scale of the place field of pyramidal cell, a characteristic of the septotemporal level of the hippocampus from which the cells are recorded, and the rate of phase precession, which is slower in middle regions. Furthermore, variations in pyramidal cell place field scale within each septotemporal level attributable to task variations are similarly associated with variations in interneuron place field scale. The available data strongly suggest that spatial selectivity of CA1 stratum pyramidale interneurons is inherited from a small cluster of local pyramidal cells and is not a consequence of spatially selective synaptic input from CA3 or other sources.
Keywords: hippocampus, oscillation, place cell, rat, theta rhythm, place field
Introduction
Neuronal models of associative memory in the hippocampus are typically constructed of two primary units, principal neurons and inhibitory neurons. The typical role of the principal cells in these models is to store information via modifiable synapses. One important role of interneurons may be to provide threshold control necessary for associative retrieval, by sampling the total network input and rapidly feeding forward a proportional inhibition to principal cells (Marr, 1971; McNaughton and Morris, 1987). In line with general predictions from this hypothesis (McNaughton and Nadel, 1990), inhibitory neurons are much fewer in number than principal cells but have extensive connectivity (Amaral and Witter, 1995; Freund and Buzsaki, 1996), are driven by the same excitatory afferents and recurrent connections that activate the principal cells, respond to a synchronous input at lower threshold and at shorter latency than principal cells (Mizumori et al., 1989), and lack modifiable synapses with excitatory inputs (McBain et al., 1999), and, in unfamiliar situations, extrinsic modulation of inhibitory neurons might lower output threshold, possibly serving as a gate enabling the activation of the synaptic modification process (Wilson and McNaughton, 1993; Fyhn et al., 2002; Nitz and McNaughton, 2004). Another implication of this general theoretical framework is that, whereas principal cells will be quite selective in their response characteristics, inhibitory neurons will not be particular about which afferents are active at a given time only how many. Thus, they will convey little information in the response domain of the principle cell.
Perhaps contrary to the foregoing theoretical ideas, research in freely behaving rats has shown that the activity of some stratum pyramidale interneurons in CA1 is tightly coupled with the activity of principal neurons in a manner that is suggestive of strong monosynaptic pyramidal cell–interneuron connections (Csicsvari et al., 1998). Consistent with the evidence that a single hippocampal pyramidal cell can drive a local interneuron with high efficiency, it appears that some interneurons may also inherit their spatial selectivity from a small group of afferent place cells that are active in a given environment (Marshall et al., 2002).
Most, if not all, principal cells of the hippocampus exhibit a clear, monotonic shift of the timing of spikes relative to the local theta rhythm as a rat traverses the place field of a cell (O'Keefe and Recce, 1993; Skaggs et al., 1996). Manipulations that alter place field size also alter the spatial rate of theta phase precession, and constitutive variations in place field size along the septotemporal axis of the hippocampus are strongly associated with corresponding variation in the spatial rate of phase shift (Shen et al., 1997; Ekstrom et al., 2001; Huxter et al., 2003; Maurer et al., 2005, 2006; Terrazas et al., 2005). In accordance with the idea that the spatial selectivity of interneurons is acquired from monosynaptically connected place cells, it is reasonable to assume that a portion of interneurons will also exhibit theta phase precession, as hypothesized by Buzsaki and colleagues (Csicsvari et al., 1998; Marshall et al., 2002). The present study confirms and extends this prediction.
Materials and Methods
Animals and surgical procedures.
Neurophysiological studies were conducted on three Brown Norway/Fisher 344 hybrid male rats between 8 and 12 months old. The rats were housed individually and maintained on a 12 h light/dark cycle. Recordings took place during the dark phase of the cycle. Surgery was conducted according to National Institutes of Health guidelines for rodents and approved Institutional Animal Care and Use Committee protocols. Before surgery, the rats were administered Bicillin (30,000 U, i.m., in each hindlimb). The rats were implanted, under isofluorane anesthesia, with an array of 14 separately moveable microdrives (“Hyperdrive”). This device, implantation methods, and the parallel recording technique have been described in detail previously (Gothard et al., 1996). Briefly, each microdrive consisted of a drive screw coupled by a nut to a guide cannula. Twelve guide cannulas contained tetrodes (McNaughton et al., 1983b; Recce and O'Keefe, 1989), four-channel electrodes constructed by twisting together four strands of insulated 13 μm nichrome wire (H. P. Reid, Neptune, NJ). Two additional tetrodes with their individual wires shorted together served as an indifferent reference and an EEG recording probe. A full turn of the screw advanced the tetrode 318 μm. For all three rats, recordings were made sequentially from the middle (5.7 posterior, 5.0 lateral to bregma) and septal (3.0 posterior, 1.4 lateral to bregma) regions. This was accomplished by directing all 14 probes first to the middle region and then physically moving the drive to a previously prepared and sealed craniotomy over the septal pole. The implant was cemented in place with dental acrylic anchored by dental screws. After surgery, rats were orally administered 26 mg of acetaminophen (Children's Tylenol Elixir; McNeil, Fort Washington, PA). They also received 2.7 mg/ml acetaminophen in the drinking water for 1–3 d after surgery and oral ampicillin (Bicillin; Wyeth Laboratories, Madison, NJ) on a 10 d on/10 d off regimen for the duration of the experiment.
Neurophysiology.
The tetrodes were lowered after surgery into the hippocampus, allowed to stabilize for several days just above the CA1 hippocampal subregion, and then gradually advanced into the CA1 stratum pyramidale. The neutral reference electrode was located in or near the corpus callosum. The EEG probe was used to record theta field activity from the vicinity of the hippocampal fissure. The four channels of each tetrode were each attached to a separate channel of a 50-channel unity-gain head stage (Neuralynx, Tucson, AZ). A multiwire cable connected the head stage to digitally programmable amplifiers (Neuralynx). The spike signals were amplified by a factor of 1000–5000, bandpass filtered between 600 Hz and 6 kHz, and transmitted to the Cheetah Data Acquisition system (Neuralynx). Signals were digitized at 32 kHz, and events that reached a predetermined threshold were recorded for a duration of 1 ms. Spikes were sorted off-line on the basis of the amplitude and principal components from the four-tetrode channels, by means of a semiautomatic clustering algorithm [BBClust (P. Lipa, University of Arizona, Tucson, AZ); KlustaKwik (K. D. Harris, Rutgers University, Newark, NJ)]. The resulting classification was corrected and refined manually with custom-written software (MClust; A. D. Redish, University of Minnesota, Minneapolis, MN), resulting in a spike-train time series for each of the well isolated cells. No attempt was made to match cells from one daily session to the next, and, therefore, the numbers of recorded cells reported does not take into account possible recordings from the same cells on consecutive days; however, because the electrode positions were frequently adjusted from one day to the next, recordings from the same cell over days were probably relatively infrequent. Putative pyramidal neurons were identified by means of the standard parameters of firing rate, burstiness, and spike waveform (Ranck, 1973), as well as the first moment of the autocorrelation (Csicsvari et al., 1998). As noted by Csicsvari et al., pyramidal neurons traditionally exhibit a faster decay in their autocorrelation compared with interneurons.
Theta activity in the EEG was recorded from a separate probe that was positioned ∼0.5 mm below the CA1 pyramidal layer, near the hippocampal fissure. The location of the theta recording electrode changed between the dorsal and middle regions of the hippocampus along with the recording microdrive. EEG signals were bandpass filtered between 1 and 300 Hz and sampled at 2.4 kHz. The EEG signals were amplified on the head stage with unity gain and then again with variable gain amplifiers (up to 5000).
Several diodes were mounted on the head stage to allow position tracking. The position of the diode array was detected by a television camera placed directly above the experimental apparatus and recorded with a sampling frequency of 60 Hz. The sampling resolution was such that a pixel was ∼0.3 cm.
Behavior.
The animals were food deprived to ∼85% of their ad libitum weight. During this time period, the rats were trained to run on circular tracks for food reinforcement. Two different tracks were used, one 167.5 cm in circumference and the other 382 cm in circumference. Rats ran unidirectionally around the smaller track with food delivered at one point and bidirectionally around the large track, which was partitioned by a barrier at one point. Food was given on either side of the barrier and at the 180° opposite point. The two-track design was adopted to increase the yield of independent place fields from a given recorded ensemble and for other reasons not relevant to this study. Rats ran each track for ∼20 min, resulting in a variable number of laps per session. Rats ran two sessions per day, one on the large track and one on the small track (in counterbalanced order), with each running session flanked by a rest period in the “nest.” Data from the rest periods were used to assess baseline firing and cell stability.
Analyses.
The place field diagrams in the top panel of Figures 1–3 were constructed by first transforming the two-dimensional position coordinates into a single dimension. Spike data were combined with the position data using a 3 cm bin width for both the large and the small track. Given the unidirectional nature of place fields during track running (but see Battaglia et al., 2004), the clockwise and counterclockwise trajectories on the large track were analyzed separately.
Figure 1.

Examples of two interneurons that did not exhibit theta phase precession. Each column presents plots of phase, position, and firing rate activity of two interneurons that did not exhibit phase precession. Top row, The average firing rate of each neuron at each location on the track (∼3 cm bin size). Middle row, The trial-by-trial spiking activity of the two neurons at each position. Bottom row, A density plot of spiking activity plotted by theta phase and position. The interneuron on the left was recorded as the animal ran on the large track, and the interneuron on the right was recorded during behavior on a small track.
Figure 2.

Examples of two interneurons exhibiting phase precession. Spiking activity was recorded as the rat traversed the small track (running direction is from right to left). These two examples were recorded from the dorsal hippocampus. Recordings were from different tetrodes and on two separate recording sessions (rat 8001).
Figure 3.
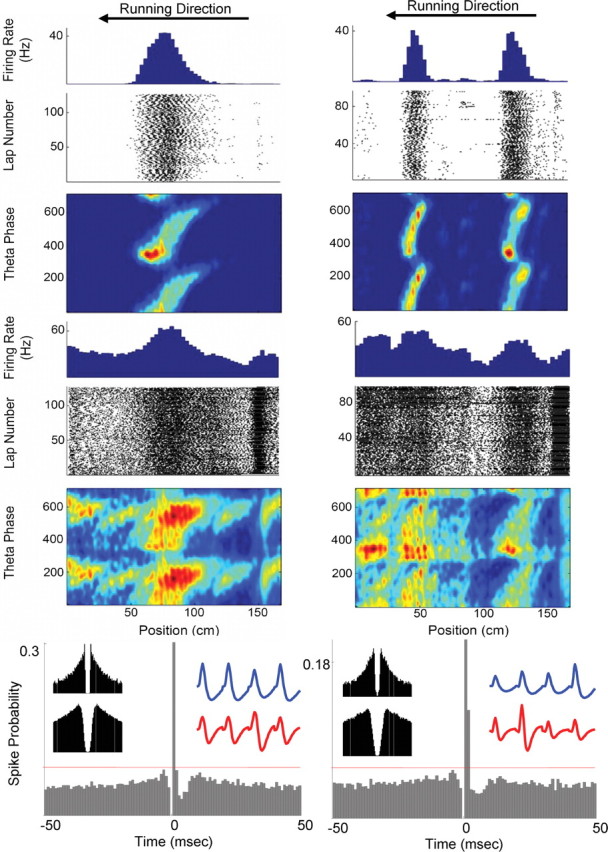
Two examples of putatively monosynaptically coupled pyramidal–interneuron pairs on the small track. An example from the middle hippocampus is presented in the left column, and an example from the dorsal hippocampus is presented on the right column. The first three rows present the phase, position, and firing rate activity (see Fig. 1) of the principal cell, and the next three rows present the same information for the monosynaptically coupled interneuron. The bottom row shows the cross-correlograms for each neuron pair. The horizontal red line indicates the threshold used to identify significant putative monosynaptic activity (see Materials and Methods). Waveforms from each electrode of the tetrode for the pyramidal neuron (blue) and interneuron (red) are shown in the top right of the cross-correlogram plots. The autocorrelations for each cell, computed only during behavior, are in the top left of the cross-correlogram plots (top plot is the pyramidal neuron, and bottom plot is the interneuron). In both examples, the principal cell and the interneuron exhibited phase precession at similar spatial locations. The pyramidal cell in the left column precessed at a rate of 0.073 cm/°, whereas the interneuron to which it was monosynaptically coupled precessed at a rate of 0.068 cm/°. In the right column, the pyramidal cell and interneuron precessed at rates of 0.033 and 0.023 cm/°, respectively. Running direction is from the right to the left.
The occupancy-normalized theta phase versus position spike-density plots illustrated in the three panels of Figures 1–3 were constructed in the following manner. For the phase versus position plots, each spike was assigned a nominal phase according to the fraction of the time between the preceding and following theta peaks at which it occurred. Precisely, the phase assigned to an event at time t was 360 × (t − t0)/(t1 − t0), where t0 and t1 are the times of the preceding and following peaks of the digitally filtered (6–11 Hz) reference EEG signal. Note that the phase is always a number between 0 and 360. Finally, the spike phase versus position data were convolved with a two-dimensional Hanning window. The spatial width of the Hanning window was set at 5.25 cm, corresponding to approximately one-fifth the size of a typical pyramidal place field. The extent in phase was set at 70° to smooth over minor variations in phase. Minor changes in the Hanning window size yielded similar results in all test conditions. The firing rate by position plots were normalized by occupancy to facilitate visualization of possible place fields.
For interneurons that exhibited phase precession, place field boundaries were assigned by evaluating the phase versus position plots described above, according to the definition that a single place field involves a single cycle of 360° of phase precession (Maurer et al., 2006). The start and end locations of a field were taken as the margins of the spike phase versus position clusters. Spikes belonging to a given place field were flagged by manually drawing boundaries around the apparent phase versus position clusters. Although interneurons that exhibited precession exhibited multiple place fields by the definition of 360° of precession, only the most salient precession cycles were selected for the analysis of interneuron field size.
The classical measure of the rate of precession is the slope of a fitted regression line to the points (spikes) on a position by phase plot (O'Keefe and Recce, 1993; Shen et al., 1997; Ekstrom et al., 2001). In the case of interneurons with multiple overlapping place fields, however, this method becomes unworkable because no single regression line can effectively fit the multiple, overlapping fields. Other approaches such as the circular ANOVA also assume the presence of a single place field. One solution to this problem is for the experimenter to define and draw the boundaries of the “precession field” and then apply these traditional techniques to this region. The clear disadvantage to such an approach is its subjectivity, because it may introduce a selection bias for regions of precession. Given these issues, the study of phase precession, especially in the case of cells with multiple, overlapping place fields (Maurer et al., 2006), demands a technique that accurately determines the rate of precession with a minimum of user bias.
To address this issue, we developed a procedure that identified the slope of precession through a process of parametrically rotating the smoothed position by phase density matrix (D). The slope of precession for a particular neuron was determined as the point in rotation that maximized the variance of the columnar sum (across position) of the rotated matrix. Specifically, the position by phase density matrix was rotated by shifting each row of phase (i) to either the left or right according to the equation si = I × r, where s represents the amount of shift in centimeters for each row of phase (i) and r represents the chosen amount of shift of position for each degree of phase. The columns of this rotated matrix were summed [vj = Σi Di,j, where j is each column (position) of the density matrix D] to produce a vector v. The variance of this vector (σ2) was calculated for each choice of r between the values of −0.5 and 0.5 cm/°. The value of r associated with the maximum variance was then used to determine the estimate of the slope of precession (1/r) for the given cell. The smoothed position by phase density matrix for the small track typically yielded a negative slop when the rats trajectory was plotted from right to left and was corrected by multiplying the phase value by a negative one. For a demonstration of this procedure, see movie 1 (http://www.nsma.arizona.edu/abstracts/2006/Sup_Movie_1.avi) and supplemental Figure 3 (available at www.jneurosci.org as supplemental material).
Smoothing.
The creation of the position by phase density plot requires a degree of smoothing in both the x dimension (position) and y dimension (phase angle). Given that the central objective was to identify place fields and the slope of precession, it was reasonable to smooth position in a range that optimized the events at the spatial scale of a typical place field of a principal cell. Accordingly, a Hanning window of one-third the size of a typical pyramidal cell place field was used. A range of other values of place field size produced similar results. Smoothing in the y dimension (phase) was required to smooth over the jitter in spike firing and the regular interspike intervals that occur during burst firing observed in principal cells and the resultant “procession” effect that these intervals cause. Because the time/phase scale of a burst is ∼10°, a Hanning window of ∼30° in phase angle was used. Again, this measure was robust to various levels of smoothing >30°.
To examine the effect of different EEG states on the firing properties of interneurons, sharp wave and theta epochs needed to be identified. Sharp waves were detected by high-pass filtering the EEG signals between 100 and 300 Hz, rectifying the result, and then smoothing by low-pass filtering with a cutoff of 20 Hz. This procedure yields a curve that approximately follows the envelope of the high-frequency component of the signal, as illustrated in supplemental Figure 1 (available at www.jneurosci.org as supplemental material). Previous methods of setting ripple detection thresholds include an observer-determined threshold (Kudrimoti et al., 1999) or 7 SDs above the mean (Csicsvari et al., 1999). To optimize the detection of ripple epochs, thresholds were determined automatically based on a comparison of the amplitude distributions of peaks in the 100–300 Hz filtered, rectified, and smoothed local field potential data for active behavior versus rest (supplemental Fig. 2, available at www.jneurosci.org as supplemental material). The same threshold was used for all ripples from a given channel for all three sleep epochs. A simple SD threshold will be sensitive to the number of ripples recorded on a given session. Specifically, on a session with a higher average ripple rate, the SD will be greater (because ripples are high-amplitude events and increase the overall variance measure), therefore yielding a lower ripple count (more errors of omission). The main advantage of the present method is that it addresses this issue by computing the threshold relative to a within-session period of few or no ripples (behavior), not relative to “itself,” as occurs with the SD approach. This method, however, may have detected local 100 Hz oscillations (Csicsvari et al., 2000), and therefore all ripples are referred to as “putative ripples” in this manuscript. Theta epochs during track running were detected by calculating the theta/delta power ratio within a 2 s window (Csicsvari et al., 1998, 1999; Terrazas et al., 2005). Theta/delta power ratios >2 were identified as theta epochs (Louie and Wilson, 2002).
Short-latency and short-duration peaks in cross-correlogram plots (1 ms bin width) allowed putative monosynaptic excitatory connections (referred to here as “functional” connections) to be identified (Csicsvari et al., 1998; Marshall et al., 2002; Bartho et al., 2004). The spikes of interneurons were aligned on the times of pyramidal neurons and then divided by the number of reference pyramidal cell spikes to determine the probability of the interneuron firing within a 1–3 ms window. A second cross-correlogram was generated after shuffling the interspike intervals of the interneuron (Brody, 1999) and subtracted from the original (Csicsvari et al., 1998; Marshall et al., 2002), and functional connections were considered significant when at least one bin, within 3 ms of the center bin, exceeded 5 SDs of the mean. The mean was calculated from the spikes within the −50 to −10 ms and 10–50 ms time bins (Bartho et al., 2004). Cell pairs from the same electrode did not exhibit counts within the 0 ms bin attributable to sampling constraints of the Cheetah Data acquisition system.
Results
Short-latency peaks in pyramidal cell–interneuron pairs
Previous research has demonstrated that a portion of cross-correlograms between CA1 pyramidal neurons and interneurons, in both slices and freely behaving preparations, exhibit short-latency peaks (<3 ms) suggestive of strong monosynaptic coupling (Csicsvari et al., 1998; Marshall et al., 2002). This study confirms the results in the CA1 region of the freely behaving rat. Cross-correlograms, generated by aligning interneuron spikes on pyramidal cell spike times, revealed that some interneurons had a significantly increased probability of firing within 1–3 ms after the principal cells spike (Figs. 2, 3). The probabilities of the interneuron spikes following the spikes of a principal neuron within 3 ms ranged from 0.24 to 0.42 for all significant cross-correlations.
Spatial consistency in firing profiles of functionally coupled pyramidal cell–interneuron pairs
Marshall et al. (2002) have shown that interneurons that were putatively driven by monosynaptically coupled place cells also inherited the spatial modulation of their afferent neuron. Figure 3 shows two functionally coupled pyramidal cell–interneuron pairs. The interneurons exhibited multiple firing rate versus position peaks, a portion of which were in the same spatial location as the place fields of the functionally coupled place cell. Figure 4 shows a place cell with fields on both the small and large tracks with a functionally coupled interneuron. The interneuron consistently mirrors the spatial modulation of its coupled place cell in both track epochs.
Figure 4.

Example of a place cell with fields on both the small (left column) and the large (right column) tracks coupled with a local interneuron. The first three rows present plots of phase, position, and firing rate activity (see Fig. 1) for the principal cell, and the next three rows present the same information for the putative monosynaptically coupled interneuron. Running direction is indicated by the arrow on the top of the figure. The bottom row shows the cross-correlograms for each neuron pair. The rate of precession of the pyramidal cell on the small track was 0.022 cm/°, whereas the interneuron precessed at a rate of 0.034 cm/° on the small track. On the large track, the pyramidal cell and interneuron precessed at rates of 0.094 and 0.085 cm/°, respectively. This pyramidal cell interneuron pair was recorded from the middle hippocampus of rat 8042.
Functional pyramidal–interneuron coupling occurs locally
A total of 6246 cross-correlograms between pyramidal cells and interneurons were generated, 846 of which were cells recorded on the same tetrode, whereas the remaining 5400 were cells recorded on different tetrodes. Of these cross-correlograms, 56 (6.62%) of the within-tetrode pairs exhibited a significant (>5 SD) short-latency peak, whereas only 20 (0.37%) between-tetrode pairs were found to be significant. The clustering of significant cross-correlograms within a tetrode was significant [X2 (1, N = 6246) = 222.01, p < 0.0001].
Interneurons exhibit theta phase precession
The current experiment tested the hypotheses proposed by Csicsvari et al. (1998) and Marshall et al. (2002): interneurons that inherit the spatial selectivity of their putatively presynaptic place cells also adopt the phase of firing of their afferents relative to the theta rhythm. Of the 42 interneurons recorded in the dorsal hippocampus, 28 (67%) exhibited salient theta phase precession, whereas 14 (33%) did not (Fig. 1). Fifty-four interneurons were recorded in the middle hippocampus. Thirty-two of the middle region interneurons precessed (59.3%), whereas 22 did not (40.7%). Figures 2–4 show examples of interneurons that exhibited multiple salient cycles of theta phase precession. Similar to the spatial firing rate correlation between putatively coupled pyramidal cell–interneuron pairs, the interneurons expressed a cycle of precession in the same location as the functionally coupled place cell (Figs. 3, 4).
Interneurons place field size varies systematically along the dorsoventral axis
Firing rate versus position plots for a majority of interneurons revealed that interneurons can have multiple firing rate peaks, suggesting the presence of multiple place fields. The presence of multiple peaks in these plots, however, made it difficult to isolate clear place field boundaries; however, these peaks typically corresponded to salient episodes of interneuron theta phase precession, and previous analyses have determined that place field boundaries of principal cells can be identified using the area a rat must traverse for the spikes to precess 360° with respect to the theta rhythm (Maurer et al., 2006). Accordingly, interneuron place field boundaries were identified using this method. For this analysis, only the most salient interneuron fields were included. The mean ± SD interneuron place field size for the dorsal hippocampus was 45.3 ± 10.51 cm (n = 60) on the large track and 25.5 ± 8.05 cm (n = 44) on the small track. In the middle hippocampus, the mean ± SD place field size was 59.7 ± 17.46 cm (n = 42) and 45.2 ± 2.92 cm (n = 48) for the large and small tracks, respectively (Fig. 4). The factors of anatomical locus (dorsal vs middle CA1) and track size (large vs small) each had a significant effect on the size of interneuron place fields (ANOVA, p < 0.01). Moreover, there was a significant difference in the size of interneuron place fields in the dorsal versus the middle CA1 region on both the large and the small tracks (ANOVA, p < 0.05). These results correspond with previous observations that principal cell place fields were larger in the middle hippocampus compared with the fields of principal cells in the dorsal hippocampus (Jung and McNaughton, 1993; Maurer et al., 2005, 2006), and that principal cell place fields in both the middle and dorsal hippocampus were significantly larger on the big compared with the small track (Maurer et al., 2006).
Slope of interneuron precession
Analysis of the slope of interneuron theta phase precession (see Materials and Methods) produced a number of interesting observations. For instance, a significant difference in the slope was observed between the dorsal and middle hippocampal interneurons (p < 0.001, ANOVA) and between interneurons recorded on the large versus small track in the dorsal hippocampus (p < 0.01, ANOVA) (Fig. 5). The interneurons in the middle hippocampus that exhibited theta phase precession were not significantly different on the large and small tracks (p = 0.26). The dorsal interneurons precessed at a rate of 0.029 ± 0.021 cm/° on the small track (mean ± SD) and 0.052 ± 0.287 cm/° on the large track (mean ± SD). Middle hippocampal interneurons on the small and large tracks precessed at a rate of 0.065 ± 0.037 cm/° (mean ± SD) and 0.082 ± 0.048 cm/° (mean ± SD), respectively. These results provide additional evidence that, similar to pyramidal neurons, interneuron place fields are larger in middle CA1 compared with dorsal CA1.
Figure 5.

Spatial, anatomical, and phase-related properties of interneurons. Top, Average interneuron firing rate activity classified by EEG state and anatomical location on the dorsoventral axis. Interneurons exhibiting phase precession fired at significantly higher rates during theta and ripple epochs (*p < 0.05; ***p < 0.01). Middle, The number of precessing and non-precessing interneurons observed in both the dorsal and middle hippocampus. Bottom, Mean pyramidal place field size versus mean interneuron field size for each brain region and track size for all rats. The diagonal line indicates identity.
Firing rate properties of precessing and non-precessing interneurons
The identification of a significant subset of interneurons with phase precession suggests that these cells may be functionally and physiologically distinct from non-precessing cells. It was hypothesized that these differences may be manifested in the activities of these cells during different EEG states. To pursue this question, firing rates of the precessing and non-precessing interneurons were analyzed in different EEG states. It was observed that precessing interneurons in both the dorsal and middle hippocampus fired at a significantly higher rate during putative ripple (both p values <0.01) and theta epochs (p < 0.01 and p < 0.05, respectively). During non-ripple epochs, middle CA1 hippocampal interneurons that exhibited theta phase precession fired at a greater rate than the non-precessing interneurons (p < 0.05). Dorsal CA1 precessing interneurons fired at a slightly higher rate than non-precessing interneurons during non-ripple epochs, although this effect was not significant (p = 0.13).
Also, perievent time histograms (PETHs) centered around the approximate middle of the putative ripple epoch were constructed for the precessing and non-precessing interneurons. No difference was found in the average PETH of precessing and non-precessing interneurons with the mid-ripple timestamp. One common feature of the cross-correlograms from both groups was the existence of double peaks at approximately the onset and offset of the putative ripple epoch, characteristic of cells in the CA1 pyramidal layer (as reported by Csicsvari et al., 1999).
First moment of the autocorrelation
A factorial ANOVA was used to examine the effect of hippocampal region (dorsal vs middle CA1) and neuron class (precessing interneurons, non-precessing interneurons, and pyramidal cells) on the first moment, or average, of the autocorrelation. Region of the hippocampus (dorsal vs middle CA1) had no effect on the first moment of the autocorrelation (p = 0.28, ANOVA). The mean ± SD for the first moment of the autocorrelation of all of the dorsal CA1 neurons was 19.9 ± 3.5 ms, and, for all middle hippocampal CA1 neurons, the mean ± SD was 18.9 ± 3.2 ms. There was, however, a significant effect of cell class on the first moment of the autocorrelation (p < 0.001, ANOVA). Moreover, each class of neurons was significantly different from the other classes in both the dorsal and middle hippocampus (p < 0.03 for all comparisons). The mean ± SD moment of the autocorrelation for precessing interneurons in the dorsal and middle hippocampus were 26.2 ± 1.4 ms and 26.2 ± 0.58, respectively. Non-precessing interneurons of the dorsal and middle hippocampus had mean ± SD first moments of 24.9 ± 1.2 and 24.6 ± 2.1 ms, respectively. Dorsal pyramidal cells had an average ± SD first moment of 19.2 ± 3.0 ms, whereas middle pyramidal cells had a first moment of 18.3 ± 2.7 ms. This suggests that the first moment of the autocorrelation may distinguish precessing interneurons from non-precessing interneurons and pyramidal cells.
Overlapping place fields
A portion of precessing interneurons exhibited overlapping place fields similar to place cells of the CA1 region (Maurer et al., 2006), which required the use of the phase component analysis rather than a linear regression or circular ANOVA analysis. Similar to pyramidal neurons, when two interneuron fields overlapped, spikes from each field can occur at different phases within a single theta cycle (Fig. 6).
Figure 6.

Example of an interneuron with overlapping place fields. Place field boundaries were assigned according to the definition that a single place field involves a single cycle of 360° of phase precession (Maurer et al., 2006). Left column, The first three rows present plots of phase, position, and firing rate activity (see Fig. 1). The spike density plots presented in the bottom row illustrate how the singular peak in the rate plot (top row) is composed of two overlapping place fields. The fields used for this analysis are dictated by the black dotted circles. Right column, The top row presents an event-triggered average of spike times, aligned on the time of the theta peak that occurred nearest (in time) to the point of maximum spatial overlap of the two fields (blue, first field encountered; red, second field encountered). Time is in units of phase relative to the trigger point. This plot illustrates that this interneuron fired at unique and non-overlapping phases of the theta rhythm throughout the overlapping portion of the place field.
Discussion
The present results confirm the hypothesis of Csicsvari et al. (1999) and Marshall et al. (2002) that, because some interneurons appear to be driven with high efficacy and at short latency by single pyramidal cells, these interneurons should exhibit an unambiguous cycle of theta phase precession in the same spatial location as the place field of their presynaptic pyramidal neuron. Similar predictions were derived from the model of Bose et al. (2000). Specifically, pyramidal cell–interneuron pairs that showed functional coupling had place fields that showed salient phase precession in the same region of the track. Moreover, previous research has shown that place field size, i.e., the spatial metric, increases along the dorsoventral axis of the hippocampus. Using a single cycle of theta phase precession as the definition of a unitary place field, interneuron place field size was similar to those measured in principal cells in the dorsal and middle hippocampus on both the large and small track [as determined in a previous analysis (Maurer et al., 2006)]. The increase in spatial metric of interneuron place fields was accompanied by a reduced spatial rate of phase precession (Fig. 2).
Previous studies of the functional coupling between hippocampal neurons report that ∼17.6% of all pyramidal cell–interneuron pairs recorded within a tetrode exhibit monosynaptic coupling, whereas only ∼1.17% of pyramidal cell–interneuron pairs between tetrodes had significant short-latency peaks in their cross-correlograms (Csicsvari et al., 1998). The lower proportion of functionally coupled neurons in the present study primarily reflects the fact that the present analysis required peaks within 3 ms of the center bin to be >5 SD above the mean and not 3 SD as used in previous analyses. The ratios of functionally coupled neurons recorded within tetrodes to coupled cell pairs recorded between tetrodes is similar [∼15:1 (Csicsvari et al., 1998) and ∼18:1 (present analysis)]. All interneurons that were monosynaptically coupled with pyramidal cells were found to precess.
The efficacy of monosynaptic transmission between interneurons and pyramidal cells is in the 10–50% range. Interneuron firing rates, however, are significantly greater in the spatial location in which the pyramidal cell is active. Therefore, it is conceivable that either the interneuron is being driven by other pyramidal neurons that have fields in the same location or a common network mechanism is generating the spatial selectivity and phase precession of the interneuron.
The existence of interneuron phase precession does not directly fit with hypotheses derived from the Hebb–Marr neural network model. The short-latency peaks in the cross-correlation analyses show that the pyramidal cell fires before the interneuron, not after. Thus, these interneurons may not play a simple thresholding function. Moreover, it appears that a proportion of interneuron input comes from local projections and not from external sources. Furthermore, the existence of interneuron phase precession demonstrates that they fire in the information domain of the CA1 principal neurons, expressing multiple instances of place fields based on the definition of a unitary field as a single cycle of precession. However, the strong functional coupling between pyramidal cells and interneurons is consistent with an “n-winners take all” dynamics (Brown and Sharp, 1995) in which the most strongly activated pyramidal cells fire at shorter latency and result in selective inhibition of firing of pyramidal cells that may be more weakly activated by the afferent input. The result is effectively the same as in the feedforward model of threshold control during associative recall.
Cobb et al. (1995) have demonstrated that basket cells in the CA1 region of the hippocampus can temporally synchronize pyramidal cell activity. Thus, it is plausible that interneurons that are driven by pyramidal cell activity could potentially serve to control the temporal spiking activity of other place cells and, thus, serve as a mechanism to provide a common temporal reference by which cellular assemblies are organized.
Footnotes
This work was supported by National Institutes of Health Grants NS020331, NS054465, and AG012609. We thank Jie Wang, Michelle Carroll, and Luann Snyder for technical and administrative support, as well as David Euston, Peter Lipa, Masami Tatsuno, and Shea Van Rhodes for helpful discussion.
References
- Amaral D, Witter M. The rat nervous system. San Diego: Academic; 1995. Hippocampal formation; pp. 443–486. [Google Scholar]
- Bartho P, Hirase H, Monconduit L, Zugaro M, Harris KD, Buzsaki G. Characterization of neocortical principal cells and interneurons by network interactions and extracellular features. J Neurophysiol. 2004;92:600–608. doi: 10.1152/jn.01170.2003. [DOI] [PubMed] [Google Scholar]
- Battaglia FP, Sutherland GR, McNaughton BL. Local sensory cues and place cell directionality: additional evidence of prospective coding in the hippocampus. J Neurosci. 2004;24:4541–4550. doi: 10.1523/JNEUROSCI.4896-03.2004. [DOI] [PMC free article] [PubMed] [Google Scholar]
- Bose A, Booth V, Recce M. A temporal mechanism for generating the phase precession of hippocampal place cells. J Comput Neurosci. 2000;9:5–30. doi: 10.1023/a:1008976210366. [DOI] [PubMed] [Google Scholar]
- Brody CD. Disambiguating different covariation types. Neural Comput. 1999;11:1527–1535. doi: 10.1162/089976699300016124. [DOI] [PubMed] [Google Scholar]
- Brown MA, Sharp PE. Simulation of spatial learning in the Morris water maze by a neural network model of the hippocampal formation and nucleus accumbens. Hippocampus. 1995;5:171–188. doi: 10.1002/hipo.450050304. [DOI] [PubMed] [Google Scholar]
- Cobb SR, Buhl EH, Halasy K, Paulsen O, Somogyi P. Synchronization of neuronal activity in hippocampus by individual GABAergic interneurons. Nature. 1995;378:75–78. doi: 10.1038/378075a0. [DOI] [PubMed] [Google Scholar]
- Csicsvari J, Hirase H, Czurko A, Buzsaki G. Reliability and state dependence of pyramidal cell-interneuron synapses in the hippocampus: an ensemble approach in the behaving rat. Neuron. 1998;21:179–189. doi: 10.1016/s0896-6273(00)80525-5. [DOI] [PubMed] [Google Scholar]
- Csicsvari J, Hirase H, Czurko A, Mamiya A, Buzsaki G. Fast network oscillations in the hippocampal CA1 region of the behaving rat. J Neurosci. 1999;19 doi: 10.1523/JNEUROSCI.19-16-j0001.1999. RC20(1–4) [DOI] [PMC free article] [PubMed] [Google Scholar]
- Csicsvari J, Hirase H, Mamiya A, Buzsaki G. Ensemble patterns of hippocampal CA3-CA1 neurons during sharp wave-associated population events. Neuron. 2000;28:585–594. doi: 10.1016/s0896-6273(00)00135-5. [DOI] [PubMed] [Google Scholar]
- Ekstrom AD, Meltzer J, McNaughton BL, Barnes CA. NMDA receptor antagonism blocks experience-dependent expansion of hippocampal “place fields”. Neuron. 2001;31:631–638. doi: 10.1016/s0896-6273(01)00401-9. [DOI] [PubMed] [Google Scholar]
- Freund TF, Buzsaki G. Interneurons of the hippocampus. Hippocampus. 1996;6:347–470. doi: 10.1002/(SICI)1098-1063(1996)6:4<347::AID-HIPO1>3.0.CO;2-I. [DOI] [PubMed] [Google Scholar]
- Fyhn M, Molden S, Hollup S, Moser MB, Moser E. Hippocampal neurons responding to first-time dislocation of a target object. Neuron. 2002;35:555–566. doi: 10.1016/s0896-6273(02)00784-5. [DOI] [PubMed] [Google Scholar]
- Gothard KM, Skaggs WE, Moore KM, McNaughton BL. Binding of hippocampal CA1 neural activity to multiple reference frames in a landmark-based navigation task. J Neurosci. 1996;16:823–835. doi: 10.1523/JNEUROSCI.16-02-00823.1996. [DOI] [PMC free article] [PubMed] [Google Scholar]
- Huxter J, Burgess N, O'Keefe J. Independent rate and temporal coding in hippocampal pyramidal cells. Nature. 2003;425:828–832. doi: 10.1038/nature02058. [DOI] [PMC free article] [PubMed] [Google Scholar]
- Jung MW, McNaughton BL. Spatial selectivity of unit activity in the hippocampal granular layer. Hippocampus. 1993;3:165–182. doi: 10.1002/hipo.450030209. [DOI] [PubMed] [Google Scholar]
- Kudrimoti HS, Barnes CA, McNaughton BL. Reactivation of hippocampal cell assemblies: effects of behavioral state, experience, and EEG dynamics. J Neurosci. 1999;19:4090–4101. doi: 10.1523/JNEUROSCI.19-10-04090.1999. [DOI] [PMC free article] [PubMed] [Google Scholar]
- Louie K, Wilson MA. Temporally structured replay of awake hippocampal ensemble activity during rapid eye movement sleep. Neuron. 2001;28:145–156. doi: 10.1016/s0896-6273(01)00186-6. [DOI] [PubMed] [Google Scholar]
- Marr D. Simple memory: a theory for archicortex. Philos Trans R Soc Lond B Biol Sci. 1971;262:23–81. doi: 10.1098/rstb.1971.0078. [DOI] [PubMed] [Google Scholar]
- Marshall L, Henze DA, Hirase H, Leinekugel X, Dragoi G, Buzsaki G. Hippocampal pyramidal cell-interneuron spike transmission is frequency dependent and responsible for place modulation of interneuron discharge. J Neurosci. 2002;22 doi: 10.1523/JNEUROSCI.22-02-j0001.2002. RC197(1–5) [DOI] [PMC free article] [PubMed] [Google Scholar]
- Maurer AP, Vanrhoads SR, Sutherland GR, Lipa P, McNaughton BL. Self-motion and the origin of differential spatial scaling along the septo-temporal axis of the hippocampus. Hippocampus. 2005;15:841–852. doi: 10.1002/hipo.20114. [DOI] [PubMed] [Google Scholar]
- Maurer AP, Cowen SL, Burke SN, Barnes CA, McNaughton BL. Organization of cell assemblies based on a single cycle of theta phase precession. Hippocampus. 2006;16:785–794. doi: 10.1002/hipo.20202. [DOI] [PubMed] [Google Scholar]
- McBain CJ, Freund TF, Mody I. Glutamatergic synapses onto hippocampal interneurons: precision timing without lasting plasticity. Trends Neurosci. 1999;22:228–235. doi: 10.1016/s0166-2236(98)01347-2. [DOI] [PubMed] [Google Scholar]
- McNaughton BL, Morris RG. Hippocampal synaptic enhancement and information storage within a distributed memory system. Trends Neurosci. 1987;10:408–415. [Google Scholar]
- McNaughton BL, Nadel L. Hebb-Marr networks and the neurobiological representation of action in space. In: Gluck MA, Rumelhard DE, editors. Neuroscience and connectionist theory. Hillsdale, NJ: Erlbaum; 1990. pp. 1–63. [Google Scholar]
- McNaughton BL, Barnes CA, O'Keefe J. The contributions of position, direction, and velocity to single unit activity in the hippocampus of freely-moving rats. Exp Brain Res. 1983a;52:41–49. doi: 10.1007/BF00237147. [DOI] [PubMed] [Google Scholar]
- McNaughton BL, O'Keefe J, Barnes CA. The stereotrode: a new technique for simultaneous isolation of several single units in the central nervous system from multiple unit records. J Neurosci Methods. 1983b;8:391–397. doi: 10.1016/0165-0270(83)90097-3. [DOI] [PubMed] [Google Scholar]
- Mizumori SJ, Barnes CA, McNaughton BL. Reversible inactivation of the medial septum: selective effects on the spontaneous unit activity of different hippocampal cell types. Brain Res. 1989;500:99–106. doi: 10.1016/0006-8993(89)90303-x. [DOI] [PubMed] [Google Scholar]
- Nitz D, McNaughton B. Differential modulation of CA1 and dentate gyrus interneurons during exploration of novel environments. J Neurophysiol. 2004;91:863–872. doi: 10.1152/jn.00614.2003. [DOI] [PubMed] [Google Scholar]
- O'Keefe J, Recce ML. Phase relationship between hippocampal place units and the EEG theta rhythm. Hippocampus. 1993;3:317–330. doi: 10.1002/hipo.450030307. [DOI] [PubMed] [Google Scholar]
- Ranck JB., Jr Studies on single neurons in dorsal hippocampal formation and septum in unrestrained rats. I. Behavioral correlates and firing repertoires. Exp Neurol. 1973;41:461–531. doi: 10.1016/0014-4886(73)90290-2. [DOI] [PubMed] [Google Scholar]
- Recce ML, O'Keefe J. The tetrode: an improved technique for multiunit extracellular recording. Soc Neurosci Abstr. 1989;15:1250. [Google Scholar]
- Shen J, Barnes CA, McNaughton BL, Skaggs WE, Weaver KL. The effect of aging on experience-dependent plasticity of hippocampal place cells. J Neurosci. 1997;17:6769–6782. doi: 10.1523/JNEUROSCI.17-17-06769.1997. [DOI] [PMC free article] [PubMed] [Google Scholar]
- Skaggs WE, McNaughton BL, Wilson MA, Barnes CA. Theta phase precession in hippocampal neuronal populations and the compression of temporal sequences. Hippocampus. 1996;6:149–172. doi: 10.1002/(SICI)1098-1063(1996)6:2<149::AID-HIPO6>3.0.CO;2-K. [DOI] [PubMed] [Google Scholar]
- Terrazas A, Krause M, Lipa P, Gothard KM, Barnes CA, McNaughton BL. Self-motion and the hippocampal spatial metric. J Neurosci. 2005;25:8085–8096. doi: 10.1523/JNEUROSCI.0693-05.2005. [DOI] [PMC free article] [PubMed] [Google Scholar]
- Wilson MA, McNaughton BL. Dynamics of the hippocampal ensemble code for space. Science. 1993;261:1055–1058. doi: 10.1126/science.8351520. [DOI] [PubMed] [Google Scholar]