

Abstract
Ciliary neurotrophic factor (CNTF) promotes photoreceptor survival but also suppresses electroretinogram (ERG) responses. This has caused concerns about whether CNTF is detrimental to the function of photoreceptors because it is considered to be a potential treatment for retinal degenerative disorders. Here we report that the suppression of ERG responses is attributable to negative regulation of the phototransduction machinery in rod photoreceptors. Intravitreal injection of recombinant human CNTF protein in rat results in a series of biochemical and morphological changes in rod photoreceptors. CNTF induces a decrease in rhodopsin expression and an increase in arrestin level. Morphologically, CNTF treatment causes a shortening of rod outer segments (ROS). All of these changes are fully reversible. The lower rhodopsin level and shortened ROS reduce the photon catch of rods. Less rhodopsin and more arrestin dramatically increase the arrestin-to-rhodopsin ratio so that more arrestin molecules are available to quench the photoexcited rhodopsin. The overall effect of CNTF is to negatively regulate the phototransduction machinery, which reduces the photoresponsiveness of rods, resulting in lower ERG amplitude at a given intensity of light stimulus. The CNTF-induced changes in rods are similar to those in light-induced photoreceptor plasticity. Whether CNTF-induced changes in rods are through the same mechanism that mediates light-induced photoreceptor plasticity remains to be answered.
Keywords: CNTF, phototransduction, Müller cells, ERG, electroretinogram, retina, rod
Introduction
Ciliary neurotrophic factor (CNTF), a member of the interleukin-6 family of neuropoietic cytokines, was initially identified as a factor in chick embryo extract that supported viability of embryonic chick ciliary neurons (Adler et al., 1979; Varon et al., 1979) and later purified to homogeneity (Lin et al., 1989; Stockli et al., 1989).
Inactivation of the CNTF gene results in no specific abnormalities in human and animals (Masu et al., 1993; Takahashi et al., 1994). However, application of exogenous CNTF has profound effects on cells in the nervous system. CNTF supports the survival of sensory neurons, motor neurons, cerebral neurons, and hippocampal neurons (Skaper et al., 1986; Ip et al., 1991; Sendtner et al., 1992; Wong et al., 1993; Larkfors et al., 1994). It promotes the differentiation of cholinergic sympathetic neurons (Ernsberger et al., 1989; Saadat et al., 1989), the differentiation of glial progenitors into astrocytes (Hughes et al., 1988; Lillien et al., 1988), and the maturation and survival of oligodendrocytes (Louis et al., 1993). CNTF is also a myotrophic factor (Conover et al., 1993; Helgren et al., 1994).
CNTF inhibits rod differentiation in rat retina and in retinal cell culture, judged by the number of rhodopsin-expressing cells (Ezzeddine et al., 1997; Kirsch et al., 1998). In chicken retinal cell culture, however, it promotes rod differentiation (Fuhrmann et al., 1998). Additional studies revealed that the effect on rod differentiation in rats was transient, as assessed by rhodopsin expression; it had no effect on rod morphological maturation (Schulz-Key et al., 2002).
LaVail et al. (1992) were the first to report that CNTF promotes photoreceptor survival. Since then, the protective effect of CNTF has been confirmed in a variety of animal models of retinal degeneration, including mouse models (Cayouette and Gravel, 1997; Cayouette et al., 1998; LaVail et al., 1998; Liang et al., 2001a,b; Bok et al., 2002; Schlichtenbrede et al., 2003), transgenic rats expressing mutant rhodopsin (Liang et al., 2001b; Tao et al., 2002), a cat model (Chong et al., 1999), and a dog model (Tao et al., 2002). These findings have raised the hope that CNTF could be a potential treatment for retinal degenerations and led to a clinical trial in patients with retinitis pigmentosa (Sieving et al., 2006).
Several groups used adeno-associated viral vectors to deliver cDNA of CNTF to retinal cells to evaluate the long-term effect of CNTF (Liang et al., 2001b; Bok et al., 2002; Schlichtenbrede et al., 2003). These experiments confirm the long-term protective effects. However, the treated retinas showed no improvement in the amplitudes of electroretinogram (ERG) responses. In some cases, the ERG responses in treated retinas had even lower amplitudes than in controls, despite the fact that many more rod photoreceptors survived than would have without the treatment. These unexpected and seemingly contradictory results raised the question whether CNTF treatment might be detrimental to photoreceptors.
We used CNTF protein to investigate its effects on rods. Here we report that CNTF negatively regulates the phototransduction machinery in rods, resulting in lower ERG amplitudes.
Materials and Methods
Expression and purification of recombinant CNTF protein.
The open reading frame of human CNTF cDNA was cloned into an expression vector pQE30 (Qiagen, Valencia, CA), fused to a 6× His tag at the N terminus, to generate plasmid pQE–CNTF. Recombinant human CNTF protein was expressed in Escherichia coli (XL-blue; Stratagene, La Jolla, CA) and purified by immobilized-metal affinity chromatography on Ni-NTA agarose columns (Qiagen) under native conditions. Eluted protein was buffer exchanged to PBS. The purified recombinant protein has an apparent size of ∼23 kDa after electrophoresis on acrylamide gel (Fig. 1).
Figure 1.

Recombinant human CNTF. Recombinant protein was purified on nickel columns. After electrophoresis on 10% acrylamide gel and visualized by SimplyBlue SafeStain (Invitrogen), CNTF protein was detected as a single band of ∼23 kDa. Lane 1, Protein molecular weight marker (molecular weight was indicated on the left for the 2 bands close to CNTF protein). Lane 2, Purified recombinant human CNTF protein, 1 μg. Lane 3, Purified recombinant human CNTF protein, 5 μg.
To prove that the effects we observed after CNTF treatment were not caused by potential contaminants that might be copurified with CNTF, we used purified cell lysate as control in some experiments. Purified cell lysate was obtained from E. coli transformed with an empty vector pQE30 (without CNTF open reading frame) following the same protocol used to purify CNTF. Four bands of unidentified proteins were visible in the purified cell lysate after electrophoresis (1 μg/lane), a reasonably strong band of ∼58 kDa, and three barely visible ones of ∼120, ∼75, and ∼18 kDa (data not shown).
Animals and intravitreal injections.
Adult Long–Evans rats were purchased from Harlan (Indianapolis, IN) and used in all experiments. Animals were kept in a 12 h light/dark cycle (lights on, 7:00 A.M. to 7:00 P.M.) at an in-cage illuminance of 50 lux. The in-cage temperature was kept at 20–22°C. Intravitreal injections were delivered through 32 gauge needles connected to 10 μl Hamilton microsyringes (Hamilton, Reno, NV). No change in pupil size or reactivity to light was observed in eyes injected with CNTF.
ERG recording.
A group of eight animals were injected with CNTF into the left eyes (10 μg in 5 μl of PBS), and the right eyes were injected with PBS (5 μl). A second group of six animals were injected with PBS (5 μl) in the left eyes, and the right eyes were left untreated. ERG a- and b-waves were recorded from the same animals at 6 and 21 d after injection. Before recording, animals were dark adapted overnight. Under dim red light, they were anesthetized with intraperitoneal ketamine (80 mg/kg) and xylazine (4 mg/kg). Pupils were dilated with 0.1% atropine and 0.1% phenylephrine HCl. A gold wire loop electrode was placed on the cornea, and a differential electrode was placed on the sclera near the limbus after topical anesthesia with 1% tetracaine. A ground wire electrode was attached to an ear. Both eyes were recorded simultaneously, and responses were amplified at 5000 gain and bandpass filtered between 0.1 and 1000 Hz in the presence of a 60 Hz notch filter. Scotopic (rod photoreceptor initiated) ERG responses were elicited in the dark-adapted state using single xenon photostrobe 30 μs flashes from a Grass PS33 photic stimulator (Grass-Telefactor, Astro-Med, West Warwick, RI) in a Ganzfeld (full field) integrating sphere. Stimulus light intensity between −6.9 and 0.6 log cd · s/m2 was controlled with neutral density filters. Interstimulus intervals were between 3 and 60 s depending on flash intensity. The a-wave amplitude, from threshold to maximum intensity, was measured from baseline to trough, and the b-wave amplitude, from threshold up to −1.9 log cd · s/m2, was measured from the baseline or from the trough of the a-wave when present (Fig. 2A).
Figure 2.
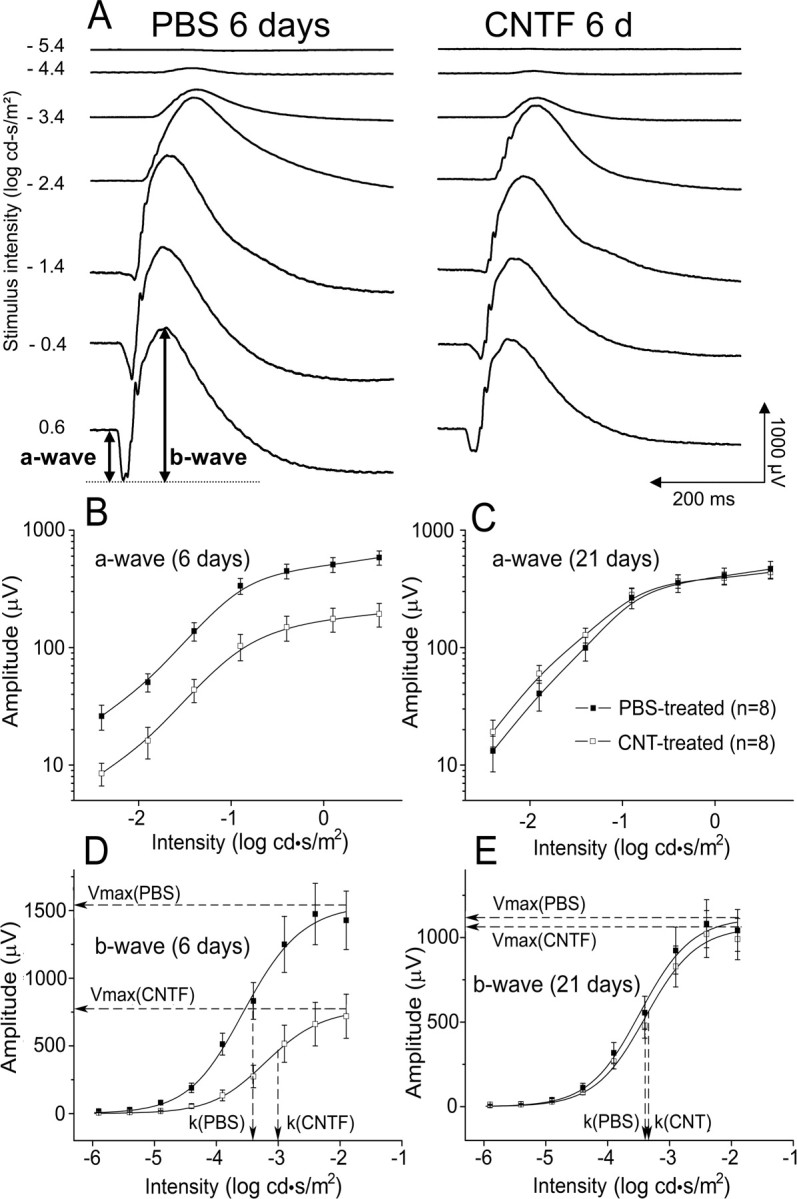
Dark-adapted ERG responses. A, ERG waveforms at increasing stimulus intensities from top to bottom. Average amplitudes of the a-wave (B, C) and the b-wave (D, C) at each intensity at 6 d (B, D) and 21 d (C, E) after CNTF injection into the left eye and PBS injection into the right eye. CNTF treatment induced a significant decrease in the a- and b-wave 6 d after injection. No significant difference between CNTF- and PBS-treated eyes in either a- or b-wave was seen 21 d after injection. Solid lines in B and C are B-spline curves through the data points. Solid lines in D and E are the averaged Naka–Rushton function fits. Dashed lines indicate Vmax and k values from these fits. Data points are averages of eight animals, and error bars are ±SEM.
The scotopic b-wave of the rat saturates ∼3 log units above threshold (Fig. 2D) (Naarendorp et al., 2001) and reflects the activity of second-order rod bipolar cells (Newman and Odette, 1984; Stockton and Slaughter, 1989; Xu and Karwoski, 1994; Robson and Frishman, 1995). This region of the b-wave intensity–response curve can be modeled using the Naka–Rushton equation, as an indicator of rod-initiated retinal function (Fulton and Rushton, 1978; Arden et al., 1983). This equation,
where Vmax is the maximum of the b-wave amplitude, k is the intensity at which the b-wave amplitude reaches half-saturation, and n is a dimensionless constant related to the slope, is used to evaluate changes in the scotopic b-wave amplitude and sensitivity (1/k) (Fulton and Rushton, 1978; Arden et al., 1983). It was fit to b-wave intensity–response data between −5.9 and −1.9 log cd · s/m2 by the least-square method iteratively performed by computer using OriginPro 7.5 (Microcal, Northampton, MA).
The variability in ERG amplitude between individual animals is usually much greater than between eyes in the same animal (Sugawara et al., 2000). Thus, the effect of monocular CNTF treatment is best expressed as the average ratio of the treated eye to the fellow control (PBS) eye, as reported previously in rabbits (Bush et al., 2004). The two-way ANOVA with repeated measures (matching across time) and the Bonferroni's post hoc test were used to determine statistical significance of differences across time and treatments in average absolute amplitudes, amplitude ratios (logarithms of amplitudes), and k values. The one-way ANOVA was used to look for statistical differences between the eyes of the CNTF–PBS and PBS–no treatment groups of rats at 6 and 21 d. All statistical analyses were performed using GraphPad Software (San Diego, CA) PRISM 4.
Antibodies, protein preparation, and immunoblotting analysis.
Antibodies against rhodopsin (B6–30) were a gift from Dr. Jeremy Nathans of Johns Hopkins University (Baltimore, MD). Antibodies against arrestin and transducin α, β subunits were purchased from Calbiochem (San Diego, CA). Antibodies against Nrl (neural retina leucine zipper) were purchased from Santa Cruz Biotechnology (Santa Cruz, CA). Antibodies against phospho-STAT3 (signal transducer and activator of transcription 3) (Tyr705) and STAT3 were purchased from Cell Signaling Technology (Beverly, MA). Pooled retinas were homogenized, and the concentration of total protein in each sample was determined by the BCA protein assay (Pierce, Rockford, IL). Total protein was electrophoresed on 10% NuPage gel (Invitrogen, Carlsbad, CA) and transferred to nitrocellulose membranes (Bio-Rad, Hercules, CA). Immunoblotting was performed and signals were visualized using chemiluminescent substrates (Pierce) and recorded on Hyperfilm (Amersham Biosciences, Piscataway, NJ). All experiments were repeated three times to verify the consistency of the results.
Quantitative real-time PCR analysis.
The levels of rhodopsin and arrestin mRNA were determined by quantitative real-time PCR (ABI Prism 7000; Applied Biosystems, Foster City, CA) according to the instructions of the manufacturer. Total RNA from pooled retinas was extracted with an RNeasy kit (Qiagen) and transcribed with Taqman Reverse Transcription Reagents (Applied Biosystems). PCR reactions were performed using commercially available probes (Applied Biosystems) for rhodopsin (Rn00583728-m1), arrestin (Rn00564656-m1), and 18S rRNA (Hs99999901-s1). The threshold cycles (Ct) were calculated with ABI Prism 7000 software. Standard curves were plotted with Ct versus log template quantities. Levels of mRNA were determined from standard curves and normalized to the level of 18S rRNA.
Histology and immunocytochemistry.
Animals were killed by CO2 overdose, followed by vascular perfusion with mixed aldehydes. Eyes were postfixed, incubated in 2% osmium tetroxide for 1 h, dehydrated, and embedded in an Epon/Araldite mixture. For light microscopy, eyes were sectioned at 1 μm along the vertical meridian. Measurement of rod outer segment (ROS) length was taken at 2 mm from the far periphery of the inferior retina at 600×. For electron microscopy, thin sections were cut, mounted on Formvar-coated grids, and stained with lead citrate and uranyl acetate. Grids were viewed using a transmission electron microscope (JEM-1010; Jeol, Tokyo, Japan).
For immunocytochemical experiments, eyes were removed from animals after 4% paraformaldehyde perfusion, cryoprotected with 20% sucrose, and frozen in Tissue-Tek OCT compound (Miles, Elkhart, IN). Tissue sections (10 μm) along the vertical meridian were cut on a cryostat. Sections were probed with anti-phospho-STAT3 (Tyr705) antibodies. Müller cells were identified with antibodies against glutamine synthetase (GS) (Chemicon, Temecula, CA). Sections were examined by confocal microscopy.
Results
ERG recording
The scotopic ERG arises from retinal activity initiated exclusively by the rod photoreceptors. The leading edge of the a-wave (Fig. 2A) directly reflects a reduction in the circulating dark current around photoreceptors in response to light, leading to their hyperpolarization (Penn and Hagins, 1969; Breton et al., 1994). Because of the low cone density in rat retina, cone responses do not contribute significantly to the total a-wave at the flash intensities used here. The scotopic b-wave is produced by second-order depolarizing bipolar cells (Newman and Odette, 1984; Stockton and Slaughter, 1989; Xu and Karwoski, 1994; Robson and Frishman, 1995). Therefore, changes in a-wave amplitude indicate changes in photoreceptor responses directly, whereas changes in b-wave amplitude could reflect changes in photoreceptor activity, in synaptic transmission, or in bipolar cell response to photoreceptor input. Above the scotopic range, b-wave amplitudes are influenced by activity in the cone retinal pathway (Toda et al., 1999) and the emergence of the a-wave (Fig. 2).
Six days after CNTF injection, substantial decreases were observed in both the a- and b-wave responses in CNTF-treated eyes compared with PBS-injected eyes across the entire range of stimulus intensity (Fig. 2). The waveforms in Figure 2A illustrate the overall reduced amplitude of the responses in CNTF eyes at each stimulus intensity and, at the same time, their relatively normal shape and timing as they change progressively with increasing intensity. Because the a-wave is a direct reflection of photoreceptor activity, this indicates reduced photoreceptor response to light in the CNTF-injected eyes. The average a- and b-wave amplitudes (n = 8) at each intensity are plotted in Figure 2B–E. The log–log plots of the a-wave (Fig. 2B,C) show that, at 6 d after injection, there is proportional amplitude reduction at every intensity, which is completely reversed by 21 d. The log–linear plots of b-wave amplitude versus intensity illustrate the substantial reduction in amplitude as well as the shift to the right in the half-maximal intensity value (k), indicating a decrease in sensitivity. These changes in the b-wave recovered completely by 21 d along with the a-wave.
The average maximum a-wave amplitudes, Vmax, and k for the b-wave are given in Table 1. The a-wave and b-wave amplitudes in the CNTF-treated eyes were significantly reduced (p < 0.01 and p < 0.05, respectively, two-way ANOVA), and the b-wave k value was significantly higher (p < 0.05) at 6 d after injection compared with the PBS eyes. At 21 d, none of these parameters were significantly different. Because of the variability between animals, the average ratio of the amplitudes in the two eyes of individual animals is a more precise measure of the effect of monocular CNTF treatment than the difference in the average amplitudes (see Materials and Methods). At 6 d, the a- and b-waves of the CNTF-treated eyes were 62% (p < 0.01) and 41% (p < 0.05) lower than those of the fellow PBS-injected eyes, respectively (Table 1). By 21 d after injection, the ratios were not significantly different from 1, indicating a complete recovery.
Table 1.
ERG a-wave and b-wave data from CNTF- and PBS-treated rats
| Treatment | a-wave amplitudea (μV) | b-wave Vmaxb (μV) | b-wave kb (log cd · s/m2) | a-wave CNTF/PBS ratio | b-wave CNTF/PBS ratio | |||||
|---|---|---|---|---|---|---|---|---|---|---|
| 6 d | ||||||||||
| PBS (n = 8) | 584 ± 81 | p < 0.01 | 1543 ± 224 | p < 0.05 | −3.50 ± 0.10 | p < 0.05 | 0.38 ± 0.09 | p < 0.01 | 0.59 ± 0.12 | p < 0.05 |
| CNTF (n = 8) | 194 ± 44 | 774 ± 165 | −3.08 ± 0.09 | |||||||
| 21 d | ||||||||||
| PBS (n = 8) | 466 ± 77 | NS | 1116 ± 134 | NS | −3.42 ± 0.06 | NS | 1.08 ± 0.16 | NS | 1.03 ± 0.16 | NS |
| CNTF (n = 8) | 438 ± 54 | 1063 ± 132 | −3.36 ± 0.05 |
aAmplitude at the maximum intensity (0.6 log cd · s/m2).
bNaka–Rushton function fit to scotopic b-wave data.
Values are mean ± SEM. p values were calculated using the repeated-measures two-way ANOVA (matching across time), followed by the Bonferroni's post hoc test for specific comparisons. For a-wave amplitude and b-wave Vmax, raw amplitudes were used. For ratios, values were first converted to logarithms to convert the differences to ratios. The log intensity values were used to calculate the p values for k. All measurements showed a significant effect of treatment (p < 0.01, a-wave; p < 0.05, b-wave and k) overall and interaction of time and treatment (p < 0.05) but no significant effect of time.
The amplitudes of the a- and b-waves in both PBS-treated and CNTF-treated eyes at 21 d were lower than PBS-injected eyes at 6 d, although the reductions were not statistically significant (two-way ANOVA). To see whether this trend occurred only in CNTF-injected animals, perhaps as a result of systemic CNTF or the injection procedure, we compared the PBS-injected eyes in this group with the eyes of the second group of rats injected at the same time with PBS in the left eye and no injection in the right eye. The average maximum amplitudes (n = 6) in the no-treatment eye at 6 d (a-wave, 633 ± 56 μV; Vmax of 1559 ± 156 μV) and 21 d (a-wave, 486 ± 77 μV; Vmax of 1299 ± 124 μV) and in the PBS-injected eyes at 6 d (a-wave, 663 ± 30 μV; Vmax of 1606 ± 124 μV) and 21 d (a-wave, 505 ± 66 μV; Vmax of 1310 ± 203 μV) were comparable with PBS-injected eyes of the first group (Table 1). Again, the reduction with age was not statistically significant, and there was no significant difference between the PBS eyes and the no-treatment eyes of these two different groups (one-way ANOVA). The trend toward lower amplitudes at 21 d is consistent with our previous experience that repeated ERG recordings in rodents, even separated by as much as 2–3 weeks, often result in a general reduction in the a- and b-wave amplitudes.
CNTF-induced changes in rhodopsin and other phototransduction-related proteins
We examined the levels of several phototransduction-related proteins, including rhodopsin, the transducin α, β subunits, and arrestin. Rhodopsin protein appeared as two major bands (∼34 and ∼60 kDa) on a Western blot (Fig. 3A), believed to represent monomers and dimers, respectively (Sung et al., 1991). By day 6 after CNTF treatment, the rhodopsin level became very low. Full recovery of the rhodopsin level was seen by 21 d after CNTF treatment (Fig. 3A). A decrease in the levels of transducin α and β subunits was also observed, which followed a temporal pattern similar to that of rhodopsin. The level of arrestin increased significantly 3 d after CNTF treatment, and an additional increase was seen 6 d after treatment. The amount of arrestin also returned to the control level 21 d after CNTF injection. In comparison, the level of Nrl, a transcription factor believed to regulate the expression of rhodopsin, was not significantly altered (Fig. 3A).
Figure 3.

CNTF-induced changes in phototransduction-related proteins. A, The levels of rhodopsin (Rho), transducin α (Tα), transducin β (Tβ), arrestin (Arr), and Nrl were examined by immunoblotting. A decrease in rhodopsin protein reached a very low level 6 d after CNTF treatment. The decrease in transducin α and β subunit followed a similar pattern. CNTF treatment also induced an increase in arrestin protein at both 3 d (3D) and 6 d (6D) after treatment. No change in the Nrl level was detected. All of the CNTF-induced changes were fully recovered by 21 d after treatment (3W). B, C, CNTF-induced changes in rhodopsin (B) and arrestin (C) gene expression were examined by real-time PCR. There was a significant decrease in rhodopsin mRNA 3 and 6 d after CNTF treatment. The rhodopsin mRNA level was 45 and 33% of that in PBS-treated eyes for 3 and 6 d, respectively. *p < 0.001 (ANOVA). Expression of arrestin was not altered by CNTF treatment.
To prove that the findings described above were not caused by potential contaminants that might have been copurified with CNTF, we used purified cell lysate (see Materials and Methods) as control. A group of animals were injected with 0.5 μg of lysate (in 5 μl of PBS) into the right eyes and CNTF (10 μg in 5 μl of PBS) into the left eyes. The protein levels of rhodopsin and arrestin were examined 6 and 21 d after injection. No alteration of either rhodopsin or arrestin level was observed in lysate-injected eyes. In comparison, a dramatic decrease in rhodopsin level and an increase in arrestin level were found in CNTF-treated eyes 6 d after injection. The changes in CNTF-injected eyes were fully recovered 21 d after injection (data not shown). These results are consistent with those in which PBS was used as control and indicate that the effects we observed after CNTF treatment were specifically induced by CNTF.
The transcriptional expression of rhodopsin and arrestin in CNTF-treated retinas was examined by quantitative real-time PCR. A significant decrease in rhodopsin mRNA was seen 3 and 6 d after CNTF injection (Fig. 3B). There was little change in arrestin mRNA after CNTF treatment (Fig. 3C), indicating that the increase in arrestin protein level was not attributable to an increase in transcription.
CNTF-induced changes in rod outer segments
Six days after CNTF treatment, the length of ROS in CNTF-treated eyes (Fig. 4A) was 15.38 ± 1.39 μm (mean ± SD; n = 13), shortened by approximately half (46%; p < 0.0001) compared with that in the contralateral PBS-treated eye (28.31 ± 2.72 μm, mean ± SD; n = 13) (Fig. 4A). In addition, the shape of the ROS in CNTF-treated eye became irregular with narrow regions along the length (Fig. 4A), which was not seen in the PBS-treated eye. Changes in ROS length and shape were fully recovered 3 weeks after CNTF injection (Fig. 4A). In another group of animals, the morphology of ROS was examined after injection of cell lysate (0.5 μg in 5 μl of PBS) into the right eyes and CNTF (10 μg in 5 μl of PBS) into the left eyes. No observable changes were found in lysate-injected eyes, whereas a significant shortening of ROS was observed 6 d after CNTF treatment. Morphological changes in CNTF-injected eyes were fully recovered by 21 d after injection (data not shown). These findings indicate that changes in ROS morphology were specifically induced by the treatment of CNTF.
Figure 4.
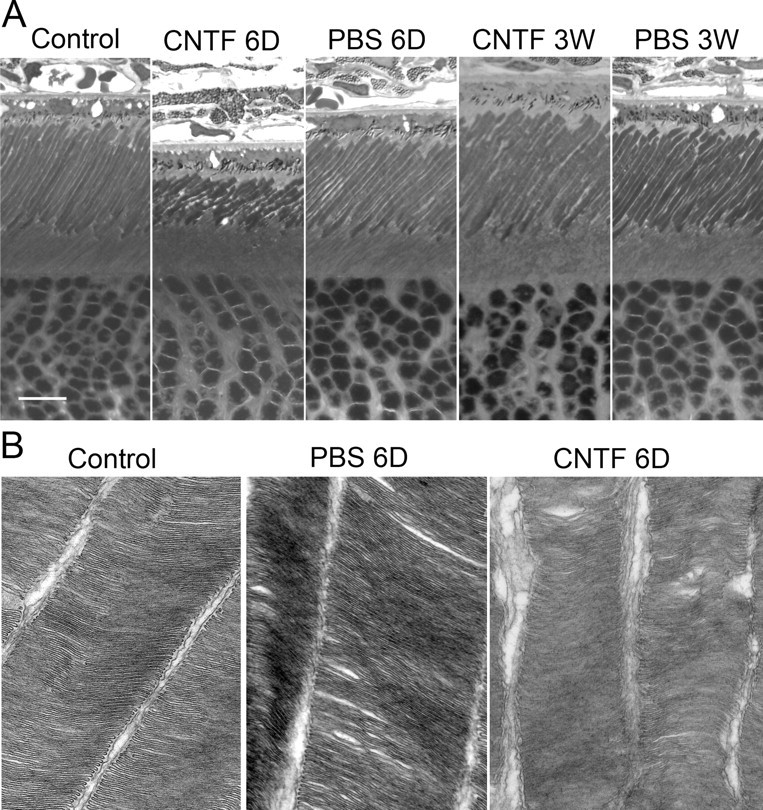
CNTF-induced morphological changes in ROS. A, A significant shortening of the ROS were seen in eyes 6 d (6D) after CNTF treatment, accompanied with narrow regions along ROS length. These changes were completely recovered 3 weeks (3W) after CNTF treatment. No alteration of ROS was observed in eyes treated with PBS. B, When examined by electron microscopy, ROS were cylinder shaped and disks were evenly packed. ROS in PBS-treated retina are similar to the untreated control. In CNTF-treated retina (B), however, there were narrow regions distributed along the ROS length. The space between outer segments became wider and some disks were disorganized. Scale bar, 10 μm. Original amplification for B, 50,000×.
The ultrastructure of the ROS was examined by electron microscopy. In the untreated retina, the ROS maintained a cylindrical shape. Disks in the ROS were of the same thickness and spaced evenly (Fig. 4B). The same was observed in ROS from PBS-treated eyes. In CNTF-treated retina, however, the shape of the ROS became irregular, with narrow regions distributed along their length, confirming the light microscopy findings. The space between ROS became wider and some disks became disorganized (Fig. 4B).
CNTF-induced phosphorylation of STAT3
CNTF activates STAT3, a major downstream signaling molecule, by inducing its phosphorylation. In CNTF-treated retinas, a dramatic increase in STAT3 phosphorylation was observed. The increase was detected as early as 1 h after injection and lasted for 6 d (Fig. 5A).
Figure 5.
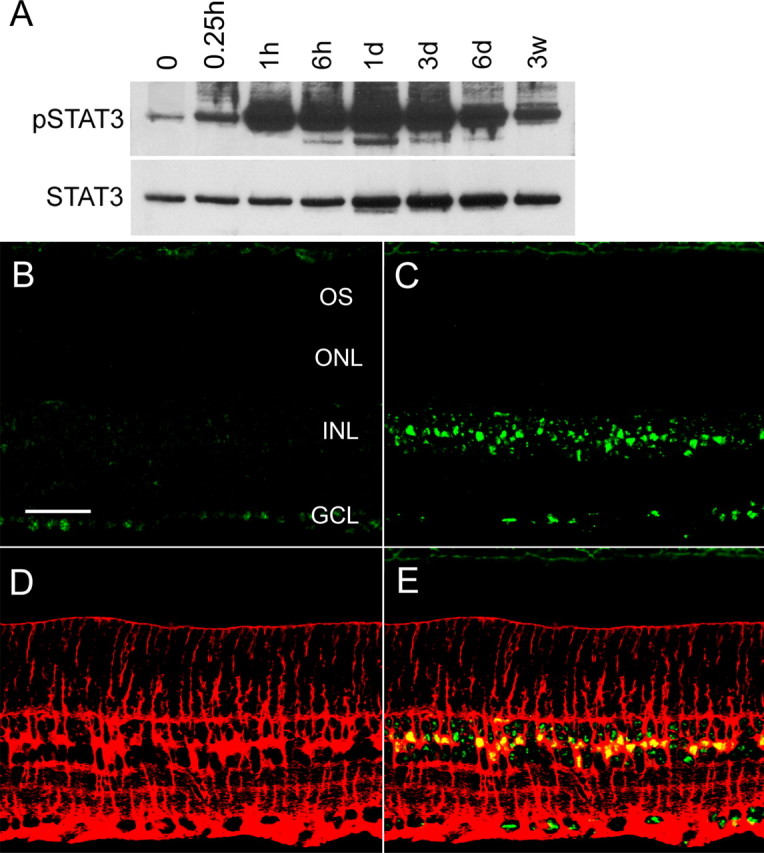
CNTF-induced phosphorylation of STAT3. A, Immunoblotting detected a significant STAT3 phosphorylation (pSTAT3) as early as 1 h and lasted 6 d after CNTF treatment. A slight increase in total STAT3 (STAT3) was also seen 1–6 d after injection. B–E, CNTF-induced STAT3 phosphorylation was localized by immunocytochemical analysis. B, Immunostaining of phospho-STAT3 was mainly detected in the nuclei of ganglion cells in the untreated retina. C, CNTF-induced a dramatic increase in STAT3 phosphorylation in a specific band of cells in the inner nuclear layer. Müller cells were identified by antibodies against GS (C, red). The immunoreactivities of pSTAT3 (green) and GS (red) are clearly colocalized (D, yellow). OS, Outer segment; ONL, outer nuclear layer; INL, inner nuclear layer; GCL, ganglion cell layer. Scale bar, 50 μm.
The induced STAT3 phosphorylation was localized by immunocytochemical analysis (Fig. 5B–E). In the untreated retina, immunostaining for phospho-STAT3 was detected mainly in the nuclei of retinal ganglion cells (Fig. 5B). In the retina treated with CNTF, there was a dramatic increase in phospho-STAT3 immunostaining in a specific band of cells in the inner nuclear layer, but no immunoreactivity was present in the photoreceptors (Fig. 5C). The location and morphology of the cells with increased STAT3 phosphorylation suggest that they are Müller cells. Indeed, immunostaining of phospho-STAT3 (Fig. 5C, green) and GS (Müller cell marker) (Fig. 5D, red) are colocalized (Fig. 5E, yellow). These results are consistent with previous findings that CNTF induces STAT3 activation specifically in Müller cells, not in photoreceptors (Peterson et al., 2000).
Discussion
We demonstrated that CNTF treatment induces a series of biochemical and morphological changes in rod photoreceptors, leading to a lower photoresponsiveness. As a result, the amplitudes of the ERG a- and b-waves are lower in CNTF-treated retinas at a given intensity of stimulus. These biochemical and morphological changes in rods, as well as changes in the ERG waves, are fully reversible. Because Müller cells are directly responsive to CNTF but photoreceptors are not, our data suggest that CNTF-induced changes in rod photoreceptors are mediated through Müller cells.
Rhodopsin captures photons and starts the phototransduction cascade (Stryer, 1986; Yau, 1994; Baylor, 1996). The lower rhodopsin content in CNTF-treated eyes reduces the photon-catching capability of rods and thus their photoresponsiveness. CNTF treatment also induces an increase in arrestin, a protein that binds to phosphorylated rhodopsin to turn off the phototransduction cascade (Wilden et al., 1986; Xu et al., 1997). The decrease in rhodopsin and increase in arrestin dramatically increases the arrestin-to-rhodopsin ratio, making more arrestin available for each rhodopsin molecule. Because the binding of arrestin to phosphorylated rhodopsin is dose dependent (Wilden, 1995), the increased arrestin-to-rhodopsin ratio favors the binding and thus more effective quenching of activated rhodopsin.
CNTF also induces a dramatic change in the morphology of ROS. ROS become significantly shorter and their shape becomes irregular with narrow regions along the length. ROS are specialized organelles for capturing photons. Shortened ROS have less capability of photon capturing. Reductions in diameter in the narrow regions further reduce the volume of ROS and thus the photon-catching capability.
The CNTF-induced biochemical and morphological changes in rod photoreceptors work in concert to downregulate the phototransduction machinery. This is directly reflected in the lower amplitude of the a-wave, which is generated by the rod photoreceptor circulating current with almost no contribution from cones in rat (Toda et al., 1999; Aleman et al., 2001). Our ERG recordings showed a 62% reduction in the a-wave amplitude at the maximum intensity 6 d after CNTF treatment, approximately proportional to the 46% reduction in ROS length. The magnitude of ERG reduction relative to ROS changes in the present work is similar to that observed by Reiser et al. (1996), who recorded a-waves in eyecups from albino rats reared in two different lighting conditions. The saturated a-wave amplitude in rats reared in 200 lux cyclic light was 44% lower than that in animals reared in 3 lux cyclic light, and the ROS length in the 200 lux animals was 32% shorter than that in the 3 lux rats (Reiser et al., 1996).
Our results confirm previous findings (Peterson et al., 2000) that CNTF does not induce STAT3 phosphorylation in photoreceptors, indicating that photoreceptors are not directly responsive to CNTF through STAT3. The effects of CTNF on photoreceptors likely are mediated through cells that are directly responsive to CNTF. The fact that activation of STAT3 was found mainly in Müller cells after CNTF treatment (Peterson et al., 2000 and the present study) suggests that Müller cells are directly responsive to exogenous CNTF. These results therefore support the hypothesis that CNTF activates Müller cells, which in turn send signals to rods to downregulate phototransduction machinery. The nature of the signals from Müller cells is yet to be identified, but it is likely to be a diffusible factor. Identification of this putative factor would shed light on the cell–cell interaction between Müller cells and photoreceptors. It may also have potential medical applications.
It is interesting to see the similarity between CNTF-induced changes and those in animals exposed to higher habitat lighting. Rhodopsin content in the retina of albino rats is reduced in cyclic light-reared albino rats compared with dark-reared animals (Organisciak and Noell, 1977). Battelle and LaVail (1978) demonstrated dynamic changes in rhodopsin content and ROS length under different light conditions. They found that dark adaptation for 10 d increased the rhodopsin content in light-reared animals to the level comparable with dark-reared animals. When the animals returned to previous habitat illuminance, their rhodopsin content returned to the previous level. Changes in ROS length follow a similar pattern (Battelle and LaVail, 1978). Moving animals from dark to cyclic light also induces a decrease in rhodopsin expression, a decrease in transducin α expression, and an increase in arrestin expression (Farber et al., 1991; Organisciak et al., 1991). In addition, animals reared in high habitat illuminance have lower-amplitude ERG a-waves than those reared in lower light levels (Reiser et al., 1996).
ROS are known to undergo continual renewal (Young, 1967; Young and Droz, 1968). New disks are assembled at the base of ROS to displace the existing ones outward (Bargoot et al., 1969; Hall et al., 1969), and disks at the tip are shed and phagocytized by Retinal pigment epithelial cells (Young and Bok, 1969). Penn and Williams (1986) proposed that the continual renewal of ROS allows rods to adjust the ROS length and rhodopsin content to a new light environment by regulating the rates of disk addition and removal. Many studies have provided evidence supporting this hypothesis. How this regulation is achieved is unclear, however. Our data showing that intravitreal administration of CNTF affects the phototransduction machinery indicate that the retina itself contains a mechanism for signaling rods to adjust their phototransduction machinery. Input from outside the retina is not necessarily required, yet the question as to whether CNTF- and light-induced changes in rods are mediated through the same mechanism remains to be answered.
In summary, we found that CNTF treatment negatively regulates rod phototransduction machinery to reduce their responsiveness to light, resulting in lower-amplitude ERG waves. CNTF-induced changes are similar to those induced by light exposure. Additional evidence is needed to prove whether CNTF-induced changes are through the mechanism that mediates light-induced photoreceptor plasticity.
Footnotes
This work was supported by National Institutes of Health Grants EY-12727 and EY-015289 (R.W.), the Karl Kirchgessner Foundation (R.W.), the Foundation Fighting Blindness (R.W.), and the intramural research program of National Institutes of Health, National Eye Institute, and National Institute on Deafness and Other Communication Disorders.
References
- Adler R, Landa KB, Manthorpe M, Varon S. Cholinergic neuronotrophic factors: intraocular distribution of trophic activity for ciliary neurons. Science. 1979;204:1434–1436. doi: 10.1126/science.451576. [DOI] [PubMed] [Google Scholar]
- Aleman TS, LaVail MM, Montemayor R, Ying G, Maguire MM, Laties AM, Jacobson SG, Cideciyan AV. Augmented rod bipolar cell function in partial receptor loss: an ERG study in P23H rhodopsin transgenic and aging normal rats. Vision Res. 2001;41:2779–2797. doi: 10.1016/s0042-6989(01)00157-2. [DOI] [PubMed] [Google Scholar]
- Arden GB, Carter RM, Hogg CR, Powell DJ, Ernst WJ, Clover GM, Lyness AL, Quinlan MP. A modified ERG technique and the results obtained in X-linked retinitis pigmentosa. Br J Ophthalmol. 1983;67:419–430. doi: 10.1136/bjo.67.7.419. [DOI] [PMC free article] [PubMed] [Google Scholar]
- Bargoot FG, Williams TP, Beidler LM. The localization of radioactive amino acid taken up into the outer segments of frog (Rana pipiens) rods. Vision Res. 1969;9:385–391. doi: 10.1016/0042-6989(69)90085-6. [DOI] [PubMed] [Google Scholar]
- Battelle BA, LaVail MM. Rhodopsin content and rod outer segment length in albino rat eyes: modification by dark adaptation. Exp Eye Res. 1978;26:487–497. doi: 10.1016/0014-4835(78)90134-3. [DOI] [PubMed] [Google Scholar]
- Baylor D. How photons start vision. Proc Natl Acad Sci USA. 1996;93:560–565. doi: 10.1073/pnas.93.2.560. [DOI] [PMC free article] [PubMed] [Google Scholar]
- Bok D, Yasumura D, Matthes MT, Ruiz A, Duncan JL, Chappelow AV, Zolutukhin S, Hauswirth W, LaVail MM. Effects of adeno-associated virus-vectored ciliary neurotrophic factor on retinal structure and function in mice with a P216L rds/peripherin mutation. Exp Eye Res. 2002;74:719–735. doi: 10.1006/exer.2002.1176. [DOI] [PubMed] [Google Scholar]
- Breton ME, Schueller AW, Lamb TD, Pugh EN., Jr Analysis of ERG a-wave amplification and kinetics in terms of the G-protein cascade of phototransduction. Invest Ophthalmol Vis Sci. 1994;35:295–309. [PubMed] [Google Scholar]
- Bush RA, Lei B, Tao W, Raz D, Chan CC, Cox TA, Santos-Muffley M, Sieving PA. Encapsulated cell-based intraocular delivery of ciliary neurotrophic factor in normal rabbit: dose-dependent effects on ERG and retinal histology. Invest Ophthalmol Vis Sci. 2004;45:2420–2430. doi: 10.1167/iovs.03-1342. [DOI] [PubMed] [Google Scholar]
- Cayouette M, Gravel C. Adenovirus-mediated gene transfer of ciliary neurotrophic factor can prevent photoreceptor degeneration in the retinal degeneration (rd) mouse. Hum Gene Ther. 1997;8:423–430. doi: 10.1089/hum.1997.8.4-423. [DOI] [PubMed] [Google Scholar]
- Cayouette M, Behn D, Sendtner M, Lachapelle P, Gravel C. Intraocular gene transfer of ciliary neurotrophic factor prevents death and increases responsiveness of rod photoreceptors in the retinal degeneration slow mouse. J Neurosci. 1998;18:9282–9293. doi: 10.1523/JNEUROSCI.18-22-09282.1998. [DOI] [PMC free article] [PubMed] [Google Scholar]
- Chong NH, Alexander RA, Waters L, Barnett KC, Bird AC, Luthert PJ. Repeated injections of a ciliary neurotrophic factor analogue leading to long-term photoreceptor survival in hereditary retinal degeneration. Invest Ophthalmol Vis Sci. 1999;40:1298–1305. [PubMed] [Google Scholar]
- Conover JC, Ip NY, Poueymirou WT, Bates B, Goldfarb MP, DeChiara TM, Yancopoulos GD. Ciliary neurotrophic factor maintains the pluripotentiality of embryonic stem cells. Development. 1993;119:559–565. doi: 10.1242/dev.119.3.559. [DOI] [PubMed] [Google Scholar]
- Ernsberger U, Sendtner M, Rohrer H. Proliferation and differentiation of embryonic chick sympathetic neurons: effects of ciliary neurotrophic factor. Neuron. 1989;2:1275–1284. doi: 10.1016/0896-6273(89)90312-7. [DOI] [PubMed] [Google Scholar]
- Ezzeddine ZD, Yang X, DeChiara T, Yancopoulos G, Cepko CL. Postmitotic cells fated to become rod photoreceptors can be respecified by CNTF treatment of the retina. Development. 1997;124:1055–1067. doi: 10.1242/dev.124.5.1055. [DOI] [PubMed] [Google Scholar]
- Farber DB, Danciger JS, Organisciak DT. Levels of mRNA encoding proteins of the cGMP cascade as a function of light environment. Exp Eye Res. 1991;53:781–786. doi: 10.1016/0014-4835(91)90114-t. [DOI] [PubMed] [Google Scholar]
- Fuhrmann S, Heller S, Rohrer H, Hofmann HD. A transient role for ciliary neurotrophic factor in chick photoreceptor development. J Neurobiol. 1998;37:672–683. doi: 10.1002/(sici)1097-4695(199812)37:4<672::aid-neu14>3.0.co;2-1. [DOI] [PubMed] [Google Scholar]
- Fulton AB, Rushton WA. The human rod ERG: correlation with psychophysical responses in light and dark adaptation. Vision Res. 1978;18:793–800. doi: 10.1016/0042-6989(78)90119-0. [DOI] [PubMed] [Google Scholar]
- Hall MO, Bok D, Bacharach AD. Biosynthesis and assembly of the rod outer segment membrane system. Formation and fate of visual pigment in the frog retina. J Mol Biol. 1969;45:397–406. doi: 10.1016/0022-2836(69)90114-4. [DOI] [PubMed] [Google Scholar]
- Helgren ME, Squinto SP, Davis HL, Parry DJ, Boulton TG, Heck CS, Zhu Y, Yancopoulos GD, Lindsay RM, DiStefano PS. Trophic effect of ciliary neurotrophic factor on denervated skeletal muscle. Cell. 1994;76:493–504. doi: 10.1016/0092-8674(94)90113-9. [DOI] [PubMed] [Google Scholar]
- Hughes SM, Lillien LE, Raff MC, Rohrer H, Sendtner M. Ciliary neurotrophic factor induces type-2 astrocyte differentiation in culture. Nature. 1988;335:70–73. doi: 10.1038/335070a0. [DOI] [PubMed] [Google Scholar]
- Ip NY, Li YP, van de Stadt I, Panayotatos N, Alderson RF, Lindsay RM. Ciliary neurotrophic factor enhances neuronal survival in embryonic rat hippocampal cultures. J Neurosci. 1991;11:3124–3134. doi: 10.1523/JNEUROSCI.11-10-03124.1991. [DOI] [PMC free article] [PubMed] [Google Scholar]
- Kirsch M, Schulz-Key S, Wiese A, Fuhrmann S, Hofmann H. Ciliary neurotrophic factor blocks rod photoreceptor differentiation from postmitotic precursor cells in vitro. Cell Tissue Res. 1998;291:207–216. doi: 10.1007/s004410050991. [DOI] [PubMed] [Google Scholar]
- Larkfors L, Lindsay RM, Alderson RF. Ciliary neurotrophic factor enhances the survival of Purkinje cells in vitro. Eur J Neurosci. 1994;6:1015–1025. doi: 10.1111/j.1460-9568.1994.tb00596.x. [DOI] [PubMed] [Google Scholar]
- LaVail MM, Unoki K, Yasumura D, Matthes MT, Yancopoulos GD, Steinberg RH. Multiple growth factors, cytokines, and neurotrophins rescue photoreceptors from the damaging effects of constant light. Proc Natl Acad Sci USA. 1992;89:11249–11253. doi: 10.1073/pnas.89.23.11249. [DOI] [PMC free article] [PubMed] [Google Scholar]
- LaVail MM, Yasumura D, Matthes MT, Lau-Villacorta C, Unoki K, Sung CH, Steinberg RH. Protection of mouse photoreceptors by survival factors in retinal degenerations. Invest Ophthalmol Vis Sci. 1998;39:592–602. [PubMed] [Google Scholar]
- Liang FQ, Dejneka NS, Cohen DR, Krasnoperova NV, Lem J, Maguire AM, Dudus L, Fisher KJ, Bennett J. AAV-mediated delivery of ciliary neurotrophic factor prolongs photoreceptor survival in the rhodopsin knockout mouse. Mol Ther. 2001a;3:241–248. doi: 10.1006/mthe.2000.0252. [DOI] [PubMed] [Google Scholar]
- Liang FQ, Aleman TS, Dejneka NS, Dudus L, Fisher KJ, Maguire AM, Jacobson SG, Bennett J. Long-term protection of retinal structure but not function using RAAV.CNTF in animal models of retinitis pigmentosa. Mol Ther. 2001b;4:461–472. doi: 10.1006/mthe.2001.0473. [DOI] [PubMed] [Google Scholar]
- Lillien LE, Sendtner M, Rohrer H, Hughes SM, Raff MC. Type-2 astrocyte development in rat brain cultures is initiated by a CNTF-like protein produced by type-1 astrocytes. Neuron. 1988;1:485–494. doi: 10.1016/0896-6273(88)90179-1. [DOI] [PubMed] [Google Scholar]
- Lin LF, Mismer D, Lile JD, Armes LG, Butler ET, III, Vannice JL, Collins F. Purification, cloning, and expression of ciliary neurotrophic factor (CNTF) Science. 1989;246:1023–1025. doi: 10.1126/science.2587985. [DOI] [PubMed] [Google Scholar]
- Louis JC, Magal E, Takayama S, Varon S. CNTF protection of oligodendrocytes against natural and tumor necrosis factor-induced death. Science. 1993;259:689–692. doi: 10.1126/science.8430320. [DOI] [PubMed] [Google Scholar]
- Masu Y, Wolf E, Holtmann B, Sendtner M, Brem G, Thoenen H. Disruption of the CNTF gene results in motor neuron degeneration. Nature. 1993;365:27–32. doi: 10.1038/365027a0. [DOI] [PubMed] [Google Scholar]
- Naarendorp F, Sato Y, Cajdric A, Hubbard NP. Absolute and relative sensitivity of the scotopic system of rat: electroretinography and behavior. Vis Neurosci. 2001;18:641–656. doi: 10.1017/s0952523801184142. [DOI] [PubMed] [Google Scholar]
- Newman EA, Odette LL. Model of electroretinogram b-wave generation: a test of the K+ hypothesis. J Neurophysiol. 1984;51:164–182. doi: 10.1152/jn.1984.51.1.164. [DOI] [PubMed] [Google Scholar]
- Organisciak DT, Noell WK. The rod outer segment phospholipid/opsin ratio of rats maintained in darkness or cyclic light. Invest Ophthalmol Vis Sci. 1977;16:188–190. [PubMed] [Google Scholar]
- Organisciak DT, Xie A, Wang HM, Jiang YL, Darrow RM, Donoso LA. Adaptive changes in visual cell transduction protein levels: effect of light. Exp Eye Res. 1991;53:773–779. doi: 10.1016/0014-4835(91)90113-s. [DOI] [PubMed] [Google Scholar]
- Penn JS, Williams TP. Photostasis: regulation of daily photon-catch by rat retinas in response to various cyclic illuminances. Exp Eye Res. 1986;43:915–928. doi: 10.1016/0014-4835(86)90070-9. [DOI] [PubMed] [Google Scholar]
- Penn RD, Hagins WA. Signal transmission along retinal rods and the origin of the electroretinographic a-wave. Nature. 1969;223:201–204. doi: 10.1038/223201a0. [DOI] [PubMed] [Google Scholar]
- Peterson WM, Wang Q, Tzekova R, Wiegand SJ. Ciliary neurotrophic factor and stress stimuli activate the Jak-STAT pathway in retinal neurons and glia. J Neurosci. 2000;20:4081–4090. doi: 10.1523/JNEUROSCI.20-11-04081.2000. [DOI] [PMC free article] [PubMed] [Google Scholar]
- Reiser MA, Williams TP, Pugh EN., Jr The effect of light history on the aspartate-isolated fast-PIII responses of the albino rat retina. Invest Ophthalmol Vis Sci. 1996;37:221–229. [PubMed] [Google Scholar]
- Robson JG, Frishman LJ. Response linearity and kinetics of the cat retina: the bipolar cell component of the dark-adapted electroretinogram. Vis Neurosci. 1995;12:837–850. doi: 10.1017/s0952523800009408. [DOI] [PubMed] [Google Scholar]
- Saadat S, Sendtner M, Rohrer H. Ciliary neurotrophic factor induces cholinergic differentiation of rat sympathetic neurons in culture. J Cell Biol. 1989;108:1807–1816. doi: 10.1083/jcb.108.5.1807. [DOI] [PMC free article] [PubMed] [Google Scholar]
- Schlichtenbrede FC, MacNeil A, Bainbridge JW, Tschernutter M, Thrasher AJ, Smith AJ, Ali RR. Intraocular gene delivery of ciliary neurotrophic factor results in significant loss of retinal function in normal mice and in the Prph2Rd2/Rd2 model of retinal degeneration. Gene Ther. 2003;10:523–527. doi: 10.1038/sj.gt.3301929. [DOI] [PubMed] [Google Scholar]
- Schulz-Key S, Hofmann HD, Beisenherz-Huss C, Barbisch C, Kirsch M. Ciliary neurotrophic factor as a transient negative regulator of rod development in rat retina. Invest Ophthalmol Vis Sci. 2002;43:3099–3108. [PubMed] [Google Scholar]
- Sendtner M, Schmalbruch H, Stockli KA, Carroll P, Kreutzberg GW, Thoenen H. Ciliary neurotrophic factor prevents degeneration of motor neurons in mouse mutant progressive motor neuronopathy. Nature. 1992;358:502–504. doi: 10.1038/358502a0. [DOI] [PubMed] [Google Scholar]
- Sieving PA, Caruso RC, Tao W, Coleman HR, Thompson DJ, Fullmer KR, Bush RA. Ciliary neurotrophic factor (CNTF) for human retinal degeneration: phase I trial of CNTF delivered by encapsulated cell intraocular implants. Proc Natl Acad Sci USA. 2006;103:3896–3901. doi: 10.1073/pnas.0600236103. [DOI] [PMC free article] [PubMed] [Google Scholar]
- Skaper SD, Montz HP, Varon S. Control of Na+, K+-pump activity in dorsal root ganglionic neurons by different neuronotrophic agents. Brain Res. 1986;386:130–135. doi: 10.1016/0006-8993(86)90149-6. [DOI] [PubMed] [Google Scholar]
- Stockli KA, Lottspeich F, Sendtner M, Masiakowski P, Carroll P, Gotz R, Lindholm D, Thoenen H. Molecular cloning, expression and regional distribution of rat ciliary neurotrophic factor. Nature. 1989;342:920–923. doi: 10.1038/342920a0. [DOI] [PubMed] [Google Scholar]
- Stockton RA, Slaughter MM. B-wave of the electroretinogram. A reflection of ON bipolar cell activity. J Gen Physiol. 1989;93:101–122. doi: 10.1085/jgp.93.1.101. [DOI] [PMC free article] [PubMed] [Google Scholar]
- Stryer L. Cyclic GMP cascade of vision. Annu Rev Neurosci. 1986;9:87–119. doi: 10.1146/annurev.ne.09.030186.000511. [DOI] [PubMed] [Google Scholar]
- Sugawara T, Sieving PA, Bush RA. Quantitative relationship of the scotopic and photopic ERG to photoreceptor cell loss in light damaged rats. Exp Eye Res. 2000;70:693–705. doi: 10.1006/exer.2000.0842. [DOI] [PubMed] [Google Scholar]
- Sung CH, Schneider BG, Agarwal N, Papermaster DS, Nathans J. Functional heterogeneity of mutant rhodopsins responsible for autosomal dominant retinitis pigmentosa. Proc Natl Acad Sci USA. 1991;88:8840–8844. doi: 10.1073/pnas.88.19.8840. [DOI] [PMC free article] [PubMed] [Google Scholar]
- Takahashi R, Yokoji H, Misawa H, Hayashi M, Hu J, Deguchi T. A null mutation in the human CNTF gene is not causally related to neurological diseases. Nat Genet. 1994;7:79–84. doi: 10.1038/ng0594-79. [DOI] [PubMed] [Google Scholar]
- Tao W, Wen R, Goddard MB, Sherman SD, O'Rourke PJ, Stabila PF, Bell WJ, Dean BJ, Kauper KA, Budz VA, Tsiaras WG, Acland GM, Pearce-Kelling S, Laties AM, Aguirre GD. Encapsulated cell-based delivery of CNTF reduces photoreceptor degeneration in animal models of retinitis pigmentosa. Invest Ophthalmol Vis Sci. 2002;43:3292–3298. [PubMed] [Google Scholar]
- Toda K, Bush RA, Humphries P, Sieving PA. The electroretinogram of the rhodopsin knockout mouse. Vis Neurosci. 1999;16:391–398. doi: 10.1017/s0952523899162187. [DOI] [PubMed] [Google Scholar]
- Varon S, Manthorpe M, Adler R. Cholinergic neuronotrophic factors. I. Survival, neurite outgrowth and choline acetyltransferase activity in monolayer cultures from chick embryo ciliary ganglia. Brain Res. 1979;173:29–45. doi: 10.1016/0006-8993(79)91093-x. [DOI] [PubMed] [Google Scholar]
- Wilden U. Duration and amplitude of the light-induced cGMP hydrolysis in vertebrate photoreceptors are regulated by multiple phosphorylation of rhodopsin and by arrestin binding. Biochemistry. 1995;34:1446–1454. doi: 10.1021/bi00004a040. [DOI] [PubMed] [Google Scholar]
- Wilden U, Hall SW, Kuhn H. Phosphodiesterase activation by photoexcited rhodopsin is quenched when rhodopsin is phosphorylated and binds the intrinsic 48-kDa protein of rod outer segments. Proc Natl Acad Sci USA. 1986;83:1174–1178. doi: 10.1073/pnas.83.5.1174. [DOI] [PMC free article] [PubMed] [Google Scholar]
- Wong V, Arriaga R, Ip NY, Lindsay RM. The neurotrophins BDNF, NT-3 and NT-4/5, but not NGF, up-regulate the cholinergic phenotype of developing motor neurons. Eur J Neurosci. 1993;5:466–474. doi: 10.1111/j.1460-9568.1993.tb00513.x. [DOI] [PubMed] [Google Scholar]
- Xu J, Dodd RL, Makino CL, Simon MI, Baylor DA, Chen J. Prolonged photoresponses in transgenic mouse rods lacking arrestin. Nature. 1997;389:505–509. doi: 10.1038/39068. [DOI] [PubMed] [Google Scholar]
- Xu X, Karwoski CJ. Current source density analysis of retinal field potentials. II. Pharmacological analysis of the b-wave and M-wave. J Neurophysiol. 1994;72:96–105. doi: 10.1152/jn.1994.72.1.96. [DOI] [PubMed] [Google Scholar]
- Yau KW. Cyclic nucleotide-gated channels: an expanding new family of ion channels. Proc Natl Acad Sci USA. 1994;91:3481–3483. doi: 10.1073/pnas.91.9.3481. [DOI] [PMC free article] [PubMed] [Google Scholar]
- Young RW. The renewal of photoreceptor cell outer segments. J Cell Biol. 1967;33:61–72. doi: 10.1083/jcb.33.1.61. [DOI] [PMC free article] [PubMed] [Google Scholar]
- Young RW, Bok D. Participation of the retinal pigment epithelium in the rod outer segment renewal process. J Cell Biol. 1969;42:392–403. doi: 10.1083/jcb.42.2.392. [DOI] [PMC free article] [PubMed] [Google Scholar]
- Young RW, Droz B. The renewal of protein in retinal rods and cones. J Cell Biol. 1968;39:169–184. doi: 10.1083/jcb.39.1.169. [DOI] [PMC free article] [PubMed] [Google Scholar]