

Abstract
Large-scale changes in luminance are known to exert a significant suppressive or masking effect on visual perception, but the neural substrate for this effect remains unclear. In this report, we describe the results of experiments using in vivo intracellular recording to explore the impact of luminance transients on the responses of orientation-selective neurons in layer 2/3 of tree shrew primary visual cortex. By measuring changes in excitatory and inhibitory conductances, we find that instantaneous changes in luminance evoke strong cortical inhibition. When combined with visual stimuli that would otherwise yield strong excitatory responses, luminance transients produce significant reductions in excitation as well as increases in inhibition. As a result, luminance transients significantly delay the emergence of orientation tuned cortical responses, and virtually eliminate ongoing responses to effective stimuli. We conclude that cortical inhibition is a critical factor in luminance-evoked cortical suppression and the likely substrate for luminance-induced visual masking phenomenon.
Keywords: visual cortex, physiology, inhibition, luminance, neural circuits, synaptic conductance
Introduction
During experience with natural scenes, the visual system is subject to rapid, large-scale changes in luminance imposed by alterations in observer position or gaze angle as well as changes in the environment itself (movement of clouds, shadows of moving objects, etc.). Such spatially uniform changes convey relatively little information about the details of the visual scene; nevertheless, when present, they exert a powerful influence on the observer's ability to perceive the features signaled by local image contrast. For example, a sudden change in mean luminance can mask the appearance of visual targets presented slightly before, at the same time, or just after the luminance transient (Crawford, 1947; Macknik and Livingstone, 1998; Breitmeyer and Ogmen, 2000; Ogmen et al., 2003). Moreover, performance on visual discrimination tasks is substantially reduced by concurrent changes in luminance (Huang et al., 2005).
The suppressive impact of luminance transients on perception accords with the impact of large-scale changes in luminance on the responses of neurons in primary visual cortex (Kayama et al., 1979; Komatsu et al., 1996; Kammer et al., 1999; Kinoshita and Komatsu, 2001; Haynes et al., 2004; Peng and Van Essen, 2005). Increments or decrements in luminance are accompanied by short latency changes in cortical activity including a prominent transient (tens to hundreds of milliseconds) suppression of neural response whose duration is consistent with the perceptual effects of luminance transients (Bridgeman, 1975; Macknik and Livingstone, 1998; Gawne and Martin, 2002; Huang and Paradiso, 2005). However, the neural substrate that mediates luminance-evoked suppression of cortical response remains unresolved. Lateral geniculate neurons generate transient responses to changes in luminance (Schiller, 1968; Sherman, 2001; Martinez-Conde et al., 2002; Denning and Reinagel, 2005), raising the possibility that cortical response suppression arises from a reduction in the activity of excitatory feedforward inputs. However, evidence that visual masking phenomena exhibit interocular transfer (a masking stimulus presented to one eye can mask the appearance of a stimulus presented to the other eye) suggests that luminance-evoked suppression may depend on intracortical circuits, perhaps reflecting the preferential recruitment of cortical inhibitory neurons (Kolers and Rosner, 1960; Schiller, 1965; Macknik and Martinez-Conde, 2004).
Here, we describe the results of experiments using in vivo intracellular recordings to explore the effect of spatially uniform luminance transients on the responses of neurons in tree shrew visual cortex. Our goal was to characterize the subthreshold response of cortical neurons to luminance change, and to determine how these uniform changes in luminance affect the response to structured visual stimuli, in particular, the response to gratings. For this reason, we focused our attention on neurons in cortical layer 2/3 that are well tuned to stimulus orientation, a tuning that arises via inputs from non-orientation-selective layer 4 neurons (Chisum et al., 2003; Mooser et al., 2004). Our results demonstrate that changes in luminance evoke strong cortical inhibition, which delays the emergence of orientation tuned responses in layer 2/3 neurons and eliminates ongoing responses to effective stimuli. We conclude that cortically derived inhibition is a critical factor in luminance-evoked cortical suppression and the likely basis for luminance-induced perceptual masking.
Materials and Methods
Tree shrew preparation.
Surgical preparations for tree shrews (Tupaia belangeri) have been described previously (Bosking et al., 1997). Briefly, adult tree shrews (4–12 months) were initially anesthetized before surgery with ketamine (200 mg/kg) and xylazine (4.7 mg/kg) by intramuscular injection and a 2:1 mixture of N2O/O2 supplemented with 1.5% halothane, delivered through a tracheostomy by artificial respiration. Procedures for intracellular recording included creating a small craniotomy (0.5–1.0 mm diameter) overlying V1, retracting dura, and performing a bilateral pneumothorax to reduce pulsations attributable to respiration. All wound margins, incisions, and pressure points were treated with lidocaine. Before recording, halothane levels were reduced to 0.75%, N2O/O2 mixture set to 1:1, and the animal was paralyzed with pancuronium bromide administered through an intraperitoneal cannula. The animal was secured in a modified stereotaxic frame, and the eyes were protected by planar contact lenses. Temperature was maintained at 38°C, expired CO2 at 3.5%, and the electrocardiogram was monitored throughout the experiment. All experimental procedures were approved by the Duke University Institutional Animal Care and Use Committee and were done in compliance with guidelines published by the National Institutes of Health.
Visual stimuli.
Visual stimuli were generated by programs written in Matlab with Psychophysics Toolbox extensions (Brainard, 1997; Pelli, 1997) on a Macintosh G4 computer, and presented at 120 Hz on a calibrated Sony (Tokyo, Japan) GDM-C520 cathode ray tube monitor, having a luminance range of 0.3–120 cd/m2. Orientation tuning curves were determined by randomly presenting equiluminant full-field static (nondrifting) square-wave gratings at 18 different orientations between 0 and 180° and fitting subthreshold responses with a Gaussian curve [y = y0 + (A/(w sqrt(π/2))) exp(−2(x − xc)2/w2)], where y0 is the baseline offset, xc is the center of the peak, A is the total area under the curve from the baseline, and w is the width (2σ). Visual stimuli were presented for 1 s at interstimulus intervals of 1 s, synchronized to the vertical refresh signal of the monitor, allowing repeated trials to be aligned with submillisecond accuracy.
Because luminance-evoked responses are generated by transitions between two visual stimuli differing in mean luminance, we used two methods to create visual stimuli containing various combinations of grating contrast and luminance. In the first method, we varied the luminance of the first stimulus (the preceding uniform field) while the second stimulus remained constant. For example, a high contrast grating (100% contrast; black bars, 0.3 cd/m2; white bars, 120 cd/m2; overall mean luminance, 60 cd/m2) preceded by a black uniform field yielded a transition with increasing luminance (e.g., see Fig. 4C), whereas the same grating preceded by a gray uniform field (60 cd/m2) gave an equiluminant transition (e.g., see Fig. 4B). In the second method, the first stimulus remained constant as we varied the luminance of the second stimulus. For example, low contrast (10%) gratings with alternating light gray (66 cd/m2) and dark gray (54 cd/m2) bars were made equiluminant to a preceding uniform gray field (see Fig. 7A). A grating with the same contrast (i.e., difference between “light” and “dark” bars was equal to 12 cd/m2) was produced with alternating white (120 cd/m2) and light gray (108 cd/m2) bars (see Fig. 7C), which gave an increasing luminance transition relative to the preceding flat gray field (from 60 to 114 cd/m2). The first method was necessary to investigate the effect of luminance on high contrast gratings, having black and white bars that used the full luminance range of the monitor (i.e., luminance step gratings). The second method was needed to present isolated transitions in contrast and luminance (i.e., delayed luminance step gratings) (see Figs. 5A, 7E). Because the majority of neurons in layer 2/3 of tree shrew have complex receptive fields (our unpublished data), after determining the preferred orientation of the neuron, we selected a single grating phase that generated a vigorous response, and used the same phase for all subsequent measurements.
Figure 4.

Changes in luminance transiently suppress grating-evoked responses. A–C, Representative responses evoked by changes in pure full-field luminance (A), high contrast equiluminant gratings (B), and high contrast gratings with a change in mean luminance relative to the preceding uniform field (C, luminance step grating) are shown for three cells (i–iii). In response to luminance step gratings (C), the first spike was preceded by a strong hyperpolarization and delayed relative to the first spike evoked by equiluminant gratings (B). Stimulus onset is coincident with the beginning of the trace. Calibration (adjacent to traces in C): 20 mV, 50 ms. The size of the luminance step is equivalent for stimuli in A and C. The square icons represent the luminance of the uniform field (left icon) and the stimulus that induced the transition in grating contrast and/or luminance (right icon). Beneath the icons, the luminance values of the stimuli are symbolically represented by line drawings (horizontal lines, flat luminance; square waves, gratings), in which the amount of vertical displacement between the two line drawings signifies the presence (A, C) or absence (B) of a luminance transition. Note that the luminance values of the light and dark bars for the equiluminant grating (B) fall equally above and below the luminance of the preceding uniform field, but for the luminance step grating, the luminance values for both light and dark bars are higher than the preceding black field. Also note that the grating stimulus is identical in B and C; the luminance step is imposed by changing the luminance of the preceding uniform field only. D, Superimposed traces showing subthreshold responses to an equiluminant high contrast grating (black trace), an equiluminant low contrast grating (light gray trace), and a high contrast grating with a change in mean luminance relative to the preceding uniform field (dark gray trace). Note that the onset latency of response for the high contrast grating and luminance step grating are virtually coincident, but the peak response evoked by the luminance step grating occurs at a later time than either the high or low contrast equiluminant gratings because of the presence of the luminance-evoked hyperpolarization. E, The latency to peak is significantly longer for responses evoked by luminance step gratings than those for equiluminant gratings. Population statistics for onset latency to peak response for high contrast equiluminant gratings (black squares), low contrast equiluminant gratings (light gray triangles), and high contrast gratings with higher mean luminance than the preceding uniform field (dark gray circles). The peak was quantified by measuring the time at which the response reached 90% of the maximum amplitude. F, Conductance measurements obtained in response to presentation of a grating with a change in mean luminance relative to the preceding uniform field for two cells (i, ii). Conventions are the same as in Figure 2C. Luminance step gratings generated multiphasic changes in membrane potential before depolarizing to the peak response (top row). The multiphasic waveforms were correlated with rapid increases in inhibitory conductance but not excitatory conductance. Subsequently, both excitatory and inhibitory conductances increased to a peak corresponding to the peak in Vmem. The traces shown in the top row have membrane potentials slightly below rest, near chloride reversal potential, because of negative current injection, a value at which the luminance-evoked hyperpolarization is less visible. G, Synaptic conductances evoked by luminance step gratings differ substantially from those evoked by equiluminant gratings. To facilitate comparison, traces of excitatory (top panel) and inhibitory (bottom panel) synaptic conductances are overlaid for responses evoked by equiluminant (gray trace) and luminance step gratings (black trace) in the same cell (traces previously shown in Figs. 3Ci and 5Fi). The initial response to the luminance step grating is an increase in inhibitory conductance but not excitatory conductance, whereas the equiluminant grating evokes simultaneous increases in both excitation and inhibition. Note that the change in luminance prevents the large, rapid increase in grating-evoked excitation and inhibition.
Figure 7.
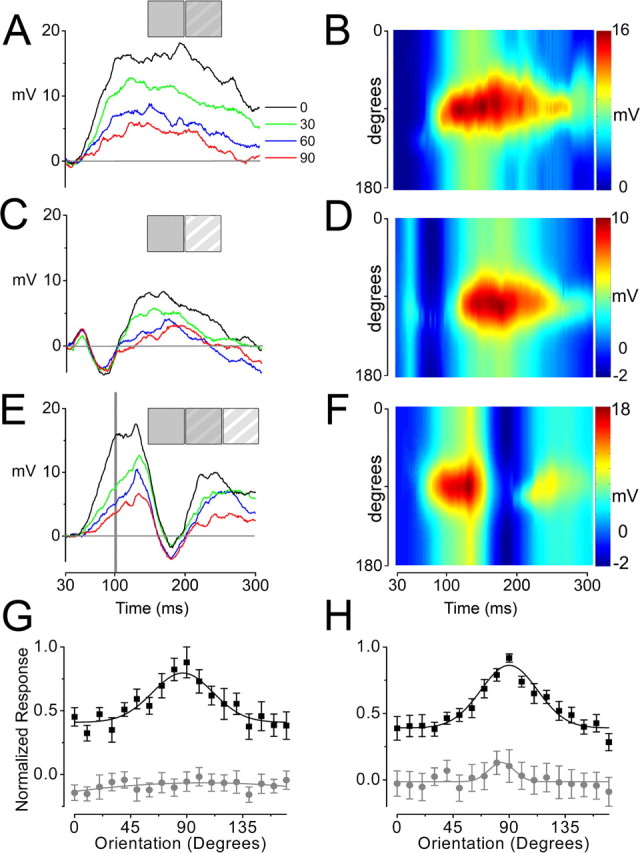
Changes in luminance delay the emergence of orientation selectivity and suppress ongoing responses. A, C, E, Intracellular recordings of subthreshold membrane potential responses from the same cell evoked by equiluminant gratings (A), gratings with a change in luminance relative to the preceding uniform gray field (C), equiluminant gratings that were followed by a change in mean luminance after a delay of 100 ms (E). Responses to four different orientations are superimposed and color-coded, as indicated by the legend in A (right). The stimuli are depicted by icons at the top of each panel, including the preceding uniform gray field (left square), a grating presented at time 0 (second square), and a grating presented at 100 ms (E, third square). All gratings were stationary with 10% contrast. Membrane potentials are relative to resting potential. B, D, F, Surface plots showing time course of orientation tuning preference. Intracellular responses were obtained for 18 orientation gratings in 10° intervals and fit by a Gaussian function at every millisecond during the response time course. Pseudocolor scale is shown at right for each panel. A, B, Equiluminant gratings evoked a short-latency, sustained response in which orientation selectivity was evident shortly after the onset of response. C, D, In comparison, gratings with higher mean luminance than the preceding uniform field generated a rapid depolarization followed by a strong hyperpolarization, delaying the emergence of orientation selectivity by ∼70 ms. E, F, Equiluminant gratings yielded strong depolarizing responses that were virtually abolished by a sudden increase in mean luminance delivered at 100 ms. Subsequently, the orientation tuned response had mostly recovered after ∼100 ms. G, Population statistics for orientation tuning curves determined from responses to equiluminant gratings (black squares) and luminance step gratings (gray circles) near the negative-most point in the response to the luminance step grating (∼50–100 ms after onset of stimulus). All responses were normalized to response evoked by the preferred orientation of the equiluminant grating at the designated time point. Each set of points was fitted by a Gaussian function. Note that the orientation tuning curve for the luminance step grating is both flat and negative-valued at this time point, demonstrating the delayed emergence of orientation-specific responses. Error bars indicate SEM. H, Following conventions from G, population statistics are shown for orientation tuning curves determined from responses to equiluminant gratings (black squares) and delayed luminance step gratings (gray circles) near the negative-most point in the response to the delayed luminance step grating (∼150–200 ms after stimulus presentation). Note that, although the normalized response to gratings is dramatically reduced after the change in luminance (gray circles), the small Gaussian-shaped hump around 90° indicates that responses to preferred orientations are still slightly greater than those to other orientations.
Figure 5.

Changes in luminance transiently suppress ongoing synaptic activity evoked by equiluminant gratings. A, Conductance measurements obtained in response to presentation of an equiluminant low contrast grating followed by a change in mean luminance after a delay of 120 ms for two cells (i, ii). Conventions are the same as in Figure 2C. Responses to the delayed luminance step grating (black trace) and the corresponding low contrast equiluminant grating (gray trace) are overlaid in the top row. Immediately after the presentation of the low contrast grating, neurons generated depolarizing responses attributable to moderate increases in excitatory conductance (fourth row). During the ongoing response, a grating with the same contrast but higher mean luminance was presented ∼120 ms after the initial grating (vertical dotted line). This sudden increase in mean luminance effectively shut off the ongoing excitatory conductance (fourth row) and simultaneously generated a large spike in inhibitory conductance (bottom row). These responses indicate that grating-evoked excitation was abolished by a large increase in synaptic inhibition generated by the presentation of a delayed luminance step. The square icons represent the preceding uniform field (left icon), the low contrast equiluminant grating presented at time zero (middle icon), and the luminance step grating presented at the indicated time (right icon), remaining until the end of the trial that lasted 1 s. Note that, although the luminance step grating is present for several hundred milliseconds, the response recovers from hyperpolarization within ∼100 ms. (Cell i in Fig. 5 is the same cell as in Fig. 1C; cell ii in Fig. 5 is the same as ii in Fig. 3). B–E, Population statistics for changes in synaptic conductances after changes in pure luminance (B), equiluminant transitions (C), luminance step gratings (D), and delayed luminance step gratings (E). For each cell, percentage changes in synaptic conductances were determined by dividing changes in excitatory and inhibitory conductances (ΔGexc and ΔGinh) by the total resting conductance (Gtotal) before stimulus onset. The pair of data points from each cell are connected by a straight line, and the population mean and SD are juxtaposed. B, For responses to pure luminance transitions, changes in synaptic conductances were assessed at the time of the negative-most value in luminance-evoked hyperpolarization (n = 11 neurons). C, For responses to equiluminant transitions, changes in synaptic conductances were measured at the time of the peak depolarization (n = 10). D, Responses to luminance step gratings were assessed at the time of the negative-going peak of the hyperpolarization (n = 3). E, For delayed luminance step gratings, synaptic conductances were assessed at the time of the minimal value in membrane potential after the change in luminance (n = 3).
Intracellular recordings.
Intracellular recordings followed standard methods. Sharp electrodes (80–130 MΩ) were fabricated using borosilicate capillary glass tubing (World Precision Instruments, Sarasota, FL) and an electrode puller (Sutter Instrument, Novato, CA). For standard (nonconductance) recordings, electrodes were filled with 2 m potassium acetate. For conductance recordings, electrodes were filled with 2 m cesium acetate and 50 mm lidocaine N-ethyl bromide (QX-314) (Calbiochem, La Jolla, CA) to block intrinsic sodium and potassium conductances, permitting recordings to be obtained during large positive current injections, uncontaminated by action potentials and other voltage-gated conductances. The effect of these ion-channel blockers was typically evident several minutes after impalement, because action potentials initially broadened and then disappeared. In a few cases (e.g., see Figs. 4Fii, 5Aii), data used in conductance calculations were obtained before blockade was complete, and where necessary, action potentials were clipped and filtered before analysis.
Electrodes were stabilized by applying 4% agar to the craniotomy, reducing brain pulsations caused by heartbeat and respiration, and advanced by hydraulic and mechanical micromanipulators (Soma Scientific, Irvine, CA). Recordings were targeted to neurons in superficial layers of cortex, having estimated depths of 0.2–0.8 mm below the pial surface. Intracellular recordings were obtained in current-clamp (bridge) mode on an Axoclamp-1D (Molecular Devices, Union City, CA), filtered at 3 kHz, and digitized at 10 kHz with a CED Power 1401 (Cambridge Electronic Design, Cambridge, UK) connected to a personal computer running Spike2 software. After obtaining a stable recording, small current steps were delivered to facilitate bridge balance and capacitance neutralization, and these settings were rechecked every few minutes to verify stability of recordings, which were commonly maintained for 30–120 min. The time constants of electrodes were typically an order of magnitude faster than that of cells, allowing precise compensation of electrode resistance both before and after impalement. Neurons selected for analysis had stable resting potentials below −65 mV, action potentials >50 mV above threshold, and input resistances >50 MΩ. All were identified as regular-spiking neurons, exhibiting spike-frequency adaptation, lack of intrinsic bursts, and broad action potentials (full-width at half-maximum, >0.6 ms).
Conductance calculations.
Synaptic conductances were determined by a previously published method (Hirsch et al., 1998; Anderson et al., 2000). Recordings were obtained at three to five different levels of current injection between −0.4 and +0.8 nA, maintaining the membrane potential at various levels between −120 and +20 mV, and up to 20 trials were acquired at each setting.
The resting input conductance (Grest) of the neuron was determined by the following equation: V = V0 + Iinj/Grest, where V is the membrane potential, Iinj is the injected current, and V0 is the resting membrane potential in the absence of current injection. Similarly, the total conductance of the neuron, Gtotal(t), was determined for the entire time course of response by the formula V(t) = Vvisual(t) + Iinj/Gtotal(t), where V(t) is the time-varying stimulus-evoked membrane potential response at the associated level of current injection, and Vvisual(t) is the excursion in membrane potential for the stimulus-evoked synaptic response in the absence of injected current (Iinj = 0). To determine how excitatory and inhibitory conductances [Gexc(t) and Ginh(t)] contribute to the total conductance, we assume that the total conductance can be attributed to three independent factors according to the following formula:
The impact that each of these conductances exerts on the membrane potential depends on its reversal potential and the total conductance according to the following formula:
Although inhibitory currents are normally carried by both chloride and potassium, in our experiments potassium channels are blocked by intracellular cesium, so we assume that all inhibitory currents are carried by chloride through GABAergic channels with a reversal potential of −75 mV (Vi), and all excitatory currents are carried by glutamate-mediated nonselective cation channels having a reversal potential of 0 mV (Ve). Equations 1 and 2 provide two equations with two unknowns (Gexc and Ginh) which are solved at each point in time by simple linear methods using custom Matlab programs. All values are reported as the mean ± 1 SD.
Results
Subthreshold response of cortical neurons to large-scale changes in luminance
Our initial step in investigating the effect of changes in luminance on cortical neuronal circuits was to characterize the subthreshold responses of layer 2/3 neurons to full screen (73 × 55°, width by height) changes in luminance. Changes in luminance evoked multiphasic responses, typically consisting of a weak, short latency depolarization followed by a strong hyperpolarization lasting up to several hundred milliseconds (Fig. 1). For approximately one-half of the sample (n = 18), equivalent responses were found for luminance increments and decrements (Fig. 1A,B). For the remainder of the population, responses to increments and decrements were distinct, either because the shape of the multiphasic response was substantially different (Fig. 1C), or because response to one sign of luminance change was hyperpolarizing, whereas the response to the other was depolarizing (Fig. 1D) (n = 15). Despite these differences, a strong hyperpolarizing response to luminance steps was present in all of the cells in our sample.
Figure 1.

Intracellular responses to instantaneous changes in full-field mean luminance. A–D, Subthreshold responses of four neurons to stepwise decreases and increases in luminance. A, B, Two neurons with symmetrical responses to changes in luminance. Responses are similar for equally sized luminance steps regardless of positive or negative luminance trajectory, indicating that these neurons are sensitive to the magnitude but not direction of the luminance step. C, D, Two neurons with asymmetrical responses, exhibiting substantially different waveforms to increases and decreases in luminance. All responses are relative to the resting membrane potential indicated by thin flat line overlaying response. Calibration: 5 mV, 100 ms. Mean luminance was varied stepwise from a uniform gray field (60 cd/m2; 50% gray) by amounts ranging from −37.5 to +37.5% relative to the full luminance range of the monitor (minimum: 0.3 cd/m2, 0%; maximum: 120 cd/m2, 100%). The size of the luminance step and time of stimulus onset are graphically represented at top along with pairs of icons symbolizing visual stimuli: the first icon represents the uniform gray field, which preceded a uniform field with higher or lower mean luminance, represented by the second icon. After the transition, the luminance remained constant for 1 full second (longer than the duration of the intracellular trace). E, Population average showing systematic relationship between normalized absolute value of the magnitude of the hyperpolarization and size of luminance step. For each cell, the most negative value in membrane potential for each luminance-driven response was normalized to the maximum hyperpolarization within the luminance series. Error bars indicate SEM. F, Superimposed traces for four stimulus conditions (luminance steps: 10, 20, 50, and 100% from a preceding uniform black field, 0%) showing systematic relationship between luminance change and onset latency.
Both the amplitude and duration of the hyperpolarization were correlated with the magnitude of the luminance step: larger luminance steps (either increments or decrements) produced larger and longer hyperpolarizing responses (Fig. 1A–D). To examine this relationship across the population, we normalized the negative peak of each response to the largest hyperpolarization within the series of luminance steps for each cell (Fig. 1E). The resulting curve shows that the amplitude of the hyperpolarizing responses grows progressively with the magnitude of luminance change. The onset latency of the luminance response varied with the magnitude of the luminance step (Fig. 1F), occurring 16 ± 8 ms earlier for the large versus small steps (100% luminance step, 23 ± 4 ms; 10%, 39 ± 13 ms). Although the initial brief depolarization was a common feature of the luminance-evoked response, the cell-to-cell variability in its amplitude made it difficult to draw strong conclusions regarding its relationship to the magnitude of the luminance change.
Luminance-evoked hyperpolarization reflects an increase in inhibition
To determine the contribution of various sources of synaptic excitation and inhibition to luminance-driven cortical responses, we used electrodes filled with a solution containing QX-314 and cesium to block both voltage-gated sodium and potassium channels, and varied the membrane potential between −120 and +20 mV by injecting current through the electrode, altering the driving forces on synaptic currents. At rest, luminance-evoked changes in membrane potential are dominated by excitatory synaptic events, because the membrane potential is far from the reversal potential for cationic currents gated by glutamate receptors and near the reversal potentials for chloride- and potassium-mediated inhibition. Conversely, when the cell is depolarized near zero millivolts, luminance-evoked changes in membrane potential are dominated by inhibitory synaptic events.
Luminance-evoked hyperpolarizations were observed to be relatively small near the resting membrane potential, but their magnitude grew substantially larger as the membrane potential was progressively depolarized toward zero millivolts, yielding amplitudes commonly fivefold greater than those at rest (Fig. 2A). Linear fits to response amplitudes from each cell showed average reversal potentials of −85 ± 6 mV (n = 11) (Fig. 2B), a value consistent with the reversal potentials for inhibitory synaptic currents. This suggests that the hyperpolarizing responses evoked by changes in luminance are dominated by increases in inhibition with little or no contribution of changes in excitation.
Figure 2.

Luminance-driven hyperpolarization is mediated by large increases in synaptic inhibition. A, Effect of varying membrane potential on amplitude of luminance-evoked hyperpolarization. As the membrane potential was depolarized by continuous injection of positive current through the intracellular electrode, the magnitude of the luminance-driven hyperpolarization progressively increased, becoming five times greater at +10 mV (+600 pA; right) than at rest (0 pA injection; left). The stimulus was a transition from a gray to white uniform field, sustained for 1 s. B, Calculation of reversal potential for luminance-evoked hyperpolarization. By varying the amount of current injection, hyperpolarizations were recorded at multiple membrane potentials to assess the approximate potential at which the driving force on the luminance-evoked response was nullified. Because the magnitudes of hyperpolarization differed between cells, the set of responses for each cell was normalized to the response evoked at zero millivolts. (In many cases, this value was extrapolated by fitting the set of points to a linear function.) This graph contains two or three representative points (postnormalization) from each cell, the set of which were fit by a straight line (n = 11 layer 2/3 neurons). The y-intercept, −85 ± 6 mV, indicates the population average reversal potential of the luminance-evoked hyperpolarization. C, Effect of changes in luminance on synaptic conductances for three neurons (i–iii). The top row shows intracellular responses obtained at the resting membrane potential after a transition in mean luminance from black to white (100% luminance step). Additional responses (data not shown) were recorded at multiple levels of current injection to calculate changes in synaptic conductances. Luminance-evoked hyperpolarizations (top row) were correlated with large increases in total conductance (Gtotal; second row) that were almost entirely attributable to changes in inhibitory conductance (ΔGinh; bottom row), as excitatory conductance decreased only slightly (ΔGexc; third row). The quality of conductance values were verified by calculating theoretical responses based on these parameters (gray line overlaying membrane potential; top row). In most cases, the calculated trace was virtually indistinguishable from the true response, indicating that the conductance parameters accurately represent the luminance-evoked changes in synaptic activity.
From these data, we were able to obtain a more quantitative assessment of the synaptic components of luminance-driven responses by calculating the relative changes in excitatory and inhibitory conductances (Fig. 2C). Conductance calculations revealed that luminance changes cause a large increase in the total conductance of the cell, which is almost entirely attributable to increases in inhibition. After changes in luminance, the excitatory conductance was either unchanged or slightly diminished throughout the response, although in some cases there was a small, brief increase in excitatory conductance that occurred very early in the response at the same point in time as the short latency depolarization, mentioned previously. During the negative-most aspect of the hyperpolarization, inhibitory conductance, ΔGinh, increased 33 ± 10% and excitatory conductance, ΔGexc, decreased −5 ± 4%, relative to the total conductance of the neuron, Gtotal, at rest (n = 11) (see Fig. 5B).
Luminance transitions evoke a transient hyperpolarization that is not found with equiluminant transitions
The strong net inhibitory response of layer 2/3 neurons to a change in luminance was not observed when stimulus transitions were equated for average luminance. This point is illustrated in Figure 3, where the response of individual cortical neurons to a luminance step is compared with their response to a square wave grating of the preferred orientation, whose mean luminance was equivalent to that of the preceding uniform field stimulus (equiluminant transition; mean luminance of both grating and preceding uniform field, 50% gray). As described above, luminance steps consistently evoked strong transient hyperpolarizing responses (Fig. 3A), but this was never observed for equiluminant transitions, regardless of the contrast of the grating (n = 15) (Fig. 3B). Instead, equiluminant gratings of the preferred orientation always evoked net depolarizing responses whose magnitude and rise time varied systematically with contrast.
Figure 3.

Responses evoked by changes in luminance are not mimicked by responses to gratings. A, B, Intracellular responses to changes in full-field luminance and equiluminant gratings for three neurons (i–iii). Although changes in full-field luminance produced biphasic or multiphasic responses including a strong hyperpolarization (A), preferred orientation gratings evoked depolarizations that increased monotonically to a peak in membrane potential before decaying steadily toward baseline (B). Although the time course and amplitude of responses varied for high (100%; black trace), intermediate (10–20%; gray trace), and low (7–10%; light gray trace) contrast gratings, equiluminant gratings with preferred orientations did not evoke hyperpolarization at any contrast, indicating that multiphasic signatures are not caused by salient visual stimuli, but rather they are specific to changes in luminance. C, Conductance measurements obtained in response to presentation of equiluminant high contrast gratings for three cells (i–iii). Conventions are the same as in Figure 2C. High-contrast preferred-orientation gratings evoked strong depolarizations from rest (top row, i and ii) and strong hyperpolarizations from membrane potentials ∼0 mV (top row, iii), sustained by continuous injections of positive current. These responses revealed large increases in total conductance (second row), in which both excitatory and inhibitory conductances exhibited large, sustained increases, having similar time courses (third and fourth rows).
Conductance calculations for high contrast equiluminant transitions revealed rapid, simultaneous increases in both inhibitory and excitatory conductances (Fig. 3C), consistent with observations from intracellular recordings in visual cortex of the cat (Ferster, 1986; Hirsch et al., 1998; Anderson et al., 2000; Monier et al., 2003). To compare the results across the population of cells, conductances were quantified by measuring their value at the peak of the depolarization, where both excitatory and inhibitory conductances increased by about one-third (ΔGexc, 34 ± 10%; ΔGinh, 37 ± 4%; n = 10) over the initial level of the resting total conductance, Gtotal (see Fig. 5C). Thus, the major difference in synaptic inputs between equiluminant and luminance step transitions lies in excitatory conductance changes: both stimulus conditions yield an increase in inhibitory conductances, but only equiluminant conditions result in significant increases in excitatory conductances (compare with Fig. 2C).
Luminance transients veto the response of layer 2/3 neurons by evoking strong reductions in excitatory inputs as well as increases in inhibition
What accounts for the failure of luminance transitions to evoke increases in excitatory conductances like that seen with equiluminant transitions? A parsimonious explanation would be that luminance increments evoke inhibition in layer 2/3 neurons and in the cortical neurons that supply their excitatory inputs. Indeed, the weak depolarizing response to luminance change that frequently precedes the strong hyperpolarizing response in layer 2/3 neurons is consistent with luminance evoked inhibition of cortical excitation. However, stronger support for this interpretation comes from an analysis of the impact of luminance change on the response of layer 2/3 neurons to a stimulus that, presented in isolation, produces a robust increase in excitatory drive.
Figure 4 compares in the same neuron, responses generated by luminance steps, equiluminant gratings, and luminance step gratings, a high contrast grating of the preferred orientation preceded by a uniform field stimulus having a substantially different mean luminance (higher or lower) than the grating. When a luminance step was combined with the presentation of a grating stimulus, the initial response was remarkably similar in appearance to that produced by presentation of an equivalent luminance step alone (Fig. 4, compare A, C). The small depolarization and subsequent hyperpolarization that were prominent features of the response to isolated luminance steps were clearly evident in the initial response to luminance step gratings. As a result, the first spike produced by the luminance step grating was significantly delayed relative to that evoked by equiluminant gratings (average delay, 75 ± 20 ms; equiluminant grating, 47 ± 6 ms; luminance step grating, 122 ± 59 ms; p < 0.01, paired t test; n = 7). Consistent with this result, the peak depolarization evoked by luminance step gratings was also significantly delayed, relative to those evoked by both high and low contrast equiluminant gratings, and preceded by a prominent hyperpolarization (Fig. 4D,E) (luminance step grating, 117 ± 15 ms; high contrast equiluminant grating, 56 ± 11 ms; p < 0.001; low contrast equiluminant grating, 94 ± 23 ms; p < 0.02, independent t test; n = 15; peak measured at 90% of maximal amplitude).
The depolarizations evoked by luminance step gratings frequently exhibited different peak amplitudes than those evoked by equiluminant gratings. In some cases, the peak response to the luminance step grating was greater than that of the equiluminant grating (Fig. 4D), whereas in other cases it was less (see Fig. 7A,C). These differences were correlated with the response of the cell to pure luminance change: luminance step gratings evoked diminished responses in cells having solely hyperpolarizing responses to changes in pure luminance (Fig. 1B), but they generated augmented responses in cells exhibiting secondary (rebound) depolarization (Fig. 1A,C,D). Averaging across the cells in our sample, the difference in peak depolarization to equiluminant and luminance step conditions was not significant (luminance step, 9 ± 4 mV; equiluminant, 14 ± 6 mV; p < 0.13, independent t test; n = 15).
These results indicate that luminance transitions exert a powerful suppressive effect on the excitatory drive to layer 2/3 neurons, an effect that is confirmed by conductance calculations (Fig. 4F). The total change in conductance induced by the luminance step grating consists of two stages that are distinguished by different contributions of excitatory and inhibitory conductances. The initial increase in total conductance that follows the presentation of a luminance step grating is almost entirely attributable to an increase in inhibitory conductance. This is followed by a second increase in total conductance that involves an increase in both excitatory and inhibitory conductance. Thus, in terms of the relative contribution of excitatory and inhibitory conductance changes, the initial response to the luminance step gratings resembles the response to isolated changes in luminance, and lacks the strong increase in excitatory conductance that is found with equiluminant grating transitions (Fig. 4G). Note also that the initial change in inhibitory conductance evoked by the luminance step grating is less than that evoked by an equiluminant grating. Thus, luminance steps appear to veto the full complement of synaptic inputs that are conveyed to layer 2/3 neurons after the presentation of an equiluminant grating, perhaps as a consequence of blocking excitatory drive at an early site in the cortical circuit. In the three cells for which conductance calculations could be made, inhibitory conductance at the initial peak increased 17 ± 6% without a change in excitatory conductance (ΔGexc = 3 ± 2%) relative to the resting total conductance (Fig. 5D).
Changes in luminance actively suppress ongoing grating-evoked cortical excitation
Although the onset of the luminance step and the grating were simultaneous, the response to this stimulus appears as two distinct components, an early component that has the conductance profile associated with isolated changes in luminance and a later component that exhibits the properties of an equiluminant grating response. This raises the possibility that the strong impact of the luminance step on the cortical response to a grating stimulus may depend at least in part on the fact that luminance-driven inhibition of cortical circuits arrives early, before the high levels of synaptic activity generated by a grating stimulus can be recruited. If privileged temporal access to cortex is a major factor in the luminance veto of the grating response, then the impact of luminance-evoked suppression should be significantly reduced by delaying the onset of the luminance step, allowing cortical circuits time to build a strong grating-evoked response.
To test this possibility, we delayed the presentation of luminance steps such that they would occur at the peak of grating-evoked responses (delayed luminance step grating stimuli). Namely, equiluminant gratings were preceded by a uniform gray field, and ∼100 ms later, near the peak depolarization, the visual stimulus was changed to a grating with the same orientation and contrast but having a higher (or lower) mean luminance. In these recordings, after the transition to the luminance step grating, the ongoing grating-evoked depolarization was abolished for tens to hundreds of milliseconds as the membrane potential transiently hyperpolarized beneath the resting potential, creating a prominent notch (Fig. 5A). Conductance calculations for delayed luminance step gratings revealed that, after the luminance transition, inhibitory conductance rose sharply by 33 ± 18% and excitatory conductance fell abruptly by −14 ± 10% relative to the total conductance (n = 3) (Fig. 5E). These results emphasize that changes in luminance exert a powerful veto on the response of cortical circuits regardless of their ongoing level of activity, and do so via complementary changes in excitatory and inhibitory conductances.
Lateral geniculate neurons generate sustained responses to changes in luminance
The complementary changes in inhibition and excitation recorded in individual layer 2/3 neurons are consistent with a mechanism in which luminance steps drive increases in the activity of cortical inhibitory neurons that, in turn, silence the activity of cortical excitatory neurons. Such a mechanism requires that luminance steps evoke an increase in the activity of thalamic inputs supplying excitatory drive to cortical inhibitory neurons that is of sufficient duration to account for the time course of cortical suppression. To determine whether large-scale luminance steps are accompanied by strong and sustained increases in the activity of lateral geniculate (LGN) neurons, extracellular recordings were used to evaluate the responses of on- and off-center neurons in the LGN to sign-appropriate changes in luminance. In response to full-field changes in luminance, geniculate neurons generated robust responses lasting up to several seconds (n = 4 on-center; n = 2 off-center). The initial response was a high frequency burst followed by sustained spiking that decayed slowly to the spontaneous firing rate (Fig. 6A,B). The transient and sustained components were quantified in the normalized and averaged population response, which was best fit by a double exponential function having fast (τ1 = 65 ms) and slow (τ2 = 3.6 s) time constants (n = 6) (Fig. 6C,D). These results indicate that LGN neurons maintain strong excitatory drive to cortical circuits throughout the time course of the luminance-evoked suppression of cortical response.
Figure 6.

Changes in luminance generate robust responses for neurons in the lateral geniculate nucleus. A, B, Peristimulus time histogram of extracellularly recorded spike discharge from an on-center LGN neuron after changes in luminance (a transition from gray to white uniform field). In this representative neuron, changes in luminance evoked a large transient response lasting up to 1 s followed by a sustained response over 4 s (average of 6 trials; bin size, 50 ms; horizontal dotted line represents spontaneous activity level). B, Expanded time scale of data in A showing that the luminance-evoked increase in spike discharge remains significantly above baseline activity levels for >500 ms. Note that, during this time interval, intracellular recordings in layer 2/3 cortical neurons would reveal large hyperpolarizing responses. C, D, Peristimulus time histogram of luminance-evoked spike discharge rate for a population of six extracellularly recorded LGN neurons (4 on-center and 2 off-center). Expanded timescale is shown in D. Responses from each neuron were normalized to the peak spike discharge rate before averaging. The initial burst decayed rapidly over 200 ms to a more sustained level that declined to baseline over the next several seconds. The normalized peristimulus time histogram was fit by a double exponential function.
The impact of luminance steps on orientation tuned responses
The previous results show that changes in luminance suppress responses driven by gratings at the preferred orientation (Figs. 4, 5), but they do not address how luminance steps impact the operation of cortical circuits that are responsible for generating orientation-selective responses. Here, we quantify the impact of luminance steps on orientation tuning functions by presenting a full range of orientations (0–180°) for both equiluminant, luminance step, and delayed luminance step gratings.
After equiluminant grating presentations, orientation selectivity was evident from response onset, because each grating orientation evoked a distinct trajectory of depolarization, causing responses to diverge from their earliest time points (Fig. 7A,B). In contrast, the initial responses to luminance step gratings were virtually identical for all orientations, yielding overlapping multiphasic waveforms during the first several tens of milliseconds of response (n = 7) (Fig. 7C,D). To quantify the initial differences in the orientation tuning for equiluminant and luminance-evoked responses in our sample population, we selected the time of the negative peak of the hyperpolarization (79 ± 12 ms) to fit responses to Gaussian functions and quantify parameters of orientation tuning (Fig. 7G). At this time, responses to equiluminant gratings were well tuned (width, 48 ± 10°; offset, 0.4 ± 0.1 units; area, 24 ± 6 unit-degrees; n = 7), but those evoked by luminance step gratings were virtually flat, exhibiting no significant orientation preference and an offset below baseline attributable to the hyperpolarization (offset, −0.08 ± 0.04 units). In some cases (four of seven cells), the response to the preferred orientation was slightly greater than that evoked by other orientations during the luminance-evoked hyperpolarization (Fig. 7C); however, this trend was not consistent across the population.
Although orientation tuning was virtually absent throughout the luminance-evoked hyperpolarization, it developed rapidly as responses depolarized, eventually becoming comparable with that evoked by equiluminant gratings. At the time of the peak depolarization (t = 122 ± 25 ms), responses evoked by luminance step gratings were well tuned for orientation (width, 51 ± 12°; area, 23 ± 7 unit-degrees; offset, 0.34 ± 0.04 units), values that were similar to those for equiluminant responses at their peak (t = 64 ± 22 ms; width, 45 ± 5°; area, 27 ± 4 unit-degrees; offset, 0.4 ± 0.03 units). Thus, despite potent suppression evoked by changes in luminance, orientation-selective responses recover completely within 43 ± 15 ms after the negative peak of the hyperpolarization.
The rapid recovery of orientation tuning after luminance steps was also evident in the response to the delayed luminance step stimulus (Fig. 7E,F). At the negative peak of the hyperpolarization after the onset of the luminance step, responses to all orientations were grouped closely together and differed by only a few millivolts, indicating a profound impact on orientation tuning. At the negative peak of the hyperpolarization, the preferred orientation of the Gaussian fit was relatively unchanged from that of equiluminant responses, but the area was markedly reduced, the tuning width was substantially narrower, and the offset was negative because of the hyperpolarization (Fig. 7H) (delayed luminance step: width, 20 ± 8°; area, 4 ± 2 unit-degrees; offset, −0.01 ± 0.01 units; equiluminant: width, 45 ± 5°, area, 27 ± 4 unit-degrees; offset, 0.4 ± 0.03 units). From the negative hyperpolarizing peak, responses reversed course and depolarized rapidly to a second peak 32 ± 12 ms later. At this time, orientation tuning was mostly restored and virtually identical to the equiluminant values at the same time point (width, 45 ± 8°; offset, 0.44 ± 0.03 units; area, 21 ± 4 unit-degrees).
Discussion
These results demonstrate that large-scale changes in luminance evoke brief but powerful suppression that dominates layer 2/3 neuron response to concurrent visual stimulation. In the sections below, we consider the evidence that this response derives from the activation of cortical inhibitory neurons, speculate on the circuitry that mediates this response, and relate these observations to visual masking and related psychophysical phenomenon.
Luminance-evoked suppression is a product of cortically derived inhibition
The suppressive effects of luminance change reported here are consistent with previous studies using extracellular recordings in which it was shown that changes in luminance, although generally ineffective in driving cortical response, could reduce the discharge rate of cortical neurons to effective stimuli (Bridgeman, 1975; Kayama et al., 1979; Kretz et al., 1986; Macknik and Livingstone, 1998; Gawne and Martin, 2000, 2002; Huang and Paradiso, 2005; Peng and Van Essen, 2005). Although extracellular recordings provide a clear picture of the impact of luminance on spike discharge rate, they provide little insight into the excitatory and inhibitory events that mediate this suppression. By using intracellular recordings in layer 2/3, we were able to explore the response of cortical neurons to luminance change in the absence of additional stimuli, and these results demonstrate strong increases in total conductance that are almost entirely accounted for by increases in inhibitory conductance. Moreover, because inputs from the LGN are strictly excitatory, this observation rules out the possibility that luminance-evoked suppression is a subcortical phenomena (i.e., the luminance signal must be conveyed to cortical circuits as an increase in LGN activity to drive inhibitory cortical neurons).
Indeed, extracellular recordings in the LGN revealed that changes in luminance generate robust responses that persist throughout the time course of hyperpolarization in layer 2/3 (Fig. 6). These data are consistent with previous results showing that stimulation by diffuse light generates long-lasting responses in the LGN (Hubel, 1960; Hubel and Wiesel, 1961; Jacobs and Yolton, 1970; Mukhametov and Rizzolatti, 1970; Marrocco, 1972; Kayama et al., 1979; Valberg et al., 1985), sometimes preceded by transient, high frequency bursts (Sherman, 2001). Although changes in luminance generally produce weaker responses in the LGN than those evoked by gratings or stimulation of the receptive field center alone (Hubel and Wiesel, 1961), LGN activity does not decline below spontaneous levels after luminance steps, indicating that luminance-evoked cortical hyperpolarization is not attributable to a transient removal of feedforward excitation.
Luminance-evoked suppression in layer 2/3 neurons involves both increased inhibition and decreased excitation: circuit implications
Although inhibition is the predominant response of layer 2/3 neurons to luminance steps in isolation, when combined with stimuli that would otherwise yield strong excitatory drive, luminance steps evoke significant changes in both excitation and inhibition. This can be appreciated by comparing the response to equiluminant gratings, which evoked large increases in excitation (Fig. 3C), and the response to luminance step gratings, which did not (Fig. 4F). An even more dramatic illustration is the sharp reduction in excitatory conductance produced by a luminance step presented during the ongoing response to an effective stimulus (Fig. 5A). Under these conditions, the powerful suppressive effect of luminance change is mediated by complementary changes in both excitatory and inhibitory conductances, presumably the result of an increase in the activity of inhibitory neurons as well as a decrease in the activity of excitatory neurons that synapse with layer 2/3 neurons.
Given that a major source of excitatory drive to layer 2/3 neurons arises from spiny stellate neurons in cortical layer 4 (Lund, 1988; Muly and Fitzpatrick, 1992; Fitzpatrick, 1996; Callaway, 1998; Lund et al., 2003; Douglas and Martin, 2004; Mooser et al., 2004), a parsimonious explanation for these effects is that luminance steps evoke inhibition in layer 2/3 neurons and in the spiny stellate neurons of layer 4 that supply feedforward excitatory inputs. Moreover, the fact that increases in the inhibitory conductance of layer 2/3 neurons occur without increases (or during decreases) in excitatory conductance suggests that the synapses providing luminance-evoked inhibition onto layer 2/3 neurons arise from layer 4 neurons that receive direct LGN input. Thus, the impact of luminance change on the responses of layer 2/3 neurons could be explained by the activation of layer 4 neurons that supply feedforward inhibition to layer 2/3 neurons and to the layer 4 neurons that supply layer 2/3 neurons with their excitatory drive. This hypothesis is consistent with evidence for a class of GABAergic smooth dendritic neurons in layer 4 of neocortex that receive direct thalamic inputs and supply feedforward inhibition to both layer 2/3 and to other neurons in layer 4 (Gibson et al., 1999; Porter et al., 2001; Bruno and Simons, 2002; Beierlein et al., 2003; Hirsch et al., 2003; Swadlow, 2003). Such a mechanism could also explain the weak transient depolarization that frequently precedes luminance-evoked inhibition in layer 2/3 neurons (Fig. 1): the monosynaptic activation of layer 4 excitatory neurons by LGN inputs would be expected to occur before silencing by disynaptic feedforward inhibition.
Although this discussion has focused on the cortical circuitry likely to mediate luminance-evoked suppression, it presumes some difference in the response of LGN neurons to equiluminant and luminance step stimuli that could elicit such distinct cortical response patterns. One interesting possibility is suggested by the observation that large-scale changes in luminance frequently evoke high-frequency burst discharges in LGN neurons (Schiller, 1968; Ramcharan et al., 2001; Sherman, 2001; Lesica and Stanley, 2004; Alitto et al., 2005; Denning and Reinagel, 2005). Similar burst discharges in somatosensory thalamus have been shown to be effective in driving the responses of layer 4 cortical inhibitory neurons (Swadlow and Gusev, 2001). If one assumes that luminance steps evoke synchronous bursts in large populations of LGN relay neurons, this pattern of activity could preferentially recruit layer 4 inhibitory neurons, which in turn would deliver a strong synchronous burst of feedforward inhibition to target neurons in layer 4 and layer 2/3. Indeed, the synchronous activation of large populations of LGN neurons by electrical stimulation produces biphasic subthreshold responses in cortical neurons that are virtually identical to the waveforms we observe with changes in luminance (Ferster and Jagadeesh, 1992; Ferster et al., 1996; Kara et al., 2002).
Turning off cortical circuits: perceptual significance
Alterations in detection and discrimination of visual targets presented in close temporal proximity to large-scale changes in luminance have been well described and are likely the perceptual manifestation of the suppressive events described here (Crawford, 1947; Boynton and Kandel, 1957; Breitmeyer and Ogmen, 2000; Huang et al., 2005). The similarity in the time courses of perceptual masking and luminance-driven inhibition suggests that visual stimuli are masked from perception when their representation by cortical circuits is damped by strong intracortical inhibition. Perceptual masking is not limited to large-scale changes in luminance; spatially localized flashed stimuli also produce masking effects and these are sensitive to the locations and configuration of the mask and target stimuli (Bridgeman, 1971; Leopold and Logothetis, 1996; Macknik et al., 2000; Wilke et al., 2003). The extent to which these topographically restricted forms of visual masking rely on cortically derived inhibition remains to be determined.
Although the perceptual effects induced by changes in luminance have been a useful tool for exploring the temporal properties of visual processing in the laboratory, presumably such interruptions in the cortical representation of visual information are a common occurrence in natural vision as changes in gaze angle induce concurrent changes in target stimuli and the background in which they appear. Given that large-scale changes in luminance carry little information about the fine structure of visual scenes, transient cortical inhibition may act as a filter reducing the impact of luminance flux on cortical circuits responsible for extracting visual scene details. If left unabated, large-scale changes in luminance would likely exert a more protracted and disruptive impact on the information processing capabilities of cortical circuits, than that induced by luminance-evoked suppression. Although there may be a cost associated with these self-imposed gaps in visual perception, the fact that we are generally unaware of these gaps suggests (ironically) that transiently turning off cortical circuits plays an important role in insuring the continuity of visual experience.
Footnotes
This work was supported by National Eye Institute Grant EY06821. We thank members of the Fitzpatrick laboratory for helpful discussion and comments on this manuscript.
References
- Alitto HJ, Weyand TG, Usrey WM. Distinct properties of stimulus-evoked bursts in the lateral geniculate nucleus. J Neurosci. 2005;25:514–523. doi: 10.1523/JNEUROSCI.3369-04.2005. [DOI] [PMC free article] [PubMed] [Google Scholar]
- Anderson JS, Carandini M, Ferster D. Orientation tuning of input conductance, excitation, and inhibition in cat primary visual cortex. J Neurophysiol. 2000;84:909–926. doi: 10.1152/jn.2000.84.2.909. [DOI] [PubMed] [Google Scholar]
- Beierlein M, Gibson JR, Connors BW. Two dynamically distinct inhibitory networks in layer 4 of the neocortex. J Neurophysiol. 2003;90:2987–3000. doi: 10.1152/jn.00283.2003. [DOI] [PubMed] [Google Scholar]
- Bosking WH, Zhang Y, Schofield B, Fitzpatrick D. Orientation selectivity and the arrangement of horizontal connections in tree shrew striate cortex. J Neurosci. 1997;17:2112–2127. doi: 10.1523/JNEUROSCI.17-06-02112.1997. [DOI] [PMC free article] [PubMed] [Google Scholar]
- Boynton RM, Kandel G. On responses in the human visual system as a function of adaptation level. J Opt Soc Am. 1957;47:275–286. doi: 10.1364/josa.47.000275. [DOI] [PubMed] [Google Scholar]
- Brainard DH. The psychophysics toolbox. Spat Vis. 1997;10:433–436. [PubMed] [Google Scholar]
- Breitmeyer BG, Ogmen H. Recent models and findings in visual backward masking: a comparison, review, and update. Percept Psychophys. 2000;62:1572–1595. doi: 10.3758/bf03212157. [DOI] [PubMed] [Google Scholar]
- Bridgeman B. Metacontrast and lateral inhibition. Psychol Rev. 1971;78:528–539. doi: 10.1037/h0031782. [DOI] [PubMed] [Google Scholar]
- Bridgeman B. Correlates of metacontrast in single cells of the cat visual system. Vision Res. 1975;15:91–99. doi: 10.1016/0042-6989(75)90065-6. [DOI] [PubMed] [Google Scholar]
- Bruno RM, Simons DJ. Feedforward mechanisms of excitatory and inhibitory cortical receptive fields. J Neurosci. 2002;22:10966–10975. doi: 10.1523/JNEUROSCI.22-24-10966.2002. [DOI] [PMC free article] [PubMed] [Google Scholar]
- Callaway EM. Local circuits in primary visual cortex of the macaque monkey. Annu Rev Neurosci. 1998;21:47–74. doi: 10.1146/annurev.neuro.21.1.47. [DOI] [PubMed] [Google Scholar]
- Chisum HJ, Mooser F, Fitzpatrick D. Emergent properties of layer 2/3 neurons reflect the collinear arrangement of horizontal connections in tree shrew visual cortex. J Neurosci. 2003;23:2947–2960. doi: 10.1523/JNEUROSCI.23-07-02947.2003. [DOI] [PMC free article] [PubMed] [Google Scholar]
- Crawford BH. Visual adaptation in relation to brief conditioning stimuli. Proc R Soc Lond B Biol Sci. 1947;134:283–302. doi: 10.1098/rspb.1947.0015. [DOI] [PubMed] [Google Scholar]
- Denning KS, Reinagel P. Visual control of burst priming in the anesthetized lateral geniculate nucleus. J Neurosci. 2005;25:3531–3538. doi: 10.1523/JNEUROSCI.4417-04.2005. [DOI] [PMC free article] [PubMed] [Google Scholar]
- Douglas RJ, Martin KA. Neuronal circuits of the neocortex. Annu Rev Neurosci. 2004;27:419–451. doi: 10.1146/annurev.neuro.27.070203.144152. [DOI] [PubMed] [Google Scholar]
- Ferster D. Orientation selectivity of synaptic potentials in neurons of cat primary visual cortex. J Neurosci. 1986;6:1284–1301. doi: 10.1523/JNEUROSCI.06-05-01284.1986. [DOI] [PMC free article] [PubMed] [Google Scholar]
- Ferster D, Jagadeesh B. EPSP-IPSP interactions in cat visual cortex studied with in vivo whole-cell patch recording. J Neurosci. 1992;12:1262–1274. doi: 10.1523/JNEUROSCI.12-04-01262.1992. [DOI] [PMC free article] [PubMed] [Google Scholar]
- Ferster D, Chung S, Wheat H. Orientation selectivity of thalamic input to simple cells of cat visual cortex. Nature. 1996;380:249–252. doi: 10.1038/380249a0. [DOI] [PubMed] [Google Scholar]
- Fitzpatrick D. The functional organization of local circuits in visual cortex: insights from the study of tree shrew striate cortex. Cereb Cortex. 1996;6:329–341. doi: 10.1093/cercor/6.3.329. [DOI] [PubMed] [Google Scholar]
- Gawne TJ, Martin JM. Activity of primate V1 cortical neurons during blinks. J Neurophysiol. 2000;84:2691–2694. doi: 10.1152/jn.2000.84.5.2691. [DOI] [PubMed] [Google Scholar]
- Gawne TJ, Martin JM. Responses of primate visual cortical neurons to stimuli presented by flash, saccade, blink, and external darkening. J Neurophysiol. 2002;88:2178–2186. doi: 10.1152/jn.00151.200. [DOI] [PubMed] [Google Scholar]
- Gibson JR, Beierlein M, Connors BW. Two networks of electrically coupled inhibitory neurons in neocortex. Nature. 1999;402:75–79. doi: 10.1038/47035. [DOI] [PubMed] [Google Scholar]
- Haynes JD, Lotto RB, Rees G. Responses of human visual cortex to uniform surfaces. Proc Natl Acad Sci USA. 2004;101:4286–4291. doi: 10.1073/pnas.0307948101. [DOI] [PMC free article] [PubMed] [Google Scholar]
- Hirsch JA, Alonso JM, Reid RC, Martinez LM. Synaptic integration in striate cortical simple cells. J Neurosci. 1998;18:9517–9528. doi: 10.1523/JNEUROSCI.18-22-09517.1998. [DOI] [PMC free article] [PubMed] [Google Scholar]
- Hirsch JA, Martinez LM, Pillai C, Alonso JM, Wang Q, Sommer FT. Functionally distinct inhibitory neurons at the first stage of visual cortical processing. Nat Neurosci. 2003;6:1300–1308. doi: 10.1038/nn1152. [DOI] [PubMed] [Google Scholar]
- Huang X, Paradiso MA. Background changes delay information represented in macaque V1 neurons. J Neurophysiol. 2005;94:4314–4330. doi: 10.1152/jn.01309.2004. [DOI] [PubMed] [Google Scholar]
- Huang X, Blau S, Paradiso MA. Background changes delay the perceptual availability of form information. J Neurophysiol. 2005;94:4331–4343. doi: 10.1152/jn.01312.2004. [DOI] [PubMed] [Google Scholar]
- Hubel DH. Single unit activity in lateral geniculate body and optic tract of unrestrained cats. J Physiol (Lond) 1960;150:91–104. doi: 10.1113/jphysiol.1960.sp006375. [DOI] [PMC free article] [PubMed] [Google Scholar]
- Hubel DH, Wiesel TN. Integrative action in the cat's lateral geniculate body. J Physiol (Lond) 1961;155:385–398. doi: 10.1113/jphysiol.1961.sp006635. [DOI] [PMC free article] [PubMed] [Google Scholar]
- Jacobs GH, Yolton RL. Center-surround balance in receptive fields of cells in the lateral geniculate nucleus. Vision Res. 1970;10:1127–1144. doi: 10.1016/0042-6989(70)90030-1. [DOI] [PubMed] [Google Scholar]
- Kammer T, Lehr L, Kirschfeld K. Cortical visual processing is temporally dispersed by luminance in human subjects. Neurosci Lett. 1999;263:133–136. doi: 10.1016/s0304-3940(99)00137-8. [DOI] [PubMed] [Google Scholar]
- Kara P, Pezaris JS, Yurgenson S, Reid RC. The spatial receptive field of thalamic inputs to single cortical simple cells revealed by the interaction of visual and electrical stimulation. Proc Natl Acad Sci USA. 2002;99:16261–16266. doi: 10.1073/pnas.242625499. [DOI] [PMC free article] [PubMed] [Google Scholar]
- Kayama Y, Riso RR, Bartlett JR, Doty RW. Luxotonic responses of units in macaque striate cortex. J Neurophysiol. 1979;42:1495–1517. doi: 10.1152/jn.1979.42.6.1495. [DOI] [PubMed] [Google Scholar]
- Kinoshita M, Komatsu H. Neural representation of the luminance and brightness of a uniform surface in the macaque primary visual cortex. J Neurophysiol. 2001;86:2559–2570. doi: 10.1152/jn.2001.86.5.2559. [DOI] [PubMed] [Google Scholar]
- Kolers P, Rosner BS. On visual masking (metacontrast): dichoptic observations. Am J Psychol. 1960;73:2–21. [PubMed] [Google Scholar]
- Komatsu H, Murakami I, Kinoshita M. Surface representation in the visual system. Brain Res Cogn Brain Res. 1996;5:97–104. doi: 10.1016/s0926-6410(96)00045-6. [DOI] [PubMed] [Google Scholar]
- Kretz R, Rager G, Norton TT. Laminar organization of ON and OFF regions and ocular dominance in the striate cortex of the tree shrew (Tupaia belangeri) J Comp Neurol. 1986;251:135–145. doi: 10.1002/cne.902510110. [DOI] [PubMed] [Google Scholar]
- Leopold DA, Logothetis NK. Activity changes in early visual cortex reflect monkeys' percepts during binocular rivalry. Nature. 1996;379:549–553. doi: 10.1038/379549a0. [DOI] [PubMed] [Google Scholar]
- Lesica NA, Stanley GB. Encoding of natural scene movies by tonic and burst spikes in the lateral geniculate nucleus. J Neurosci. 2004;24:10731–10740. doi: 10.1523/JNEUROSCI.3059-04.2004. [DOI] [PMC free article] [PubMed] [Google Scholar]
- Lund JS. Anatomical organization of macaque monkey striate visual cortex. Annu Rev Neurosci. 1988;11:253–288. doi: 10.1146/annurev.ne.11.030188.001345. [DOI] [PubMed] [Google Scholar]
- Lund JS, Angelucci A, Bressloff PC. Anatomical substrates for functional columns in macaque monkey primary visual cortex. Cereb Cortex. 2003;13:15–24. doi: 10.1093/cercor/13.1.15. [DOI] [PubMed] [Google Scholar]
- Macknik SL, Livingstone MS. Neuronal correlates of visibility and invisibility in the primate visual system. Nat Neurosci. 1998;1:144–149. doi: 10.1038/393. [DOI] [PubMed] [Google Scholar]
- Macknik SL, Martinez-Conde S. Dichoptic visual masking reveals that early binocular neurons exhibit weak interocular suppression: implications for binocular vision and visual awareness. J Cogn Neurosci. 2004;16:1049–1059. doi: 10.1162/0898929041502788. [DOI] [PubMed] [Google Scholar]
- Macknik SL, Martinez-Conde S, Haglund MM. The role of spatiotemporal edges in visibility and visual masking. Proc Natl Acad Sci USA. 2000;97:7556–7560. doi: 10.1073/pnas.110142097. [DOI] [PMC free article] [PubMed] [Google Scholar]
- Marrocco RT. Maintained activity of monkey optic tract fibers and lateral geniculate nucleus cells. Vision Res. 1972;12:1175–1181. doi: 10.1016/0042-6989(72)90105-8. [DOI] [PubMed] [Google Scholar]
- Martinez-Conde S, Macknik SL, Hubel DH. The function of bursts of spikes during visual fixation in the awake primate lateral geniculate nucleus and primary visual cortex. Proc Natl Acad Sci USA. 2002;99:13920–13925. doi: 10.1073/pnas.212500599. [DOI] [PMC free article] [PubMed] [Google Scholar]
- Monier C, Chavane F, Baudot P, Graham LJ, Fregnac Y. Orientation and direction selectivity of synaptic inputs in visual cortical neurons: a diversity of combinations produces spike tuning. Neuron. 2003;37:663–680. doi: 10.1016/s0896-6273(03)00064-3. [DOI] [PubMed] [Google Scholar]
- Mooser F, Bosking WH, Fitzpatrick D. A morphological basis for orientation tuning in primary visual cortex. Nat Neurosci. 2004;7:872–879. doi: 10.1038/nn1287. [DOI] [PubMed] [Google Scholar]
- Mukhametov LM, Rizzolatti G. The responses of lateral geniculate neurons to flashes of light during the sleep-waking cycle. Arch Ital Biol. 1970;108:348–368. [PubMed] [Google Scholar]
- Muly EC, Fitzpatrick D. The morphological basis for binocular and ON/OFF convergence in tree shrew striate cortex. J Neurosci. 1992;12:1319–1334. doi: 10.1523/JNEUROSCI.12-04-01319.1992. [DOI] [PMC free article] [PubMed] [Google Scholar]
- Ogmen H, Breitmeyer BG, Melvin R. The what and where in visual masking. Vision Res. 2003;43:1337–1350. doi: 10.1016/s0042-6989(03)00138-x. [DOI] [PubMed] [Google Scholar]
- Pelli DG. The VideoToolbox software for visual psychophysics: transforming numbers into movies. Spat Vis. 1997;10:437–442. [PubMed] [Google Scholar]
- Peng X, Van Essen DC. Peaked encoding of relative luminance in macaque areas V1 and V2. J Neurophysiol. 2005;93:1620–1632. doi: 10.1152/jn.00793.2004. [DOI] [PubMed] [Google Scholar]
- Porter JT, Johnson CK, Agmon A. Diverse types of interneurons generate thalamus-evoked feedforward inhibition in the mouse barrel cortex. J Neurosci. 2001;21:2699–2710. doi: 10.1523/JNEUROSCI.21-08-02699.2001. [DOI] [PMC free article] [PubMed] [Google Scholar]
- Ramcharan EJ, Gnadt JW, Sherman SM. The effects of saccadic eye movements on the activity of geniculate relay neurons in the monkey. Vis Neurosci. 2001;18:253–258. doi: 10.1017/s0952523801182106. [DOI] [PubMed] [Google Scholar]
- Schiller PH. Monoptic and dichoptic visual masking by patterns and flashes. J Exp Psychol. 1965;69:193–199. doi: 10.1037/h0021574. [DOI] [PubMed] [Google Scholar]
- Schiller PH. Single unit analysis of backward visual masking and metacontrast in the cat lateral geniculate nucleus. Vision Res. 1968;8:855–866. doi: 10.1016/0042-6989(68)90135-1. [DOI] [PubMed] [Google Scholar]
- Sherman SM. Tonic and burst firing: dual modes of thalamocortical relay. Trends Neurosci. 2001;24:122–126. doi: 10.1016/s0166-2236(00)01714-8. [DOI] [PubMed] [Google Scholar]
- Swadlow HA. Fast-spike interneurons and feedforward inhibition in awake sensory neocortex. Cereb Cortex. 2003;13:25–32. doi: 10.1093/cercor/13.1.25. [DOI] [PubMed] [Google Scholar]
- Swadlow HA, Gusev AG. The impact of “bursting” thalamic impulses at a neocortical synapse. Nat Neurosci. 2001;4:402–408. doi: 10.1038/86054. [DOI] [PubMed] [Google Scholar]
- Valberg A, Lee BB, Tigwell DA, Creutzfeldt OD. A simultaneous contrast effect of steady remote surrounds on responses of cells in macaque lateral geniculate nucleus. Exp Brain Res. 1985;58:604–608. doi: 10.1007/BF00235876. [DOI] [PubMed] [Google Scholar]
- Wilke M, Logothetis NK, Leopold DA. Generalized flash suppression of salient visual targets. Neuron. 2003;39:1043–1052. doi: 10.1016/j.neuron.2003.08.003. [DOI] [PubMed] [Google Scholar]