

Abstract
Malformations of the neocortex are a common cause of human epilepsy; however, the critical issue of how disturbances in cortical organization render neurons epileptogenic remains controversial. The present study addressed this issue by studying inhibitory structure and function before seizure onset in the telencephalic internal structural heterotopia (tish) rat, which is a genetic model of heightened seizure susceptibility associated with a prominent neocortical malformation. Both normally positioned (normotopic) and misplaced (heterotopic) pyramidal neurons in the tish neocortex exhibited lower resting membrane potentials and a tendency toward higher input resistance compared with pyramidal neurons from control brains. GABAergic synaptic transmission was attenuated in the tish cortex, characterized by significant reductions in the frequency of spontaneous IPSCs (sIPSCs) and miniature IPSCs recorded from pyramidal neurons. In addition, the amplitudes of sIPSCs were reduced in the tish neocortex, an effect that was more profound in the normotopic cells. Immunohistochemical assessment of presynaptic GABAergic terminals showed a reduction in terminals surrounding pyramidal cell somata in normotopic and heterotopic tish neocortex. The attenuation of inhibitory innervation was more prominent for normotopic neurons and was associated with a reduction in a subset of GABAergic interneurons expressing the calcium-binding protein parvalbumin. Together, these findings indicate that key facets of inhibitory GABAergic neurotransmission are disturbed before seizure onset in a brain predisposed to developing seizures. Such alterations represent a rational substrate for reduced seizure thresholds associated with certain cortical malformations.
Keywords: GABAA receptor, cerebral cortex, interneuron, inhibition, pyramidal cell, epilepsy
Introduction
Neocortical malformations can result from disturbances in a variety of developmental processes such as migration, proliferation, etc. (Rorke, 1994; Barkovich et al., 1996). Given the complexity of these events, it is not surprising that neurons in a malformed cortex may harbor aberrant physiological features that could contribute to the generation of seizures and epilepsy (Barkovich and Raybaud, 2004; Najm et al., 2004; Guerrini and Filippi, 2005). Studies performed on human brain tissue from surgical resections indicate that dysplastic tissue is hyperexcitable compared with surrounding eloquent tissue (Schwartzkroin and Knowles, 1984; Reid and Palovcik, 1989; Mattia et al., 1995; Avoli et al., 1999, 2003). However, the inherent limitations of experiments involving human tissue and the inability to assess neural function before seizure onset have limited progress in characterizing the cause(s) of epileptogenesis.
Animal models of cortical malformation provide opportunities to define disturbances that predispose dysplastic brains to epilepsy. A particularly useful animal for this purpose is the seizure-prone genetic mutant termed the telencephalic internal structural heterotopia (tish) rat. An autosomal recessive mutation in the tish rat results in the development of bilateral subcortical band heterotopia reminiscent of those found in the human seizure disorder of subcortical band heterotopia or double cortex (Lee et al., 1997). The heterotopia consist of misplaced cortical neurons and glia that retain several basic features of normal neocortex, including topographic connectivity with subcortical targets (Lee et al., 1997, 1998; Schottler et al., 1998, 2001). However, the heterotopic neurons fail to orient and laminate as in typical neocortex. Overlying the heterotopia is an area of the neocortex termed “normotopic cortex” that is thinner than normal neocortex but maintains proper orientation and lamination of its primary neurons (Lee et al., 1997, 1998, 1999; Schottler et al., 1998, 2001). Electrophysiological studies have demonstrated that spontaneous seizure activity occurs in both normotopic and heterotopic areas of the adult tish neocortex, but that the normotopic area is more prone to develop aberrant discharge activity (Chen et al., 2000). Key advantages of the tish rat for studying functional disturbances associated with a cortical malformation are (1) the heterotopia are genetically heritable (i.e., no experimental manipulation is required to induce the malformation) and (2) the animals are naturally prone to develop recurrent spontaneous seizures (Lee et al., 1997; Chen et al. 2000).
The present study examined the role of disturbed GABAergic synaptic transmission in predisposing the tish brain to seizures. Human and animal studies of malformed neocortex have implicated alterations in GABAergic synaptic transmission as leading candidates to underlie seizures in dysplastic tissue (Schwartzkroin et al., 2004; Avoli et al., 2005). We used whole-cell recordings of pyramidal neurons to characterize IPSCs and intrinsic membrane characteristics at a developmental stage before seizure onset in the tish brain. The distribution of GABAergic interneurons and terminals was also examined. This study provides evidence for attenuated GABAergic synaptic transmission and disturbed interneuron distribution in the tish neocortex. These alterations in synaptic inhibition and cellular distribution are in a key position to contribute to epileptogenesis in a brain with cortical heterotopia.
Materials and Methods
Animals and breeding.
Animals were housed at 22°C on a standard light/dark schedule with ad libitum access to food and water. Animals were handled according to National Institutes of Health animal care and use guidelines and a protocol approved by the University of Virginia Animal Care and Use Committee. The inheritance pattern of the tish phenotype suggests an autosomal recessive mutation in a single gene, requiring two copies to display a heterotopia. Thus, litters of homozygotic experimental animals could have been generated using a homozygotic tish female mated to a homozygotic tish male. However, this strategy raised the issue of whether or not the mother had seizures while pregnant, and whether or not this affected the neurological development of those pups. Instead, we used a heterozygotic tish female and mated her to a homozygotic tish male, which resulted in a litter of 50% heterozygotic animals, without cortical heterotopia, and 50% homozygotic, heterotopia-bearing animals. Male wild-type Sprague Dawley rats and homozygotic tish rats of Sprague Dawley background were selected for experimentation on postnatal day 15 (P15), with the day of birth considered as P1. This age represents a pre-seizure time point, which is important because we wanted to study possible mechanisms leading up to seizures, but not alterations as a result of seizures. This age is consistent with previous observations that seizure onset does not occur until at least P30.
Brain slice preparation.
Animals were anesthetized with halothane before decapitation, followed by quick removal of the brain, which was sectioned to 350 μm using a vibratome stage at 4°C in oxygenated high-sucrose artificial CSF (ACSF) containing the following (in mm): 248 sucrose, 127 NaCl, 2 KCl, 25.7 KH2PO4, 1.5 NaHCO3, 1.1 d-glucose, 2.4 CaCl2, and 1.5 MgSO4; osmolarity 300–305. The slices were stored in oxygenated ACSF containing the following (in mm): 127 NaCl, 2 KCl, 1.1 KH2PO4, 25.7 NaHCO3, 10 d-glucose, 1.5 CaCl2, and 1.5 MgSO4; osmolarity 300–305. They were held in this chamber at 32°C for 60 min before transfer to the recording chamber mounted to the stage of an Olympus (Tokyo, Japan) BX51 microscope.
Whole-cell recording.
Whole-cell patch-clamp recordings were performed using infrared differential interference contrast (IR-DIC) microscopy and a 40× water-immersion objective to visually identify layer V pyramidal neurons in control neocortex and in the normotopic region of homozygotic tish animals. Layer V neurons were selected for analysis because they are a major source of efferent projections from the neocortex and have been implicated in epileptogenesis (Connors and Telfeian, 2000). In addition, large pyramidal neurons were targeted in the heterotopia of homozygotic tish animals. Slices were continuously superfused with ACSF identical to the storage solution saturated with 95%O2–5%CO2 at room temperature. Electrodes (2–4 MΩ) were pulled from 1.5-mm-outer-diameter borosilicate glass capillary tubing on a horizontal Flaming-Brown microelectrode puller. Biocytin (0.1%) was included in the internal solution to confirm the pyramidal morphology of cells selected for experimentation. For current clamp recordings, the pipettes were filled with a solution containing the following (in mm): 135.0 K-gluconate, 7.0 KCl, 10 HEPES, 0.5 EGTA, 2.5 NaCl, 4 ATP-Mg salt; pH adjusted to 7.4 with KOH, osmolarity 285–290. A brief suprathreshold current pulse was applied to evoke action potential trains in the cell. For voltage-clamp recordings, the electrode solution was sterile filtered and contained cesium to block potassium channels (in mm): 153.3 CsCl, 1.0 MgCl2, 10 HEPES, 5 EGTA, 3 ATP-Mg salt; pH adjusted to 7.4 with CsOH, osmolarity 285–290. The cell was voltage clamped to −60 mV for the duration of the recording, which was between 10 and 30 min. Access resistance was monitored by applying a 10 ms square conductance pulse. Data were recorded at a rate of 10 kHz rate using a Digidata 1322 digitizer with Axopatch 1D and 200B amplifiers, filtered at 5 kHz. To measure spontaneous IPSCs (sIPSCs), dl-2-amino-5-phosphonopentanoic acid (50 μm) and 6-cyano-77-nitroquinoxaline-2,3-dione (20 μm) were added to the superfusion ACSF to block NMDA and AMPA/kainate receptor-mediated currents, respectively. To study miniature IPSCs (mIPSCs), we switched to a solution containing APV, DNQX, and tetrodotoxin (1.0 μm) to block voltage-gated sodium channels and thus block action potential-mediated events. For experiments examining the effect of increased probability of release, the ACSF was identical to that used for sIPSCs but contained low Mg2+ (0.5 mm) and high Ca2+ (3.0 mm). In experiments blocking N- or P/Q-type calcium channel function, ω-conotoxin-GVIa (1 μm) and ω-agatoxin-IVa (500 nm) (Bachem, Torrance, CA), respectively, were added to the sIPSC solution along with 0.001% bovine serum albumin (BSA) to prevent adsorption of the toxin to surfaces. Bicuculline (20 μm), a GABA receptor competitive antagonist, was applied at the end of the experiment to verify that these currents were indeed GABA mediated.
Data analysis and statistics.
Data were analyzed using Clampfit 8 (Molecular Devices, Union City, CA) and MiniAnalysis (Synaptosoft, Decatur, GA). Each event in the 10–30 min recording was visually inspected for proper detection. The threshold for detection was set to three times the root mean square of baseline noise. The recording was terminated if the resistance increased by ≥25% during the experiment. Data values were expressed as the mean ± SEM unless noted otherwise. p values represent the results of Student's t test analysis, with p < 0.05 indicating the level of significance. Drug application data were analyzed using a paired t test. The mIPSC amplitude is described by median values because their values were not normally distributed as a result of the loss of smaller currents in background noise. The median mIPSC amplitudes were then averaged, and the mean of medians ± SEM are reported. All statistical comparisons were performed using Prism software (Graph Pad, San Diego, CA). Gaussian distributions were best fit using Origin software (Northampton, MA) with the following equation:
 |
where y0 is the baseline offset, A is the total area under the curve from the baseline, x0 is the center of the peak, w is 2 “σ”, ∼0.849 the width of the peak at half height.
Recordings selected for Gaussian fitting consisted of at least 400 individual IPSC events without any evidence of rundown of IPSC amplitudes or change in input resistance.
Biocytin-filled cells.
As described previously by (Zhang, 2004), slices possessing biocytin-filled cells were carefully removed from the recording chamber and fixed by immersion in 4% paraformaldehyde in 0.1 m PBS overnight at 4°C, followed by two rinses in PBS (0.1 m). The slices were then incubated in 3% H2O2 and 10% methanol in PBS (0.1 m) for 1 h at room temperature to quench endogenous peroxidase activity, which was followed by five 5 min washes in PBS plus 0.1% Triton. Slices were then incubated in streptavidin-conjugated peroxidase (2 μg/ml) in PBS containing 2% Triton overnight at 4°C, rinsed five times in PBS plus 0.1% Triton, and reacted with 3,3′-diaminobenzidine tetrahydrochloride (0.06%) and H2O2 (0.003%) in PBS. The slices were mounted on slides, air dried overnight, dehydrated through a series of ethanols (70–100%), followed by xylenes, embedded in Permount, and coverslipped.
Immunohistochemistry for interneurons.
Animals were deeply anesthetized with halothane, given intraperitoneal injections of a lethal dose of chloral hydrate, and perfused transcardially with 0.1 m phosphate buffer (PB), pH 7.4, followed by 4% paraformaldehyde in 0.1 m PB, pH 7.4. The brains were removed and postfixed in the same fixative overnight at 4°C. After incubation until sinking in 30% sucrose in 0.1 m PB for cryoprotection, the brains were frozen rapidly and sectioned coronally to 30 μm on a cryostat. Sections were then processed for immunohistochemistry. Briefly, sections were washed three times in 0.1 m PBS, pH 7.4, and incubated with blocking solution containing 5% normal goat serum (Jackson Immunoresearch, West Grove, PA), 0.1% BSA (Jackson Immunoresearch), and 0.3% Triton X-100 in 0.1 m PBS for 1 h at room temperature. Tissue sections were then incubated with the primary antibodies diluted in PBS containing 1% normal goat serum, 0.2% BSA, and 0.3% Triton X-100 at 4°C for 48–72 h on a shaker. The following concentrations of primary antibodies were used: monoclonal mouse anti-neuronal nuclei (NeuN; 1:200, MAB377; Chemicon, Temecula, CA); polyclonal rabbit anti-glutamic acid decarboxylase, 65 kDa isoform (GAD-65; 1:1000, AB5082; Chemicon); monoclonal mouse anti-parvalbumin antibody (1:2000, P3088; Sigma, St. Louis, MO); polyclonal rabbit anti-somatostatin antibody (1:2000, T-4546; Peninsula Laboratories, San Carlos, CA); polyclonal rabbit anti-cholecystokinin antibody (1:6000, C2581; Sigma). Sections were then washed six times in PBS plus 0.1% Triton X-100 and incubated in secondary antibodies in either a combination of goat anti-rabbit IgG conjugated with Alexa 488 fluorochrome/goat anti-mouse IgG conjugated with Alexa 594 fluorochrome or goat anti-rabbit IgG conjugated with Alexa 594 fluorochrome/goat anti-mouse IgG conjugated with Alexa 488 fluorochrome, 4 μg/ml (Invitrogen, Eugene, OR) diluted in PBS containing 1% normal goat serum, 0.2% BSA, and 0.3% Triton X-100 for 1 h on a shaker at room temperature in darkness. Sections were then washed six times in PBS plus 0.1% Triton X-100, mounted on slides, air dried, and coverslipped with Gel/Mount (Biomeda, Foster City, CA), and the edge of each coverslip was sealed with clear nail polish. Slides were stored at −20°C.
Image acquisition and analysis.
Fluorescent images of representative sections were captured on a CoolSnap cf CCD camera (Roper Scientific Photometrics, Tucson, AZ) mounted on an Eclipse TE200 fluorescent microscope (Nikon, Tokyo, Japan) driven by MetaMorph imaging software (Universal Imaging, Downington, PA). High-resolution digital images of each fluorochrome were acquired with a 60×/1.4 numerical aperture lens. Brightness and contrast of fluorescent images were adjusted with MetaMorph software to limit weak diffuse background labeling. Images were saved as 8-bit TIFF files and opened in Adobe Photoshop 6.0 (Adobe Systems, San Jose, CA), where overall brightness was increased for final production.
For the study of interneuron distributions, images of somatosensory cortex (and heterotopic cortex) were captured with a low-magnification objective lens (4×). Coronal sections located between −0.2 and +0.7 mm relative to bregma were selected for cell counting (Paxinos and Watson, 1998). Cell counts were obtained from four control and five tish brains using two sections per brain. For quantitative analysis of interneuron profiles in control brains, a contour of the cortex was drawn between the pia of the somatosensory neocortex and the underlying subcortical white matter, which represented an area of ∼9 mm2 per section. To measure profiles in normotopic neocortex, a contour was drawn bounded by the pia of the somatosensory neocortex and the white matter that separates this region from the heterotopia. To measure profiles in the heterotopia, a contour was drawn bounded by the white matter that separates this region from the normotopic neocortex and the subcortical white matter. Interneuron profiles within the contour were quantified using MetaMorph 6.03 software (Universal Imaging). The same threshold was applied to all images acquired. Most of the antigens were revealed as individual profiles, which were considered as individual objects in binary images. An aggregation of 20–1000 pixels of intensity at least twice the background intensity was considered a profile. Data were analyzed using Prism 4.0 software (Graph Pad). All values are reported as mean ± SEM.
Results
Neocortical neurons in control and tish rats
Homozygous tish rats exhibit a profound cortical malformation characterized by bilateral heterotopia at the base of the neocortex (Lee et al., 1997, Lee et al. 1998). Both the heterotopic and overlying normotopic areas are composed of neocortical cells, with a thin layer of white matter separating the two areas (Fig. 1A,B). The overlying normotopic area retains a six-layered organization, although it is thinner than the neocortex from control animals (Fig. 1A,B). The identity of cortical layers in the normotopic area has been established in previous studies based on cellular composition and characteristic afferent and efferent connectivity (Lee et al., 1997; Schottler et al., 1998).
Figure 1.
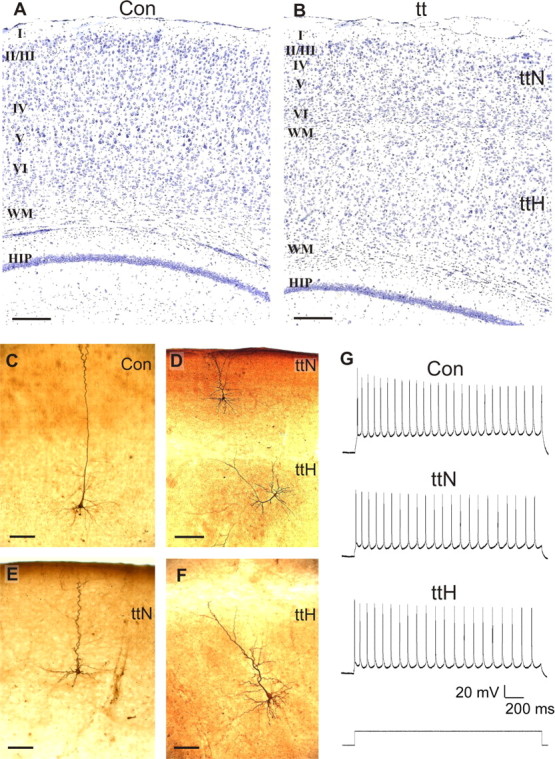
Cellular morphology and action potentials of pyramidal cells in the tish neocortex. A, B, Cresyl violet-stained coronal sections of control (A) and tish (B) cortices. Typical six-layered cortical organization is observed in the control animal, whereas a large, unlaminated heterotopia underlies a thinned six-layered cortex (normotopic cortex) in the tish rat. C–F, Biocytin-filled neurons. C, Layer V pyramidal neurons in control animals display prominent apical and basal dendrites and a triangular soma. D, E, Layer V pyramidal neurons in the normotopic tish cortex exhibit similar features, but the radial extent of the dendrites is shorter because of the thinned cortex, and the apical dendrites appear more tortuous. D, F, Large pyramidal neurons in the heterotopia lack typical radial orientation and lamination. G, Depolarization-evoked action potentials recorded from control, tish normotopic, and tish heterotopic pyramidal neurons exhibited discharge patterns typical of layer V cells in P15 rat neocortex. Scale bars: A, B, D, 250 μm;C, E, F, 100 μm. Con, Control; tt, tish; ttH, heterotopic area of tish cortex; ttN, normotopic tish cortex; WM, White matter; HIP, CA1 region of hippocampus.
Biocytin-filled layer V neurons in the control neocortex exhibited large pyramidal somata with radially oriented apical dendrites, some of which extended to layer I, and typical basal dendrites (Fig. 1C). Axon-like projections were observed coursing into the subjacent cortical white matter, with multiple axon collaterals arborizing in the cortical gray matter. Similarly, cells in layer V of the normotopic area of the tish brain possessed large pyramidal somata with prominent, radially oriented dendrites (Fig. 1D,E). In some cases, the apical dendrites exhibited a more tortuous appearance as they ascend toward layer I. Typical-appearing dendrites and axons emanated from the basal surface of the pyramidal somata. Labeled axons were observed to penetrate the white matter separating the neocortex from the heterotopia with collaterals projecting into the subjacent heterotopia and/or toward the internal capsule. Thus, layer V pyramidal neurons in the normotopic area of the tish cortex (normotopic neurons) retain a pyramidal phenotype with proper lamination and orientation, although the tortuousity of their dendrites appeared to be increased in some cases.
Large pyramidal neurons with prominent apical and basal dendrites were also readily identified in the heterotopic area of in vitro slices using IR-DIC. Biocytin labeling of large heterotopic pyramidal cells revealed neurons similar in appearance to those found in layer V of the control and tish normotopic neocortices, with two key distinctions. First, the orientation of the apical dendrite was variable with most cells not exhibiting typical radial orientation (Fig. 1D,F). Second, in some cases, the apical dendrites curved as they approached the edge of the heterotopia and followed the contour of the surrounding white matter. Otherwise, the size of the cells (i.e., the largest in the neocortex), their pyramidal shape, and general dendritic appearance were similar to those of layer V pyramidal neurons. The placements, orientations, and morphologies of the labeled heterotopic cells are also characteristic of corticospinal neurons identified in previous studies of the tish heterotopic area (Lee et al., 1997; Schottler et al., 1998).
Membrane properties
Membrane properties were characterized in control, normotopic, and heterotopic neocortical neurons using whole-cell current-clamp recordings obtained from in vitro slices (Fig. 1G, Table 1). In response to a suprathreshold current pulse, control neurons demonstrated a train of action potentials typical of layer V pyramidal neurons in rats 15 d of age, described by regular spiking with moderate adaptation in spike frequency (Zhang, 2004). These characteristics were also present in the pyramidal cells selected from both regions of the tish brain. Normotopic and heterotopic neurons in the tish neocortex were slightly but significantly more depolarized at rest than layer V neurons in control animals (Table 1). In addition, the input resistances of normotopic and heterotopic neurons tended to be higher than those observed in cells from control slices; however, these differences did not attain statistical significance. Membrane capacitances of normotopic, heterotopic, and control cells were similar and did not differ significantly among groups.
Table 1.
Membrane and action potential properties in layer V pyramidal neurons of the neocortex
| Control |
Normotopic |
Heterotopic |
|
|---|---|---|---|
| Membrane properties | |||
| RMP (mV) | −61.5 ± 0.5 (n = 20) | −57.9 ± 0.6** (n = 7) | −56.2 ± 0.9** (n = 6) |
| RN (MΩ) | 56.0 ± 2.3 (n = 28) | 66.5 ± 7.2 (n = 13) | 65.8 ± 5.9 (n = 12) |
| CM (pF) | 0.94 ± 0.06 (n = 21) | 0.86 ± 0.09 (n = 29) | 0.90 ± 0.06 (n = 35) |
| sIPSCs | |||
| Frequency (Hz) | 4.00 ± 0.56 | 2.21 ± 0.42* | 2.53 ± 0.43* |
| Amplitude (pA) | 71.9 ± 9.3 | 47.0 ± 3.0* | 59.9 ± 4.3 |
| n | 13 | 16 | 14 |
| mIPSCs | |||
| Frequency (Hz) | 2.45 ± 0.34 | 1.60 ± 0.23* | 1.54 ± 0.28* |
| Amplitude (pA) | 43.6 ± 2.5 | 42.5 ± 2.2 | 45.6 ± 3.1 |
| n | 13 | 16 | 16 |
p < 0.05
p < 0.001. RMP, Resting membrane potential; RN, input resistance; CM, membrane capacitance.
Diminished GABAA receptor-mediated synaptic transmission of normotopic tish neurons
Action potential-dependent sIPSCs were recorded in voltage-clamp mode from normotopic layer V neurons of the tish neocortex. sIPSCs recorded from normotopic neurons were less frequent and smaller in amplitude compared with those recorded from layer V neurons in control slices (Fig. 2A). Group data comparisons demonstrated that sIPSC frequency was reduced by 45% and sIPSC amplitude was attenuated by 37% in normotopic neurons compared with control neurons (Fig. 2B, Table 1). According to the quantal theory of GABAergic synaptic transmission (Edwards et al., 1990), the smaller amplitudes of sIPSCs recorded from normotopic neurons could result from smaller quantal size or diminished probability of multi-quantal release during a sIPSC. Previous studies in control tissue have shown that the distribution of sIPSC amplitudes can be resolved into multiple peaks and that enhancing the probability of transmitter release increases the number of peaks (Edwards et al., 1990). We therefore investigated whether the distribution of sIPSC amplitudes was different in these two groups of neurons. The amplitudes of sIPSCs recorded from control neurons (n = 6) were pooled and fitted to an equation for multiple Gaussians using Origin software. The amplitude distribution histogram could be best fit to a sum of four Gaussians. The peaks of the Gaussians were centered at 25, 37, 59, and 131 pA (Fig. 2C). Each Gaussian contributed 22–27% of the overall population of sIPSCs. In contrast, the amplitudes of sIPSCs pooled from normotopic neurons (n = 6) could be fit to only three Gaussians, centered at 26, 38, and at 59 pA (Fig. 2C). This suggested a decreased occurrence of multi-quantal, multi-terminal release events in the tish brain compared with controls.
Figure 2.

sIPSC and mIPSC measures are reduced in tish neocortex. A, Representative sIPSC and mIPSC recordings from control, tish normotopic, and tish heterotopic neurons. sIPSCs in the normotopic cortex and heterotopia appear less frequent and smaller. mIPSCs also appear to be less frequent in the tish cortex. B, Group data analyses reveal a significant reduction in sIPSC amplitude in tish normotopic neurons and significantly less frequent sIPSCs and mIPSCs in both tish normotopic and tish heterotopic neurons. mIPSC amplitude is similar for all groups. Values represent mean ± SEM, except for the mIPSC amplitude measurements, which represent mean of medians ± SEM. *p < 0.05 (Student's t test). C, sIPSC amplitude distribution histograms of data pooled from five to six cells in each group. The pie chart insets represent the relative proportion that each Gaussian subpopulation contributed to the total sIPSC amplitude population. The largest-amplitude Gaussian is absent from the tish normotopic neurons. Con, Control; ttN, tish normotopic; ttH, tish heterotopic.
To determine the quantal size in control and tish normotopic neurons, we measured the amplitude of action potential-independent mIPSCs. The amplitudes of mIPSCs recorded from normotopic neurons and control neurons were similar (Fig. 2A,B; Table 1), indicating that quantal size was comparable in the two populations of neurons. The lower amplitudes of sIPSCs recorded from normotopic neurons were therefore not attributable to smaller quantal size but likely resulted from a lower probability of occurrence of multi-quantal events.
Increasing release probability did not rescue GABA release in normotopic neurons
It is possible that establishing conditions that increase the probability of transmitter release might overcome the attenuated release from GABAergic terminals onto normotopic neurons. This possibility was examined by first recording sIPSCs in standard medium and then facilitating release by changing to a medium containing low magnesium (0.5 mm) and high calcium (3 mm). The frequency of sIPSCs recorded from control cells increased by 87% in response to low Mg2+/high Ca2+conditions; this reflects a robust increase in the release of presynaptic vesicles from control interneurons (Fig. 3A,B; Table 2). In contrast, sIPSC frequency was only modestly and nonsignificantly increased (by 24%) in normotopic cells under the same conditions. Thus, despite an enhanced probability of release, the frequency of sIPSCs in normotopic cells did not achieve a level comparable to that recorded from control neurons in standard recording conditions (Fig. 3A,B; Table 2).
Figure 3.

Increasing release probability only partially rescues inhibitory events in the tish brain. A, B, sIPSC recordings in slices before and during incubation in a medium that increases the probability of vesicular release from presynaptic terminals (low magnesium, high calcium). sIPSC frequency and amplitude appeared increased in all three types of cells under these conditions. C, D, sIPSC amplitude distribution histograms from a representative cell from each group. Pie chart insets represent the relative proportion that each Gaussian subpopulation contributed to the total sIPSC amplitude population. Arrows point to the additional high-amplitude population elicited by increased probability of release in the control and tish heterotopic neurons, but not in tish normotopic neurons. Con, Control; ttN, tish normotopic; ttH, tish heterotopic.
Table 2.
Effect of increased release probability on sIPSC measurements
| Standard medium | ↓Mg ↑Ca | |
|---|---|---|
| Control | ||
| Frequency (Hz) | 3.67 ± 0.42 | 6.87 ± 1.22* |
| Amplitude (pA) | 63.8 ± 9.7 | 74.0 ± 13.4 |
| n | 5 | 5 |
| Normotopic | ||
| Frequency (Hz) | 2.14 ± 0.24 | 2.66 ± 0.30 |
| Amplitude (pA) | 40.9 ± 2.8 | 43.2 ± 6.2 |
| n | 5 | 5 |
| Heterotopic | ||
| Frequency (Hz) | 2.18 ± 0.27 | 3.01 ± 0.41* |
| Amplitude (pA) | 60.7 ± 17.8 | 56.5 ± 10.3 |
| n | 7 | 7 |
p < 0.05.
The effect of enhancing release probability on multi-quantal events was assessed by comparing the amplitude distribution histograms of sIPSCs recorded before and after application of a low-Mg2+/high-Ca2+ medium. A typical example for a control neuron is shown in Figure 3, C and D. In standard medium, the amplitude distribution could be best fit to a sum of four Gaussians, with peaks at 25, 42, 80, and 145 pA. In response to low-Mg2+/high-Ca2+ medium, an additional (fifth) Gaussian appeared with a peak amplitude of 227 pA (Fig. 3D, Con, arrow). In contrast, when the amplitudes of sIPSCs recorded from a normotopic cell in standard medium were analyzed, the histogram could be fit to only three Gaussians, with peaks at 26, 47, and 75 pA (Fig. 3C, ttN). In response to low-Mg2+/high-Ca2+ medium, a new population of larger events emerged with a peak amplitude of 100 pA (Fig. 3D, ttN). However, the population of events for the fourth Gaussian in normotopic neurons in low-Mg2+/high-Ca2+ medium (n = 4; range, 92–117 pA) was smaller than that observed for control neurons in standard medium in which the fourth peak ranged from 140 to 157 pA (n = 5). It is also noteworthy that the amplitude distribution histograms from normotopic cells exposed to low-Mg2+/high-Ca2+ medium did not demonstrate a fifth peak. This contrasts with the consistent fifth peak evoked under the same conditions for control cells.
Inasmuch as neurotransmitter release from presynaptic terminals is mediated by entry of Ca2+ into the terminal via voltage-gated Ca2+ channels, we tested whether the expression and/or function of Ca2+ channels on GABAergic presynaptic terminals in the normotopic cortex was reduced compared with control cortex.
Calcium channels on presynaptic terminals innervating normotopic neurons
In interneurons, high voltage-activated N-type calcium channels are located specifically on synaptic terminals, are tightly coupled to exocytosis, and play a predominant role in action potential-mediated GABA release (Timmermann et al., 2002; Ali and Nelson, 2006). This contrasts with the situation in other central neurons in which P/Q-type channels play a dominant role in synaptic release (Timmermann et al., 2002). Thus, one possible explanation for disturbed GABA release from interneuron terminals in response to action potentials is that the expression of N-type channels is altered in the tish neocortex. To test the relative contributions of N-type versus P/Q-type channels for interneuron GABA release, we used toxins that are highly specific blockers of each of the two calcium channel subtypes: ω-conotoxin-GVIa for N-type channels and ω-agatoxin-IVa for P/Q-type channels.
sIPSCs recorded in tish normotopic neurons were less sensitive to blockade by ω-conotoxin-GVIa than were those recorded in control layer V neurons. After ω-conotoxin-GVIa application, sIPSC frequency and amplitude in control neurons were diminished by 38 and 39%, respectively (Fig. 4A–C). The values for sIPSC measurements in the presence of ω-conotoxin-GVIa were similar to control mIPSC values in standard medium (Table 3). This indicated that the action potential-mediated activation of N-type calcium channels was completely blocked and verifies the presence and function of N-type channels on the terminals of control interneurons. Treatment with ω-conotoxin-GVIa reduced the frequency and amplitude of sIPSCs recorded from tish normotopic neurons by 24 and 10%, respectively (Fig. 4A,B; Table 3). Group analysis of pooled data from eight cells did not reveal a significant effect on sIPSC frequency. However, pairwise comparisons of each cell before and after ω-conotoxin-GVIa incubation revealed significant reductions in frequency for all eight cells tested [Kolmogorov–Smirnov (K-S) test]. Furthermore, the values for the sIPSC measurements in the presence of ω-conotoxin-GVIa were also similar to mIPSC measurements obtained for normotopic neurons in standard medium. These observations confirm the presence and function of N-type channels in tish normotopic interneuron terminals. However, the magnitude of reduction in sIPSC values when treated with ω-conotoxin-GVIa was far less in normotopic neurons than that observed in control neurons under the same conditions (Fig. 4, Table 3). This could be attributable to a “floor effect” resulting from the already low amplitude and frequency of sIPSCs in the normotopic neurons in standard medium.
Figure 4.

N-type calcium channels are functional in inhibitory presynaptic terminals in both control and tish cortices. A, B, Representative recordings from control, tish normotopic, and tish heterotopic neurons demonstrate reduced sIPSC properties in response to incubation with the N-type calcium channel-specific blocker ω-conotoxin-GVIa. C, Group data analyses reveal a significant reduction in sIPSC frequency in control and tish heterotopic neurons in response to ω-conotoxin-GVIa. The amplitude of sIPSCs was significantly reduced in all groups. D, Group data analyses demonstrate that sIPSCs are unchanged in all three groups in response to incubation in the P/Q-type calcium channel-specific blocker ω-agatoxin-IVa. Error bars represent mean ± SEM. *p < 0.05, **p < 0.01 (Student's t test). Con, Control; ttN, tish normotopic; ttH, tish heterotopic; CTX, ω-conotoxin-GVIa; AGA, ω-agatoxin-IVa.
Table 3.
Effect of conotoxin on sIPSC properties
| Standard medium | Plus conotoxin | |
|---|---|---|
| Control | ||
| Frequency (Hz) | 3.45 ± 0.63 | 2.14 ± 0.46** |
| Amplitude (pA) | 78.3 ± 12.6 | 47.8 ± 6.21** |
| n | 9 | 9 |
| Normotopic | ||
| Frequency (Hz) | 1.65 ± 0.30 | 1.26 ± 0.20 |
| Amplitude (pA) | 43.1 ± 6.2 | 39.0 ± 5.7* |
| n | 8 | 8 |
| Heterotopic | ||
| Frequency (Hz) | 2.19 ± 0.24 | 1.33 ± 0.10* |
| Amplitude (pA) | 50.8 ± 3.7 | 38.4 ± 2.4* |
| n | 6 | 6 |
p < 0.05
p < 0.01.
An alternative explanation for diminished sensitivity to ω-conotoxin-GVIa in tish normotopic cells is that a compensatory shift in calcium channel subtypes could have occurred. In particular, it is possible that a shift from exclusive N-type channel participation in GABA release to partial P/Q-type channel participation may have occurred in these neurons. To test this concept, sIPSCs were measured before and during incubation in medium containing the selective P/Q-type channel blocker ω-agatoxin-IVa. As shown in Figure 4D and Table 4, the blockade of P/Q-type channels did not exert a significant effect on group analysis of sIPSCs in either control or normotopic neurons. Pairwise comparisons of individual cells before and after treatment revealed that only one of five tested control and normotopic cells had significantly reduced frequency (K-S test). Although sIPSC amplitude was found to be significantly affected, this may partially result from run down of the cell during the long incubation with the toxin. These findings indicate that P/Q-type channels do not participate substantially in regulating GABA release from terminals innervating layer V pyramidal cells and that a shift of calcium channel types responsible for GABA release did not occur in the interneurons innervating tish normotopic neurons.
Table 4.
Effect of agatoxin on sIPSC properties
| Standard medium | Plus agatoxin | |
|---|---|---|
| Control | ||
| Frequency (Hz) | 5.05 ± 1.98 | 4.55 ± 1.68 |
| Amplitude (pA) | 49.7 ± 5.7 | 38.6 ± 4.1 |
| n | 5 | 5 |
| Normotopic | ||
| Frequency (Hz) | 3.02 ± 0.96 | 2.73 ± 1.04 |
| Amplitude (pA) | 40.6 ± 4.1 | 36.1 ± 5.2 |
| n | 5 | 5 |
| Heterotopic | ||
| Frequency (Hz) | 1.73 ± 0.29 | 1.71 ± 0.26 |
| Amplitude (pA) | 55.0 ± 10.0 | 51.1 ± 10.1 |
| n | 5 | 5 |
Reduction in GABAergic terminals on normotopic layer V pyramidal neurons
The observations of reduced frequencies of mIPSCs and sIPSCs in tish normotopic neurons implicated a presynaptic disturbance in GABAergic neurotransmission. A plausible explanation for this type of change is that fewer GABAergic terminals were making synapses onto normotopic neurons. To test this concept, immunohistochemical techniques were used to visualize the expression of GAD-65 in control and tish neocortices. GAD-65 is the rate-limiting enzyme in GABA production and is concentrated in the terminals and occasional cell bodies of GABAergic interneurons.
In control animals, GAD-65 displayed intense immunoreactivity within layer V of the neocortex surrounding pyramidal somata (Fig. 5A). In addition to the perisomatic labeling of large pyramidal cells, other smaller cells, which were scattered throughout the neocortex, exhibited GAD-65 immunoreactivity within their in their somata (Fig. 5A, arrowhead). These latter cells represented presumptive GABAergic interneurons. To visualize the location of GABAergic terminals with respect to layer V pyramidal cell bodies, sections were double labeled with both GAD-65 and anti-NeuN (Fig. 5C). GAD-65 demonstrated intense punctate immunoreactivity surrounding pyramidal neurons of layer V of control tissue (Fig. 5B,D). This labeling corresponded to the location of terminals from GABAergic interneurons innervating the somata of layer V pyramidal neurons. The neuropil in the vicinity of the labeled cell bodies also demonstrated punctate GAD-65 immunoreactivity.
Figure 5.
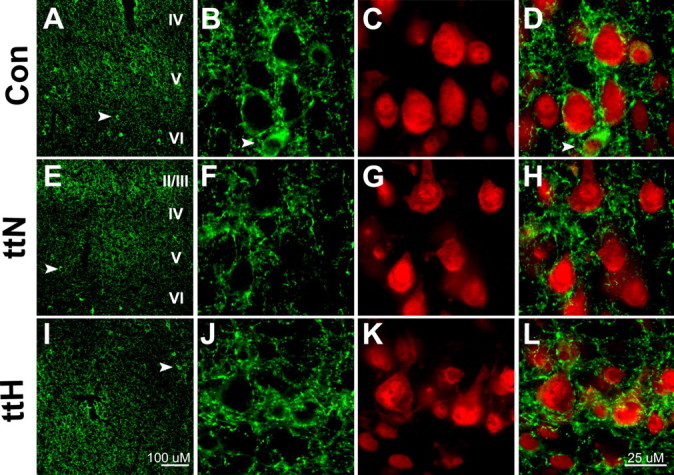
GABAergic terminal plexuses surrounding pyramidal cells appear reduced in the tish cortex. GAD-65 immunoreactivity (green) was used to visualize GABAergic terminals, and NeuN immunoreactivity (red) was used to visualize neuronal nuclei. A, In control (Con) neocortex, GAD-65 immunoreactivity exhibits strong labeling surrounding layer V pyramidal cells. B–D, Higher magnification of the control cortex shows dense punctuate GAD-65 immunoreactivity surrounding layer V pyramidal neurons, which are labeled with NeuN. E, In the tish normotopic cortex, less intense GAD-65 immunoreactivity is observed in layer V compared with the control cortex (A). F–H, Higher magnification of the normotopic cortex reveals less dense and more dispersed GAD-65 labeling in the vicinity of layer V neurons compared with the control cortex (B, D). I, In the tish heterotopic cortex, GAD-65 labeling demonstrates an overall patchy pattern of immunoreactivity, consistent with the lack of laminar organization within the heterotopia. J–L, Higher magnification of the heterotopia demonstrates that some large pyramidal neurons are surrounded by punctate GAD-65 terminals. Arrowheads indicate smaller cell bodies that are GAD-65 immunoreactive, representing presumed interneurons. Scale bars: A, E, I, 100 μm; B–D, F–H, J–L, 25 μm. Con, Control; ttN, tish normotopic; ttH, tish heterotopic.
The intensity of GAD-65 immunoreactivity in layer V of the tish normotopic cortex was reduced relative to that observed in control tissue (Fig. 5E). GAD-65-immunoreactive (IR) terminals surrounding layer V pyramidal neurons displayed dispersed, punctate immunoreactivity that was less intense than that seen surrounding control layer V cells (Fig. 5F,H). The reduced perisomatic labeling in the tish cortex is consistent with a reduction in the number of GABAergic terminals innervating layer V pyramidal neurons, although a reduction in immunogenicity and/or size of individual terminals cannot be ruled out. Interestingly, there appeared to be fewer small cells exhibiting prominent GAD-65 immunoreactivity within their somata in the tish normotopic cortex (Fig. 5E, arrowhead), suggesting that a reduction in GABAergic interneurons could have occurred.
Altered distribution of interneurons in normotopic cortex
Multiple classification schemes have been developed to describe distinct interneuron populations in the cortex using morphological, electrophysiological, and immunohistochemical profiles (Kawaguchi and Kubota, 1997; Butt et al., 2005). A reduction in GAD-65-positive cells in the tish normotopic cortex could reflect an overall reduction in interneurons, a selective reduction in one or more interneuron subtype, and/or an attenuation of immunogenicity for GAD-65 in one or more type of interneuron. To examine these issues, we used a previously described classification system that identified three discrete interneuron populations based on their selective expression of the following markers: parvalbumin, somatostatin, and cholecystokinin (Kawaguchi and Kondo, 2002).
Parvalbumin-IR interneurons, which include the basket cells that innervate layer V pyramidal cell somata, were found throughout the control neocortex. In control animals, cells were concentrated in layers II/III–VI, with fewer cells in upper layer II and layer I. A plexus of labeling was observed in the neuropil of layer V with a less prominent plexus present in neuropil of layer IV and the deeper aspect of layer II/III (Fig. 6A). The tish normotopic cortex also demonstrated parvalbumin immunoreactivity; however fewer cells appeared to be labeled relative to control cortex (Fig. 6B). Quantification of parvalbumin-IR cell bodies revealed a significant 43% reduction in normotopic neocortex (n = 10) compared with control neocortex (n = 6, p < 0.001) (Fig. 6D). In addition, the parvalbumin-IR plexus in the neuropil of layer V of the tish normotopic area was less intense than in control neocortex.
Figure 6.

Altered distribution of interneurons in the tish brain. A–C, Parvalbumin immunoreactivity in control and tish neocortices. A, Parvalbumin-IR cell bodies are distributed throughout layers II–VI in the control cortex. Neuropil labeling is seen in layers III–IV and around large pyramidal cells in layer V. B, In the tish normotopic cortex, parvalbumin-IR cell bodies are present in layers II–VI; however, the density of cells appears substantially reduced, and neuropil immunoreactivity is attenuated. In addition, labeled cells in the normotopic somatosensory cortex demonstrated a less even laminar distribution compared with the control cortex, characterized by regions of higher cell density adjacent to regions of lower cell density. C, The heterotopia displays parvalbumin-IR cell bodies distributed throughout its depth with occasional strong neuropil labeling in the rim region (arrowhead). Arrows denote the white matter above and below the heterotopia. D, Quantification of parvalbumin-IR cell bodies demonstrates a significant reduction in the tish normotopic and tish heterotopic regions of the tish brain compared with control. **p < 0.01,*** p < 0.001 (Student's t test). E–G, Somatostatin immunoreactivity in control and tish neocortices. E, F, Somatostatin-IR cell bodies are distributed throughout layers II–VI of control and tish normotopic neocortices. G, The heterotopia display somatostatin-IR cell bodies distributed throughout the structure. H, Quantification of somatostatin-IR cell bodies demonstrates similar numbers of cells in all groups (Student's t test). I–K, Cholecystokinin immunoreactivity in control and tish neocortices. I, J, Cholecystokinin-IR cell bodies in control and tish normotopic cortex are present in layers II–III with occasional cell bodies in layers V and VI. Strong neuropil labeling was present in layers IV and VI, which likely represents thalamic afferent terminal fields. K, Cholecystokinin-IR cell bodies are distributed randomly throughout the heterotopia. Patchy areas of neuropil labeling are evident in the heterotopia, and these regions are located directly subjacent to the regions of neuropil labeling within the normotopic neocortex. L, Quantification of cholecystokinin-IR cell bodies demonstrates that the numbers of cells did not differ significantly among groups (Student's t test). Values represent mean ± SEM. Scale bar, 250 μm. Con, Control; ttN, tish normotopic; ttH, tish heterotopic.
Somatostatin-IR and cholecystokinin-IR cells were dispersed across the control neocortex and were present at lower densities than parvalbumin-IR cells (Fig. 6E,I). The distribution of somatostatin-IR and cholecystokinin-IR cells did not appear to differ substantially between tish control cortex and normotopic cortex, and cell counting confirmed this observation (Fig. 6E,F,H–J,L). The diffuse plexus of cholecystokinin immunoreactivity observed in the deep layers of the control cortex appeared attenuated in the deep layers of the normotopic tish neocortex.
Together, the observations of the preceding immunohistochemical and electrophysiological studies indicated that synaptic inputs from GABAergic interneurons onto layer V pyramidal neurons were diminished in the tish normotopic cortex and that this may have been the result of a selective loss of a specific subtype of interneuron. A key remaining issue is whether similar types of changes occurred in the heterotopic area of the tish neocortex.
GABAA receptor-mediated synaptic transmission is altered in heterotopic neurons
Although certain evidence indicates that neurons in the normotopic area of the tish cortex provide a key proconvulsant influence on neocortical circuitry (Chen et al., 2000), a similar role for heterotopic neurons is conceivable. Consequently, we investigated inhibitory synaptic transmission and interneuronal structure and function in cortical heterotopia. The efficacy of inhibitory synaptic transmission onto heterotopic pyramidal neurons was reduced compared with that observed in control layer V neurons. As described above (Fig. 1), morphological identification of the large pyramidal neurons in the heterotopic area of the tish cortex was confirmed by analyzing the appearance of recorded cells with biocytin labeling. Qualitative assessments of sIPSCs recorded from large heterotopic pyramidal neurons suggested a subtle reduction in frequency and amplitude (Fig. 2A). Quantitative analyses of group data revealed a significant 37% reduction in sIPSCs frequency, with a modest but nonsignificant 17% reduction in sIPSC amplitude (Fig. 2B, Table 1). In addition, there was a reduction in mIPSC frequency, but not amplitude, in heterotopic pyramidal neurons compared with control neurons (Fig. 2A,B; Table 1).
When the probability of transmitter release was enhanced by lowering Mg2+ and increasing Ca2+ in the medium, the frequency of sIPSCs in heterotopic neurons was increased by 38%. However, the magnitude of the increase in sIPSC frequency in heterotopic neurons was considerably less than that observed in control cells under similar conditions (Fig. 3A,B; Table 2). Blockade of N-type calcium channels with ω-conotoxin-GVIa significantly reduced sIPSC frequency in heterotopic neurons to a value comparable to mIPSC frequency (Fig. 4, Table 3). The magnitude of the reduction in sIPSC frequency in heterotopic neurons in response to N-channel blockade was similar to that observed in control neurons (39 and 38%, respectively). Blockade of P/Q channels with ω-agatoxin-IVa did not alter the frequency of sIPSCs recorded from heterotopic neurons (Fig. 4D). Together, these findings indicated that inhibitory synaptic transmission onto large heterotopic pyramidal neurons was somewhat weaker than that observed in large pyramidal neurons in layer V of control tissue.
Reduced GABAergic terminals on heterotopic pyramidal neurons
GABAergic terminals were examined in the tish heterotopia using an antibody against GAD-65 as described in control and tish normotopic neocortex. The more scattered and unlaminated distribution of large pyramidal neurons in the tish heterotopic region rendered immunohistochemical examination of neuropil labeling more difficult and equivocal than in the laminated cortices. Regions of strong immunoreactivity were adjacent to regions of weak immunoreactivity, lending a patchy appearance to the heterotopia. Nonetheless, it was possible to identify large pyramidal cells in the heterotopia and to examine GAD-65 immunoreactivity in the vicinity of these cells. As in the laminated structures, GAD-65-IR puncta were observed surrounding the somata of large pyramidal cells in the heterotopia (Fig. 5I–L). The intensity of the GAD-65 immunoreactivity appeared more diffuse around the heterotopic pyramidal neurons compared with control, but not as weak as that observed surrounding the tish normotopic layer V neurons (Fig. 5B,F,J). Smaller cell bodies that were strongly GAD-65 immunoreactive (presumptive interneurons) were observed scattered in the heterotopia (Fig. 5I, arrowhead).
Interneuron distribution in the tish heterotopia
Interneurons were examined as described above, based on the presence of parvalbumin, cholecystokinin, and somatostatin. Parvalbumin-IR cells were numerous in the heterotopia, however the cells were not evenly distributed but were collected in patches rather than in distinct layers as in control cortex (Fig. 6A,C). Quantification of parvalbumin-IR cells in the heterotopia revealed a significant 32% reduction (n = 10) compared with control (n = 6; p < 0.01) (Fig. 6D). Interestingly, large cells and plexuses were found in the rim region of the heterotopia (Fig. 6C, arrowhead). In contrast, the somatostatin-IR and cholecystokinin-IR cell bodies were found distributed randomly throughout the depth of the heterotopia (Fig. 6G,K). Patchy areas of cholecystokinin immunoreactivity were seen in regions of the heterotopia and were located subjacent to regions of strong neuropil labeling in the overlying normotopic cortex (e.g., topographic expression of cholecystokinin immunoreactivity is preserved in the heterotopia) (Fig. 6J,K). However, the neuropil labeled in patches in the heterotopia, rather than in laminas as in control and normotopic cortices. Thus, all three subtypes of interneurons were present in the heterotopia of the tish brain, but their distribution appeared more random than in the laminated areas of the neocortex. A profound reduction in parvalbumin-positive cells, such as that observed in the normotopic area of the tish cortex, was not seen in the heterotopia. However, GABAergic terminal density appeared slightly reduced based on the more diffuse GAD65 immunoreactivity surrounding large pyramidal neurons in the heterotopia.
Discussion
This study demonstrates that defects in GABAergic synaptic transmission occur before seizure onset in a seizure-prone, dysplastic brain. Diminished synaptic inhibition of layer V pyramidal cells in the normotopic cortex of the malformed tish brain is supported by the following evidence: (1) sIPSCs and mIPSCs are less frequent, and sIPSCs are smaller in amplitude; (2) large-amplitude, multi-vesicle, multi-synapse events are not observed in normotopic sIPSC amplitude histograms; (3) increasing presynaptic release probability does not rescue normotopic sIPSC frequency or amplitude to control values; (4) quantal size is unchanged; (5) calcium channels responsible for vesicle release from cortical interneurons are expressed and are functional within the terminals in the tish brain; (6) the density of presynaptic GABAergic terminals onto postsynaptic layer V pyramidal neurons is reduced; and (7) a subpopulation of interneuron in the normotopic neocortex is reduced.
The exact location(s) of the disturbances responsible for the reduction in GABA release are not known. Possibilities include abnormalities in the vesicle release machinery at release sites, reduced probability of release, reduced numbers of release sites per terminal, reduced numbers of terminals per interneuron, and reduced numbers of interneurons with normal numbers of terminals. This study examined three potential anomalies responsible for the diminished synaptic inhibition of layer V pyramidal cells.
One possible abnormality responsible for reduced synaptic inhibition in normotopic tish cortex is that there are fewer multi-terminal, multi-quantal events elicited in layer V pyramidal cells. This provides one explanation for the lack of a strong response to ω-conotoxin-GVIa in normotopic neurons, whereby fewer interneuron terminals with N-type calcium channels are synapsing onto the postsynaptic neuron and thus provide fewer targets for the toxin to act on. In a normal neuron, an action potential in the presynaptic cell causes multiple terminals to release multiple vesicles with a given quantal content of transmitter into the synapse. When the probability of release is increased, larger numbers of quanta are released from a release site, which can bind postsynaptic receptors and elicit a larger postsynaptic current. This basic effect was demonstrated in the present study by the recruitment of a fifth, large-amplitude peak in the sIPSC amplitude distribution histograms from control neurons (Fig. 3D, Con). However, in the normotopic cortex, there appear to be fewer inhibitory synaptic terminals on the soma of the postsynaptic cell; therefore, only a limited number of quanta can be released in a simultaneous manner, activating a smaller proportion of receptors and generating a smaller postsynaptic current. This is supported by the absence of the largest multi-quantal peak in the normotopic sIPSC amplitude distribution histogram (Fig. 3D, ttN). This concept is further reinforced by immunohistochemical evidence of reduced GABAergic terminal density surrounding layer V cortical neurons in the tish normotopic cortex.
A second, nonexclusive abnormality contributing to diminished synaptic inhibition in tish normotopic cortex is a reduction in a subtype of inhibitory interneuron. Our immunohistochemical evidence shows that the distribution of parvalbumin-IR interneurons is disturbed in the tish brain, such that the normotopic cortex contains fewer interneurons than control cortex. Altered interneuron distribution appears to be a common feature in brains with malformations (Ferrer et al., 1994; Mathern et al., 1995; Jacobs et al., 1996; Marco et al., 1996; Hablitz and DeFazio, 1998; Rosen et al., 1998; Spreafico et al., 1998; Roper et al., 1999; Schwarz et al., 2000; Choi et al., 2005). Consequently, the questions of how different interneuron populations find or do not find their final cortical destinations and survive or perish during early development are critical issues to explore. Recent studies have characterized the tangential migration of interneurons from their birthplace, the ganglionic eminences, into the cortical plate (Nery et al., 2002; Xu et al., 2004). Using fate-mapping of the medial ganglionic eminence (MGE) and caudal ganglionic eminence (CGE) of the mouse, (Butt et al. 2005) demonstrated that the MGE and CGE give rise to distinct subpopulations of interneurons. They also noted that transplants of later-born cells from the CGE give rise to interneurons with unique characteristics from the early-born cells. Thus, specific spatial and temporal cues determine interneuron subtype. Other studies have focused on the stratification of interneurons within the cortex, identifying birthdate as a powerful determinant of lamination in the cortical plate (Anderson, 2002; Valcanis and Tan, 2003). Therefore, the temporal and spatial cues that guide interneurons to their adult positions are different for subtypes of interneurons, and changes in certain cues can cause a selective alteration in the destiny of specific interneuron populations.
Finally, a third possibility is that GABAergic terminals onto layer V pyramidal neurons in the normotopic tish cortex possess abnormal release mechanisms. In tish normotopic pyramidal cells, action potential-related synaptic currents recorded under standard conditions do not demonstrate large-amplitude events indicative of the release of multiple GABA-containing vesicles. Experimentally increasing the probability of vesicle release from terminals only slightly increased the frequency of sIPSCs and did not elicit the large, multi-quantal amplitude events seen in control neurons under the same conditions. Thus, even when the circumstances are maximized for vesicle release, the terminal is incapable of eliciting massive vesicular release, indicating that the release machinery may be malfunctioning.
Abnormal calcium channel function in GABAergic terminals and/or abnormal release machinery distal to calcium channels could be responsible for the lack of a response to increased release probability. We examined calcium channel function by blocking N-type calcium channels, the major voltage-activated calcium channel in interneuron terminals responsible for vesicle release (Timmermann et al., 2002). Both control and normotopic neurons exhibited reductions in sIPSC frequency and amplitude, indicating the presence of functional N-type calcium channels. However, the magnitude of this reduction was less in normotopic neurons than in control neurons. We interpret this lack of a robust response to be attributable to a floor effect present in the normotopic recordings. The amplitude and frequency of sIPSCs recorded from normotopic neurons are already close to the values obtained from mIPSC recordings. The toxin can only reduce the sIPSC measurements to the level of mIPSCs, and this small effect is lost when the data are averaged. Nonetheless, K-S tests of individual cell sIPSC amplitudes and interevent intervals (frequency) reveal that the reduction in these measures in the presence of ω-conotoxin-GVIa is significant. Therefore, N-type calcium channels are functioning in normotopic interneuron terminals. An abnormality in release machinery distal to calcium entry to terminals may therefore be responsible for the reduced release of multiple vesicles.
We also examined the heterotopia of the tish brain for changes in inhibitory function and found reduced GABAergic synaptic transmission. As mentioned previously, the heterotopia displays no obvious layering; thus, targeting equivalent pyramidal cells for comparison to control layer V pyramidal cells was more difficult. We carefully selected cells for recording based on three selection criteria to provide a consistent protocol for choosing cells for experimentation. First, the neuron must possess a large pyramidal soma with a prominent dendrite. Whether or not the dendrite pointed apically was not a point of concern, because it has already been established that orientation of pyramidal cells within the heterotopia is inconsistent (Lee et al., 1997). Second, the neuron must be located within the “rim” region of the heterotopia. Lee et al. 1998) demonstrated that the neurogenetic gradient follows a “rim-to-core” rather than “inside-out” pattern, such that the earlier-born layer VI and V cells should be located in the rim area of the heterotopia. Moreover, Schottler et al. 1998) demonstrated that heterotopic corticospinal neurons are concentrated within the rim region of the heterotopia. The third criterion occurred post hoc when morphological observations were performed on biocytin-filled cells (Fig. 1). Filled neurons that did not display an obvious pyramidal morphology were not included in data analyses. IPSC measurements were variable with some heterotopic cells demonstrating IPSC values that even exceeded control values. Nonetheless, an overall reduction in GABAergic inhibitory drive on heterotopic neurons was demonstrated, which appeared to be intermediate to the prominent reduction in normotopic neurons (Fig. 2).
In summary, this study demonstrates reduced GABAergic synaptic inhibition in a seizure-prone animal model of cortical malformation. Studies performed in humans and other animal models have implicated disruptions in the GABAergic system in seizure activity. These disruptions include altered inhibitory drive (Smith et al., 1999; Zhu and Roper, 2000; Calcagnotto et al., 2002), alterations in GABA interneuron populations (Ferrer et al., 1994; Mathern et al., 1995; Jacobs et al., 1996; Marco et al., 1996; Hablitz and DeFazio, 1998; Rosen et al., 1998; Spreafico et al., 1998; Roper et al., 1999; Schwarz et al., 2000), changes in GABAA receptor subunits (DeFazio and Hablitz, 1999; Loup et al., 2000; Redecker et al., 2000; Coulter, 2001; Crino et al., 2001; White et al., 2001; Palma et al., 2005), and changes in GABA reuptake transporters (Calcagnotto et al., 2002, 2005). An important remaining question is what events precipitate the onset of seizures against this background of reduced inhibition. The most obvious candidates involve the postnatal development of excitatory mechanisms, which are normally choreographed with inhibitory development (Ben Ari et al., 1997). However, any of a variety of acute stresses to the regulation of neural activity could also conceivably serve to trigger seizure onset. A key finding of our study is that inhibitory failure of GABAergic innervation of primary cortical neurons actually precedes the onset of seizures. This type of disturbance thus provides not only a mechanism for ongoing seizure activity but represents a rational substrate for epileptogenesis in a dysplastic brain.
Footnotes
This work was supported by National Institutes of Health Grants NS34124, NS040337, NS44370, NS049727, and T32 GM 008328.
Reference
- Ali AB, Nelson C. Distinct Ca2+ channels mediate transmitter release at excitatory synapses displaying different dynamic properties in rat neocortex. Cereb Cortex. 2006;16:386–393. doi: 10.1093/cercor/bhi117. [DOI] [PubMed] [Google Scholar]
- Anderson SA. Determination of cell fate within the telencephalon. Chem Senses. 2002;27:573–575. doi: 10.1093/chemse/27.6.573. [DOI] [PubMed] [Google Scholar]
- Avoli M, Bernasconi A, Mattia D, Olivier A, Hwa GG. Epileptiform discharges in the human dysplastic neocortex: in vitro physiology and pharmacology. Ann Neurol. 1999;46:816–826. doi: 10.1002/1531-8249(199912)46:6<816::aid-ana3>3.0.co;2-o. [DOI] [PubMed] [Google Scholar]
- Avoli M, Louvel J, Mattia D, Olivier A, Esposito V, Pumain R, D'Antuono M. Epileptiform synchronization in the human dysplastic cortex. Epileptic Disord. 2003;5:S45–S50. [PubMed] [Google Scholar]
- Avoli M, Louvel J, Pumain R, Kohling R. Cellular and molecular mechanisms of epilepsy in the human brain. Prog Neurobiol. 2005;77:166–200. doi: 10.1016/j.pneurobio.2005.09.006. [DOI] [PubMed] [Google Scholar]
- Barkovich AJ, Raybaud CA. Malformations of cortical development. Neuroimaging Clin N Am. 2004;14:401–423. doi: 10.1016/j.nic.2004.04.003. [DOI] [PubMed] [Google Scholar]
- Barkovich AJ, Kuzniecky RI, Dobyns WB, Jackson GD, Becker LE, Evrard P. A classification scheme for malformations of cortical development. Neuropediatrics. 1996;27:59–63. doi: 10.1055/s-2007-973750. [DOI] [PubMed] [Google Scholar]
- Ben Ari Y, Khazipov R, Leinekugel X, Caillard O, Gaiarsa JL. GABAA, NMDA and AMPA receptors: a developmentally regulated “menage a trios.”. Trends Neurosci. 1997;20:523–529. doi: 10.1016/s0166-2236(97)01147-8. [DOI] [PubMed] [Google Scholar]
- Butt SJ, Fuccillo M, Nery S, Noctor S, Kriegstein A, Corbin JG, Fishell G. The temporal and spatial origins of cortical interneurons predict their physiological subtype. Neuron. 2005;48:591–604. doi: 10.1016/j.neuron.2005.09.034. [DOI] [PubMed] [Google Scholar]
- Calcagnotto ME, Paredes MF, Baraban SC. Heterotopic neurons with altered inhibitory synaptic function in an animal model of malformation-associated epilepsy. J Neurosci. 2002;22:7596–7605. doi: 10.1523/JNEUROSCI.22-17-07596.2002. [DOI] [PMC free article] [PubMed] [Google Scholar]
- Calcagnotto ME, Paredes MF, Tihan T, Barbaro NM, Baraban SC. Dysfunction of synaptic inhibition in epilepsy associated with focal cortical dysplasia. J Neurosci. 2005;25:9649–9657. doi: 10.1523/JNEUROSCI.2687-05.2005. [DOI] [PMC free article] [PubMed] [Google Scholar]
- Chen ZF, Schottler F, Bertram E, Gall CM, Anzivino MJ, Lee KS. Distribution and initiation of seizure activity in a rat brain with subcortical band heterotopia. Epilepsia. 2000;41:493–501. doi: 10.1111/j.1528-1157.2000.tb00201.x. [DOI] [PubMed] [Google Scholar]
- Choi IS, Cho JH, Lee MG, Choi BJ. Pilocarpine-induced seizure susceptibility in rats following prenatal methylazoxymethanol treatment. Biol Pharm Bull. 2005;28:1408–1413. doi: 10.1248/bpb.28.1408. [DOI] [PubMed] [Google Scholar]
- Connors BW, Telfeian AE. Dynamic properties of cells, synapses, circuits, and seizures in neocortex. Adv Neurol. 2000;84:141–152. [PubMed] [Google Scholar]
- Coulter DA. Epilepsy-associated plasticity in gamma-aminobutyric acid receptor expression, function, and inhibitory synaptic properties. Int Rev Neurobiol. 2001;45:237–252. doi: 10.1016/s0074-7742(01)45013-6. [DOI] [PubMed] [Google Scholar]
- Crino PB, Duhaime AC, Baltuch G, White R. Differential expression of glutamate and GABA-A receptor subunit mRNA in cortical dysplasia. Neurology. 2001;56:906–913. doi: 10.1212/wnl.56.7.906. [DOI] [PubMed] [Google Scholar]
- DeFazio RA, Hablitz JJ. Reduction of zolpidem sensitivity in a freeze lesion model of neocortical dysgenesis. J Neurophysiol. 1999;81:404–407. doi: 10.1152/jn.1999.81.1.404. [DOI] [PubMed] [Google Scholar]
- Edwards FA, Konnerth A, Sakmann B. Quantal analysis of inhibitory synaptic transmission in the dentate gyrus of rat hippocampal slices: a patch-clamp study. J Physiol (Lond) 1990;430:213–249. doi: 10.1113/jphysiol.1990.sp018289. [DOI] [PMC free article] [PubMed] [Google Scholar]
- Ferrer I, Oliver B, Russi A, Casas R, Rivera R. Parvalbumin and calbindin-D28k immunocytochemistry in human neocortical epileptic foci. J Neurol Sci. 1994;123:18–25. doi: 10.1016/0022-510x(94)90198-8. [DOI] [PubMed] [Google Scholar]
- Guerrini R, Filippi T. Neuronal migration disorders, genetics, and epileptogenesis. J Child Neurol. 2005;20:287–299. doi: 10.1177/08830738050200040401. [DOI] [PubMed] [Google Scholar]
- Hablitz JJ, DeFazio T. Excitability changes in freeze-induced neocortical microgyria. Epilepsy Res. 1998;32:75–82. doi: 10.1016/s0920-1211(98)00041-2. [DOI] [PubMed] [Google Scholar]
- Jacobs KM, Gutnick MJ, Prince DA. Hyperexcitability in a model of cortical maldevelopment. Cereb Cortex. 1996;6:514–523. doi: 10.1093/cercor/6.3.514. [DOI] [PubMed] [Google Scholar]
- Kawaguchi Y, Kondo S. Parvalbumin, somatostatin and cholecystokinin as chemical markers for specific GABAergic interneuron types in the rat frontal cortex. J Neurocytol. 2002;31:277–287. doi: 10.1023/a:1024126110356. [DOI] [PubMed] [Google Scholar]
- Kawaguchi Y, Kubota Y. GABAergic cell subtypes and their synaptic connections in rat frontal cortex. Cereb Cortex. 1997;7:476–486. doi: 10.1093/cercor/7.6.476. [DOI] [PubMed] [Google Scholar]
- Lee K, Schottler F, Anzivino MH, Collins JL, Frankel EA, Chen ZF, Bertram E, Zai L. Neuronal development in the tish rat. In: Spreafico R, Avanzini G, Andermann F, editors. Abnormal cortical development and epilepsy: from basic to clinical science. Eastleigh, UK: John Libbey; 1999. pp. 145–157. [Google Scholar]
- Lee KS, Schottler F, Collins JL, Lanzino G, Couture D, Rao A, Hiramatsu K, Goto Y, Hong SC, Caner H, Yamamoto H, Chen ZF, Bertram E, Berr S, Omary R, Scrable H, Jackson T, Goble J, Eisenman L. A genetic animal model of human neocortical heterotopia associated with seizures. J Neurosci. 1997;17:6236–6242. doi: 10.1523/JNEUROSCI.17-16-06236.1997. [DOI] [PMC free article] [PubMed] [Google Scholar]
- Lee KS, Collins JL, Anzivino MJ, Frankel EA, Schottler F. Heterotopic neurogenesis in a rat with cortical heterotopia. J Neurosci. 1998;18:9365–9375. doi: 10.1523/JNEUROSCI.18-22-09365.1998. [DOI] [PMC free article] [PubMed] [Google Scholar]
- Loup F, Wieser HG, Yonekawa Y, Aguzzi A, Fritschy JM. Selective alterations in GABAA receptor subtypes in human temporal lobe epilepsy. J Neurosci. 2000;20:5401–5419. doi: 10.1523/JNEUROSCI.20-14-05401.2000. [DOI] [PMC free article] [PubMed] [Google Scholar]
- Marco P, Sola RG, Pulido P, Alijarde MT, Sanchez A, Cajal SRY, DeFelipe J. Inhibitory neurons in the human epileptogenic temporal neocortex - an immunocytochemical study. Brain. 1996;119:1327–1347. doi: 10.1093/brain/119.4.1327. [DOI] [PubMed] [Google Scholar]
- Mathern GW, Babb TL, Pretorius JK, Leite JP. Reactive synaptogenesis and neuron densities for neuropeptide Y, somatostatin, and glutamate decarboxylase immunoreactivity in the epileptogenic human fascia dentata. J Neurosci. 1995;15:3990–4004. doi: 10.1523/JNEUROSCI.15-05-03990.1995. [DOI] [PMC free article] [PubMed] [Google Scholar]
- Mattia D, Olivier A, Avoli M. Seizure-like discharges recorded in human dysplastic neocortex maintained in vitro. Neurology. 1995;45:1391–1395. doi: 10.1212/wnl.45.7.1391. [DOI] [PubMed] [Google Scholar]
- Najm I, Ying Z, Babb T, Crino PB, Macdonald R, Mathern GW, Spreafico R. Mechanisms of epileptogenicity in cortical dysplasias. Neurology. 2004;62:S9–S13. doi: 10.1212/01.wnl.0000114506.49267.bb. [DOI] [PubMed] [Google Scholar]
- Nery S, Fishell G, Corbin JG. The caudal ganglionic eminence is a source of distinct cortical and subcortical cell populations. Nat Neurosci. 2002;5:1279–1287. doi: 10.1038/nn971. [DOI] [PubMed] [Google Scholar]
- Palma E, Spinelli G, Torchia G, Martinez-Torres A, Ragozzino D, Miledi R, Eusebi F. Abnormal GABAA receptors from the human epileptic hippocampal subiculum microtransplanted to Xenopus oocytes. Proc Natl Acad Sci USA. 2005;102:2514–2518. doi: 10.1073/pnas.0409687102. [DOI] [PMC free article] [PubMed] [Google Scholar]
- Paxinos G, Watson C. San Diego: Academic; 1998. The rat brain in stereotaxic coordinates. [DOI] [PubMed] [Google Scholar]
- Redecker C, Luhmann HJ, Hagemann G, Fritschy JM, Witte OW. Differential downregulation of GABAA receptor subunits in widespread brain regions in the freeze-lesion model of focal cortical malformations. J Neurosci. 2000;20:5045–5053. doi: 10.1523/JNEUROSCI.20-13-05045.2000. [DOI] [PMC free article] [PubMed] [Google Scholar]
- Reid SA, Palovcik RA. Spontaneous epileptiform discharges in isolated human cortical slices from epileptic patients. Neurosci Lett. 1989;98:200–204. doi: 10.1016/0304-3940(89)90510-7. [DOI] [PubMed] [Google Scholar]
- Roper SN, Eisenschenk S, King MA. Reduced density of parvalbumin- and calbindin D28k-immunoreactive neurons in experimental cortical dysplasia. Epilepsy Res. 1999;37:63–71. doi: 10.1016/s0920-1211(99)00035-2. [DOI] [PubMed] [Google Scholar]
- Rorke LB. A perspective: the role of disordered genetic control of neurogenesis in the pathogenesis of migration disorders. J Neuropathol Exp Neurol. 1994;53:105–117. doi: 10.1097/00005072-199403000-00001. [DOI] [PubMed] [Google Scholar]
- Rosen GD, Jacobs KM, Prince DA. Effects of neonatal freeze lesions on expression of parvalbumin in rat neocortex. Cereb Cortex. 1998;8:753–761. doi: 10.1093/cercor/8.8.753. [DOI] [PubMed] [Google Scholar]
- Schottler F, Couture D, Rao A, Kahn H, Lee KS. Subcortical connections of normotopic and heterotopic neurons in sensory and motor cortices of the tish mutant rat. J Comp Neurol. 1998;395:29–42. [PubMed] [Google Scholar]
- Schottler F, Fabiato H, Leland JM, Chang LY, Lotfi P, Getachew F, Lee KS. Normotopic and heterotopic cortical representations of mystacial vibrissae in rats with subcortical band heterotopia. Neuroscience. 2001;108:217–235. doi: 10.1016/s0306-4522(01)00395-5. [DOI] [PubMed] [Google Scholar]
- Schwartzkroin PA, Knowles WD. Intracellular study of human epileptic cortex: in vitro maintenance of epileptiform activity? Science. 1984;223:709–712. doi: 10.1126/science.6695179. [DOI] [PubMed] [Google Scholar]
- Schwartzkroin PA, Roper SN, Wenzel HJ. Cortical dysplasia and epilepsy: animal models. Adv Exp Med Biol. 2004;548:145–174. doi: 10.1007/978-1-4757-6376-8_12. [DOI] [PubMed] [Google Scholar]
- Schwarz P, Stichel CC, Luhmann HJ. Characterization of neuronal migration disorders in neocortical structures: loss or preservation of inhibitory interneurons? Epilepsia. 2000;41:781–787. doi: 10.1111/j.1528-1157.2000.tb00243.x. [DOI] [PubMed] [Google Scholar]
- Smith BN, Choi BJ, Roper SN, Dudek FE. Electrophysiological responses in vivo of hippocampal CA1 pyramidal neurons in an animal model of neuronal migration disorders. Dev Neurosci. 1999;21:374–384. doi: 10.1159/000017387. [DOI] [PubMed] [Google Scholar]
- Spreafico R, Pasquier B, Minotti L, Garbelli R, Kahane P, Grand S, Benabid AL, Tassi L, Avanzini G, Battaglia G, Munari C. Immunocytochemical investigation on dysplastic human tissue from epileptic patients. Epilepsy Res. 1998;32:34–48. doi: 10.1016/s0920-1211(98)00038-2. [DOI] [PubMed] [Google Scholar]
- Timmermann DB, Westenbroek RE, Schousboe A, Catterall WA. Distribution of high-voltage-activated calcium channels in cultured gamma-aminobutyric acidergic neurons from mouse cerebral cortex. J Neurosci Res. 2002;67:48–61. doi: 10.1002/jnr.10074. [DOI] [PubMed] [Google Scholar]
- Valcanis H, Tan SS. Layer specification of transplanted interneurons in developing mouse neocortex. J Neurosci. 2003;23:5113–5122. doi: 10.1523/JNEUROSCI.23-12-05113.2003. [DOI] [PMC free article] [PubMed] [Google Scholar]
- White R, Hua Y, Scheithauer B, Lynch DR, Henske EP, Crino PB. Selective alterations in glutamate and GABA receptor subunit mRNA expression in dysplastic neurons and giant cells of cortical tubers. Ann Neurol. 2001;49:67–78. doi: 10.1002/1531-8249(200101)49:1<67::aid-ana10>3.0.co;2-l. [DOI] [PubMed] [Google Scholar]
- Xu Q, Cobos I, De La CE, Rubenstein JL, Anderson SA. Origins of cortical interneuron subtypes. J Neurosci. 2004;24:2612–2622. doi: 10.1523/JNEUROSCI.5667-03.2004. [DOI] [PMC free article] [PubMed] [Google Scholar]
- Zhang ZW. Maturation of layer V pyramidal neurons in the rat prefrontal cortex: intrinsic properties and synaptic function. J Neurophysiol. 2004;91:1171–1182. doi: 10.1152/jn.00855.2003. [DOI] [PubMed] [Google Scholar]
- Zhu WJ, Roper SN. Reduced inhibition in an animal model of cortical dysplasia. J Neurosci. 2000;20:8925–8932. doi: 10.1523/JNEUROSCI.20-23-08925.2000. [DOI] [PMC free article] [PubMed] [Google Scholar]