

Abstract
CaV1.3 channels comprise a vital subdivision of L-type Ca2+ channels: CaV1.3 channels mediate neurotransmitter release from auditory inner hair cells (IHCs), pancreatic insulin secretion, and cardiac pacemaking. Fitting with these diverse roles, CaV1.3 channels exhibit striking variability in their inactivation by intracellular Ca2+. IHCs show generally weak-to-absent Ca2+-dependent inactivation (CDI), potentially permitting audition of sustained sounds. In contrast, the strong CDI seen elsewhere likely provides critical negative feedback. Here, we explore this mysterious CDI malleability, particularly its comparative weakness in hair cells. At baseline, heterologously expressed CaV1.3 channels exhibit intense CDI, wherein each lobe of calmodulin (CaM) contributes a distinct inactivation component. Because CaM-like molecules (bearing four recognizable but not necessarily functional Ca2+-binding EF hands) can perturb the Ca2+ response of molecules regulated by CaM, we asked whether such CaM-like entities could influence CDI. We find that CaM-like calcium-binding protein (CaBP) molecules are clearly expressed within the organ of Corti. In particular, the rare subtype CaBP4 is specific to IHCs, and CaBP4 proves capable of eliminating even the potent baseline CDI of CaV1.3. CaBP4 thereby represents a plausible candidate for moderating CDI within IHCs.
Keywords: FRET two-hybrid, ion-channel modulation, Ca2+ signaling, auditory, calmodulin, hair cell
Introduction
CaV1.3 (α1D) Ca2+ channels represent a functionally distinctive member of the L-type (CaV1) family of Ca2+ channels. Although long-studied CaV1.1 and CaV1.2 channel members exhibit far higher overall prevalence throughout the body, CaV1.3 channels nonetheless support critical biological functions in specific regions. For example, the comparatively hyperpolarized activation of these channels (Koschak et al., 2001; Safa et al., 2001; Xu and Lipscombe, 2001) renders them important for cardiac pacemaking (Platzer et al., 2000; Zhang et al., 2002; Mangoni et al., 2003) and for neurosecretion in auditory hair cells and pancreatic β cells (Ashcroft and Rorsman, 1989; Platzer et al., 2000; Namkung et al., 2001). These channels may also contribute to the activity-dependent development of auditory and pancreatic cells (Platzer et al., 2000; Namkung et al., 2001; Brandt et al., 2003; Glueckert et al., 2003). CaV1.3 knock-out mice therefore manifest deafness, bradycardia, and diabetic traits (Platzer et al., 2000; Namkung et al., 2001; Zhang et al., 2002; Mangoni et al., 2003; Dou et al., 2004).
Fitting with these diverse roles, the inactivation of CaV1.3 channels by intracellular Ca2+ [Ca2+-dependent inactivation (CDI)] is highly variable, reflecting tissue-specific tuning. In the sinoatrium and pancreas (Plant, 1988; Namkung et al., 2001; Zhang et al., 2002; Mangoni et al., 2003), native CaV1.3 shows strong CDI, matching the profile of heterologously expressed CaV1.3 (Xu and Lipscombe, 2001; Song et al., 2003). For hair cells, where Ca2+ current is carried mainly by CaV1.3 channels, CDI is far weaker or absent (Platzer et al., 2000; Marcotti et al., 2003; Michna et al., 2003; Schnee and Ricci, 2003; Song et al., 2003). Although unexpected from a channel mechanistic perspective, this moderation of inactivation may “enable a hair cell to respond … to a protracted stimulus … across a tonic synapse” (Kollmar et al., 1997). Because CaV1.3 triggers neurotransmitter release at the ribbon synapse linking inner hair cells and the auditory nerve (Platzer et al., 2000), stronger inactivation might induce an excessive decline of synaptic efficacy on maintained auditory stimulation. Given these biological considerations and the propensity for recombinant CaV1.3 channels to undergo CDI (Xu and Lipscombe, 2001), discernment of the mechanisms for diminished hair-cell CDI represents an interesting issue for auditory neurobiology.
This paper and its companion (Shen et al., 2006) investigated the extreme CDI malleability of CaV1.3 channels, particularly its moderation in the auditory setting. Is the CDI of these channels mediated by calmodulin (CaM), as for several other CaV1 and CaV2 Ca2+ channels (Liang et al., 2003)? Are there other mechanisms that are more amenable to modulation? How might these channels often manifest weak-to-absent CDI in auditory hair cells? Accordingly, we pursued biophysical and molecular analyses of recombinant CaV1.3 channels and found that their CDI reflects a unique variant of CaM-mediated regulation that is capable of intense inactivation. Concerning hair cells, certain CaM-like molecules, termed calcium-binding proteins (CaBPs) (Haeseleer et al., 2000), are poised to suppress CDI within inner hair cells. Our companion paper describes a complementary proposal, whereby splice variation of CaV1.3 could eliminate CDI in outer hair cells (OHCs).
Materials and Methods
Transfection of human embryonic kidney 293 cells.
Human embryonic kidney 293 (HEK293) cells were cultured in 10 cm plates, and channels were transiently transfected by a calcium phosphate protocol (Brody et al., 1997). We applied 8 μg of cDNA encoding the desired channel α1 subunit, along with 8 μg of rat brain β2a (Perez-Reyes et al., 1992) and 8 μg of rat brain α2δ subunits (Tomlinson et al., 1993). All of the above subunits were driven by a cytomegalovirus promoter. The CaV1.3 α1D subunits (see Fig. 3A) were from rat (Xu and Lipscombe, 2001), and the CaV1.2 α1C subunit was from rabbit (Wei et al., 1991). To enhance expression levels, cDNA for simian virus 40 T antigen (1–2 μg) was cotransfected. As the fluorescent transfection reporter (except in Fig. 7), the plasmid encoding β2a also contained a green fluorescent protein (GFP) sequence after an internal ribosomal-entry site (Wei et al., 2000). The β2a subunit was used throughout to minimize voltage-dependent inactivation, thus enhancing the resolution of CDI (Peterson et al., 1999). For experiments with recombinant CaM, 8 μg of cDNA encoding rat brain CaMWT, CaM12, CaM34, or CaM1234 was included with the transfections (Peterson et al., 1999). For experiments with mouse CaBP1 and CaBP4 (Haeseleer et al., 2000), 6 μg of inducible expression plasmid (pIND) vector (Invitrogen, San Diego, CA) encoding CaBP or fusions of CaBP and GFP (CaBP–GFP) was cotransfected; after recombinant channels exhibited robust currents, CaBPs were expressed for 6–8 h on induction by 1 μm muristerone A (insect hormone analog).
Figure 3.

Mutation of the CaV1.3 channel IQ segment selectively eliminates rapid CDI. A, CaV1.2 and CaV1.3 amino acid sequence alignments, covering C-terminal segments critical for CDI. Inset, Diagram of principal pore-forming α1 subunit for CaV1.2 and CaV1.3 channels (α1C and α1D, respectively) with approximate demarcation of C-terminal structural determinants underlying CDI. PreIQ3 and IQ segments are implicated in CaM/channel association. EF-hand motif (EF) seems involved in the transduction of CDI. Amino acid alignments: sequence starts with PreIQ3 segment and extends through stop codon. α1Dsh and α1Dlg are commonly found short and long splice variants of α1D, and α1Dsh(IQ/AA) is a mutant α1Dsh subunit in which double alanines have been substituted into the IQ segment as diagrammed. Dots indicate sequence identity with sequence immediately above. α1C, α1Dsh, and α1Dlg sequence numbering (far right) correspond to previously published constructs (Wei et al., 1999; Xu and Lipscombe, 2001). Shaded regions correspond to predicted helical segments by PHD (profile network from HeiDelberg) analysis. B, E, Persistence of a slowly inactivating phase of CDI within mutant CaV1.3 channels containing α1Dsh(IQ/AA) subunits. Format as in Figure 2C,E. f50 = 0.25 ± 0.04 (n = 4); f300 = 0.35 ± 0.06 (n = 4). C, F, Persistence of a slowly inactivating phase of CDI within mutant CaV1.3 channels containing α1Dsh(IQ/AA) subunits during coexpression with CaM34. Format as above in B and E. f50 = 0.15 ± 0.03 (n = 6); f300 = 0.29 ± 0.03 (n = 6). D, Complete elimination of CDI within mutant CaV1.3 channels containing α1Dsh(IQ/AA) subunits during coexpression with CaM12. Format as in B. f50 = 0.00 ± 0.00 (n = 4); f300 = 0.05 ± 0.02 (n = 4).
Figure 7.

Coexpression of CaV1.3 channels with CaBP1 or CaBP4 eliminates CDI. A, Overnight induction of CaBP1–GFP with CaV1.3 channels (α1Dsh/β2a/α2δ) eliminates CDI. Format as in Figure 1B. Charge carrier is 20 mm. f50 = 0.04 ± 0.02 (n = 5); f300 = 0.08 ± 0.04 (n = 5). B, Overnight induction of CaBP4–GFP with CaV1.3 channels (α1Dsh/β2a/α2δ) also eliminates CDI. Format as in Figure 1B. Charge carrier is 20 mm. f50 = 0.00 ± 0.01 (n = 7); f300 = 0.03 ± 0.01 (n = 7). C, Persistence of CDI in CaV1.3 current (α1Dsh/β2a/α2δ, without CaBPs) of moderate amplitude, taken from an exemplar cell. Dashed lines reproduce fits to control CaV1.3 currents expressed at generally higher levels (Fig. 1B). Charge carrier is 10 mm.
For fluorescence resonance energy transfer (FRET) two-hybrid experiments, transfections and experiments were performed as described previously (Erickson et al., 2003). Overall, HEK293 cells were thinly plated on 3.5 cm culture dishes with glass-coverslip bottoms (MaTek, Ashland, MA), and transiently transfected with FuGene 6 (Roche Biochemicals, Palo Alto, CA). FRET measurements were performed 1–2 d later.
Electrophysiology.
For recombinant channels, whole-cell patch-clamp recordings were performed 2–3 d after transfection at room temperature. The internal solution contained (in mm): 135 Cs-MeSO3, 5 CsCl, 5 EGTA, 1 MgCl2, 4 MgATP, and 5 HEPES, pH 7.3; 290 mOsm, adjusted with glucose. The bath solution contained (in mm): 140 TEA-MeSO3, 10 HEPES, pH 7.3, and 10 CaCl2 or BaCl2; 300 mOsm, adjusted with glucose. To enhance the resolution of currents in Figures 3 and 7A,B, the bath solution elevated CaCl2 or BaCl2 to 20 mm, whereas TEA-MeSO3 was adjusted downward to 117.5 mm. Currents were filtered at 2 kHz and sampled at 10 kHz; series resistance was 1–2 MΩ after >70% compensation; and leaks and capacitative transients were subtracted by a P/8 protocol. Test-pulse depolarizations were delivered every 30 s. Average data are presented as mean ± SEM, after analysis by custom software in MATLAB (The MathWorks, Natick, MA).
For native inner hair cell (IHC) Ca2+ channels, whole-cell recordings were made from IHCs in the semi-intact organ of Corti preparation dissected from cochleas of postnatal day 8–9 (P8) to P9 Sprague Dawley (Harlan Sprague Dawley, Indianapolis, IN) rats. Animal protocols were approved by the Johns Hopkins University Animal Care and Use Committee. Rats were anesthetized with pentobarbital and decapitated. Cochleas were removed, and the apical coil was excised and secured to a coverslip that was placed in the recording chamber. The preparation was viewed using a 40× water immersion differential interference contrast objective (Axioskop FS microscope, Zeiss, Oberkochen, Germany); with 4× magnification through an NC70 Newvicon camera (Dage MTI, Michigan City, IN). All recordings were made at room temperature. The internal (pipette) solution contained (in mm): 135 Cs-MeSO3, 13 TEA-Cl, 5 HEPES, pH 7.2, 3.5 MgCl2, 2.5 Na2ATP, 1 EGTA; 290 mOsm. The bath (extracellular) solution contained (in mm): 5.8 KCl, 115.5 NaCl, 0.9 MgCl2, 1.3 CaCl2, 5.6 glucose, 10 HEPES, pH 7.3, 30 TEA-Cl. In addition, 3.3 mm 4-aminopyridine, 300 nm apamin, and 3 μm tetrodotoxin were added from fresh from stocks on each experimental day. Where appropriate, 5 mm CaCl2 or 5 mm BaCl2 replaced equimolar NaCl in the extracellular solutions. Solutions were exchanged using a three-chamber local perfusion pipette placed near the IHC of interest. Solution exchange was controlled using a VC-6T Perfusion Valve Control System (Warner Instruments, Hamden, CT). Stated voltages are uncorrected for series resistance or liquid junction potential (approximately −10 mV). Nominal holding potential was −75 mV. Currents were low-pass filtered at 10 kHz and digitized at 50 kHz. Sylgard-coated, borosilicate glass electrodes were used, with resistances of 4–5 MΩ.
Molecular biology.
cDNA encoding the mutant α1Dsh(IQ/AA) subunit (see Fig. 3A) was created from α1Dsh/pcDNA6 by overlap extension PCR (Ho et al., 1989) of the IQ region (Fig. 3A), resulting in a 154-bp PCR fragment that could be cloned into α1Dsh/pcDNA6 via upstream BstE II and downstream NotI sites. For Figure 7, the C terminals of CaBP1 and CaBP4 were fused to GFP (via intermediary linker KGELILQSTVPRARDPPVAT), and the resulting fusion was cloned by NheI and XbaI sites into pIND (Invitrogen). For the FRET two-hybrid constructs (see Fig. 6), the yellow fluorescent protein (YFP)–IQC/pcDNA3 construct [enhanced YFP (EYFP) upstream of IQC segment] was made as described previously (Erickson et al., 2003). The YFP–IQD/pcDNA3 construct was made by PCR of the IQD segment (AGDDEVTVGKFYATFLIQDYFRKFKKRKEQGLVGKYP) and substituting it for CaMWT in a previously published YFP–CaMWT/pcDNA3 construct (Erickson et al., 2003), using NotI and ApaI sites. CaBP1–CFP/pECFP and CaBP4–CFP/pECFP [CaBP upstream of enhanced cyan fluorescent protein (ECFP)] were generated by PCR amplification of CaBPs and cloning into BglII and BaMH1 sites of pECFP-N3 (Invitrogen). All PCR products were verified by sequencing.
Figure 6.

CaBPs interact with the CaV1.3 IQ segment. A, FRET two-hybrid assays performed on resting live HEK293 cells coexpressing YFP–IQC with CaBP1–CFP, as schematized on the left. The right graph shows binding-curve analysis of FRET interactions. FRET strength (FR) determined for each cell (circle) is plotted versus the free relative donor (CaBP1–CFP) concentration, Dfree. Smooth curves show binding-curve fit to data, indicating a relative dissociation constant Kd,EFF = 100,000 and maximal FRET ratio FRmax = 4.5. Bar approximates 500 nm calibration (Erickson et al., 2003). B, FRET two-hybrid assays performed pairing YFP–PreIQ3-IQC-gly12-CaMWT with CaBP1–CFP. The format is as in A. Binding-curve analysis yields an ultrahigh relative dissociation constant Kd,EFF ∼ 131,000 and maximal FRET ratio FRmax = 4.5. The enormous elevation of Kd,EFF compared with A is consistent with mutually exclusive binding of CaMWT and CaBP1 to this region of the channel. C, FRET two-hybrid assays performed pairing YFP–IQD with CaBP1–CFP, with format as in A. Binding-curve analysis yields a relative dissociation constant Kd,EFF = 116,880 and maximal FRET ratio FRmax = 4.5. D, FRET two-hybrid assays performed pairing YFP–IQD with CaBP4–CFP. Format as in A. Binding-curve analysis yields a relative dissociation constant Kd,EFF = 142,272 and maximal FRET ratio FRmax = 7.8.
Reverse transcriptase PCR.
Rat (P7–P28) whole cochlear ducts were microdissected under sterile and RNAase-free conditions, quick frozen in dry ice, and stored at −80°C until use. For each experiment, two whole cochleas were solubilized in 50–100 μl Trizol reagent (Invitrogen, Gaithersburg, MA), and total RNA was obtained using the manufacturer's protocol. RNA was resuspended in 10 μl of diethylpyrocarbonate (DEPC)-treated water (Quality Biologicals, Gaithersburg, MD) and split into two tubes. We added the following to each tube: 1 μl of 2 pm gene-specific primer (CaBP1-GSP: GACATCATCCGGACAAACTCTTCAAAGTCC) or (CaBP4-GSP: GAGTTTGACACTGACCAGGATGGC); 1 μl of 10 mm dNTP; and 5 μl of DEPC-treated water. The tube was then heated at 65°C for 5 min. Subsequently, we added 4 μl of 5× first-strand buffer and 2 μl of 0.1 m dithiothreitol, and the tube was incubated at 42°C for 2 min. Next, we added 1 μl of SuperScript II RT (Invitrogen), and the samples were incubated at 42°C for 50 min and then at 70°C for 15 min. Finally, we added 1 μl of RNase H (Invitrogen) to each tube, followed by incubation at 37°C for 15 min. To avoid contamination within subsequent PCR reactions, reverse transcriptase steps (above) and PCR amplification were performed in a separate laboratory where no previous work with CaBPs had been performed. Moreover, all solutions were prepared under a laminar-flow hood to avoid aerosol contamination. PCR amplification was performed with Pfu Turbo DNA polymerase (Stratagene, La Jolla, CA), using the following parameters: 95°C for 2 min, followed by 25 amplification cycles (95°C for 30 s, 47°C for 1 min, and 72°C for 1 min), and terminated with an extension at 72°C for 10 min. The first-round PCR reaction contained the following: 2.5 μl of 10 mm dNTP, 2.5 μl of 10× Pfu buffer, 0.5 μl of Pfu Turbo (2.5 U/μl), 1 μl of first-strand cDNA, 1 μl of forward primer (10 μm stock solutions: CaBP1-F1:TTCGACAAGGACAAGGATGGCTACATC, or CaBP4-F1: GAGTTTGACACTGACCAGGATGGC), 1 μl of reverse primer (10 μm stock solution of gene-specific primers, as above), and 16.5 μl of DEPC-treated water. For CaBP4, hemi-nested PCR was performed using the same protocol but with new forward and reverse primers (10 μm stock solutions; forward, CaBP4-F2: CAGCACGTGAAGATGCGCATGGGG; reverse, CaBP4-R2: CAACATCTCATCCAGTTCAGTGCC). (See supplemental data, section 2, for overview of primer locations on CaBPs, available at www.jneurosci.org as supplemental material.) All PCR mixtures were overlaid with mineral oil.
Immunostaining of organ of Corti.
Organ of Corti sections were derived from inner ear tissue and dissected from neonatal (P9) and adult (P28) Sprague Dawley rats, with handling as approved by the Johns Hopkins Animal Care and Use Committee. Methods were similar to those used extensively for preparation and staining of tissue sections from the organ of Corti (Lustig et al., 1999; Lioudyno et al., 2004). Briefly, isolated cochleas were perfused with ice-cold 2% PLP fixative (2% paraformaldehyde, buffered with 0.1 m monobasic sodium phosphate, pH 7.4). After fixation at 4°C for 3–6 h, excess bone and connective tissue were dissected away, and specimens were rinsed in ice-cold 0.1 m phosphate buffer for 2 h. Specimens were then decalcified at 4°C for 3–5 d in 5% EDTA, buffered with 0.1 m phosphate buffer. After several rinses (1–3 h each) with fresh 0.1 m phosphate buffer, the tissue samples were cryoprotected with 30% sucrose in 0.1 m monobasic phosphate for >48 h at 4°C. The 10- to 16-μm-thick sections were layered on poly-l-lysine-treated slides (Fisher Scientific, Houston, TX) and placed with desiccant at −20°C for storage until use.
For immunostaining, slides were placed at 37°C for 15–30 min so that tissue sections would adhere to the slide surface, thereby minimizing tissue loss during the multiple washes of the staining procedure. To reduce nonspecific labeling, tissue sections were initially blocked for 1 h at room temperature in the blocking buffer (60 mm PBS, pH 7.4, supplemented with 5% normal goat serum and 0.25% Triton X-100). Rabbit anti-CaBP1 (1:3000 dilution) or anti-CaBP4 IgG (1:3000 dilution) (Haeseleer et al., 2000, 2004) along with mouse monoclonal anti-neurofilament 200 antibodies (1:1000) (N0142; Sigma, St. Louis, MO) were applied to the tissue sections during overnight incubation at 4°C in humid chambers. After two to three rinses in the blocking buffer, sections were treated with a mixture of goat Alexa 488-conjugated anti-rabbit IgG and Alexa 594-conjugated anti-mouse IgG (Invitrogen, Eugene, OR) at 1:6000 dilution for 2 h at room temperature. Finally, the tissue sections underwent a series of washes at room temperature in 60 mm PBS, pH 7.4, before confocal microscopy.
FRET two-hybrid analysis.
FRET was determined by the three-cube FRET method, as described previously (Erickson et al., 2003). Briefly, total fluorescence from single cells, as isolated via a pinhole in the image plane, was quantified by a photomultiplier tube. In all experiments, CFP levels were below a threshold at which spurious, concentration-dependent FRET became significant (Stratton et al., 2004). The filter cubes for CFP, YFP, and FRET were as follows (excitation, dichroic, emission, company, respectively): CFP (D440/20X, 455DCLP, D480/30M, Chroma Technology, Rockingham, VT); YFP (500AF25, 525DRLP, 530ALP, Omega Optical, Brattleboro, VT); and FRET (D436/20X, 455DCLP, D535/30M, Chroma Technology).
The degree of FRET in an individual cell was quantified by the FRET ratio (FR), defined as the fractional increase in YFP emission caused by FRET. Explicitly, FR = [SFRET − (RD1)(SCFP)]/[(RA1)(SYFP − (RD2)(SCFP))], where SX is fluorescence measurement with the indicated filter cube (X), and experimentally determined RD1, RD2, and RA values (0.33, 0.0051, and 0.0165, respectively) did not vary significantly among the various CFP- and YFP-tagged constructs. FR is related to the average FRET efficiency in a cell by the conversion equation FR = (EEFF/[εYFP/εCFP]) + 1, where εYFP/εCFP is the ratio of YFP and CFP molar extinction coefficients measured through the 440 nm excitation bandpass of the FRET cube (0.058).
The binding-model analysis has been described previously (Erickson et al., 2001, 2003). A 1:1 ligand-binding model is assumed to determine two parameters: FRmax and Kd,EFF. FRmax is the maximum FR that occurs when all acceptor-tagged molecules are bound; hence, FRmax depends only on interfluorophore geometry. The second parameter Kd,EFF, the effective dissociation constant, furnishes the relative dissociation constant for the binding reaction, with conversion factors to actual Kd determined by optical characteristics of our microscope system. See http://www.neuron.org/cgi/content/full/39/1/97/DC1 for further details (Erickson et al., 2003).
Results
CaV1.3 channels feature unusually strong Ca2+-dependent inactivation
Given the diverse CDI characteristics of native CaV1.3 in various biological contexts, we first investigated the baseline inactivation profile of recombinant CaV1.3 channels (α1D/β2a/α2δ subunits), as expressed heterologously in mammalian HEK293 cells to facilitate optimal current isolation and biophysical resolution. For reference, Figure 1A displays the prototypic CaM-mediated CDI of well studied CaV1.2 channels (α1C/β2a/α2δ) resolved under conditions identical to those used for CaV1.3. Depolarization to the peak of current–voltage (I--V) relations (bottom) evoked rapidly decaying Ca2+ current indicative of CDI (top, gray exemplar trace). Switching the charge carrier to Ba2+ yielded currents (black trace) that decayed only slowly, as driven by a residual voltage-dependent inactivation mechanism. More quantitatively, the fraction of peak current remaining after 50 and 300 ms of depolarization (r50 and r300) reflects the kinetic and steady-state aspects of inactivation. Plots of these metrics as a function of depolarizing voltage encapsulate the CDI profile of CaV1.2 (middle). The “U-shaped” voltage dependence of r50 and r300 with Ca2+ as charge carrier accords with a genuine Ca2+ dependence of the inactivation (Peterson et al., 1999); the near unity values of these metrics for Ba2+ currents concur with scant voltage-dependent inactivation over this timescale. The difference between Ca2+ and Ba2+ relations at the peak of I--V relations (f50 and f300) thereby furnished convenient kinetic and steady-state indices of “pure” CDI.
Figure 1.

CaV1.3 Ca2+ channels manifest ultrastrong CDI driven exclusively by CaM. A, Prototypical CDI exhibited by CaV1.2 Ca2+ channels (α1C/β2a/α2δ). Top, Voltage protocol and exemplar whole-cell currents. Here and throughout, the scale bar for current refers to Ca2+ waveforms, and the Ba2+ waveforms are scaled down approximately three times to facilitate visual comparison of decay kinetics. Top middle, Fraction of peak current remaining after 50 ms depolarization (r50), plotted as a function of step potential. The distance between Ba2+ and Ca2+ relations gauges kinetics of CDI. Bottom middle, Fraction of peak current remaining after 300 ms depolarization (r300), plotted as a function of step potential. The distance between Ba2+ and Ca2+ relations gauges steady-state extent of CDI. Bottom, Normalized I--V relation, taken from peak Ca2+ currents evoked by voltage steps to the indicated potentials. B, Ultrastrong CDI exhibited by CaV1.3 Ca2+ channels (α1Dsh/β2a/α2δ). Format as above in A. Bottom middle, Distance between Ba2+ and Ca2+ r300 relations at −10 mV (f300) furnishes simple metric of steady-state extent of CDI. Bottom, Dashed curve reproduces fit to normalized I–V relation for CaV1.2 from A. f50 = 0.70 ± 0.02 (n = 11); f300 = 0.63 ± 0.02 (n = 11). C, Elimination of CDI during coexpression of CaV1.3 channels with CaM1234. Format as above in A. f50 = 0.04 ± 0.03 (n = 7); f300 = 0.06 ± 0.04 (n = 7). D, CDI during coexpression of CaV1.3 channels with CaMWT. Format as above in A. No appreciable difference from profile in B. f50 = 0.69 ± 0.04 (n = 5); f300 = 0.72 ± 0.02 (n = 5).
With this framework, we could immediately appreciate the existence of CDI in recombinant CaV1.3 channels (Fig. 1B), as reported previously (Xu and Lipscombe, 2001; Song et al., 2003). Additionally, the I–V relation of these channels was characteristically hyperpolarized compared with CaV1.2 (Xu and Lipscombe, 2001), consistent with the negative activation range of native hair-cell currents (Zidanic and Fuchs, 1995; Michna et al., 2003); however, contrary to expectations from hair-cell currents, the head-to-head comparison of CaV1.2 and CaV1.3 channels newly emphasized that CDI was not only present in CaV1.3 but strikingly faster and stronger than in CaV1.2 channels. In particular, both f50 and f300 parameters were nearly doubled in CaV1.3 channels, and such CDI is indeed faster than that observed for any other member of the CaV1–2 channel family (DeMaria et al., 2001; Soong et al., 2002; Liang et al., 2003).
A unique variant of CaM-mediated regulation in CaV1.3 channels
This unusually strong inactivation gave us reason to speculate whether the CaV1.3 phenotype could be completely explained by a CaM-mediated CDI mechanism akin to that of closely similar CaV1.2 channels (Peterson et al., 1999; Zuhlke et al., 1999), or whether additional or different mechanisms contribute. One straightforward means of testing for such CaM-mediated CDI is to coexpress channels with a Ca2+-insensitive mutant CaM in which mutations have been introduced within all four EF-hand Ca2+ binding sites (CaM1234) (Peterson et al., 1999). Because CaM constitutes a resident Ca2+ sensor of CaV1.2, in which Ca2+-free apoCaM already preassociates with channels (Erickson et al., 2001, 2003), CaM1234 serves as a dominant negative to eliminate CDI in this context. For CaV1.3, coexpressing CaM1234 also produced an impressive ablation of CDI (Fig. 1C), despite the prominent inactivation baseline of these channels (Fig. 1B). In contrast, pairing CaV1.3 with expression of recombinant wild-type CaM (CaMWT) left CDI unchanged (Fig. 1D), indicating that endogenous CaM sufficed to fully populate channels with their allotment of resident CaM. These results argue strongly that CaV1.3 channels feature an exclusive, CaM-mediated CDI mechanism analogous to that for CaV1.2.
A partial explanation for the unusually strong CDI of CaV1.3 channels arose by considering the lobe specificity of CaM in producing such inactivation. Ca2+ binding to the C-terminal lobe of CaM triggers nearly all of the CDI observed in CaV1.2 channels under the conditions used here, whereas Ca2+ binding to the N-terminal lobe contributes little (Peterson et al., 1999). This can be demonstrated by coexpressing CaV1.2 channels with mutant CaM molecules selectively deficient in Ca2+ binding to the C-terminal (CaM34) and N-terminal (CaM12) lobes of CaM (Peterson et al., 1999). Specifically, CaM34 entirely eliminates CaV1.2 CDI (Fig. 2A), whereas CaM12 essentially spares CDI at control levels (Fig. 2B). When these lobe-specific mutant CaM molecules were coexpressed with CaV1.3 channels, a mechanistically revealing contrast emerged. CaM34 clearly spared a slowly inactivating component but inhibited a rapid component (Fig. 2C). In a complementary manner, CaM12 retained a rapid CDI phase but diminished the overall extent of CDI during a 300 ms depolarization (Fig. 2D). These results suggested that the two lobes of CaM each contribute a different component of CDI in CaV1.3 channels: Ca2+ binding to the C-terminal lobe of CaM triggers a rapid form of CDI, whereas Ca2+ binding to the N-terminal lobe elicits a slower inactivating component.
Figure 2.
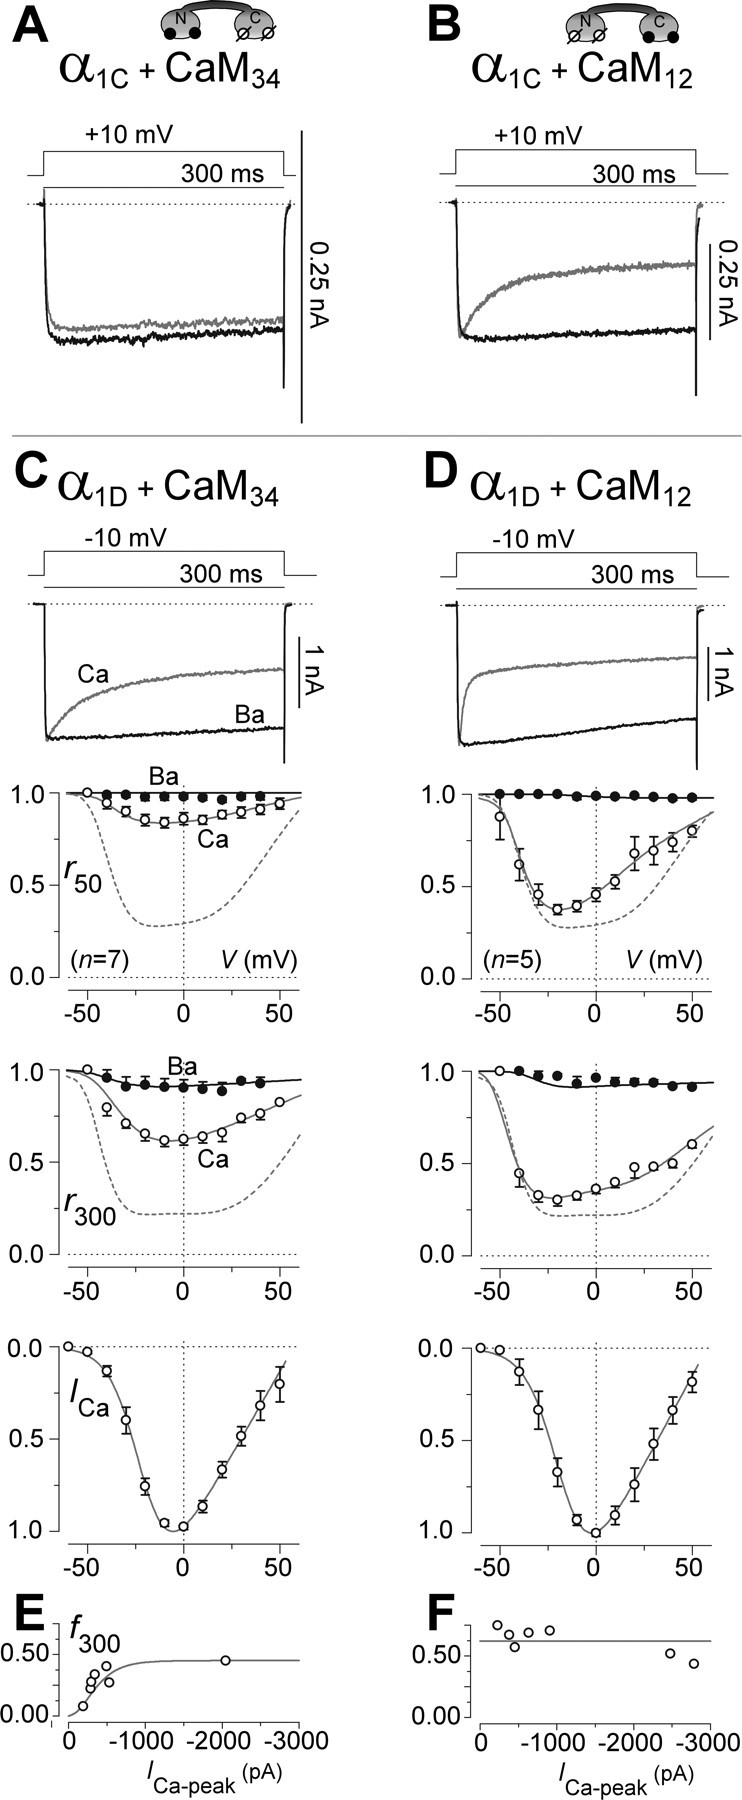
CaM lobe-specific contributions to CDI of CaV1.2 and CaV1.3 channels. A, Exemplar currents showing elimination of CDI during coexpression of CaV1.2 channels with CaM34. Format as in Figure 1A, top row. B, Exemplar currents showing sparing of CDI during coexpression of CaV1.2 channels with CaM12. Format as in top row of Figure 1A. C, Persistence of a slowly inactivating phase of CDI during coexpression of CaV1.3 channels with CaM34. Format as in Figure 1B. Top and bottom middle, Dashed curves reproduce fits to control r50 and r300 relations, shown in Figure 1B. f50 = 0.14 ± 0.03 (n = 7); f300 = 0.29 ± 0.05 (n = 7). D, Persistence of a rapidly inactivating phase of CDI during coexpression of CaV1.3 channels with CaM12. Format as above in C. f50 = 0.61 ± 0.03 (n = 7); f300 = 0.62 ± 0.04 (n = 7). E, Strength of CDI (f300) increases with peak Ca2+ current amplitude (ICa-peak) during coexpression of CaV1.3 channels with CaM34. F, Strength of CDI (f300) invariant with peak Ca2+ current amplitude (ICa-peak) during coexpression of CaV1.3 channels with CaM12.
To bolster the evidence for distinct CDI processes, we exploited a general pattern of spatial Ca2+ sensitivities for Ca2+ regulatory mechanisms triggered by N- versus C-terminal lobes of CaM as manifest in CaV2 and other CaV1 Ca2+ channels (Liang et al., 2003). Regulation triggered by the N-terminal lobe of CaM is sensitive to global levels of Ca2+, whereas that initiated by the C-terminal lobe is sensitive primarily to local Ca2+ influx through individual channels (Soong et al., 2002; Liang et al., 2003). Confirmation of this pattern for the two CDI phases of CaV1.3 channels would argue further that these components reflect genuinely distinct mechanisms. To test for such a pattern, we plotted the CDI strength (f300) of individual cells as a function of peak whole-cell current (ICa-peak), the latter of which furnishes an indication of global Ca2+ concentration (Peterson et al., 1999; Soong et al., 2002). Accordingly, the predicted outcomes would be as follows. If a process were sensitive to spatially global patterns of Ca2+ influx, then the process would intensify with increasing ICa-peak. In contrast, if a mechanism were preferentially evoked by Ca2+ influx through individual channels, then the strength of that mechanism would be independent of ICa-peak. Previously, this approach has successfully dissected the local versus global Ca2+ preference of CaM regulation in CaV1.2 (Peterson et al., 1999) and CaV2.1 channels (Soong et al., 2002; Chaudhuri et al., 2004, 2005, 2006). Here, application of this approach to CaV1.3 channels showed that the CDI initiated by Ca2+ binding to the N-terminal lobe of CaM (with CaM34 present) intensified with increasing ICa-peak (Fig. 2E), whereas CDI induced by Ca2+ binding to the C-terminal lobe (with CaM12 present) was insensitive to ICa-peak (Fig. 2F). Additionally, cell-to-cell variations in ICa-peak were correlated linearly with fluctuations in maximal gating charge (Agler et al., 2005), corroborating the underlying assumption that differences in ICa-peak reflect different numbers of channels with the same open probability (supplemental data, section 1, available at www.jneurosci.org as supplemental material). In all, the slow and rapid phases of CDI cohered to the generally observed pattern of spatial Ca2+ sensitivities, further substantiating these inactivating phases as legitimately distinct processes.
Another telltale signature of distinct regulatory processes triggered by the different lobes of CaM concerns the selectivity of mutations introduced within the IQ-like motif of channels (Fig. 3A). In other CaV1–2 channels, the IQ region appears important both for the preassociation of apoCaM (Erickson et al., 2003; Tang et al., 2003) and for the channel regulation triggered by Ca2+ binding to the C-terminal lobe of CaM. In particular, substituting alanines for the isoleucine–glutamine cluster [α1Dsh(IQ/AA); “IQ/AA mutations”] preserves apoCaM preassociation (Erickson et al., 2003) but eliminates regulation invoked by the C-terminal (but not N-terminal) lobe of CaM (Peterson et al., 1999; Zuhlke et al., 1999; DeMaria et al., 2001). Because the IQ region of CaV1.3 is highly similar to that of CaV1.2 (Fig. 3A), a like pattern of selective effects for the IQ/AA mutation in CaV1.3 would provide further compelling support of distinct regulatory processes in these channels. Indeed, CaV1.3 channels bearing IQ/AA mutations lacked a rapidly inactivating CDI component and exhibited only a slow inactivation (Fig. 3B) resembling that of wild-type CaV1.3 coexpressed with CaM34. Moreover, mutant IQ/AA channels exhibited CDI with the same dependence on global Ca2+ activity (Fig. 3E) as did the wild-type CaV1.3 coexpressed with CaM34. Finally, CaM12 (but not CaM34) preferentially eliminated CDI of mutant CaV1.3 channels (Fig. 3C,D,F). These results favor the interpretation that the IQ/AA mutations appear to have eliminated CDI related to the C-terminal lobe of CaM and that the residual CDI was induced by Ca2+ binding to the N-terminal lobe.
In all, the existence in CaV1.3 of two forms of CDI, as triggered by different lobes of CaM, is thus far unique among CaV1–2 channels (Liang et al., 2003). Other channels have at most a single lobe of CaM devoted to inactivation, so the bipartite CDI of CaV1.3 helps to account for the unusually strong inactivating profile of these channels.
CaBP molecules of hair cells eliminate CDI of CaV1.3 channels
Although the baseline CDI of recombinant CaV1.3 channels coarsely approximates the profile of native CaV1.3 channels in cardiac sinoatrium (Zhang et al., 2002; Mangoni et al., 2003), the intense inactivation of recombinant channels contrasts sharply with the weaker to absent CDI of CaV1.3 channels in hair cells (Platzer et al., 2000; Marcotti et al., 2003; Michna et al., 2003; Schnee and Ricci, 2003; Song et al., 2003). In fact, explicit measurements of native IHC Ca2+ currents, as present within isolated rat organ of Corti preparations (Fig. 4A, bottom, schematic), revealed negligible CDI under the typical regimen used in this study (Fig. 4A, top, traces). The intracellular Ca2+ buffering for these native currents was reduced to 1 mm EGTA (compared with the usual 5 mm used for heterologous currents) to amplify potential CDI. Even so, native Ba2+ and Ca2+ currents exhibited nearly identical inactivation kinetics. Superposition of the rapidly inactivating Ca2+ current waveform of recombinant CaV1.3 channels (rCa; reproduced from Fig. 1B) directly emphasizes the striking difference between the CDI profiles of heterologously expressed recombinant channels and native auditory channels within IHCs. Given that the limited CDI of hair-cell channels may be critical for protracted auditory signaling (Lewis and Hudspeth, 1983; Kollmar et al., 1997), we therefore explored how the inherently prominent CDI of CaV1.3 channels might be moderated in the auditory setting.
Figure 4.

CDI of native IHC Ca2+ channels (A) and unchanged CDI of CaV1.3 Ca2+ channels containing a long α1D splice variant (B). A, Top, Direct comparison of CDI for native IHC Ca2+ channels with that for recombinant CaV1.3 channels (rCa, recombinant Ca2+ current trace, reproduced from Fig. 1B), as labeled. Native currents were evoked by a −15 mV step, and the recombinant current was evoked by a −10 mV step (asterisk). Native current f300 = 0.008 ± 0.013 (n = 6). Bottom, Schematic of isolated organ of Corti preparation (P8–P9 rats) from which native recordings were made in the apical turn. Top schematic provides orientation; expanded view below illustrates details of the pipette approach to an IHC. B, CDI exhibited by long splice variant CaV1.3 Ca2+ channels (α1Dlg/β2a/α2δ). Format as in Figure 1B. Behavior is no different from that for the short splice variant CaV1.3 Ca2+ channels (α1Dsh/β2a/α2δ), as seen by comparison with dashed curves reproducing fits to control r50 and r300 relations in Figure 1B. f50 = 0.62 ± 0.02 (n = 13); f300 = 0.60 ± 0.03 (n = 13).
One possible explanation is that hair cells possess a custom splice variant of CaV1.3 channels (Kollmar et al., 1997; Xu and Lipscombe, 2001, 2002), one that features little CDI. Thus far, all of our experiments had been performed with a prominent “short” variant of the principal α1D subunit of CaV1.3 channels (Xu and Lipscombe, 2001; Lipscombe et al., 2002), in which a stop codon appears shortly after the IQ motif (Fig. 3A, α1Dsh). A “long” α1D variant features an IQ motif followed by an additional ∼500 downstream residues (Fig. 3A, α1Dlg). Considering the importance of the IQ region and other C-terminal structures for CDI across the family of CaV1–2 channels (Liang et al., 2003), we wondered whether the long α1D variant might exhibit a comparatively weaker inactivation profile; however, explicit characterization of this long variant (Fig. 4B) confirmed a CDI profile identical to that of the short variant. Hence, the long α1D splice variant would not contribute to the limited CDI profile in hair cells. In our companion paper (Shen et al., 2006), a different α1D splice variant is described, one that both lacks CDI and shows expression in OHCs of the mammalian cochlea.
Here, we considered instead whether ancillary molecules might interact with CaV1.3 channels to attenuate CDI in the native context (Song et al., 2003). In particular, because CDI of recombinant CaV1.3 channels appeared completely mediated by CaM (Figs. 1–3), we considered whether members of a CaM-like family of molecules might function in this attenuating capacity (Burgoyne and Weiss, 2001). Such CaM-like molecules also bear four EF hands (although not all need to be functional Ca2+ binding sites) and can often perturb the Ca2+ responsiveness of molecules subject to baseline CaM-mediated regulation (Haeseleer et al., 2000, 2004; Lee et al., 2002; Tsujimoto et al., 2002; Yang et al., 2002). With particular reference to CaV1 Ca2+ channels, two different isoforms of CaBPs have been shown to bind channels and modulate gating function. CaBP1 features widespread distribution throughout the brain and interferes with CaM-mediated CDI of CaV1.2 channels (Zhou et al., 2004). Alternatively, CaBP4 is thought to be restricted to the retina, and it hyperpolarizes the activation curve of CaV1.4, a retina-specific Ca2+ channel (Haeseleer et al., 2004). Neither of these CaBP isoforms is found in the heart (Haeseleer et al., 2000), where CaV1.3 CDI is clearly manifest (Platzer et al., 2000); however, it remained unknown whether CaBPs are present in auditory hair cells and whether these molecules can modulate the CaV1.3 channels that predominate in these cells.
To test for the presence of CaBP transcripts in hair cells, we performed reverse transcriptase-PCR analysis of organ of Corti tissue samples dissected from P10 rats. Gel electrophoresis revealed PCR products with sizes anticipated for CaBP1 and CaBP4 transcripts (398 and 294 bp, respectively), whereas negative controls were devoid of such products (Fig. 5A). Direct sequencing of PCR products confirmed the presence of rat CaBP1 and CaBP4 transcripts (supplemental data, section 2, available at www.jneurosci.org as supplemental material).
Figure 5.
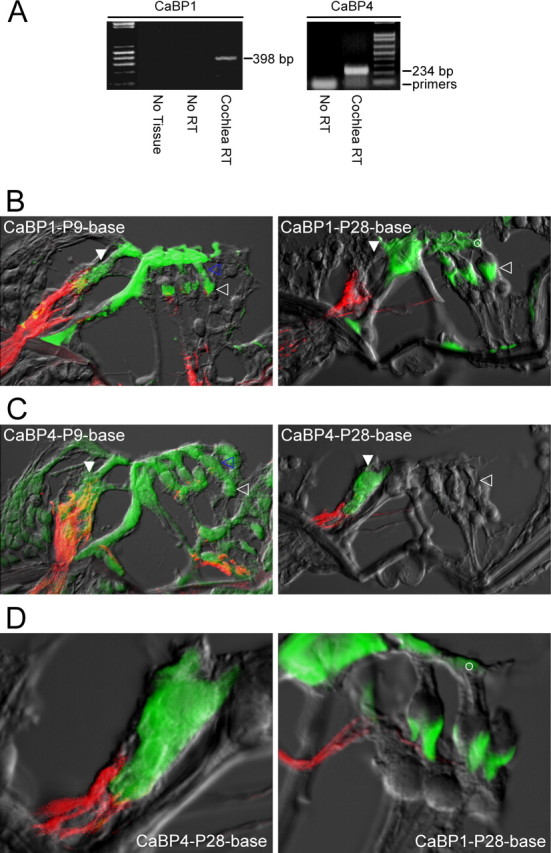
CaBPs express in auditory hair cells. A, Reverse-transcriptase PCR analysis demonstrating the presence of transcripts for CaBP1 (left) and CaBP4 (right) in rat cochlear tissue (P10). “Cochlear RT” lanes show PCR products amplified from reverse transcriptase reactions performed on cochlear tissue; explicit sequencing of these products confirmed the presence of CaBP1 (left) and CaBP4 (right) transcripts (supplemental data, section 2, available at www.jneurosci.org as supplemental material). “No RT” controls document the results of the identical procedures with omission of the reverse transcriptase step. “No Tissue” controls reflect the results when all procedures were performed, with omission of cochlear tissue. B, CaBP1 immunostains of sections obtained from basal turns of the rat organ of Corti (here and throughout the figure), as derived from P9 and P28 rats. Green fluorescence signal reports CaBP1 staining; red fluorescence registers neurofilament 200 staining characteristic of afferent nerves; and gray signal reflects scanned transmitted light image. All three signals were imaged by confocal microscopy and digitally merged. At P9, CaBP1 signals shows diffuse expression in both IHCs (filled white arrow, next to afferent nerve connection) and OHCs (open blue arrow). By P28, CaBP1 is preferentially localized to chalices of Deiters cells (open white arrow), as well as to the cuticular plates of OHCs (open white circle). CaBP1 labeling of pillar cells is of unknown significance. OHCs are oriented on the right, here and throughout. C, CaBP4 immunostains of sections obtained from rat organ of Corti, derived from P9 and P28 rats. At P9, CaBP4 shows diffuse expression in both IHCs (filled white arrow) and OHCs (open blue arrow), as well as in Deiters cells (open white arrow). By P28, CaBP4 is preferentially localized to IHCs. CaBP4 labeling of pillar cells at P9 is of unknown significance. D, Higher-power views of P28 rat sections demonstrating selective CaBP4 enrichment within IHCs (left). The right panel illustrates adult CaBP1 enhancement of “chalice” processes from Deiters cells, the cuticular plates of OHCs (open white circles), and multiple segments of pilar cells.
To assess the cochlear distribution of CaBP proteins, we obtained immunofluorescence images of sections made from rat organ of Corti (Fig. 5B,C) by using antibodies specific for CaBP1 or CaBP4 (Haeseleer et al., 2000, 2004) (supplemental data, section 3, available at www.jneurosci.org as supplemental material). For orientation, the cochlear nerve was labeled specifically for neurofilament 200 (red). Both antibodies labeled much of the neonatal (P9) organ of Corti; however, over the course of development, CaBP1 labeling (green) became restricted to the inner pillar cells as well as the processes of Deiters cells that reside immediately below and envelope the base of OHCs (Fig. 5B, P28 section, open arrow). As for hair-cell localization in these older cochleas (P28), CaBP1 immunoreactivity was absent from IHCs and restricted to the apical (hair bundle) surface of OHCs (Fig. 5B,D, right, open circle). Of note, the CaBP1 immunoreactivity beneath OHCs was distinct from the immunoreactivity to choline acetyltransferase (supplemental data, section 3, available at www.jneurosci.org as supplemental material), a specific label of efferent nerve terminals. Indeed, CaBP1-positive structures enveloped the choline acetyltransferase-positive endings, echoing the Deiters cell chalice that envelops the synaptic poles of OHCs (Furness et al., 2002). The pattern of CaBP1 immunoreactivity at P28 (OHC cuticular plates, pillar cells, and Deiters cells) hint at a linkage to mechanotransduction.
The CaBP4 isoform displayed an especially intriguing pattern of labeling (Fig. 5C). Specifically, CaBP4 immunolabel (green) was present in both IHCs and OHCs at P9 but was clearly restricted to IHCs by P28 (Fig. 5D, left). The prominent expression of CaBP4 within IHCs is remarkable because CaBP4 has heretofore been detected only in retina (Haeseleer et al., 2004). CaBP4 staining was also apparent in pillar and Deiters cells at P9 but not at P28. These patterns of CaBP1 and CaBP4 expression were representative of those obtained in approximately three separate organ of Corti preparations for each condition. The pronounced immunolocalization of CaBP4 to IHCs, including their basolateral aspects (Fig. 5D) where Ca2+ channels are concentrated at ribbon synapses (Sidi et al., 2004; Brandt et al., 2005), render these CaM-like molecules plausible candidates for influencing native auditory CaV1.3 at this functionally critical synapse.
Modulation of other CaV1 channels by CaBP molecules likely requires their interaction with channel regions mediating CaM-driven CDI (Zhou et al., 2004), particularly the IQ domain (Fig. 3A). Accordingly, to gauge further whether CaBP1/4 molecules are poised to modulate CaV1.3 channels, we tested for interactions between CaBP1/4 molecules and the IQD segment of these channels (Fig. 3A, IQ region underscore). If such interactions were present, particularly at resting levels of Ca2+, this outcome would position CaBP molecules for constitutive alteration of CaM-mediated CDI, without need for previous Ca2+ influx to mobilize CaBP toward channels. We probed for such interactions using a live-cell FRET two-hybrid assay (Erickson et al., 2003) and found the following: CaBPs were fused to ECFP (yielding CaBP1–CFP and CaBP4–CFP); IQD (or IQC) was joined to EYFP (YFP– IQD and YFP– IQC); and the resulting fusion constructs expressed pairwise in mammalian HEK293 cells (Fig. 6A,C,D, left). The presence of optical CFP/YFP FRET in live individual cells would thereby give a strong indication of interpartner binding in the resting intracellular milieu. Specifically, a three-cube FRET algorithm specified the strength of FRET interaction as the metric FR (“FRET ratio”), which adopts a value of unity in the absence of FRET and grows linearly with increasing FRET efficiency (Erickson et al., 2003). Additionally, because FR depends on the fractional binding between interacting partners, variability in the expression levels of fusion constructs among cells could be exploited to estimate a relative dissociation constant (Kd,EFF) that estimates binding affinity. As a baseline control, we first considered an experiment corresponding to CaV1.2 channels, for which CaBP1 modulation has been established previously (Zhou et al., 2004). Here, for CaBP1–CFP pitted against YFP– IQC (Fig. 6A), FR determinations for many individual cells (plotted as circles) frequently exceed unity, giving an obvious indication of FRET. More rigorously, when variable expression levels of CaBP1–CFP (Dfree; free relative donor concentration) were taken into account, the FR data conformed nicely to a 1:1 binding relation (solid curve) (Erickson et al., 2003). Interestingly, for the YFP–PreIQ3-IQC-gly12-CaMWT construct (Fig. 6B, left), which incorporates the PreIQ3-IQC segment fused to a wild-type CaM via 12 glycines, there was negligible FRET interaction with CaBP1–CFP. Because such glycine fusions of CaM to holochannels yield functional channels, wherein the enormous local concentration of the “linked” CaM usurps the IQC site (Mori et al., 2004), the near absence of FRET in this pairing argues that CaBP1 and CaM cannot bind simultaneously to this region. If anything, the added presence of the PreIQ3 segment in this FRET experiment should increase the chances that simultaneous binding might occur. Hence, these results are consistent with the notion that competition of CaBPs and CaM for this channel region may underlie the modulatory effects of CaBPs. Experiments for CaBP1–CFP paired against YFP– IQD (Fig. 6C), and for CaBP4–CFP matched against YFP–IQD (Fig. 6D), showed robust FRET interaction, in which Kd,EFF values were comparable with that for YFP–IQC. These interactions indicate that CaBP1 and CaBP4 molecules appear well situated to interact with IQD segments of CaV1.3 channels and potentially modulate their CaM-mediated regulation.
Finally, to investigate directly whether CaBP1 and/or CaBP4 molecules impact(s) the CDI of CaV1.3 channels, we coexpressed CaBPs with channels in HEK293 cells. These experiments were challenged initially by a salient effect of CaBPs to diminish Ca2+ currents, often to levels precluding reliable determination of channel properties. This channel-attenuating effect appears to have been present in previous CaBP studies with other types of Ca2+ channels (Lee et al., 2002; Haeseleer et al., 2004; Zhou et al., 2004) and may well reflect diminished channel expression secondary to CaBP modulatory actions that promote constitutive Ca2+ entry via Ca2+ channels. Thus, to ensure reliable characterization of CaV1.3 currents in the experiments at hand, we cloned CaBPs into pIND (Invitrogen), such that recombinant CaV1.3 channels could attain substantial levels of expression before overnight induction of CaBPs. With this approach, CaV1.3 current amplitudes, although reduced by the time-limited expression of CaBPs, were nonetheless sufficiently maintained for ready characterization of functional profiles. We could then resolve that, despite the intensely inactivating baseline of this channel (Fig. 1), both CaBP1 and CaBP4 clearly produced near elimination of CDI (Fig. 7A,B), yielding channel behavior that matched the weak to absent inactivation profiles characteristic within hair cells. Control CaV1.3 currents (expressed without CaBPs) of similarly moderated amplitude nonetheless exhibited strong CDI (Fig. 7C), excluding diminished current amplitudes as a trivial explanation for the observed CaBP effects.
On the basis of these observations (Figs. 5–7), CaBP1 and CaBP4 could serve to modulate the inactivation of CaV1.3 channels, affording localized customization of channel opening. Of these two, however, CaBP4 is present specifically in the IHCs that provide Ca2+-dependent synaptic transmission to the auditory nerve, thereby endowing CaBP4 with potentially high functional relevance.
Discussion
This study concerns an interesting puzzle of auditory neurobiology: how to reconcile the weaker to absent CDI of native hair cell CaV1.3 Ca2+ currents with the baseline propensity of recombinant CaV1.3 channels to undergo such inactivation (Xu and Lipscombe, 2001). Initially, our biophysical examination of CDI by recombinant CaV1.3 channels only further highlighted this puzzle, because CDI reflects a unique variant of CaM-mediated channel regulation, capable of the most intense inactivation seen within the CaV1–2 family of channels; however, the exclusive role of CaM in mediating the CDI of recombinant CaV1.3 channels focused attention on whether CaM-like molecules (CaBPs) could suppress native CDI (Haeseleer et al., 2000). Our experiments indeed demonstrated expression of CaBP1 and CaBP4 in cochlear cells. In particular, CaBP4 is preferentially enriched within IHCs and strikingly eliminates CDI of recombinant CaV1.3 channels. Accordingly, CaBP4 is poised to attenuate the CDI of native CaV1.3 channels within IHCs, thereby potentially facilitating neurotransmission to the cochlear nerve during ongoing spontaneous activity and sustained auditory stimuli. Our companion paper explores whether a novel splice variant of CaV1.3 channels could account for the limited CDI of native Ca2+ channels within OHCs (Shen et al., 2006). These findings merit three lines of discussion, as developed below.
Baseline CDI mechanism of CaV1.3 channels
The CDI of recombinant CaV1.3 channels is unique: it reflects two inactivation processes, as triggered by the different lobes of CaM (Liang et al., 2003). The N-terminal lobe of CaM initiates a slowly inactivating phase that is responsive mainly to global elevations of Ca2+, whereas the C-terminal lobe triggers a rapidly inactivating component that is sensitive primarily to local Ca2+ influx through individual channels (Figs. 2, 3). The preference of the N-terminal lobe for global Ca2+ upholds a consistent pattern for Ca2+ regulation triggered by the N-terminal lobe of CaM in other CaV1–2 channels, and the selectivity of the C-terminal lobe for local Ca2+ coheres with a general pattern for C-terminal lobe modulation (Liang et al., 2003). Moreover, the role of the CaV1.3 IQ segment in mediating regulation by the C-terminal lobe of CaM appears conserved across other channels (Fig. 3). The unique feature of CaV1.3 is that both lobes of CaM trigger inactivation processes, whereas a single lobe of CaM, at most, is dedicated to inactivation in other channels (Liang et al., 2003). For example, in CaV2.1 channels, the N-terminal lobe of CaM triggers inactivation, but the C-terminal lobe initiates Ca2+-dependent facilitation of channel opening (DeMaria et al., 2001; Chaudhuri et al., 2005).
Although the dual-lobed CDI of CaV1.3 helps explain the strong inactivation of these channels, such a profile is unexpected from the structure–function viewpoint. The proximal third of the α1 subunit for CaV1.2 and CaV1.3 (Fig. 3A, EF through IQ) is nearly identical (differing at only ∼4% of residues), and this region is considered a predominant structural determinant of Ca2+ regulation (de Leon et al., 1995; Peterson et al., 2000). Moreover, the CaV1.2 IQ segment, for which atomic structure has been determined in complex with Ca2+/CaM (Van Petegem et al., 2004; Fallon et al., 2005), differs from the CaV1.3 IQ segment by only a single glutamate-to-aspartate substitution, yet under the conditions used here, the CDI of CaV1.2 channels is driven by the C-terminal lobe of CaM, with no obvious N-terminal lobe contribution (Peterson et al., 1999; Alseikhan et al., 2002). Structure–function analysis of this contrasting behavior merits further investigation.
Potential for CaBP modulation in hair cells
The selective enrichment of CaBP4 at IHCs (Fig. 5C,D), with elimination of recombinant CaV1.3 CDI by this molecule (Fig. 7B), renders CaBP4/CaV1.3 interaction a plausible explanation for the attenuated inactivation of native Ca2+ currents (Fig. 4A) (Platzer et al., 2000; Marcotti et al., 2003; Michna et al., 2003; Schnee and Ricci, 2003; Song et al., 2003). Although calcium concentration and buffering vary among these studies, a general conclusion is that native currents exhibit maximal inactivation of 0–50% at 300 ms, with lesser levels under near-physiological conditions. Although syntaxin, VAMP (vesicle-associated membrane protein), and SNAP25 (soluble N-ethylmaleimide-sensitive factor attachment protein 25) can somewhat moderate CDI of CaV1.3 channels (Song et al., 2003), these other molecules are considerably less effective than CaBP4 and alone cannot explain the profile of native channels. Other potential explanations for modulating native CDI should still be considered; for example, CaM-like molecules other than CaBP4 (for which we did not screen) could well contribute in the native context. Definitive testing of our CaBP4 hypothesis for moderating CDI within IHCs will require experiments with CaBP4−/− mice (Haeseleer et al., 2004) or with siRNA approaches. These now represent exciting future work framed by the results in the present study.
The moderation of CDI in native channels may be necessary for continued perception of sustained auditory stimuli (Lewis and Hudspeth, 1983; Kollmar et al., 1997). CaV1.3 triggers neurotransmission between IHCs and the cochlear nerve (Platzer et al., 2000), and such synaptic communication is critical for sound conversion into nerve impulses and for ongoing spontaneous activity (Robertson and Paki, 2002; Sueta et al., 2004). Limited CaV1.3 inactivation may be especially crucial because IHCs form ribbon synapses with the cochlear nerve. As with those synapses in retina, neurotransmitter release from IHCs is regulated by graded and tonic presynaptic depolarization over extended periods, rather than by variable presynaptic spike rates (Sterling and Matthews, 2005). Additionally, weakened CDI could broaden slowly repetitive, Ca2+-dependent action potentials (duration ∼100 ms) that occur spontaneously in immature IHCs (Beutner and Moser, 2001; Glowatzki and Fuchs, 2002). Such broadening could enhance activity-dependent Ca2+ signaling that drives development (Platzer et al., 2000; Brandt et al., 2003; Glueckert et al., 2003).
More broadly, because the only other sighting of CaBP4 has been in retinal cells that also comprise ribbon synapses (Haeseleer et al., 2004), CaBP4 may be present in general at these synapses to customize Ca2+ signaling profiles. For example, CaBP4 found in rods may hyperpolarize voltage-dependent activation of CaV1.4 Ca2+ channels, facilitating Ca2+ entry during the limited depolarization of these cells (Haeseleer et al., 2004). Interestingly, these channels lack intrinsic CDI (McRory et al., 2004), and no such CaBP-induced hyperpolarization of activation was observed in CaV1.3 (Fig. 7). Thus, the particular optimization of CaBP4 may vary according to the target molecule. If the linkage between ribbon synapses and CaBP4 were truly invariant, then CaBP4 would also be present at ribbon synapses in fish electroreceptors (Sejnowski and Yodlowski, 1982) and pinealocytes (Vollrath and Spiwoks-Becker, 1996).
For OHCs, the near absence of CaBPs (Fig. 5B,D) complements the presence of custom CaV1.3 splice variants lacking CDI, as reported in our companion paper (Shen et al., 2006). Ca2+ currents in OHCs may serve functions other than transmitter release, so the use of alternative means to modulate CDI could be relevant to the requirements of these other roles.
Customization of Ca2+ regulation by CaM-like molecules
The ablation of CDI by CaBP/CaV1.3 interaction enriches an emerging theme, whereby CaM-like molecules expand the baseline CaM regulatory profile of various Ca2+ signaling proteins. Analogous effects have been reported for CaV1.2, CaV1.4, and CaV2.1 Ca2+ channels (Lee et al., 2002; Haeseleer et al., 2004; Zhou et al., 2004, 2005; Few et al., 2005; Lautermilch et al., 2005), with the variation that channels impacted by CaM-like molecules may sometimes exhibit alteration rather than elimination of Ca2+ regulation. Another feature expanding the versatility of such a model is that channels need not be partitioned solely into “altered” and “nonaltered” pools of channels. Native P-type channels in cerebellar Purkinje neurons may be distributed between these two forms, allowing variable penetrance of CaM-mediated channel facilitation with fluctuating levels of CaM and CaM-like moieties (Chaudhuri et al., 2005). A similar mechanism involving CaBP4/CaV1.3 interactions may explain the variable expression of CDI in hair cells. The detailed mechanisms by which CaM-like molecules produce their effects appear to be complex and remain to be fully understood (Lee et al., 2002; Haeseleer et al., 2004; Zhou et al., 2004, 2005). Nonetheless, CaBP/CaV1.3 interaction promises to be an interesting instance of this general mechanism, with high potential relevance for the auditory system.
Footnotes
This work was supported by grants from the National Institutes of Health (D.T.Y., P.A.F.).We thank Nicholas Cher for collaboration on certain experiments and Michael Tadross for in-depth comments. Dr. Françoise Haeseleer generously provided antibodies, peptides, and cDNA constructs for CaBPs.
References
- Agler HL, Evans J, Tay LH, Anderson MJ, Colecraft HM, Yue DT. G protein-gated inhibitory module of N-type (CaV2.2) Ca2+ channels. Neuron. 2005;46:891–904. doi: 10.1016/j.neuron.2005.05.011. [DOI] [PubMed] [Google Scholar]
- Alseikhan BA, DeMaria CD, Colecraft HM, Yue DT. Engineered calmodulins reveal the unexpected eminence of Ca2+ channel inactivation in controlling heart excitation. Proc Natl Acad Sci USA. 2002;99:17185–17190. doi: 10.1073/pnas.262372999. [DOI] [PMC free article] [PubMed] [Google Scholar]
- Ashcroft FM, Rorsman P. Electrophysiology of the pancreatic beta-cell. Prog Biophys Mol Biol. 1989;54:87–143. doi: 10.1016/0079-6107(89)90013-8. [DOI] [PubMed] [Google Scholar]
- Beutner D, Moser T. The presynaptic function of mouse cochlear inner hair cells during development of hearing. J Neurosci. 2001;21:4593–4599. doi: 10.1523/JNEUROSCI.21-13-04593.2001. [DOI] [PMC free article] [PubMed] [Google Scholar]
- Brandt A, Striessnig J, Moser T. CaV1.3 channels are essential for development and presynaptic activity of cochlear inner hair cells. J Neurosci. 2003;23:10832–10840. doi: 10.1523/JNEUROSCI.23-34-10832.2003. [DOI] [PMC free article] [PubMed] [Google Scholar]
- Brandt A, Khimich D, Moser T. Few CaV1.3 channels regulate the exocytosis of a synaptic vesicle at the hair cell ribbon synapse. J Neurosci. 2005;25:11577–11585. doi: 10.1523/JNEUROSCI.3411-05.2005. [DOI] [PMC free article] [PubMed] [Google Scholar]
- Brody DL, Patil PG, Mulle JG, Snutch TP, Yue DT. Bursts of action potential waveforms relieve G-protein inhibition of recombinant P/Q-type Ca2+ channels in HEK 293 cells. J Physiol (Lond) 1997;499:637–644. doi: 10.1113/jphysiol.1997.sp021956. [DOI] [PMC free article] [PubMed] [Google Scholar]
- Burgoyne RD, Weiss JL. The neuronal calcium sensor family of Ca2+-binding proteins. Biochem J. 2001;353:1–12. [PMC free article] [PubMed] [Google Scholar]
- Chaudhuri D, Chang SY, DeMaria CD, Alvania RS, Soong TW, Yue DT. Alternative splicing as a molecular switch for Ca2+/calmodulin-dependent facilitation of P/Q-type Ca2+ channels. J Neurosci. 2004;24:6334–6342. doi: 10.1523/JNEUROSCI.1712-04.2004. [DOI] [PMC free article] [PubMed] [Google Scholar]
- Chaudhuri D, Alseikhan BA, Chang SY, Soong TW, Yue DT. Developmental activation of calmodulin-dependent facilitation of cerebellar P-type Ca2+ current. J Neurosci. 2005;25:8282–8294. doi: 10.1523/JNEUROSCI.2253-05.2005. [DOI] [PMC free article] [PubMed] [Google Scholar]
- Chaudhuri D, Issa J, Yue DT. Elementary mechanisms underlying calmodulin-dependent facilitation of P/Q-type (CaV2.1) Ca2+ channels. Biophys J. 2006;90:233a. [Google Scholar]
- de Leon M, Wang Y, Jones L, Perez-Reyes E, Wei X, Soong TW, Snutch TP, Yue DT. Essential Ca2+-binding motif for Ca2+-sensitive inactivation of L-type Ca2+ channels. Science. 1995;270:1502–1506. doi: 10.1126/science.270.5241.1502. [DOI] [PubMed] [Google Scholar]
- DeMaria CD, Soong TW, Alseikhan BA, Alvania RS, Yue DT. Calmodulin bifurcates the local Ca2+ signal that modulates P/Q-type Ca2+ channels. Nature. 2001;411:484–489. doi: 10.1038/35078091. [DOI] [PubMed] [Google Scholar]
- Dou H, Vazquez AE, Namkung Y, Chu H, Cardell EL, Nie L, Parson S, Shin HS, Yamoah EN. Null mutation of alpha1D Ca2+ channel gene results in deafness but no vestibular defect in mice. J Assoc Res Otolaryngol. 2004;5:215–226. doi: 10.1007/s10162-003-4020-3. [DOI] [PMC free article] [PubMed] [Google Scholar]
- Erickson MG, Alseikhan BA, Peterson BZ, Yue DT. Preassociation of calmodulin with voltage-gated Ca2+ channels revealed by FRET in single living cells. Neuron. 2001;31:973–985. doi: 10.1016/s0896-6273(01)00438-x. [DOI] [PubMed] [Google Scholar]
- Erickson MG, Liang H, Mori MX, Yue DT. FRET two-hybrid mapping reveals function and location of L-type Ca2+ channel CaM preassociation. Neuron. 2003;39:97–107. doi: 10.1016/s0896-6273(03)00395-7. [DOI] [PubMed] [Google Scholar]
- Fallon JL, Halling DB, Hamilton SL, Quiocho FA. Structure of calmodulin bound to the hydrophobic IQ domain of the cardiac Cav1.2 calcium channel. Structure. 2005;13:1881–1886. doi: 10.1016/j.str.2005.09.021. [DOI] [PubMed] [Google Scholar]
- Few AP, Lautermilch NJ, Westenbroek RE, Scheuer T, Catterall WA. Differential regulation of CaV2.1 channels by calcium-binding protein 1 and visinin-like protein-2 requires N-terminal myristoylation. J Neurosci. 2005;25:7071–7080. doi: 10.1523/JNEUROSCI.0452-05.2005. [DOI] [PMC free article] [PubMed] [Google Scholar]
- Furness DN, Hulme JA, Lawton DM, Hackney CM. Distribution of the glutamate/aspartate transporter GLAST in relation to the afferent synapses of outer hair cells in the guinea pig cochlea. J Assoc Res Otolaryngol. 2002;3:234–247. doi: 10.1007/s101620010064. [DOI] [PMC free article] [PubMed] [Google Scholar]
- Glowatzki E, Fuchs PA. Transmitter release at the hair cell ribbon synapse. Nat Neurosci. 2002;5:147–154. doi: 10.1038/nn796. [DOI] [PubMed] [Google Scholar]
- Glueckert R, Wietzorrek G, Kammen-Jolly K, Scholtz A, Stephan K, Striessnig J, Schrott-Fischer A. Role of class D L-type Ca2+ channels for cochlear morphology. Hear Res. 2003;178:95–105. doi: 10.1016/s0378-5955(03)00054-6. [DOI] [PubMed] [Google Scholar]
- Haeseleer F, Sokal I, Verlinde CL, Erdjument-Bromage H, Tempst P, Pronin AN, Benovic JL, Fariss RN, Palczewski K. Five members of a novel Ca2+-binding protein (CaBP) subfamily with similarity to calmodulin. J Biol Chem. 2000;275:1247–1260. doi: 10.1074/jbc.275.2.1247. [DOI] [PMC free article] [PubMed] [Google Scholar]
- Haeseleer F, Imanishi Y, Maeda T, Possin DE, Maeda A, Lee A, Rieke F, Palczewski K. Essential role of Ca2+-binding protein 4, a CaV1.4 channel regulator, in photoreceptor synaptic function. Nat Neurosci. 2004;7:1079–1087. doi: 10.1038/nn1320. [DOI] [PMC free article] [PubMed] [Google Scholar]
- Ho S, Hunt H, Horton R, Pullen J, Pease L. Site-directed mutagenesis by overlap extension using the polymerase chain reaction. Gene. 1989;77:51–59. doi: 10.1016/0378-1119(89)90358-2. [DOI] [PubMed] [Google Scholar]
- Kollmar R, Fak J, Montgomery LG, Hudspeth AJ. Hair cell-specific splicing of mRNA for the alpha1D subunit of voltage-gated Ca2+ channels in the chicken's cochlea. Proc Natl Acad Sci USA. 1997;94:14889–14893. doi: 10.1073/pnas.94.26.14889. [DOI] [PMC free article] [PubMed] [Google Scholar]
- Koschak A, Reimer D, Huber I, Grabner M, Glossmann H, Engel J, Striessnig J. alpha 1D (Cav1.3) subunits can form l-type Ca2+ channels activating at negative voltages. J Biol Chem. 2001;276:22100–22106. doi: 10.1074/jbc.M101469200. [DOI] [PubMed] [Google Scholar]
- Lautermilch NJ, Few AP, Scheuer T, Catterall WA. Modulation of CaV2.1 channels by the neuronal calcium-binding protein visinin-like protein-2. J Neurosci. 2005;25:7062–7070. doi: 10.1523/JNEUROSCI.0447-05.2005. [DOI] [PMC free article] [PubMed] [Google Scholar]
- Lee A, Westenbroek RE, Haeseleer F, Palczewski K, Scheuer T, Catterall WA. Differential modulation of Ca(v)2.1 channels by calmodulin and Ca2+-binding protein 1. Nat Neurosci. 2002;5:210–217. doi: 10.1038/nn805. [DOI] [PMC free article] [PubMed] [Google Scholar]
- Lewis RS, Hudspeth AJ. Voltage- and ion-dependent conductances in solitary vertebrate hair cells. Nature. 1983;304:538–541. doi: 10.1038/304538a0. [DOI] [PubMed] [Google Scholar]
- Liang H, DeMaria CD, Erickson MG, Mori MX, Alseikhan BA, Yue DT. Unified mechanisms of Ca2+ regulation across the Ca2+ channel family. Neuron. 2003;39:951–960. doi: 10.1016/s0896-6273(03)00560-9. [DOI] [PubMed] [Google Scholar]
- Lioudyno M, Hiel H, Kong JH, Katz E, Waldman E, Parameshwaran-Iyer S, Glowatzki E, Fuchs PA. A “synaptoplasmic cistern” mediates rapid inhibition of cochlear hair cells. J Neurosci. 2004;24:11160–11164. doi: 10.1523/JNEUROSCI.3674-04.2004. [DOI] [PMC free article] [PubMed] [Google Scholar]
- Lipscombe D, Pan JQ, Gray AC. Functional diversity in neuronal voltage-gated calcium channels by alternative splicing of Cavalpha1. Mol Neurobiol. 2002;26:21–44. doi: 10.1385/MN:26:1:021. [DOI] [PubMed] [Google Scholar]
- Lustig LR, Hiel H, Fuchs PA. Vestibular hair cells of the chick express the nicotinic acetylcholine receptor subunit alpha 9. J Vestib Res. 1999;9:359–367. [PubMed] [Google Scholar]
- Mangoni ME, Couette B, Bourinet E, Platzer J, Reimer D, Striessnig J, Nargeot J. Functional role of L-type Cav1.3 Ca2+ channels in cardiac pacemaker activity. Proc Natl Acad Sci USA. 2003;100:5543–5548. doi: 10.1073/pnas.0935295100. [DOI] [PMC free article] [PubMed] [Google Scholar]
- Marcotti W, Johnson SL, Rusch A, Kros CJ. Sodium and calcium currents shape action potentials in immature mouse inner hair cells. J Physiol (Lond) 2003;552:743–761. doi: 10.1113/jphysiol.2003.043612. [DOI] [PMC free article] [PubMed] [Google Scholar]
- McRory JE, Hamid J, Doering CJ, Garcia E, Parker R, Hamming K, Chen L, Hildebrand M, Beedle AM, Feldcamp L, Zamponi GW, Snutch TP. The CACNA1F gene encodes an L-type calcium channel with unique biophysical properties and tissue distribution. J Neurosci. 2004;24:1707–1718. doi: 10.1523/JNEUROSCI.4846-03.2004. [DOI] [PMC free article] [PubMed] [Google Scholar]
- Michna M, Knirsch M, Hoda JC, Muenkner S, Langer P, Platzer J, Striessnig J, Engel J. Cav1.3 (alpha1D) Ca2+ currents in neonatal outer hair cells of mice. J Physiol (Lond) 2003;553:747–758. doi: 10.1113/jphysiol.2003.053256. [DOI] [PMC free article] [PubMed] [Google Scholar]
- Mori MX, Erickson MG, Yue DT. Functional stoichiometry and local enrichment of calmodulin interacting with Ca2+ channels. Science. 2004;304:432–435. doi: 10.1126/science.1093490. [DOI] [PubMed] [Google Scholar]
- Namkung Y, Skrypnyk N, Jeong MJ, Lee T, Lee MS, Kim HL, Chin H, Suh PG, Kim SS, Shin HS. Requirement for the L-type Ca2+ channel alpha(1D) subunit in postnatal pancreatic beta cell generation. J Clin Invest. 2001;108:1015–1022. doi: 10.1172/JCI13310. [DOI] [PMC free article] [PubMed] [Google Scholar]
- Perez-Reyes E, Castellano A, Kim HS, Bertrand P, Baggstrom E, Lacerda AE, Wei XY, Birnbaumer L. Cloning and expression of a cardiac/brain beta subunit of the L-type calcium channel. J Biol Chem. 1992;267:1792–1797. [PubMed] [Google Scholar]
- Peterson BZ, DeMaria CD, Adelman JP, Yue DT. Calmodulin is the Ca2+ sensor for Ca2+-dependent inactivation of L-type calcium channels. Neuron. 1999;22:549–558. doi: 10.1016/s0896-6273(00)80709-6. [DOI] [PubMed] [Google Scholar]
- Peterson BZ, Lee JS, Mulle JG, Wang Y, de Leon M, Yue DT. Critical determinants of Ca2+-dependent inactivation within an EF-hand motif of L-type Ca2+ channels. Biophys J. 2000;78:1906–1920. doi: 10.1016/S0006-3495(00)76739-7. [DOI] [PMC free article] [PubMed] [Google Scholar]
- Plant TD. Properties and calcium-dependent inactivation of calcium currents in cultured mouse pancreatic B-cells. J Physiol (Lond) 1988;404:731–747. doi: 10.1113/jphysiol.1988.sp017316. [DOI] [PMC free article] [PubMed] [Google Scholar]
- Platzer J, Engel J, Schrott-Fischer A, Stephan K, Bova S, Chen H, Zheng H, Striessnig J. Congenital deafness and sinoatrial node dysfunction in mice lacking class D L-type Ca2+ channels. Cell. 2000;102:89–97. doi: 10.1016/s0092-8674(00)00013-1. [DOI] [PubMed] [Google Scholar]
- Robertson D, Paki B. Role of L-type Ca2+ channels in transmitter release from mammalian inner hair cells. II. Single-neuron activity. J Neurophysiol. 2002;87:2734–2740. doi: 10.1152/jn.2002.87.6.2734. [DOI] [PubMed] [Google Scholar]
- Safa P, Boulter J, Hales TG. Functional properties of Cav1.3 (alpha1D) L-type Ca2+ channel splice variants expressed by rat brain and neuroendocrine GH3 cells. J Biol Chem. 2001;276:38727–38737. doi: 10.1074/jbc.M103724200. [DOI] [PubMed] [Google Scholar]
- Schnee ME, Ricci AJ. Biophysical and pharmacological characterization of voltage-gated calcium currents in turtle auditory hair cells. J Physiol (Lond) 2003;549:697–717. doi: 10.1113/jphysiol.2002.037481. [DOI] [PMC free article] [PubMed] [Google Scholar]
- Sejnowski TJ, Yodlowski ML. A freeze-fracture study of the skate electroreceptor. J Neurocytol. 1982;11:897–912. doi: 10.1007/BF01148307. [DOI] [PubMed] [Google Scholar]
- Shen Y, Yu D, Hiel H, Liao P, Yue DT, Fuchs PA, Soong TW. Alternative splicing of the CaV1.3 channel IQ domain: a molecular switch for Ca2+-dependent inactivation within auditory hair cells. J Neurosci. 2006;26:XXXX–XXXX. doi: 10.1523/JNEUROSCI.2093-06.2006. [DOI] [PMC free article] [PubMed] [Google Scholar]
- Sidi S, Busch-Nentwich E, Friedrich R, Schoenberger U, Nicolson T. Gemini encodes a zebrafish L-type calcium channel that localizes at sensory hair cell ribbon synapses. J Neurosci. 2004;24:4213–4223. doi: 10.1523/JNEUROSCI.0223-04.2004. [DOI] [PMC free article] [PubMed] [Google Scholar]
- Song H, Nie L, Rodriguez-Contreras A, Sheng ZH, Yamoah EN. Functional interaction of auxiliary subunits and synaptic proteins with Ca(v)1.3 may impart hair cell Ca2+ current properties. J Neurophysiol. 2003;89:1143–1149. doi: 10.1152/jn.00482.2002. [DOI] [PubMed] [Google Scholar]
- Soong TW, DeMaria CD, Alvania RS, Zweifel LS, Liang MC, Mittman S, Agnew WS, Yue DT. Systematic identification of splice variants in human P/Q-type channel alpha1(2.1) subunits: implications for current density and Ca2+-dependent inactivation. J Neurosci. 2002;22:10142–10152. doi: 10.1523/JNEUROSCI.22-23-10142.2002. [DOI] [PMC free article] [PubMed] [Google Scholar]
- Sterling P, Matthews G. Structure and function of ribbon synapses. Trends Neurosci. 2005;28:20–29. doi: 10.1016/j.tins.2004.11.009. [DOI] [PubMed] [Google Scholar]
- Stratton J, Evans J, Erickson MG, Alvania RS, Yue DT. The nature of concentration-dependent spurious FRET arising from CFP and YFP. Biophys J. 2004;86:317a. [Google Scholar]
- Sueta T, Zhang SY, Sellick PM, Patuzzi R, Robertson D. Effects of a calcium channel blocker on spontaneous neural noise and gross action potential waveforms in the guinea pig cochlea. Hear Res. 2004;188:117–125. doi: 10.1016/S0378-5955(03)00374-5. [DOI] [PubMed] [Google Scholar]
- Tang W, Halling DB, Black DJ, Pate P, Zhang JZ, Pedersen S, Altschuld RA, Hamilton SL. Apocalmodulin and Ca2+ calmodulin-binding sites on the CaV1.2 channel. Biophys J. 2003;85:1538–1547. doi: 10.1016/s0006-3495(03)74586-x. [DOI] [PMC free article] [PubMed] [Google Scholar]
- Tomlinson WJ, Stea A, Bourinet E, Charnet P, Nargeot J, Snutch TP. Functional properties of a neuronal class C L-type calcium channel. Neuropharmacology. 1993;32:1117–1126. doi: 10.1016/0028-3908(93)90006-o. [DOI] [PubMed] [Google Scholar]
- Tsujimoto T, Jeromin A, Saitoh N, Roder JC, Takahashi T. Neuronal calcium sensor 1 and activity-dependent facilitation of P/Q-type calcium currents at presynaptic nerve terminals. Science. 2002;295:2276–2279. doi: 10.1126/science.1068278. [DOI] [PubMed] [Google Scholar]
- Van Petegem F, Clark KA, Chatelain FC, Minor DL., Jr Structure of a complex between a voltage-gated calcium channel beta-subunit and an alpha-subunit domain. Nature. 2004;429:671–675. doi: 10.1038/nature02588. [DOI] [PMC free article] [PubMed] [Google Scholar]
- Vollrath L, Spiwoks-Becker I. Plasticity of retinal ribbon synapses. Microsc Res Tech. 1996;35:472–487. doi: 10.1002/(SICI)1097-0029(19961215)35:6<472::AID-JEMT6>3.0.CO;2-K. [DOI] [PubMed] [Google Scholar]
- Wei SK, Colecraft HM, DeMaria CD, Peterson BZ, Zhang R, Kohout TA, Rogers TB, Yue DT. Ca2+ channel modulation by recombinant auxiliary beta subunits expressed in young adult heart cells. Circ Res. 2000;86:175–184. doi: 10.1161/01.res.86.2.175. [DOI] [PubMed] [Google Scholar]
- Wei XY, Perez-Reyes E, Lacerda AE, Schuster G, Brown AM, Birnbaumer L. Heterologous regulation of the cardiac Ca2+ channel alpha 1 sub-unit by skeletal muscle beta and gamma subunits: implications for the structure of cardiac L-type Ca2+ channels. J Biol Chem. 1991;266:21943–21947. [PubMed] [Google Scholar]
- Xu W, Lipscombe D. Neuronal Ca(V)1.3alpha(1) L-type channels activate at relatively hyperpolarized membrane potentials and are incompletely inhibited by dihydropyridines. J Neurosci. 2001;21:5944–5951. doi: 10.1523/JNEUROSCI.21-16-05944.2001. [DOI] [PMC free article] [PubMed] [Google Scholar]
- Yang J, McBride S, Mak DO, Vardi N, Palczewski K, Haeseleer F, Foskett JK. Identification of a family of calcium sensors as protein ligands of inositol trisphosphate receptor Ca(2+) release channels. Proc Natl Acad Sci USA. 2002;99:7711–7716. doi: 10.1073/pnas.102006299. [DOI] [PMC free article] [PubMed] [Google Scholar]
- Zhang Z, Xu Y, Song H, Rodriguez J, Tuteja D, Namkung Y, Shin HS, Chiamvimonvat N. Functional roles of Ca(v)1.3 (alpha(1D)) calcium channel in sinoatrial nodes: insight gained using gene-targeted null mutant mice. Circ Res. 2002;90:981–987. doi: 10.1161/01.res.0000018003.14304.e2. [DOI] [PubMed] [Google Scholar]
- Zhou H, Kim SA, Kirk EA, Tippens AL, Sun H, Haeseleer F, Lee A. Ca2+-binding protein-1 facilitates and forms a postsynaptic complex with Cav1.2 (L-type) Ca2+ channels. J Neurosci. 2004;24:4698–4708. doi: 10.1523/JNEUROSCI.5523-03.2004. [DOI] [PMC free article] [PubMed] [Google Scholar]
- Zhou H, Yu K, McCoy KL, Lee A. Molecular mechanism for divergent regulation of Cav1.2 Ca2+ channels by calmodulin and Ca2+-binding protein-1. J Biol Chem. 2005;280:29612–29619. doi: 10.1074/jbc.M504167200. [DOI] [PubMed] [Google Scholar]
- Zidanic M, Fuchs PA. Kinetic analysis of barium currents in chick cochlear hair cells. Biophys J. 1995;68:1323–1336. doi: 10.1016/S0006-3495(95)80305-X. [DOI] [PMC free article] [PubMed] [Google Scholar]
- Zuhlke RD, Pitt GS, Deisseroth K, Tsien RW, Reuter H. Calmodulin supports both inactivation and facilitation of L-type calcium channels. Nature. 1999;399:159–162. doi: 10.1038/20200. [DOI] [PubMed] [Google Scholar]