

Abstract
Central pattern generators (CPGs) control both swimming and crawling in the medicinal leech. To investigate whether the neurons comprising these two CPGs are dedicated or multifunctional, we used voltage-sensitive dye imaging to record from ∼80% of the ∼400 neurons in a segmental ganglion. By eliciting swimming and crawling in the same preparation, we were able to identify neurons that participated in either of the two rhythms, or both. More than twice as many cells oscillated in-phase with crawling (188) compared with swimming (90). Surprisingly, 84 of the cells (93%) that oscillated with swimming also oscillated with crawling. We then characterized two previously unidentified interneurons, cells 255 and 257, that had interesting activity patterns based on the imaging results. Cell 255 proved to be a multifunctional interneuron that oscillates with and can perturb both rhythms, whereas cell 257 is an interneuron dedicated to crawling. These results show that the swimming and crawling networks are driven by both multifunctional and dedicated circuitry.
Keywords: central pattern generator, multifunctional circuitry, dedicated circuitry, live-cell imaging, single-trial analysis, motor control
Introduction
Central pattern generators (CPGs) have been shown to be the computational kernel underlying the generation of many rhythmic behaviors in both vertebrate and invertebrate nervous systems (Marder and Calabrese, 1996; Kiehn and Butt, 2003; Marder et al., 2005; Stein, 2005). CPGs drive motor neurons to activate muscles in precise spatiotemporal patterns. When the same muscles are used to generate multiple, mutually exclusive rhythmic behaviors, two models have been proposed for the organization of the underlying CPGs: dedicated circuitry or reorganizing circuitry (Morton and Chiel, 1994). Dedicated circuitry refers to an architecture in which anatomically distinct neuron populations are used exclusively to generate behaviors. Such an organization has been observed in locusts, in which two different interneuron pools that control walking and flight converge on the same (bifunctional) muscles (Ramirez and Pearson, 1988). In vivo calcium imaging experiments in zebrafish spinal cord have also demonstrated that two different sets of interneurons drive swimming and escape behaviors, suggesting that dedicated circuitry is also used by vertebrates (Ritter et al., 2001).
In contrast, the concept of reorganizing (or multifunctional) circuitry posits some degree of overlap between multiple CPGs. This type of organization is a common feature of many invertebrate nervous systems (Weimann and Marder, 1994; Kristan and Shaw, 1997; Popescu and Frost, 2002; Jing et al., 2004) and is just beginning to be studied in the vertebrate spinal cord (Berkowitz, 2005). In the extreme, a single network can be dynamically reconfigured by neuromodulation to generate multiple rhythms (Nusbaum et al., 2001). Although studies of multifunctional networks have demonstrated the remarkable versatility of individual neurons, most have been performed by recording from single neurons during ongoing rhythms. This approach limits the ability to determine the full extent of the multifunctional overlap between networks of neurons. We have used fluorescence resonance energy transfer (FRET)-based voltage-sensitive dye (VSD) imaging in the nervous system of the medicinal leech (Cacciatore et al., 1999; Taylor et al., 2003; Briggman et al., 2005) to determine the degree of overlap among neurons underlying two mutually exclusive behaviors.
Materials and Methods
Preparation.
Animals were adult Hirudo medicinalis (2–5 g), the European medicinal leech, obtained from Leeches USA (Westbury, NY) and maintained in artificial pond water at 15°C. To reliably evoke swimming and crawling, all experiments were performed between the months of January through May. In all experiments, we dissected out the full nerve cord, including the head brain, all 21 segmental ganglia, and the tail brain, and then removed the blood sinus around the ganglion to be imaged, ganglion 10 (G10). We dissected away the connective tissue sheath from the ventral or dorsal surface of this ganglion before applying the voltage-sensitive dyes. For imaging the ventral surface, we removed the two large Retzius cells to expose the smaller cells below them. We prepared at least two dorsal posterior (DP) nerves, chosen from between G12 and G15, for extracellular recording and stimulation. The largest spikes in this recording are from cell 3 during both the dorsal contractile phase of swimming (at 1–1.5 Hz) (Kristan and Calabrese, 1976) and the contractile phase of crawling (at 0.04–0.1 Hz) (Eisenhart et al., 2000), so this recording served as a convenient monitor of both the crawling and swimming motor programs. The purpose of recording with two suction electrodes was to confirm the propagation of behaviors down the nerve cord. To elicit swimming, DP(12) or DP(13) was stimulated with 10 ms electrical pulses delivered at 15 Hz, with an amplitude of 2–3 V. We often observed spontaneous swim episodes as well. To elicit crawling, several tail brain nerves were stimulated with a suction electrode using the same stimulus parameters as for DP nerve stimulation (Eisenhart et al., 2000). In all experiments, we stabilized the imaged ganglion by pinning small latex strips across the adjacent nerve cord to minimize the motion artifact (Cacciatore et al., 1999). The preparation was maintained in a chamber filled with ∼10 ml of leech saline at room temperature (20–22°C) consisting of the following (in mm): 115 NaCl, 4KCl, 1.8CaCl2, 1.5 MgCl2, 10 dextrose, 4.6 Tris maleate, and 5.4 Tris base, pH 7.4.
Staining with FRET dyes.
The same staining protocol was used as described previously (Briggman et al., 2005). We used a FRET-based voltage sensitive-dye consisting of a coumarin (donor) molecule and an oxonol (acceptor) molecule (Vertex Pharmaceuticals, La Jolla, CA). Briefly, we bath loaded a 10 μm concentration of coumarin dye in leech saline for 30 min and a 12.5 μm concentration of oxonol dye in leech saline for 30 min. The sensitivity of the fluorescence signals was critically dependent on the oxonol concentration. We replaced the dye solutions with cold leech saline after the staining protocol.
Electrophysiology and cell fills.
We recorded intracellularly from cells using 40–60 MΩ glass microelectrodes filled with 1 m potassium acetate, using an AxoClamp 2A amplifier (Molecular Devices, Palo City, CA). For each experiment, we monitored two cells intracellularly. When recording from the dorsal surface, we impaled cell 1 and cell 3 and recorded for the duration of the experiment. For recording from the ventral surface, we impaled cell CV and cell AE. These recordings provided additional information about the behavioral state of the preparation as well as a measure of the sensitivity of the optical signals. We recorded extracellularly using suction electrodes and a four-channel differential amplifier (model 1600; A-M Systems, Sequim, WA). We digitized all electrical data at 10 kHz using a 16-bit analog-to-digital board (PCI-6035E; National Instruments, Austin, TX) and custom Matlab (Data Acquisition Toolbox; MathWorks, Natick, MA) software. We filled neurons using Alexa 488 dextran (10,000 molecular weight; Invitrogen, Carlsbad, CA). Microelectrodes were backfilled using concentrations of 25 mg/ml Alexa 488. To fill a neuron, we passed current (+3 nA for at least 15 min) through these electrodes while recording from the neuron intracellularly. We allowed the dye to diffuse for 1 h, fixed the tissue overnight in 2% paraformaldehyde in PBS, then dehydrated, cleared, and mounted it on a slide for viewing. We imaged the cell fills using a confocal microscope (1024ES; Bio-Rad, Hercules, CA). Images in Figures 7 and 8 are maximal projections from confocal stacks that were inverted to emphasize the fine structure of the neuronal processes. Both cells 255 and 257 are difficult to locate and are often buried under other neurons located in the posterior medial packet on the ventral surface.
Figure 7.
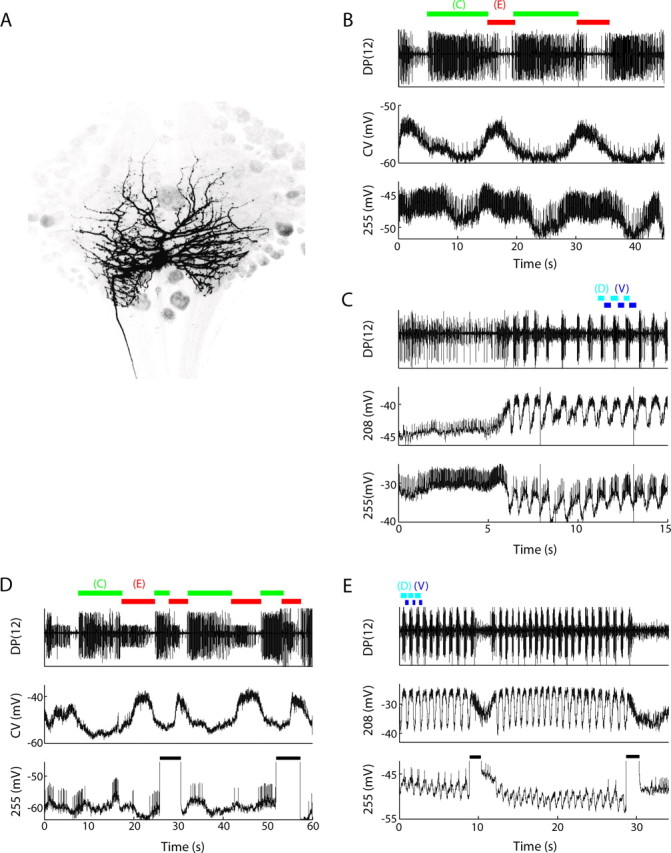
Cell 255 is a multifunctional interneuron. A, The morphology of cell 255, located in the posterior medial glial packet on the ventral surface. B, Dual intracellular recording of cell CV, a motor neuron to the ventral circular muscles, and cell 255, along with an extracellular recording of cell 3 spikes in the DP nerve. The DP recording was used to determine the timing of the contraction (C, green) and elongation (E, red) phases of the crawling motor program. Cell 255 oscillated in-phase with cell CV, depolarizing during the elongation phase of crawling. C, A dual intracellular recording of cell 208 and cell 255, along with a DP nerve recording to monitor the dorsal (D, cyan) and ventral (V, blue) phases of the swimming motor program. Cell 255 slightly led the oscillation of cell 208 and oscillated around a hyperpolarized potential below resting potential. D, Effects of depolarizing cell 255 on the crawling motor program. The recordings are the same as in B. Depolarizing current (+2 nA for 3–5 s; black horizontal bars) injected into cell 255 during the contraction phase of crawling terminated contraction and initiated elongation. The cell was held slightly hyperpolarized (−0.1 nA) during this trial. E, Effects of depolarizing cell 255 on the swimming motor program. The recordings are the same as in C. Depolarizing current (+2 nA for 1–2 s; black horizontal bars) injected into cell 255 terminated swimming.
Figure 8.

Cell 257 is a dedicated interneuron. A, The morphology of cell 257, located in the posterior medial glial packet on the ventral surface. B, Dual intracellular recording of cell AE and cell 257 along with an extracellular recording from a DP nerve in a nearby segmental ganglion to determine the contraction and elongation phases of the crawling motor program. Cell 257 oscillated 180° out-of-phase with cell AE, producing high-frequency impulse bursts in the elongation phase of crawling. C, Dual intracellular recording of cell CV and cell 257, along with an extracellular recording from a DP nerve to determine the dorsal and ventral phases of the swimming motor program. Cell 257 became strongly hyperpolarized during swim episodes. C, Contraction; E, elongation; D, dorsal; V, ventral.
Optical recording.
We used the optical recording system described previously (Briggman et al., 2005). Briefly, signals were acquired by ratioing alternating frames recording with a cooled CCD camera (NeuroCCD-SM256; RedShirtImaging, Fairfield, CT) at a resolution of 256 × 256 pixels. The frame rate was set according to which behavior was recorded. For swimming, images were acquired at 20 Hz, yielding ratioed signals at 10 Hz. Trials at this frame rate were 10 s in duration. For crawling, 50 ms frames were acquired twice per second, yielding 2 Hz ratioed signals. Trials at this frame rate were 60 s in duration. In the 2 Hz configuration, the excitation light was shuttered off in between frame captures to limit phototoxicity. Imaging data were acquired using custom software written in Matlab (Data Acquisition Toolbox; MathWorks). We synchronized the optical and electrical recordings by feeding the frame timing signals emitted by the camera into the analog-to-digital board, along with all of the electrophysiology signals.
Analysis.
In a typical experiment, we imaged at least five trials each of swimming and crawling. Swimming and crawling trials were analyzed separately. After acquiring the data, we manually outlined cell bodies and analyzed the resulting fluorescence signals using Matlab. The phase and magnitude of the coherence were calculated (Taylor et al., 2003) for each cell at the peak oscillation frequency of each behavior. This frequency ranged between 0.04 and 0.1 Hz for crawling and 1 and 1.5 Hz for swimming. For coherence estimates, we used a frequency resolution of 0.67 Hz for swimming and 0.05 Hz for crawling. The α level for significance was chosen so that the multiple comparisons level for any trial did not exceed 0.05. For experiments imaging the dorsal surface of the ganglion, the optical signal of a cell 3 was used as the reference for both swimming and crawling. The phase plots were aligned to the know phase of cell 3 in swimming and crawling. For experiments imaging the ventral surface of the ganglion, the optical signal of cell AE was used as the reference for crawling. Phase plots for ventral crawling were aligned to the known phase of cell AE during crawling. Because neither cell AE nor cell CV oscillate during swimming, a cell in the anterior lateral glial packet with a consistently large oscillation during swimming was used as a reference. Phase plots for ventral swimming were then aligned to the known phase of cell 208 during swimming (70°) (Friesen, 1989). Cell 208 was identified intracellularly at the completion of each ventral surface imaging experiment. For the generation of summary phase maps, three criteria were set for inclusion: (1) a cell oscillated with the same phase in swimming and/or crawling in four of eight dorsal experiments or four of six ventral experiments; (2) it was in the same area of the same glial packet; and 3) its soma was approximately the same diameter. Averaged across preparations, 68 ± 8% (mean ± SD; n = 14) of the cells with a significant oscillation fit the three criteria. Several sources of variability between preparations led to cells not meeting the criteria, including variability in desheathing, sensitivity of optical signals, and the particular imaging plane used. We chose the above criteria to emphasize the most consistent results. Because all identified neurons on the dorsal surface and lateral glial packets on the ventral surface are symmetrically paired neurons, we added neurons fitting the inclusion criteria symmetrically to these packets in the summary maps but not to the ventral medial packets.
Results
The two behaviors we studied are swimming and crawling. The medicinal leech coordinates the same sets of longitudinal and circular muscles in fundamentally different ways to achieve these two forms of locomotion, both of which are produced by a CPG (Kristan and Calabrese, 1976; Eisenhart et al., 2000). Importantly, a leech cannot both swim and crawl at the same time. We were interested in whether the two underlying CPGs consist of separate pools of interneurons or, instead, have overlapping neuronal pools. For example, cell 208, a neuron recently implicated in decision making (Briggman et al., 2005), is known to oscillate with both swimming (Weeks, 1982) and crawling (Baader, 1997). Because we are ultimately interested in the behavioral choice between these two behaviors, we also need to understand the interaction between their CPGs.
The neuronal mechanisms underlying swimming have been extensively studied (Brodfuehrer et al., 1995; Kristan et al., 2005). Swimming movements are produced by alternating dorsal and ventral contractions of longitudinal muscles that propagate down the length of the animal (Fig. 1 A) (Stent et al., 1978). During this behavior, dorsoventral muscles are tonically active, helping the animal to flatten. Primarily inhibitory interactions between CPG interneurons are responsible for driving the oscillatory contractions (Friesen, 1989). In contrast, although a CPG underlies crawling (Cacciatore et al., 2000; Eisenhart et al., 2000), none of the interneurons responsible for the rhythm have been identified. In each segment, crawling consists of the contraction of circular muscles, causing elongation of the body, alternating with the co-contraction of dorsal and ventral longitudinal muscles, causing a segmental contraction (Fig. 1 B). The elongations and contractions propagate from segment to segment down the length of the leech. The nervous system can switch between crawling and swimming rapidly, certainly within 1 or 2 s (see Fig. 6 E).
Figure 1.

Swimming and crawling motor patterns in the isolated leech nervous system. A, Swimming consists of alternating dorsal and ventral contractions of longitudinal muscles. B, A crawling step is achieved by contraction of circular muscles causing elongation, followed by activation of longitudinal muscles causing contraction. C, The dorsal surface of G10, stained with the voltage-sensitive dyes and imaged at the peak emission wavelength for one of them (coumarin) (González et al., 1999). Cell 1 and cell 3 were recorded intracellularly throughout all dorsal surface experiments. D, An example of a crawling episode, defined by alternating contraction (C, green bars) and elongation (E, red bars) that propagates down the nerve cord, recorded in nerves DP(12) and DP(13). Intracellular recordings from cells 1 and 3 in G10 are shown as black traces. The simultaneously recorded raw optical signals are overlaid in red. Cells 1 and 3 oscillated 180° out-of-phase to one another during crawling. E, An example of a swimming episode, defined by alternating dorsal (D, cyan bars) motor neuron bursts and ventral (V, blue bars) motor neuron bursts that propagated down the nerve cord, recorded in nerves DP(12) and DP(13). Intracellular recordings (black traces) and optical signals (red traces) for cells 1 and 3 are shown; they oscillated 90° out-of-phase during swimming. F, The phase (circumferential axis) and magnitude (radial axis) of the coherence during crawling of all optically recorded cells shown in C. Color-coded cells were significantly coherent with cell 3 at the peak crawling frequency (0.09 Hz in this example). The dashed line indicates the threshold for significance (multiple comparisons α < 0.05). Error bars for the phase and magnitude represent 1 SE. G, The phase and magnitude of the coherence during swimming. Color-coded cells were significantly coherent with cell 3 at the peak swimming frequency (1.3 Hz in this example).
Figure 6.

Analysis of the summary phase maps. A, The distribution of cells from the summary phase maps in each phase of swimming. The total number of cells (dorsal surface plus ventral surface) are shown. B, The total distribution of cells from the summary phase maps in each phase of crawling. C, A Venn diagram showing the total number of cells that oscillated with crawling (188 cells), with swimming (90 cells), and cells that oscillated with both behaviors (84 cells). There are ∼400 total neurons in G10. D, The distribution of phase combinations for cells that oscillated with both crawling and swimming. Numbers below and to the right of the diagonal inside each box indicate the number of cells that oscillated for each combination. Numbers above and to the left of the diagonal indicate the expected counts if the swimming and crawling phases were independent. The distribution of combinations of swimming and crawling phases were not significantly different (Fisher–Freeman–Halton exact test, p = 0.148). E, Intracellular recordings from two cells demonstrating two of the phase combinations (cyan/green and blue/green). The left shows a transition from crawling (0–50 s) to swimming (50–60 s). The right is an enlargement of the last 15 s of the recording, to show the phases of the oscillations of the two neurons. Cell 3 (black trace) is an example of a cyan/green combination, and cell 4 (gray trace) is an example of a blue/green combination. C, Contraction; E, elongation; DC, dorsal contraction; VC, ventral contraction.
Coherent swimming and crawling oscillations on the dorsal surface
Our strategy for examining the overlap between the crawling and swimming CPGs was to image all of the neurons in a segmental ganglion during the two ongoing motor rhythms. We used isolated, intact nerve cords and desheathed either the dorsal (Fig. 1 C) or ventral (see Fig. 3 A) side of segmental G10 for VSD imaging. Figure 1 D is an episode of crawling while imaging the dorsal surface of one such preparation, and Figure 1 E is a swimming episode from the same preparation. We recorded the motor neuron patterns for both behaviors as motor impulses in DP nerves from segments 12 and 13 [Fig. 1 D,E, DP(12), DP(13)]. Each time we recorded optically from the dorsal ganglion surface, we also recorded intracellularly from two motor neurons, cell 1 and cell 3 (Fig. 1 C), to calibrate the VSD recordings. Cell 3 excites dorsal longitudinal muscles, whereas cell 1 inhibits these same muscles as well as cell 3. The raw optical signals from these two cells (Fig. 1 D,E, red lines) consistently provided accurate measures of their intracellular recordings (Fig. 1 D,E, black traces). The phase shift of the optical signals relative to the intracellular recordings (Fig. 1 E) is attributable to the time constant of the VSD (Cacciatore et al., 1999). To quantify the phase relationships among all cells, we calculated the phase and magnitude of the coherence between the optical signal of cell 3 and every other cell at the dominant frequency for each behavior (Cacciatore et al., 1999; Taylor et al., 2003) (see Materials and Methods). Polar plots show the magnitude and phase of those cells that were significantly coherent. Each polar plot was divided into color-coded quadrants (Fig. 1 F,G). For crawling, we arbitrarily denoted the peak of elongation as 0° (Fig. 1 F, red points) and the peak of contraction as 180° (Fig. 1 F, green points). For swimming, we denoted the peak dorsal contraction as 0° (Fig. 1 G, cyan points) and the peak ventral contraction as 180° (Fig. 1 G, blue points). For both behaviors, cells that were not significantly coherent are shown in black on the polar plots.
Figure 3.

Imaging the ventral surface during crawling and swimming motor patterns. A, The ventral surface of G10, stained with the VSD at the coumarin emission wavelength. For all ventral surface experiments, cell AE and cell CV were intracellularly recorded. B, A sample crawling episode with intracellular (black traces) and optical (red traces) signals from cells CV and AE showing that they are 180° out-of-phase during crawling. C, Contraction; E, elongation. C, A sample swimming episode recorded while imaging the ventral surface. Cells CV and AE were not rhythmically active during swimming, as indicated by both the electrical (black) and optical (red) traces. D, Dorsal; V, ventral. D, The phase (circumferential axis) and magnitude (radial axis) of the coherence of cells on the ventral surface in A during the crawling motor pattern. Color-coded cells were significantly coherent with cell AE at the peak crawling frequency (0.08 Hz in this example). E, The phase and magnitude of the coherence of cells on the ventral surface during the swimming motor pattern. For experiments on the ventral surface of the ganglion, a cell with a consistently large oscillation in the anterior lateral glial packet was used as the reference, and its phase was obtained by reference to the recordings of cell 208. Color-coded cells were significantly coherent with this cell at the peak swimming frequency (1.25 Hz in this example). The phases in this plot were rotated so that cell 208 was aligned with its known phase (70°) during swimming (Friesen, 1989).
To visualize the spatial distribution of the phases, we constructed phase maps for crawling and swimming by projecting the color-coded phases onto a map of the individual neurons in the ganglion (Fig. 2 A,B). Predicted phase maps based on the function of previously identified neurons on the dorsal surface are shown for comparison (Fig. 2 C,D) (Muller et al., 1981; Brodfuehrer et al., 1995; Eisenhart et al., 2000). We observed neurons in approximately the same positions and phases for all of the neurons in the predicted phase maps for both swimming and crawling. The absolute location of any given neuron can vary by a cell diameter or two. Four pairs of prominent longitudinal motor neurons, cells 1–4, are very regular in their location and indeed overlapped in the measured and predicted phase maps. In addition, we measured coherent oscillations during swimming and crawling in many unidentified neurons. We conclude that neurons with the approximate phase of the predicted neurons (both motor neurons and interneurons) were detected by the VSDs in appropriate locations, along with many other previously unidentified neurons.
Figure 2.

Measured and predicted dorsal surface phase maps. A, The locations of neuronal somata on the dorsal ganglionic surface that were coherent with the crawling motor program (data from Fig. 1 F). The phases were split into four quadrants; red corresponds to elongation, green corresponds to contraction, and orange and yellow lie between contraction and elongation. Black cells were not significantly coherent. B, The locations of coherent neuronal somata during swimming in the same preparation as in A (data from Fig. 1 G). Cyan corresponds to dorsal contraction, blue corresponds to ventral contraction, and pink and purple lie between dorsal and ventral contraction. C, D, The predicted distribution of phases during crawling (C) and swimming (D) based on the known function of neurons on the dorsal surface of segmental ganglia (Muller et al., 1981; Brodfuehrer et al., 1995; Eisenhart et al., 2000) projected onto the canonical dorsal surface map (Muller et al., 1981). The locations of cells 1–4 are indicated in all four panels for comparison.
Coherent swimming and crawling oscillations on the ventral surface
Similar experiments were performed for neurons on the ventral surface of G10 (Fig. 3 A). During these optical recordings, we made simultaneous intracellular recordings from two different motor neurons, cells AE and CV. Cell CV excites circular muscles and is therefore active during the elongation phase of crawling (Fig. 3 B), whereas cell AE excites the annuli along the leech body wall and is depolarized during the contraction phase of crawling (Fig. 3 B). Neither of these two cells is rhythmically active during swimming (Fig. 3 C). We again calculated the phase and magnitude of the coherence for each imaged neuron during each behavior (Fig. 3 D,E), using cell AE as a reference for crawling and cell 208 as the reference for swimming (see Materials and Methods). We constructed phase maps of the ventral surface (Fig. 4 A,B) using the same coding scheme used for the dorsal surface (Fig. 2 A,B) and compared them with predicted phase maps based on identified ventral surface neurons (Fig. 4 C,D) (Muller et al., 1981; Brodfuehrer et al., 1995; Baader, 1997; Eisenhart et al., 2000). Again, within the variability inherent in the locations of the cell bodies, the VSDs located the identified neurons and found many additional ones.
Figure 4.

Measured and predicted ventral surface phase maps. A, B, The locations of coherent neuronal somata during crawling (A) and swimming (B) while imaging the ventral surface (data from Fig. 3 D,E). The phases were split into four quadrants as in Figure 2. The location of the reference cell used for swimming is indicated in B. C, D, The predicted distribution of phases during crawling (C) and swimming (D) based on the known function of neurons on the ventral surface of segmental ganglia (Muller et al., 1981; Brodfuehrer et al., 1995; Baader, 1997; Eisenhart et al., 2000) projected onto the canonical ventral surface map (Muller et al., 1981). The locations of cells AE, CV, and 208 are indicated in the four panels for comparison. The Retzius cell somata were removed for all ventral surface experiments to image smaller cells below them.
Summary dorsal and ventral phase maps
To determine the reproducibility of these neuronal maps, we compiled phase maps for eight dorsal experiments (supplemental Figs. 1, 2, available at www.jneurosci.org as supplemental material) and six ventral experiments (supplemental Figs. 3, 4, available at www.jneurosci.org as supplemental material) to construct summary phase maps. A cell was included on the summary phase map if (1) it was observed to have the same phase during swimming and/or crawling, and (2) it was approximately the same diameter and located in the same area of a glial packet. Cells meeting these criteria in four of eight dorsal preparations or four of six ventral preparations were included in the summary phase maps (Fig. 5 A,B). These maps are merged images of their activity in swimming and crawling. Uncolored neurons were inactive in both behaviors, and mono-colored neurons oscillated in just one behavior. Neurons that oscillated in both behaviors are bi-colored; the swimming and crawling phases are denoted above and below the diagonal, respectively. The predicted merged phase maps are shown for comparison (Fig. 5 C,D). Every neuron in the predicted phase maps was found to correspond to a neuron in a summary phase map, and many previously unidentified neurons were active in one or both behaviors.
Figure 5.

Summary phase maps for swimming and crawling compared with predicted maps. A, A summary phase map obtained from experiments on the dorsal surface of eight different G10 ganglia (supplemental Figs. 1, 2, available at www.jneurosci.org as supplemental material). Cells included in this map were observed at the shown phase in at least four of eight experiments. The swimming and crawling phases have been merged; for cells active during both rhythms, the color on the left indicates the activity phase in swimming, and the color on the right indicates the phase in crawling. White cells were not in-phase with either oscillation, and mono-colored cells were active in-phase with only one of the oscillations. B, A summary phase map obtained from six experiments in which the ventral surfaces of six different G10 ganglia were imaged (supplemental Figs. 3, 4, available at www.jneurosci.org as supplemental material). Cells included in this phase map were observed in at least four of six experiments. C, D, The predicted merged phase maps for the dorsal (C) and ventral (D) surface based on the function of known neurons, including both motor neurons and interneurons. C, Contraction; E, elongation; DC, dorsal contraction; VC, ventral contraction.
The swimming and crawling networks overlap
To determine the nature of the overlap in the swimming and crawling networks, we further analyzed the information contained in the summary phase maps. We first determined how many neurons were active in each phase of the two behaviors (Fig. 6 A,B). There are approximately equal numbers of cells active in each phase of swimming (Fig. 6 A). We emphasize that the ganglion contains a heterogeneous populations of neurons, including sensory neurons, interneurons, and motor neurons. Although it would be ideal to separate interneurons from motor neurons for this analysis, we had no independent confirmation of the function of each neuron. The analysis therefore combines interneurons and motor neurons (the sensory neurons were not observed to oscillate with either rhythm). The greater number of cells in the dorsal and ventral contraction phases of swimming reflects the fact that most longitudinal motor neurons are active in one of these two phases. This nearly equal representation of the number of cells in each phase is in agreement with the known phase distribution of identified neurons in the swim CPG (Friesen, 1989). In contrast, more than twice as many neurons are active during the elongation phase of crawling than in the contraction phase (Fig. 6 B), and even fewer neurons are active in the intermediate phases. In addition, we observed more than twice as many total neurons oscillating during crawling (188) compared with swimming (90).
Surprisingly, the overlap in neurons active during both swimming and crawling was very high: fully 93% of the cells that oscillated with swimming in the summary maps also oscillated with crawling (Fig. 6 C). To test whether the phase of a cell in one behavior was predictive of its phase in the other behavior, we organized the data as a contingency table, with the four phases of each behavior along each side (Fig. 6 D). Of the 16 possible phase combinations, we observed examples of cells of 15 different combinations, and the phase combinations did not differ from a random distribution (Fisher–Freeman–Halton exact test, p = 0.148) In other words, there was no association between the phase of a cell during swimming and crawling greater than that predicted by chance. An example of two of the phase combinations during a transition from crawling to swimming is shown in Figure 6 E. Cells 3 and 4 are both active during contraction in crawling (green phase) but are 180° out-of-phase during swimming (blue and cyan phases).
Finally, we estimated what percentage of the total number of neurons in G10 that we observed in these experiments. In the eight experiments in which we imaged the dorsal surface, we observed 164 ± 10 (mean ± SD) cells; in the six experiments viewing the ventral surface experiments, we observed 153 ± 11 (mean ± SD) cells. Based on the number of neurons in the canonical map of a leech midbody ganglion (∼400) (Muller et al., 1981), we imaged, on average, ∼80% (317 ± 15) of the neurons.
Identification of neurons using the summary phase maps
By their location in the summary phase maps, many of the neurons identified by the VSDs were not previously identified. To test the usefulness of the summary maps, we chose two of them, cells 255 and 257 on the ventral surface (Fig. 5 B), to characterize more fully using electrophysiological recordings. We confirmed that, as predicted from the imaging results, cell 255 depolarizes and produces spikes during the elongation phase of crawling, in-phase with cell CV (Fig. 7 B), and hyperpolarizes during contraction. During swimming, cell 255 oscillates synchronously with cell 208 (Fig. 7 C). Unlike cell 208, which oscillates above resting potentials, cell 255 oscillates around a hyperpolarized potential relative to rest. Cell 255 was identified in 15 preparations electrophysiologically and filled with a fluorescent dye in 14 of 15 preparations. In all 14 fills, cell 255 had a bilaterally symmetric arborization and projected a process through a posterior lateral connective (Fig. 7 A). Because it does not send an axon into a peripheral nerve, this neuron is an interneuron. The bilateral symmetry of its arbors is indicative of an unpaired neuron (Weeks and Kristan, 1978; Weeks, 1982), and we never found more than one neuron with these characteristics in any ganglion.
Demonstrating that an interneuron oscillates in-phase with two behaviors suggests, but does not prove, that it is actively participating in two CPGs. To test this hypothesis, we injected prolonged (2–5 s) depolarizing and hyperpolarizing current pulses into cell 255 during different phases of the two ongoing rhythms. Depolarizing current injected during the contraction phase of crawling terminated the contraction and caused an early elongation (Fig. 7 D). Of 120 crawling steps from eight preparations, current injections during contraction reduced the period of crawling steps by 21 ± 7% (mean ± SD, ratio of stimulated step periods to unstimulated step periods). This effect was most pronounced when cell 255 was depolarized from a slightly hyperpolarized potential relative to rest (Fig. 7 D). Depolarization during elongation had no effect on the period of crawling steps. Hence, this neuron not only depolarizes during elongation, it also participates in the generation of elongation in the crawling CPG.
Depolarizing cell 255 during swimming either terminated a swimming episode (Fig. 7 E) or slowed the swim period for the duration of the stimulus (data not shown). Of 120 attempts in 15 preparations, depolarizing current slowed or stopped swimming 63% of the time. Therefore, cell 255 oscillates with both swimming and crawling, and depolarizing current speeds up crawling, in a phase-specific way, and slows or terminates swimming. Hyperpolarizing current injections had no consistent effect on either rhythm.
We then focused on a neuron that oscillates during crawling but not during swimming. We denoted this neuron cell 257, based on its position. Like cell 255, it depolarizes and spikes during the elongation phase of crawling, as shown with a dual recording of cell AE (Fig. 8 B). During swimming, cell 257 is strongly hyperpolarized from its resting potential (Fig. 8 C). Cell 257 was identified in 10 preparations electrophysiologically and filled with fluorescent dye in 8 of 10 preparations. It appears to be a paired neuron that arborizes primarily ipsilateral to the soma location. It projects a process through an anterior lateral connective nerve contralateral to the position of the soma (Fig. 8 A). Depolarizing and hyperpolarizing current injections into a single cell 257 did not consistently perturb either swimming or crawling.
Discussion
In this study, we found imaging many neurons in a population during ongoing behaviors useful for addressing neuronal questions on two different levels. First, we were able to form a global, network-level picture of the dynamics of the circuits. We used this to learn about the distributed nature of the crawling CPG as well as the overlap between two CPGs. Second, we used imaging to identify circuit elements for a single-cell analysis. We constructed phase maps to study multifunctional neurons and also as a guide to begin identifying the individual neurons involved in crawling. These maps reduce the unguided search time involved in identifying unknown circuit structure.
The ability to record simultaneously from large populations of neurons with single-cell resolution allowed us to measure the dynamics of networks of neurons. This large-scale approach to studying networks has distinct advantages over single-cell electrophysiology. In the case of the previously unknown CPG for crawling, we now know that more than twice as many neurons oscillate during crawling as during swimming, indicating that the crawling CPG may be a much more distributed network than the swim CPG. Because we recorded both behaviors in the same preparation, we also explicitly measured the overlap between the two networks. An interpretation of the high degree of overlap between the two circuits is that the swim CPG is superimposed on top of the crawling CPG. Because all species of leech can crawl but only approximately half of the species swim (Sawyer, 1986), crawling may be an evolutionarily more primitive behavior and the swim CPG may have evolved by sharing part of the existing circuitry used for crawling.
However, the two CPGs came to overlap by such a large percentage, we found no correlation between the phases of cells that oscillate with both behaviors (Fig. 6 D). This complicates the understanding of how overlapping networks can drive the same muscle groups in fundamentally different patterns and on very disparate timescales. For the example shown in Figure 6 E, cells 3 and 4 oscillate synchronously during crawling (an ∼0.1 Hz rhythm) but are phase shifted by 180° during swimming (a 1 Hz rhythm). Although this could be attributable to reorganization of premotor circuitry, a recent theoretical study shows that frequency-dependent phase shifts can result from interactions between inhibitory and electrical synapses between neurons as well as the intrinsic properties of individual neurons (Pfeuty et al., 2005; Kleinfeld and Mehta, 2006). In other words, a single network driven at two different frequencies could generate motor patterns with different phase relationships without recruiting any additional neurons. Neuromodulation may also play an important role in driving the networks, as has been shown in the crustacean stomatogastric ganglion (Nusbaum et al., 2001). In the leech, serotonin is known to promote swimming (Willard, 1981; Mangan et al., 1994) and dopamine has recently been shown to modulate crawling (Crisp and Mesce, 2004). Of primary interest is the mechanism by which the two CPGs generate oscillations. The swim CPG functions by a core of reciprocal inhibitory connections driven by tonic excitation (Friesen, 1989). The connectivity pattern of the crawling CPG is needed to draw conclusions about its mechanism of oscillation.
The summary phase maps we generated not only provide a global picture of the dynamics within a ganglion, but they were also useful for identifying circuit elements. We noticed a previously unidentified neuron, cell 255, that oscillated in-phase with cell 208 during swimming. Cell 255 was of particular interest because it also oscillates with crawling, making it potentially a multifunctional interneuron. Indeed, its ability to perturb both rhythms with intracellular current injection demonstrates that it is involved in the generation of the two behaviors. This, in addition to the similarity of the phase of cell 255 during swimming and crawling to that of cell 208 may also implicate it in the behavioral choice between the two behaviors (Briggman et al., 2005). To definitively prove its role in the two CPGs, we must identify synaptic connections (Taylor et al., 2003) to the swim CPG and the unknown crawl CPG.
Multifunctional neurons have been described in many systems (Weimann and Marder, 1994; Popescu and Frost, 2002; Jing et al., 2004), including in the interaction between swimming and whole-body shortening in the leech (Shaw and Kristan, 1997). Subsets of swimming CPG cells are either hyperpolarized or depolarized during whole-body shortening. Cells that are active during one behavior but hyperpolarized during another were termed dedicated neurons; cell 257 is an example of such a neuron dedicated to crawling. Our inability to perturb either rhythm with cell 257 leaves its role, if any, in the CPGs in doubt. We note, however, that the apparently highly distributed nature of the crawl CPG may reduce the ability of current injections into single paired neurons to significantly perturb ongoing crawling rhythms. Indeed, it has been suggested recently that determining the function of a neuron in a circuit based on its synaptic connections may be more informative than the traditional tests of sufficiency for inclusion in a CPG (Marder et al., 2005).
The large overlap of neurons in the swimming and crawling populations suggests that they are part of a single dynamical system that can operate in two different regimens, at very different timescales. With recent advances in population recording technologies, multifunctional networks such as this may become more prevalent as researchers are able to search for them. The identification of single neurons, such as cell 255, that are participating in the generation of these dynamical states is an important first step toward understanding the biophysical basis of these states. Ultimately, however, a more complete understanding of the synaptic connectivity plus the ability to selectively manipulate many neurons is required to bridge the gap between studying how single cells function within a population and studying how many cells interact with one another to generate complex dynamical patterns.
Footnotes
This work was supported by National Institutes of Health Grant MH43396 (W.B.K.) and training awards from the Burroughs Wellcome Fund (La Jolla Interfaces in Science) and National Science Foundation (Integrative Graduate Education and Research Traineeship grant) (K.L.B.). We thank J. E. González of Vertex Pharmaceuticals for supplying the FRET voltage-sensitive dyes.
References
- Baader AP. Interneuronal and motor patterns during crawling behavior of semi-intact leeches. J Exp Biol. 1997;200:1369–1381. doi: 10.1242/jeb.200.9.1369. [DOI] [PubMed] [Google Scholar]
- Berkowitz A. Physiology and morphology indicate that individual spinal interneurons contribute to diverse limb movements. J Neurophysiol. 2005;94:4455–4470. doi: 10.1152/jn.00229.2005. [DOI] [PubMed] [Google Scholar]
- Briggman KL, Abarbanel HD, Kristan WB., Jr Optical imaging of neuronal populations during decision-making. Science. 2005;307:896–901. doi: 10.1126/science.1103736. [DOI] [PubMed] [Google Scholar]
- Brodfuehrer PD, Debski EA, O'Gara BA, Friesen WO. Neuronal control of leech swimming. J Neurobiol. 1995;27:403–418. doi: 10.1002/neu.480270312. [DOI] [PubMed] [Google Scholar]
- Cacciatore TW, Brodfuehrer PD, González JE, Jiang T, Adams SR, Tsien RY, Kristan WB, Jr, Kleinfeld D. Identification of neural circuits byimaging coherent electrical activity with FRET-based dyes. Neuron. 1999;23:449–459. doi: 10.1016/s0896-6273(00)80799-0. [DOI] [PubMed] [Google Scholar]
- Cacciatore TW, Rozenshteyn R, Kristan WB., Jr Kinematics and modeling of leech crawling: evidence for an oscillatory behavior produced by propagating waves of excitation. J Neurosci. 2000;20:1643–1655. doi: 10.1523/JNEUROSCI.20-04-01643.2000. [DOI] [PMC free article] [PubMed] [Google Scholar]
- Crisp KM, Mesce KA. A cephalic projection neuron involved in locomotion is dye coupled to the dopaminergic neural network in the medicinal leech. J Exp Biol. 2004;207:4535–4542. doi: 10.1242/jeb.01315. [DOI] [PubMed] [Google Scholar]
- Eisenhart FJ, Cacciatore TW, Kristan WB., Jr A central pattern generator underlies crawling in the medicinal leech. J Comp Physiol A Neuroethol Sens Neural Behav Physiol. 2000;186:631–643. doi: 10.1007/s003590000117. [DOI] [PubMed] [Google Scholar]
- Friesen WO. Neuronal control of leech swimming movements. In: Jacklet JW, editor. Cellular and neuronal oscillators. New York: Dekker; 1989. pp. 269–316. [Google Scholar]
- González JE, Oades K, Leychkis Y, Harootunian A, Negulescu PA. Cell-based assays and instrumentation for screening ion-channel targets. Drug Discov Today. 1999;4:431–439. doi: 10.1016/s1359-6446(99)01383-5. [DOI] [PubMed] [Google Scholar]
- Jing J, Cropper EC, Hurwitz I, Weiss KR. The construction of movement with behavior-specific and behavior-independent modules. J Neurosci. 2004;24:6315–6325. doi: 10.1523/JNEUROSCI.0965-04.2004. [DOI] [PMC free article] [PubMed] [Google Scholar]
- Kiehn O, Butt SJ. Physiological, anatomical and genetic identification of CPG neurons in the developing mammalian spinal cord. Prog Neurobiol. 2003;70:347–361. doi: 10.1016/s0301-0082(03)00091-1. [DOI] [PubMed] [Google Scholar]
- Kleinfeld D, Mehta SB. Spectral mixing in nervous systems: experimental evidence and biologically plausible circuits. Prog Theor Phys Suppl. 2006;161:86–98. [Google Scholar]
- Kristan WB, Jr, Calabrese RL. Rhythmic swimming activity in neurones of the isolated nerve cord of the leech. J Exp Biol. 1976;65:643–668. doi: 10.1242/jeb.65.3.643. [DOI] [PubMed] [Google Scholar]
- Kristan WB, Jr, Shaw BK. Population coding and behavioral choice. Curr Opin Neurobiol. 1997;7:826–831. doi: 10.1016/s0959-4388(97)80142-0. [DOI] [PubMed] [Google Scholar]
- Kristan WB, Jr, Calabrese RL, Friesen WO. Neuronal control of leech behavior. Prog Neurobiol. 2005;76:279–327. doi: 10.1016/j.pneurobio.2005.09.004. [DOI] [PubMed] [Google Scholar]
- Mangan PS, Cometa AK, Friesen WO. Modulation of swimming behavior in the medicinal leech. IV. Serotonin-induced alteration of synaptic interactions between neurons of the swim circuit. J Comp Physiol A Neuroethol Sens Neural Behav Physiol. 1994;175:723–736. doi: 10.1007/BF00191844. [DOI] [PubMed] [Google Scholar]
- Marder E, Calabrese RL. Principles of rhythmic motor pattern generation. Physiol Rev. 1996;76:687–717. doi: 10.1152/physrev.1996.76.3.687. [DOI] [PubMed] [Google Scholar]
- Marder E, Bucher D, Schulz DJ, Taylor AL. Invertebrate central pattern generation moves along. Curr Biol. 2005;15:R685–R699. doi: 10.1016/j.cub.2005.08.022. [DOI] [PubMed] [Google Scholar]
- Morton DW, Chiel HJ. Neural architectures for adaptive behavior. Trends Neurosci. 1994;17:413–420. doi: 10.1016/0166-2236(94)90015-9. [DOI] [PubMed] [Google Scholar]
- Muller KJ, Nicholls JG, Stent GS. New York: Cold Spring Harbor; 1981. Neurobiology of the leech. [Google Scholar]
- Nusbaum MP, Blitz DM, Swensen AM, Wood D, Marder E. The roles of co-transmission in neural network modulation. Trends Neurosci. 2001;24:146–154. doi: 10.1016/s0166-2236(00)01723-9. [DOI] [PubMed] [Google Scholar]
- Pfeuty B, Mato G, Golomb D, Hansel D. The combined effects of inhibitory and electrical synapses in synchrony. Neural Comput. 2005;17:633–670. doi: 10.1162/0899766053019917. [DOI] [PubMed] [Google Scholar]
- Popescu IR, Frost WN. Highly dissimilar behaviors mediated by a multifunctional network in the marine mollusk Tritonia diomedea . J Neurosci. 2002;22:1985–1993. doi: 10.1523/JNEUROSCI.22-05-01985.2002. [DOI] [PMC free article] [PubMed] [Google Scholar]
- Ramirez JM, Pearson KG. Generation of motor patterns for walking and flight in motoneurons supplying bifunctional muscles in the locust. J Neurobiol. 1988;19:257–282. doi: 10.1002/neu.480190307. [DOI] [PubMed] [Google Scholar]
- Ritter DA, Bhatt DH, Fetcho JR. In vivo imaging of zebrafish reveals differences in the spinal networks for escape and swimming movements. J Neurosci. 2001;21:8956–8965. doi: 10.1523/JNEUROSCI.21-22-08956.2001. [DOI] [PMC free article] [PubMed] [Google Scholar]
- Sawyer RT. Oxford: Oxford Scientific Publications; 1986. Leech biology and behavior, Vol II, Feeding biology, ecology, and systematics. [Google Scholar]
- Shaw BK, Kristan WB., Jr The neuronal basis of the behavioral choice between swimming and shortening in the leech: control is not selectively exercised at higher circuit levels. J Neurosci. 1997;17:786–795. doi: 10.1523/JNEUROSCI.17-02-00786.1997. [DOI] [PMC free article] [PubMed] [Google Scholar]
- Stein PS. Neuronal control of turtle hindlimb motor rhythms. J Comp Physiol A Neuroethol Sens Neural Behav Physiol. 2005;191:213–229. doi: 10.1007/s00359-004-0568-6. [DOI] [PubMed] [Google Scholar]
- Stent GS, Kristan WB, Jr, Friesen WO, Ort CA, Poon M, Calabrese RL. Neuronal generation of the leech swimming movement. Science. 1978;200:1348–1357. doi: 10.1126/science.663615. [DOI] [PubMed] [Google Scholar]
- Taylor AL, Cottrell GW, Kleinfeld D, Kristan WB., Jr Imaging reveals synaptic targets of a swim-terminating neuron in the leech CNS. J Neurosci. 2003;23:11402–11410. doi: 10.1523/JNEUROSCI.23-36-11402.2003. [DOI] [PMC free article] [PubMed] [Google Scholar]
- Weeks JC. Synaptic basis of swim initiation in the leech II, a pattern-generating neuron (cell 208) which mediates motor effects of swim-initiating neurons. J Comp Physiol. 1982;148:265–279. [Google Scholar]
- Weeks JC, Kristan WB., Jr Initiation, maintenance, and modulation of swimming in the medicinal leech by the activity of a single neuron. J Exp Biol. 1978;77:71–88. [Google Scholar]
- Weimann JM, Marder E. Switching neurons are integral members of multiple oscillatory networks. Curr Biol. 1994;4:896–902. doi: 10.1016/s0960-9822(00)00199-8. [DOI] [PubMed] [Google Scholar]
- Willard AL. Effects of serotonin on the generation of the motor program for swimming by the medicinal leech. J Neurosci. 1981;1:936–944. doi: 10.1523/JNEUROSCI.01-09-00936.1981. [DOI] [PMC free article] [PubMed] [Google Scholar]