

Abstract
We have generated a murine embryonic stem cell line constitutively expressing L1 at all stages of neural differentiation to investigate the effects of L1 overexpression on stem cell proliferation, migration, differentiation, cell death, and ability to influence drug-induced rotation behavior in an animal model of Huntington's disease. L1-transfected cells showed decreased cell proliferation in vitro, enhanced neuronal differentiation in vitro and in vivo, and decreased astrocytic differentiation in vivo without influencing cell death compared with nontransfected cells. L1 overexpression also resulted in an increased yield of GABAergic neurons and enhanced migration of embryonic stem cell-derived neural precursor cells into the lesioned striatum. Mice grafted with L1-transfected cells showed recovery in rotation behavior 1 and 4 weeks, but not 8 weeks, after transplantation compared with mice that had received nontransfected cells, thus demonstrating for the first time that a recognition molecule is capable of improving functional recovery during the initial phase in a syngeneic transplantation paradigm.
Keywords: neural cell adhesion molecule L1, embryonic stem cell, neuronal differentiation, quinolinic acid, striatum, functional recovery
Introduction
Regeneration of functional activity after loss of GABAergic projection neurons in the striatum as seen in Huntington's disease is an important goal in restorative medicine. Recognition molecules at the cell surface and in the extracellular matrix have a potential to favor processes that regulate survival, neurite outgrowth, and synapse formation not only during development but also in the adult after trauma. Among the recognition molecules that mediate these functions is L1, a homophilically and heterophilically binding member of the Ig superfamily that is expressed by neurons but not by astrocytes and oligodendrocytes in the CNS and by neurons and Schwann cells in the peripheral nervous system (Lindner et al., 1983; Rathjen and Schachner, 1984; Moos et al., 1988; Appel et al., 1993; Kamiguchi and Yoshihara, 2001). L1 promotes neuronal survival, neurite outgrowth (Lemmon et al., 1989; Appel et al., 1993; Chen et al., 1999; Kleene et al., 2001; Dong et al., 2003), and synaptic plasticity, as shown by modification of synaptic efficacy both in vitro and in vivo as well as in learning and memory as seen in L1-deficient mice and humans (Luthi et al., 1996; Fransen et al., 1998a,b; Tiunova et al., 1998; Wolfer et al., 1998; Demyanenko et al., 1999; Pradel et al., 2000; Law et al., 2003; Saghatelyan et al., 2004; Venero et al., 2004). Furthermore, L1 is involved in myelination in the central and peripheral nervous systems (Seilheimer et al., 1989; Wood et al., 1990; Haney et al., 1999; Barbin et al., 2004). We have shown previously that L1 influences differentiation of neural stem cells into neurons in vitro (Dihné et al., 2003). Furthermore, L1 has been shown to promote functional recovery in adult rats after contusion-induced spinal cord injury (Roonprapunt et al., 2003) and optic nerve lesion (Xu et al., 2004) and is involved in regenerative growth of Purkinje cell axons in vivo (Zhang et al., 2005), thus overcoming regeneration-adversive cues that prevail in the CNS of adult mammals.
Based on these findings, we investigated whether embryonic stem (ES) cells transfected to overexpress L1 at the cell surface would show beneficial effects after syngeneic transplantation into adult mice with quinolinic acid-induced striatal lesion. We show that L1-transfected and predifferentiated ES cells indeed allow for better differentiation into neurons, migration, and functional recovery of rotation behavior in mice after depletion of striatal GABAergic projection neurons that are crucial for coordinated motor activity.
Materials and Methods
Generation of L1 + ES cells.
Standard molecular biology protocols were used for the generation of pPGK-L1-neo, a modified pKO-V924 plasmid (Stratagene, La Jolla, CA) containing full-length murine L1-cDNA (Moos et al., 1988) under the influence of the promoter of the murine 3-phoshoglycerokinase amplified from pKOSelectneo (Stratagene) and for neomycin phosphotransferase. ES cells expressing enhanced green fluorescent protein (GFP) under the influence of the β-actin promoter (GFP + ES cells) (Chen et al., 2005) were transfected with pPGK-L1-neo by electroporation (0.25 kV, 500 μF), and transfected clones were selected for by growth in the presence of G418 (250 μg/ml). The selected clones were screened for expression of L1 by immunoblot analysis. Two clones showing strongest expression of L1 (L1 + cells) as determined by Western blot analysis and immunocytochemistry of live cells through stages 1–5 according to Lee et al. (2000) were used for additional experiments. GFP + ES cells transfected with the neomycin resistance only containing plasmid pKOSelectneo were used as controls (L1 − cells).
Maintenance of undifferentiated ES cells (stage 1), embryoid body formation (stage 2), selection of nestin-positive cells (stage 3), and expansion of nestin + neural precursor cells (stage 4) was performed as described previously (Okabe et al., 1996; Lee et al., 2000) with modifications. The medium applied to the cells in stage 4 differs from the medium mN3FL described by Lee et al. (2000) by the omittance of PDGF and laminin and the replacement of insulin, transferrin, selenium, progesterone, hydrocortisone, and putrescine by B-27 supplement. Differentiation was induced by omittance of basic FGF (bFGF) (stage 5).
Immunoblot analysis.
For determination of L1 expression at various stages of differentiation in vitro, immunoblotting was performed as described previously (Dihné et al., 2003) using monoclonal rat L1 antibody (1:1000 diluted) (Appel et al., 1993). Mouse monoclonal antibodies against glyceraldehyde 3-phosphate dehydrogenase (1:3000; Chemicon, Temecula, CA) were used to control for protein loading.
Immunocytochemistry and immunohistochemistry.
Cultured cells were fixed in 4% paraformaldehyde in PBS, pH 7.3, washed with PBS, and incubated in 0.1% bovine serum albumin (Sigma, St. Louis, MO) for 40 min. For labeling with bromodeoxyuridine (BrdU) in vitro, BrdU (Sigma) was added to the culture medium to a final concentration of 10 mm 8 h before fixation. For immunohistochemistry, mice were perfused with 4% paraformaldehyde in PBS. Perfused brain tissue was soaked in 20% sucrose overnight, frozen in liquid nitrogen-cooled 2-methyl-butane, and cut on a cryostat at 25 μm. Primary antibodies, used at 4°C overnight, were monoclonal mouse antibodies to β-tubulinIII (1:400; Sigma), nestin (1:50; Developmental Studies Hybridoma Bank, Iowa City, IA), CNPase (1:1000; Sigma), NeuN (1:1000; Chemicon), and BrdU (1:50; Chemicon); a monoclonal rat antibody to myelin basic protein (MBP) (1:200; Chemicon); polyclonal rabbit antibodies to caspase-3 (1:2000; R & D Systems, Minneapolis, MN), dopamine- and cAMP-regulated phosphoprotein-32 (DARPP-32) (1:500; Chemicon), glial fibrillary acidic protein (1:1000; Dako, Carpinteria, CA), Ki-67 (1:50; Abcam, Cambridge, UK), L1 (1:250) (Rathjen and Schachner, 1984), glutamate decarboxylase (GAD) (GAD-65/67, 1:500; Sigma), neurofilament (NF)-200 (1:200; Sigma), and tyrosine hydroxylase (TH) (1:100; Chemicon); and a polyclonal goat antibody to doublecortin (DCX) (Santa Cruz Biotechnology, Santa Cruz, CA). For staining with BrdU antibody, sections were first incubated in 50% formamide/SSC at 65°C for 2 h, followed by incubation in 2N HCl at 37°C for 30 min, before using primary antibody at 4°C overnight. For detection of first antibodies, appropriate secondary antibodies, coupled to Cy2 or Cy3 (all from Dianova, Hamburg, Germany), were used. Some coverslips and sections were counterstained for 10 min with 50 μg/ml 4′,6-diamidino-2-phenylindole (DAPI; Sigma) for staining of cell nuclei. For immunostaining of live cells, fixation was omitted, and cells were washed and incubated with primary antibody on ice for 15 min, followed by washing and incubation with secondary antibody for 15 min on ice. Subsequently, cells were fixed in 4% paraformaldehyde in PBS. Specimens were examined with a fluorescence (Axioplan 2; Carl Zeiss Microimaging, Thornwood, NY) or confocal laser-scanning (LSM510; Carl Zeiss Microimaging) microscope.
Quantitative real-time PCR.
Total RNA was extracted from 2-mm-thick sections containing mainly the graft but also the surrounding host striatum of brains grafted with L1 + or L1 − cells using the lipid tissue RNA extraction kit (Qiagen, Hilden, Germany) according to the manufacturer's instructions. For reverse transcription, the SuperScript First Strand Synthesis System (Invitrogen, Karlsruhe, Germany) was used to synthesize cDNA in a 20 μl reaction volume containing 1 μg of DNase I-treated RNA and 100 ng of random hexamer primers according to the manufacturer's instructions. The cDNA product was treated with 2 U of RNase H (Invitrogen) for 20 min at 37°C, followed by heat inactivation of the enzyme at 70°C for 15 min. An identical reaction without the reverse transcriptase was performed to verify the absence of genomic DNA. The cDNA was diluted 1:4 in sterile water and stored at −20°C until use. Quantitative real-time PCR was performed using the qPCR Core kit for SYBR Green I (Eurogentec, Seraing, Belgium) following the manufacturer's instructions. Each reaction (20 μl) contained 1 μl of cDNA, 3.5 mm MgCl2, 200 μm dNTPs, 0.5 μm of each primer, and 0.025 U/μl Hot GoldStar enzyme in the reaction buffer in addition to SYBR Green I. Primers used were 5′-TTGAGCACGTCATCGAAGAGC-3′ and 5′-CCAAAGGCACTTGACTGCTGA-3′ for the detection of brain-derived neurotrophic factor (BDNF), 5′-TATTGCAGCGGTTCCTGTGAA-3′ and 5′-CATGCCTGGCCTACTTTGTCA-3′ for glial cell line-derived neurotrophic factor (GDNF), 5′-GCCCATGGTACAATCCCTTTC-3′ and 5′-TCCTTGCCCTTGATGTCTGTG-3′ for nerve growth factor (NGF), 5′-TCACCACGGAGGAAACGCTAT-3′ and 5′-TCAATGGCTGAGGACTTGTCG-3′ for neurotrophin-3 (NT-3), and 5′-GTTCTTTGCTGACCTGCTGGA-3′ and 5′-TCCCCCGTTGACTGATCATT-3′ for hypoxanthin phosphoribosyl transferase (hprt). Specificity was validated by sequencing the amplified products. Duplicate reactions were prepared for each sample along with a no-template and a no-reverse transcription negative control. PCR conditions consisted of one cycle at 50°C with a 2 min hold, followed by 95°C with a 10 min hold and 45 two-segment cycles (95°C with a 15 s hold and 60°C with a 1 min hold) using the Applied Biosystems (Foster City, CA) PRISM 7900 HT sequence detection system. Threshold cycles (cT) were determined with SDS 2.0 software (Applied Biosystems) for each sample and normalized using the cT for hprt as a reference for overall expression levels.
Transplantation.
Three days before transplantation, the right striatum of 3-month-old C57BL/6J mice was lesioned by stereotaxic injection of 1 μl of 60 nmol of quinolinic acid (Sigma) at the following coordinates in relation to bregma: 0.4 mm anteroposterior, 1.8 mm mediolateral, and 3.0 mm dorsal. On the day of transplantation, ES cells differentiated to day 3 of stage 5 were dissociated by 0.05% trypsin/0.04% EDTA and resuspended in HBSS without Ca 2+ and Mg 2+ (HBSS−) at a density of 100,000 viable cells per microliter. One microliter of stage 5 precursor cell suspension was grafted into the lesioned striatum using the same coordinates as for the lesion. The number of animals studied was as follows: L1 + cells (n = 24), L1 − cells (n = 24), and sham-injected (HBSS− only) controls (n = 19). For analysis of incorporation of BrdU, mice were given intraperitoneal injections of 100 mg of BrdU (Sigma) on days 3–7 after grafting. Grafts were analyzed 1, 4, and 8 weeks after transplantation. All animal experiments were approved by the University and State of Hamburg Animal Care Committees.
Determination of differentiation and proliferation.
To determine total cell numbers in vitro, cells were counterstained with DAPI, and the ratio of cell type-specific, marker-positive or BrdU + cells of all DAPI + cells was calculated. To determine total numbers of donor cells in vivo, GFP + cells were counted, and the ratio of cell type-specific, marker-positive cells of all GFP + cells was calculated. At least three independent experiments in duplicates and at least 1000 cells per marker and experiment were analyzed. Percentages of double-labeled cells were determined, and mean values ± SEM were calculated.
Graft volume and density.
Unbiased estimates of the total number of grafted cells and graft volume per animal, 1, 4, and 8 weeks after transplantation, were calculated according to the optical dissector and Cavalieri methods (Howard and Reed, 1998). An Axioskop microscope (Carl Zeiss Microimaging) and a Neurolucida software-controlled computer system were used for quantitative analysis (MicroBrightField Europe, Magdeburg, Germany). Graft volume and cell density of the graft were determined measuring every 10th section of the graft. Transplanted cells were identified by their GFP signal. Graft areas were outlined on digitized images to calculate volumes considering section thickness and frequency. Using random sampling in the graft core and in the periphery of the graft, cell counts were performed according to the optical dissector principle at a magnification of 40×.
Cell migration.
The graft edge was delineated at low magnification in digitized images. The shortest distances of at least 400 individual cells from the graft edge of recipient animals were determined (n = 6 for L1 + grafts, n = 6 for L1 − grafts) at higher magnification (40×).
Behavioral analysis.
Thirty adult C57BL/6J mice were used for the behavioral analyses. All mice received a unilateral striatal lesion through injection of 60 nmol of quinolinic acid. Mice were then randomly assigned to three groups: one for the transplantation of L1 − cells (n = 11), one for the transplantation of L1 + cells (n = 9), and one that received only vehicle (HBSS−) injection (sham-injected group, n = 10). Drug-induced rotation behavior was tested 1, 4, and 8 weeks after quinolinic acid lesion and cell transplantation. All behavioral tests were performed at the beginning of the animals' dark phase. Rotation was measured in a bank of automated rotometer bowls (Accuscan Instruments, Columbus, OH). Mice were tested for rotation in response to an intraperitoneal injection of 5 mg/kg d-amphetamine sulfate in sterile water. Tests were conducted over 30 min (Fricker et al., 1996). Net right turns were calculated as the number of 360° right turns minus the number of left turns. After behavioral testing, mice were killed, and lesion sizes were determined in sections stained immunohistochemically for DARPP-32. Mice with a lesion size of <50% of the volume of the striatum were excluded from the behavioral analysis. Lesion size was not significantly different between the experimental groups.
Statistical evaluation.
All experiments were performed in a double-blinded manner, and Student's t test was used for statistical evaluation if not indicated otherwise.
Results
Generation of ES cells expressing L1 at all stages of differentiation
We used a 3-phosphoglycerokinase promoter-containing plasmid driving the expression of a murine full-length L1-cDNA in ES cell lines constitutively expressing GFP to establish stably L1-expressing ES cell lines (L1 + cells) that are GFP + at all stages of differentiation. GFP + ES cells were subjected to the five-stage differentiation protocol (Okabe et al., 1996; Lee et al., 2000). Mock-transfected ES cell lines (L1 − cells) did not express significant levels of L1 at stages 1–4 as determined by immunoblotting. With terminal neuronal differentiation in stage 5, L1 expression was detected as a result of endogenous expression of basal levels of L1 by newly generated neurons (Fig. 1A). In contrast, L1 + cells stably expressed L1 at stages 1–5 (Fig. 1A). Quantification of L1 expression at stage 5 by immunoblot analysis showed a fivefold higher level of L1 expression in L1 + cells compared with L1 − cells (Fig. 1 B). At stage 4, almost all cells that were L1 + or L1 − at the cell surface expressed nestin, a marker for immature neural cells (Fig. 1C). Thus, we generated a highly enriched population of GFP + and nestin + neural precursor cells expressing increased levels of L1 at all stages of differentiation.
Figure 1.

Transfected ES cells express L1 at all stages of differentiation. A, Immunoblot analysis of L1 expression in transfected (L1 +) and mock-transfected (L1 −) GFP + ES cells differentiated by the five-stage differentiation protocol at day 2 of stages 1 and 2, day 6 of stages 3 and 4, and day 7 of stage 5. Note that transgenic L1 is expressed throughout all stages of differentiation. Immunoblot analysis of glyceraldehyde 3-phosphate dehydrogenase (GAPDH) is shown as a loading control. B, Quantification of the intensity in the immunoblot analysis of L1 expression in stage 5. Arbitrary units (AU) normalized for L1 expression in L1 − cells are shown (mean ± SEM). Student's t test was performed for statistical analysis (***p < 0.001). C, L1 overexpression at the cell surface was evaluated using anti-L1 (red) immunostaining and fluorescence light microscopy of live L1 − and L1 + cells at stage 4. Note the expression of GFP (green) in L1 − and L1 + cells. Neural differentiation of ES cells was confirmed by immunostaining of cells differentiated to stage 4 for nestin (red). Scale bar, 10 μm. EGFP, Enhanced GFP.
L1 + cells show increased neuronal differentiation and decreased proliferation in vitro
To determine the effects of L1 overexpression on neural differentiation in vitro, stage 4 cells were induced to differentiate by removal of bFGF. At day 7 of stage 5, β-tubulinIII + neurons were twice as abundant in the L1 + group versus the L1 − group (Fig. 2A,B), with no significant differences in the percentages of astrocytes and oligodendrocytes between the two groups (data not shown). At day 14 of stage 5, neurons expressing NF-200, the GABAergic marker GAD, and the dopaminergic marker TH (Fig. 2C) were increased twofold in the L1 + group versus the L1 − group (Fig. 2D), with a corresponding decrease in nestin + cells (Fig. 2C,D). Furthermore, L1 + cells showed decreased proliferation as determined by incorporation of BrdU at day 7 of stage 4 and at days 3 and 7 of stage 5 compared with L1 − cells (Fig. 2E,F). Thus, L1 expression by neural precursor cells increases neuronal differentiation and decreases proliferation.
Figure 2.
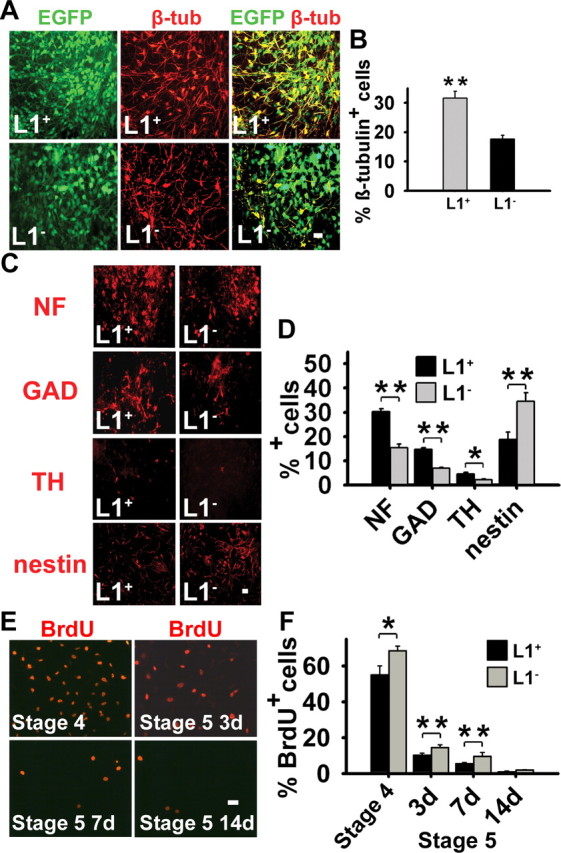
L1 expression increases neuronal differentiation and decreases proliferation in vitro. A, Generation of neurons from L1 − and L1 + ES cells was determined at day 7 of stage 5 by immunostaining for β-tubulinIII (β-tub; red). GFP + cells, green; β-tubulinIII/GFP + cells, yellow. The proportion of β-tubulinIII + cells of all GFP + cells was greater in L1 + cells than in L1 − cells. Scale bar, 20 μm. EGFP, Enhanced GFP. B, Percentages of β-tubulinIII + cells of all GFP + cells are shown at day 7 of stage 5 (mean ± SEM). Student's t test was performed for statistical analysis (**p < 0.01). C, At day 14 of stage 5, mature neuronal proteins NF-200 (NF), GAD, and TH and the neural stem cell protein nestin (all in red) were determined by immunocytochemistry in L1 − and L1 + cells. The proportion of NF +, GAD +, and TH + cells was greater in the L1 + than in the L1 − cells, whereas the proportion of nestin + cells was higher in L1 − cells. Scale bar, 10 μm. D, Percentages of NF +, GAD +, TH +, and nestin + cells at day 14 of stage 5 (mean ± SEM). *p < 0.05, **p < 0.01 (Student's t test). E, BrdU incorporation was determined at day 7 of stage 4 and at days 3, 7, and 14 of stage 5 by immunostaining for BrdU (red) after a pulse labeling of 8 h with 10 mm BrdU. Scale bar, 10 μm. F, Percentages of BrdU + cells of all cells are shown at day 7 of stage 4 and days 3, 7, and 14 of stage 5 (mean ± SEM). Student's t test was performed for statistical analysis (*p < 0.05; **p < 0.01). 3d, Day 3; 7d, day 7; 14d, day 14.
L1 + grafted cells show increased neuronal differentiation in the quinolinic acid-lesioned mouse striatum but do not influence endogenous neurogenesis
The differentiation potential of L1 + and L1 − cells was compared after transplantation into a mouse model with an acute and selective loss of GABAergic projection neurons. Stereotaxic injection of the NMDA receptor agonist quinolinic acid into the right striatum resulted in an almost complete depletion of neurons at the lesion site 3 d after injection (supplemental Fig. 1, available at www.jneurosci.org as supplemental material). ES cells differentiated to day 3 of stage 5 and injected into the center of the lesion 3 d after injection of quinolinic acid were identified by GFP expression 1–8 weeks afterward (see Fig. 6A–C). One week after transplantation, the number of neurons was significantly higher (p < 0.001) in L1 + grafts (β-tubulinIII, 22 ± 3.2%) versus L1 − grafts (β-tubulinIII, 10 ± 1.4%). Four and 8 weeks after transplantation, L1 + grafts showed a twofold increase in neurons [β-tubulinIII, 47 ± 2.5%; NF, 44 ± 4.3% (4 weeks); NF, 49 ± 7.4% (8 weeks)] versus L1 − grafts [β-tubulinIII, 23 ± 5.1%; NF, 25 ± 3.8% (4 weeks); NF, 30 ± 8.7% (8 weeks)] and a corresponding decreased differentiation into GFAP + astrocytes [L1 +: 39 ± 8.3% (4 weeks), 38 ± 6.5% (8 weeks); L1 −: 54 ± 6.1% (4 weeks), 63 ± 6.8% (8 weeks)] (Fig. 3). MBP + oligodendrocytes were hardly detectable in both groups (<1%) (Fig. 3B). To verify whether L1 exerts its beneficial functions by influencing proliferation or apoptosis in vivo, immunolabeling for the proliferation and apoptosis markers Ki-67 and caspase-3, respectively, was performed 1 and 4 weeks after transplantation. The percentage of proliferating cells in the graft as assessed by Ki-67 immunolabeling was equal in both groups 1 and 4 weeks after transplantation (Fig. 4A). Furthermore, analysis of caspase-3 immunolabeling showed no significant difference in the percentage of caspase-3-positive cells in L1 + and L1 − grafts [L1 +: 4.3 ± 0.6% (1 week), <1% (4 and 8 weeks); L1 −: 5.1 ± 0.7% (1 week), <1% (4 and 8 weeks)]. Thus, L1 does not exert its beneficial effects in vivo by influencing proliferation or apoptosis in the grafts. In addition, levels of mRNA of neurotrophic factors BDNF, GDNF, NGF, and NT-3 were measured applying quantitative real-time PCR. No difference was detected in L1 + versus L1 − grafts for all neurotrophic factors (supplemental Fig. 2, available at www.jneurosci.org as supplemental material). To investigate whether L1 + grafts influence neurogenesis within the subventricular zone (SVZ), we analyzed proliferation in the SVZ by BrdU pulse-labeling and measured the amount of DCX +-immunolabeled neurons within the SVZ in mice that had received L1 + or L1 − grafts. No differences were detected among the groups in the percentage of BrdU-labeled and DCX + neurons, indicating that L1 overexpression by the grafted cells does not influence endogenous neurogenesis (Fig. 4B–D). Thus, L1 + grafted cells show increased neuronal and decreased astrocytic differentiation in the quinolinic acid-lesioned mouse striatum without influencing endogenous neurogenesis in the SVZ.
Figure 6.

L1 + cells migrate better than L1 − cells and improve locomotory recovery after quinolinic acid lesioning. A, Photomicrographs of an L1 + and an L1 − graft 4 weeks after transplantation. Transplants in green are shown in the corresponding bright-field image of the host brain. Lateral ventricles are delineated by white lines. Note the increased amount of migrated cells in the L1 + graft. B, Images from the periphery of GFP + transplants stained with GAD antibody (GFP +GAD + cells appear yellow) show cells that have emigrated from the transplant core 4 weeks after grafting. White lines indicate graft edges. C, Images from the periphery of GFP + transplants 4 weeks after grafting. White lines indicate graft edges. D, Average migration distance of transplanted cells from the edge of the graft 1 month after grafting of L1 + (n = 6) and L1 − (n = 6) cells. Wilcoxon signed rank test was used to calculate significances (mean ± SEM; *p < 0.05). E, Analysis of amphetamine-stimulated rotations in animals with unilateral quinolinic acid-induced striatal lesion grafted with cells differentiated to day 3 of stage 5 derived from L1 − (n = 11) or L1 + cells (n = 9) and sham-injected controls (n = 10). Net 360° rotations ipsilateral to the lesioned striatum were calculated as number of right rotations minus the number of left rotations. ANOVA followed by the Newman–Keuls test was performed for statistical analysis (mean ± SEM; *p < 0.05). Scale bars: A, 100 μm; B, 50 μm; C, 20 μm.
Figure 3.

L1 + cells grafted into the quinolinic acid-lesioned striatum show increased neuronal differentiation. A, Laser-scanning microscopy illustrating immunohistochemical analysis of grafts of early stage 5 cells derived from L1 − and L1 + ES cells with the neuronal marker NF and the astrocytic marker GFAP (all in red) 4 weeks after transplantation of GFP + (green) cells. Donor-derived marker + cells in merged images appear yellow. NF staining of an L1 + graft with Z-series is displayed at top right. Note the increased expression of NF and the decreased expression of GFAP in L1 + grafts compared with L1 − grafts. Scale bar, 10 μm. B, Percentages of cell type-specific marker + cells in L1 + (n = 6) or L1 − (n = 6) grafts 4 weeks after transplantation (mean ± SEM). *p < 0.05 (Student's t test).
Figure 4.
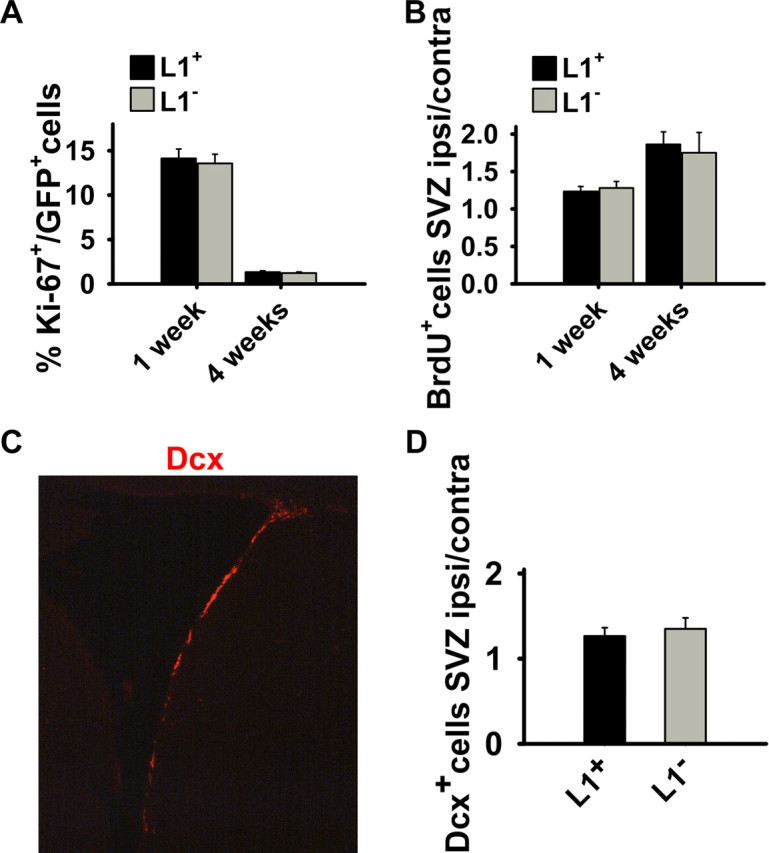
Analysis of proliferation in grafted cells by Ki-67 immunolabeling and of neurogenesis in the SVZ by BrdU incorporation and expression of DCX 1 and 4 weeks after transplantation. A, The fraction of Ki-67 + cells of all GFP + transplanted cells is given 1 and 4 weeks after transplantation of L1 + (n = 4) and L1 − (n = 4) cells. No difference was observed. B, Mice transplanted with L1 + (n = 4) or L1 − (n = 4) cells into the lesioned striatum were labeled with BrdU on days 3–7 after transplantation and killed 7 d and 4 weeks after grafting. The ratio of BrdU + cells in the SVZ ipsilateral and contralateral to the lesioned hemisphere is shown 1 and 4 weeks after transplantation. No difference was observed between the L1 + and L1 − groups. C, Immunohistochemical staining for DCX (red) in the SVZ ipsilateral to the lesion in sham-injected animals 4 weeks after grafting. D, Immunostaining for DCX in the SVZ was assessed 4 weeks after grafting. The ratio of DCX + cells in the SVZ ipsilateral and contralateral to the lesioned and transplanted hemisphere is given for mice transplanted with L1 + (n = 4) or L1 − (n = 4) cells into the lesioned striatum. No difference between L1 + and L1 − groups was observed. Error bars indicate SEM. ipsi, Ipsilateral; contra, contralateral.
L1 expression in grafted cells leads to an increased number of graft-derived GABAergic neurons
In view of the selective loss of GABAergic neurons in the quinolinic acid lesion model and the increase in GABAergic differentiation of L1 + cells in vitro, we next determined GABAergic differentiation in vivo. Differentiation of grafted cells into medium spiny GABAergic neurons was assessed by immunostaining for GAD (Fig. 5A) and DARPP (supplemental Fig. 3, available at www.jneurosci.org as supplemental material). As in vitro, an increased proportion of grafted L1 + cells differentiated into GABAergic neurons 1–8 weeks after transplantation [6 ± 1.4% (1 week); 24 ± 3.2% (8 weeks)] versus L1 − cells [3 ± 0.2% (1 week); 10 ± 3.2% (8 weeks)] (Fig. 5A,B). This 2.5-fold increase was not attributable to L1-specific induction of GABAergic differentiation, but rather reflected an increased overall neuronal differentiation, because the percentage of graft-derived GAD + of graft-derived NF + cells did not significantly differ between the two groups (L1 +, 46 ± 9.8%; L1 −, 44 ± 11.6%; 8 weeks after grafting). However, because of the overall higher number of neurons in L1 + versus L1 − cells, the number of graft-derived GABAergic neurons was increased significantly in L1 + versus L1 − grafts 1–8 weeks after transplantation (Fig. 5C). In L1 + grafts 13,600 ± 3300 GAD + cells were detectable 1 week after transplantation compared with 6200 ± 800 GAD + cells in L1 − grafts. The number of GAD + cells increased to 52,000 ± 7200 in L1 + grafts versus 27,000 ± 3600 in L1 − grafts 4 weeks after transplantation. Eight weeks after grafting, the absolute numbers of GAD + cells had dropped in the L1 + and L1 − groups to 34,000 ± 10,400 and 18,000 ± 6700, respectively. This decrease in absolute numbers of GABAergic cells is explained by a decrease in total cell number, both for the L1 + and L1 − cells, 8 weeks after grafting (Fig. 5D). Interestingly, the numbers of graft-derived TH + dopaminergic neurons were negligible in both groups (<1% of all GFP + cells). Thus, L1 expression in grafted cells leads to an increased number of graft-derived GABAergic neurons in vivo.
Figure 5.

The number of GABAergic neurons is increased in L1 + grafts. A, Laser-scanning microscopy illustrating immunohistochemical analysis of grafts of early stage 5 cells derived from L1 − and L1 + ES cells with the neuronal markers GAD (red) 8 weeks after transplantation of GFP + (green) cells. Donor-derived marker + cells in merged images appear yellow. Scale bar, 10 μm. B, Percentages of GAD + cells of GFP + cells in L1 + (n = 16) or L1 − (n = 16) grafts 1–8 weeks after transplantation. ANOVA followed by Student's t test was performed for statistical analysis (*p < 0.05). C, Total number of GAD + cells per graft 1–8 weeks after transplantation. ANOVA followed by Student's t test was performed for statistical analysis (*p < 0.05). Note the increased number of GAD + cells in L1 + grafts 1–8 weeks after transplantation compared with L1 − grafts and the number of GAD + cells in both groups decreasing 8 weeks after transplantation and reflecting a decrease in total cell number. D, Total numbers of graft-derived GFP + cells per graft 1–8 weeks after transplantation. Error bars indicate mean ± SEM.
L1 + cells migrate better than L1 − cells
Migration into the host tissue of L1 + versus L1 − cells differentiated to day 3 of stage 5 from the graft edge into the lesioned striatum was increased 4 weeks after grafting (Fig. 6A–D). Transplanted L1 − cells had migrated not more than 42 ± 17 μm away from the graft edge, whereas L1 + cells had migrated 110 ± 42 μm, with individual GAD + cells showing considerable migration compared with the graft size (Fig. 6A,B).
L1 + cells improve locomotory recovery
We tested the motor behavior of unilaterally quinolinic acid-lesioned mice grafted either with L1 + or L1 − cells differentiated to day 3 of stage 5 or sham-injected with HBSS−. Stimulation with amphetamine induces a movement bias ipsilateral to the lesion site in quinolinic acid-injected mice. Sham-operated mice showed an abnormal and stable rotational bias (Fig. 6E). Mice grafted with L1 − cells were not different from sham-injected mice and showed no recovery in rotational bias. In contrast, mice grafted with L1 + cells showed a marked decrease in ipsilateral rotational deviation 1 and 4 weeks after transplantation, indicating that the L1 + graft can correct the behavioral abnormalities. Eight weeks after transplantation, rotational behavior did not differ significantly between the L1 + cell and sham-injected groups.
Discussion
We have shown in this study that the recognition molecule L1 influences beneficially the differentiation of ES cells into neurons at the expense of astrocytes and neural precursor cells both in vitro and in vivo. The larger proportion of L1 + versus L1 − cells differentiating into neurons in the lesioned striatum resulted in an overall increase in the absolute number of GABAergic neurons. L1 + cells showed decreased proliferation in vitro, indicating that the larger proportion of neurons in L1 + cells is not attributable to increased proliferation of neuronally committed cells. This finding agrees with our previous results in which we showed that substrate-coated L1 decreased proliferation, increased neuronal differentiation, and decreased astrocytic differentiation of neural stem cells in vitro by selectively enhancing neuronal differentiation of multipotential neural precursors and bipotential neuron–astrocyte precursors (Dihné et al., 2003). In vivo, no difference in proliferation and cell death of grafted cells was detected in L1 + versus L1 − grafts. Furthermore, no differences in the expression levels of several neurotrophic factors were detected. Thus, L1 does not exert its beneficial effects by influencing proliferation, cell death, or the expression of neurotrophic factors. Also, the number of DCX-immunoreactive cells in the SVZ was not different in mice with L1 + grafts compared with mice with L1 − grafts, indicating that L1 + grafts do not preferentially affect endogenous neurogenesis over L1 − grafts.
Although 1 and 4 weeks after transplantation mice that had received L1 + cells showed an improved rotation behavior compared with mice that had received L1 − grafts or sham-injected quinolinic acid-lesioned mice, 8 weeks after transplantation no significant differences were detected between the groups in that the rotation behavior of mice that received L1 + grafts deteriorated to a level comparable to mice that received L1 − grafts or sham-injected mice. We interpret this observation as an indication that the number of L1 + cells at 1 and 4 weeks after transplantation is sufficient to improve functional recovery, whereas the decreased number of L1 + cells 8 weeks after transplantation may not be sufficient. The reason why grafts shrink in size 8 weeks compared with 4 weeks after transplantation is presently not understood but may indicate the necessity to coexpress one or several neurotrophic factors together with L1 to provide long-term functional benefits.
The fact that lesion-induced motor imbalance is significantly better already 1 week after transplantation of L1 + but not L1 − cells points to the possibility that L1 either exerts its beneficial effects at early stages of migration and functional integration of grafted cells in the lesioned host tissue or that L1 + cells improve the regenerative capacity of the host. The first possibility is supported by the fact that L1 + cells migrate longer distances and differentiate twice as much into neurons compared with L1 − cells. Thus, more neurons distribute more profusely within the host striatum, possibly causing rapid integration and functional recovery. The second possibility is mainly supported by the fact that already 1 week after transplantation the behavior of mice that received L1 + grafts is improved, suggesting that secondary neurodegenerative processes after the acute quinolinic acid lesion are beneficially influenced by L1, because within 1 week after transplantation, only a minor fraction of transplanted cells had differentiated into GABAergic neurons. As afferents from the cerebral cortex do not degenerate within 1 week after quinolinic acid injection into the striatum (Gianfriddo et al., 2003), it is also conceivable that corticostriatal afferents are spared more extensively from dying back in the presence of L1 + cells than in the presence of L1 − cells. It is not unlikely that these mechanisms of rescue and reconstitution by the grafted cells may operate simultaneously, thus leading to a concerted action of functional recovery.
Previous studies have shown that genetically modified neural stem cell lines producing NGF (Kordower et al., 1997) or BDNF (Martinez-Serrano and Bjorklund, 1996) were able to protect striatal neurons against excitotoxic damage after transplantation into the striatum, when injected 1 week before injection of quinolinic acid, thus demonstrating rescue of host cells and less deterioration in behavioral function. Rescue of degenerating GABAergic host cells by ciliary neurotrophic factor secreted by neural progenitor cells in the rat quinolinic acid model of Huntington's disease showed a significant decline in apomorphin-induced rotations compared with nontransfected cells (Weinelt et al., 2003). Proactive transplantation of human neural stem cells has also been shown to prevent degeneration of striatal neurons in a rat model of Huntington's disease when injected 1 week before injection of the toxic agent (Ryu et al., 2004). One recent study reports on stable induction of a GABAergic phenotype in a line of immortalized striatal neural stem cells through a special culture protocol demonstrating long-term survival and synaptic integration of graft neurons, but data on functional host recovery are lacking in this report (Bosch et al., 2004).
We used for the first time ES cell-derived neural precursor cells in a syngeneic transplantation paradigm in mice to ameliorate the striatal tissue loss after lesioning. ES cells have so far never been shown to lead to functional recovery in the excitotoxic lesioning model of the striatum, and their differentiation in this experimental model system has not been studied before in vivo. The present study adds a novel aspect to the use of stem cells, and in particular ES cells, by engineering them to overexpress L1 as a potent neuronal survival as well as migration- and neurite outgrowth-promoting molecule. Because in our quinolinic acid model of excitotoxic lesion we could show that the striatal GABAergic projection neurons are depleted within 3 d after injection, the beneficial effects of transplanted stem cells must derive from their ability to substitute for the degenerated cells or from their ability to attenuate neurodegenerative processes, such as the secondary and delayed degeneration of corticostriatal projection neurons. Thus, our observations encourage the use of adhesion molecule-overexpressing stem cells to promote migration and integration into the lesioned host tissue and rescue degenerating neurons and repopulate and reconnect neuron-depleted brain regions in an effort to therapeutically ameliorate neurodegeneration, possibly not only in Huntington's disease but also in other neurodegenerative diseases, by overcoming the present disadvantage that sustained long-term functional recovery was not achieved under our experimental conditions, indicating the necessity to improve graft survival by additional measures.
Footnotes
This work was supported by German Research Foundation Grants Di 881/1-1 and Scha 185/36, by a START grant from the Medical Faculty of the Technical University of Aachen (C.M.K.), and by a donation from Erika and Conrad W. Schnyder (M.S.). We thank Alexander Nikonenko and Andrey Irintchev for help with statistics and migration studies and Masaru Okabe for providing the EGFP transgenic mice. We declare that we have no competing financial interests.
References
- Appel F, Holm J, Conscience JF, Schachner M. Several extracellular domains of the neural cell adhesion molecule L1 are involved in neurite outgrowth and cell body adhesion. J Neurosci. 1993;13:4764–4775. doi: 10.1523/JNEUROSCI.13-11-04764.1993. [DOI] [PMC free article] [PubMed] [Google Scholar]
- Barbin G, Aigrot MS, Charles P, Foucher A, Grumet M, Schachner M, Zalc B, Lubetzki C. Axonal cell-adhesion molecule L1 in CNS myelination. Neuron Glia Biol. 2004;1:65–72. doi: 10.1017/S1740925X04000092. [DOI] [PubMed] [Google Scholar]
- Bosch M, Pineda JR, Sunol C, Petriz J, Cattaneo E, Alberch J, Canals JM. Induction of GABAergic phenotype in a neural stem cell line for transplantation in an excitotoxic model of Huntington's disease. Exp Neurol. 2004;190:42–58. doi: 10.1016/j.expneurol.2004.06.027. [DOI] [PubMed] [Google Scholar]
- Chen J, Bernreuther C, Dihné M, Schachner M. Cell adhesion molecule L1-transfected embryonic stem cells with enhanced survival support regrowth of corticospinal tract axons in mice after spinal cord injury. J Neurotrauma. 2005;22:896–906. doi: 10.1089/neu.2005.22.896. [DOI] [PubMed] [Google Scholar]
- Chen S, Mantei N, Dong L, Schachner M. Prevention of neuronal cell death by neural adhesion molecules L1 and CHL1. J Neurobiol. 1999;38:428–439. doi: 10.1002/(sici)1097-4695(19990215)38:3<428::aid-neu10>3.0.co;2-6. [DOI] [PubMed] [Google Scholar]
- Demyanenko GP, Tsai AY, Maness PF. Abnormalities in neuronal process extension, hippocampal development, and the ventricular system of L1 knock-out mice. J Neurosci. 1999;19:4907–4920. doi: 10.1523/JNEUROSCI.19-12-04907.1999. [DOI] [PMC free article] [PubMed] [Google Scholar]
- Dihné M, Bernreuther C, Sibbe M, Paulus W, Schachner M. A new role fort the cell adhesion molecule L1 in neural precursor cell proliferation, differentiation, and transmitter-specific subtype generation. J Neurosci. 2003;23:6638–6650. doi: 10.1523/JNEUROSCI.23-16-06638.2003. [DOI] [PMC free article] [PubMed] [Google Scholar]
- Dong L, Chen S, Schachner M. Single chain Fv antibodies against neural cell adhesion molecule L1 trigger L1 functions in cultured neurons. Mol Cell Neurosci. 2003;22:234–247. doi: 10.1016/s1044-7431(02)00033-7. [DOI] [PubMed] [Google Scholar]
- Fransen E, Van Camp G, D'Hooge R, Vits L, Willems PJ. Genotype-phenotype correlation in L1 associated diseases. J Med Genet. 1998a;35:399–404. doi: 10.1136/jmg.35.5.399. [DOI] [PMC free article] [PubMed] [Google Scholar]
- Fransen E, D'Hooge R, Van Camp G, Verhoye M, Sijbers J, Reyniers E, Soriano P, Kamiguchi H, Willemsen R, Koekkoek SK, De Zeeuw CI, De Deyn PP, Van der Linden A, Lemmon V, Kooy RF, Willems PJ. L1 knockout mice show dilated ventricles, vermis hypoplasia and impaired exploration patterns. Hum Mol Genet. 1998b;7:999–1009. doi: 10.1093/hmg/7.6.999. [DOI] [PubMed] [Google Scholar]
- Fricker RA, Annett LE, Torres EM, Dunnett SB. The placement of a striatal ibotenic acid lesion affects skilled forelimb use and the direction of drug-induced rotation. Brain Res Bull. 1996;41:409–416. doi: 10.1016/s0361-9230(96)00083-4. [DOI] [PubMed] [Google Scholar]
- Gianfriddo M, Corsi C, Melani A, Pezzola A, Reggio R, Popoli P, Pedata F. Adenosine A2A antagonism increases striatal glutamate outflow in the quinolinic acid rat model of Huntington's disease. Brain Res. 2003;979:225–229. doi: 10.1016/s0006-8993(03)02942-1. [DOI] [PubMed] [Google Scholar]
- Haney CA, Sahenk Z, Li C, Lemmon VP, Roder J, Trapp BD. Heterophilic binding of L1 on unmyelinated sensory axons mediates Schwann cell adhesion and is required for axonal survival. J Cell Biol. 1999;146:1173–1184. doi: 10.1083/jcb.146.5.1173. [DOI] [PMC free article] [PubMed] [Google Scholar]
- Howard CW, Reed MJ. Oxford: Bios Scientific; 1998. Unbiased stereology: three-dimensional measurement in microscopy. [Google Scholar]
- Kamiguchi H, Yoshihara F. The role of endocytic L1 trafficking in polarized adhesion and migration of growth cones. J Neurosci. 2001;21:9194–9203. doi: 10.1523/JNEUROSCI.21-23-09194.2001. [DOI] [PMC free article] [PubMed] [Google Scholar]
- Kleene R, Yang HB, Kutsche M, Schachner M. The neural recognition molecule L1 is a sialic acid-binding lectin for CD24, which induces promotion and inhibition of neurite outgrowth. J Biol Chem. 2001;276:21656–21663. doi: 10.1074/jbc.M101790200. [DOI] [PubMed] [Google Scholar]
- Kordower JH, Chen EY, Winkler C, Fricker R, Charles V, Messing A, Mufson EJ, Wong SC, Rosenstein JM, Bjorklund A, Emerich DF, Hammang J, Carpenter MK. Grafts of EGF-responsive neural stem cells derived from GFAP-hNGF transgenic mice: trophic and tropic effects in a rodent model of Huntington's disease. J Comp Neurol. 1997;13:96–113. doi: 10.1002/(sici)1096-9861(19971013)387:1<96::aid-cne8>3.0.co;2-i. [DOI] [PubMed] [Google Scholar]
- Law JW, Lee AY, Sun M, Nikonenko AG, Chung SK, Dityatev A, Schachner M, Morellini F. Decreased anxiety, altered place learning, and increased CA1 basal excitatory synaptic transmission in mice with conditional ablation of the neural cell adhesion molecule L1. J Neurosci. 2003;23:10419–10432. doi: 10.1523/JNEUROSCI.23-32-10419.2003. [DOI] [PMC free article] [PubMed] [Google Scholar]
- Lee SH, Lumelsky N, Studer L, Auerbach JM, McKay RD. Efficient generation of midbrain and hindbrain neurons from mouse embryonic stem cells. Nat Biotechnol. 2000;18:675–679. doi: 10.1038/76536. [DOI] [PubMed] [Google Scholar]
- Lemmon V, Farr KL, Lagenaur C. L1-mediated axon outgrowth occurs via a homophilic binding mechanism. Neuron. 1989;2:1597–1603. doi: 10.1016/0896-6273(89)90048-2. [DOI] [PubMed] [Google Scholar]
- Lindner J, Rathjen FG, Schachner M. L1 mono- and polyclonal antibodies modify cell migration in early postnatal mouse cerebellum. Nature. 1983;305:427–430. doi: 10.1038/305427a0. [DOI] [PubMed] [Google Scholar]
- Luthi A, Mohajeri H, Schachner M, Laurent JP. Reduction of hippocampal long-term potentiation in transgenic mice ectopically expressing the neural cell adhesion molecule L1 in astrocytes. J Neurosci Res. 1996;46:1–6. doi: 10.1002/(SICI)1097-4547(19961001)46:1<1::AID-JNR1>3.0.CO;2-P. [DOI] [PubMed] [Google Scholar]
- Martinez-Serrano A, Bjorklund A. Protection of the neostriatum against excitotoxic damage by neurotrophin-producing, genetically modified neural stem cells. J Neurosci. 1996;16:4604–4616. doi: 10.1523/JNEUROSCI.16-15-04604.1996. [DOI] [PMC free article] [PubMed] [Google Scholar]
- Moos M, Tacke R, Scherer H, Teplow D, Fruh K, Schachner M. Neural cell adhesion molecule L1 as a member of the immunoglobulin superfamily with binding domains similar to fibronectin. Nature. 1988;334:701–703. doi: 10.1038/334701a0. [DOI] [PubMed] [Google Scholar]
- Okabe S, Forsberg-Nilsson K, Spiro AC, Segal M, McKay RD. Development of neuronal precursor cells and functional postmitotic neurons from embryonic stem cells in vitro. Mech Dev. 1996;59:89–102. doi: 10.1016/0925-4773(96)00572-2. [DOI] [PubMed] [Google Scholar]
- Pradel G, Schmidt R, Schachner M. Involvement of L1.1 in memory consolidation after active avoidance conditioning in zebrafish. J Neurobiol. 2000;43:389–403. [PubMed] [Google Scholar]
- Rathjen FG, Schachner M. Immunocytological and biochemical characterization of a new neuronal cell surface component (L1 antigen) which is involved in cell adhesion. EMBO J. 1984;3:1–10. doi: 10.1002/j.1460-2075.1984.tb01753.x. [DOI] [PMC free article] [PubMed] [Google Scholar]
- Roonprapunt C, Huang W, Grill R, Friedlander D, Grumet M, Chen S, Schachner M, Young W. Soluble cell adhesion molecule L1-Fc promotes locomotor recovery in rats after spinal cord injury. J Neurotrauma. 2003;20:871–882. doi: 10.1089/089771503322385809. [DOI] [PubMed] [Google Scholar]
- Ryu JK, Kim J, Cho SJ, Hatori K, Nagai A, Choi HB, Lee MC, McLarnon JG, Kim SU. Proactive transplantation of human neural stem cells prevents degeneration of striatal neurons in a rat model of Huntington's disease. Neurobiol Dis. 2004;16:68–77. doi: 10.1016/j.nbd.2004.01.016. [DOI] [PubMed] [Google Scholar]
- Saghatelyan AK, Nikonenko AG, Sun M, Rolf B, Putthoff P, Kutsche M, Bartsch U, Dityatev A, Schachner M. Reduced GABAergic transmission and number of hippocampal perisomatic inhibitory synapses in juvenile mice deficient in the neural cell adhesion molecule L1. Mol Cell Neurosci. 2004;26:191–203. doi: 10.1016/j.mcn.2004.01.008. [DOI] [PubMed] [Google Scholar]
- Seilheimer B, Persohn E, Schachner M. Neural cell adhesion molecule expression is regulated by Schwann cell-neuron interactions in culture. J Cell Biol. 1989;108:1909–1915. doi: 10.1083/jcb.108.5.1909. [DOI] [PMC free article] [PubMed] [Google Scholar]
- Tiunova A, Anokhin KV, Schachner M, Rose SP. Three time windows for amnestic effect of antibodies to cell adhesion molecule L1 in chicks. NeuroReport. 1998;9:1645–1648. doi: 10.1097/00001756-199805110-00070. [DOI] [PubMed] [Google Scholar]
- Venero C, Tilling T, Hermans-Borgmeyer I, Herrero AI, Schachner M, Sandi C. Water maze learning and forebrain mRNA expression of the neural cell adhesion molecule L1. J Neurosci Res. 2004;75:172–181. doi: 10.1002/jnr.10857. [DOI] [PubMed] [Google Scholar]
- Weinelt S, Peters S, Bauer P, Mix E, Haas SJ, Dittmann A, Petrov S, Wree A, Cattaneo E, Knoblich R, Strauss U, Rolfs A. Ciliary neurotrophic factor overexpression in neural progenitor cells (ST14A) increases proliferation, metabolic activity, and resistance to stress during differentiation. J Neurosci Res. 2003;71:228–236. doi: 10.1002/jnr.10477. [DOI] [PubMed] [Google Scholar]
- Wolfer DP, Mohajeri HM, Lipp HP, Schachner M. Increased flexibility and selectivity in spatial learning of transgenic mice ectopically expressing the neural cell adhesion molecule L1 in astrocytes. Eur J Neurosci. 1998;10:708–717. doi: 10.1046/j.1460-9568.1998.00089.x. [DOI] [PubMed] [Google Scholar]
- Wood P, Moya F, Eldridge C, Owens G, Ranscht B, Schachner M, Bunge M, Bunge R. Studies of the initiation of myelination by Schwann cells. Ann NY Acad Sci. 1990;605:1–14. doi: 10.1111/j.1749-6632.1990.tb42376.x. [DOI] [PubMed] [Google Scholar]
- Xu G, Nie DY, Wang WZ, Zhang PH, Shen J, Ang BT, Liu GH, Luo XG, Chen NL, Xiao ZC. Optic nerve regeneration in polyglycolic acid-chitosan conduits coated with recombinant L1-Fc. NeuroReport. 2004;15:2167–2172. doi: 10.1097/00001756-200410050-00004. [DOI] [PubMed] [Google Scholar]
- Zhang Y, Bo X, Schoepfer R, Holtmaat AJ, Verhaagen J, Emson PC, Lieberman AR, Anderson PN. Growth-associated protein GAP-43 and L1 act synergistically to promote regenerative growth of Purkinje cell axons in vivo. Proc Natl Acad Sci USA. 2005;102:14883–14888. doi: 10.1073/pnas.0505164102. [DOI] [PMC free article] [PubMed] [Google Scholar]