

Abstract
Synaptic vesicle recycling is essential for maintaining neurotransmission during rhythmic activity. To test whether the demands imposed by ambient activity influences synaptic vesicle trafficking, we compared the kinetics of synaptic depression in hippocampal versus neocortical cultures, which have high and low levels of intrinsic activity, respectively. In response to moderate 10 Hz stimulation, hippocampal synapses depressed less compared with neocortical synapses, although they reused vesicles more slowly. Therefore, during stimulation, hippocampal synapses used more vesicles from the reserve pool, whereas neocortical synapses relied on vesicle reuse. In hippocampal cultures, chronic block of network activity increased synaptic depression by decreasing the rate of vesicle mobilization, with little effect on the rate of vesicle reuse. In contrast, in neocortical cultures, an increase in the normally low network activity reduced synaptic depression by robustly increasing vesicle reuse with no effect on vesicle mobilization. These results suggest that synaptic vesicle trafficking and the resulting synaptic dynamics adapt to meet the changing demands on neurotransmitter release. Furthermore, during these functional modifications, synapses use alternate strategies to adjust to changes in activity.
Keywords: exocytosis, FM1-43, synaptic vesicle release, synaptic plasticity, synaptic transmission, network
Introduction
Repetitive action potential (AP) firing elicits rapid synaptic depression, which is characterized by a marked decrease in postsynaptic responses to a plateau level. Typically, the time course of neurotransmission during depression follows a biphasic profile. The early phase of depression is in part attributed to depletion of a readily releasable pool of vesicles. This rapid phase is followed by tonic release sustained either by mobilization of synaptic vesicles from a reserve pool, or rapid reuse of previously fused vesicles (Wu, 2004; Rizzoli and Betz, 2005). The magnitude and the kinetics of these two components, and the relative contribution of the two phases to neurotransmission during repetitive activity, vary among synapses. For instance, there is significant variability in the rate of short-term synaptic depression among cerebellar synapses as well as hippocampal and cortical synapses (Dobrunz and Stevens, 1997; Dittman et al., 2000; Petersen, 2002). These properties of a synapse are generally considered to be hard-wired depending on the type and morphology of a synapse, as well as on the identity of presynaptic and postsynaptic neurons (Zucker and Regehr, 2002; Abbott and Regehr, 2004). However, in the neuromuscular junction, there are clear examples of conversion of synapses between tonic and phasic release properties depending on their history of use (Lnenicka and Atwood, 1985; Lnenicka et al., 1986; Bewick, 2003; Reid et al., 2003). Recent experiments in cortical slice cultures also suggest a role of cortical network activity as a potent regulator on short-term depression (Reig et al., 2006).
Most commonly studied presynaptic forms of plasticity alter the probability of vesicle fusion or the number of readily releasable vesicles, which in turn modify the rate of the rapid phase of depression. In the CNS, however, synapses contain a small number of recycling vesicles and at the same time face varying frequencies and durations of stimulation because of fluctuating levels of network activity. The ability of central synapses to effectively meet these challenges for long periods of activity would be significantly bolstered if the properties of vesicle recycling as a whole were modifiable, in addition to vesicle fusion probability or the number of releasable vesicles. Currently, there is no information on the long-term adaptability and plasticity of synaptic vesicle dynamics in response to challenges imposed by network activity.
Here, we took advantage of the different background activity levels in hippocampal and neocortical cultures to study the responsiveness of vesicle recycling to chronic alterations in activity. We found two parameters to be plastic in different synapses in response to changing chronic activity: mobilization of vesicles from the reserve pool and vesicle reuse. In hippocampal cultures, a decrease in the normally high levels of network activity, with tetrodotoxin (TTX) incubation, increased synaptic depression by reducing the rate of vesicle mobilization from the reserve pool with little effect on the rate of vesicle reuse. In contrast, the rate of synaptic vesicle reuse in neocortical synapses responded robustly to changes in activity levels. Incubation with picrotoxin (PTX) slowed synaptic depression by significantly increasing synaptic vesicle reuse rate, whereas TTX treatment did not significantly change the rate of synaptic depression but slowed synaptic vesicle reuse. Interestingly, in neocortical cultures, neither of these treatments had a major effect on synaptic vesicle mobilization from the reserve pool. Our results suggest that network activity is a critical determinant of synaptic vesicle trafficking and the resulting synaptic response dynamics. Therefore, we propose that synaptic vesicle trafficking can adapt to demand and that different synapses use alternate strategies to adjust to network activity levels.
Materials and Methods
Cell culture.
Dissociated hippocampal and neocortical cultures were prepared from 2- to 3-d-old Sprague Dawley rat pups using previously described methods (Mozhayeva et al., 2002). Experiments were performed after 14 d in vitro (typically ∼20 d in vitro) corresponding to a time period when synapses reach full maturity in culture.
Drug treatments.
All pharmacological treatments were performed with parallel drug-free controls on at least two culture batches for each condition. In a given culture batch, 6–12 coverslips were subjected to treatment with TTX (1 μm; Calbiochem, La Jolla, CA) or picrotoxin (50 μm; Sigma, St. Louis, MO). A 50 mm picrotoxin stock solution in DMSO was used at a 1:1000 dilution, to minimize the DMSO concentration in order not to affect synaptic properties (data not shown). Only cultures with similar cell densities were used for analysis. Results of pharmacological interventions were examined 2 d later. During whole-cell voltage-clamp recordings, leak currents at a holding potential of −70 mV (−100 ± 17 pA) were unaffected by the treatments.
Electrophysiology.
Pyramidal cells were voltage-clamped to −70 mV using whole-cell patch-clamp technique. Typical series resistance values varied between 7 and 15 MΩ and were left uncompensated (voltage errors were typically <30 mV). Electrode solution contained the following (in mm): 115 Cs-MeSO3, 10 CsCl, 5 NaCl, 10 HEPES, 0.6 EGTA, 20 TEA·Cl, 4 Mg-ATP, 0.3 Na2GTP, 10 lidocaine N-ethyl bromide (QX-314), pH 7.35 and 300 mOsm (Sigma). For current-clamp experiments, pipettes were filled with the following (in mm): 135 K-gluconate, 10 KCl, 5 NaCl, 10 HEPES, 0.6 EGTA, 4 Mg-ATP, 0.3 Na2GTP, pH 7.38 and 295 mOsm.
Data were acquired using an Axopatch 200B amplifier and Clampex 8.0 software (Molecular Devices, Sunnyvale, CA). Recordings were filtered at 2 kHz and sampled at 5 kHz. For measuring evoked responses, electrical stimulation was delivered through parallel platinum electrodes in modified Tyrode’s solution. All statistical comparisons were performed with two-tailed unpaired t test; values are given as means ± SEM.
Fluorescent detection of synaptic vesicle recycling.
Modified Tyrode’s solution used in all experiments contained the following (in mm): 150 NaCl, 4 KCl, 2 MgCl2, 10 glucose, 10 HEPES, and 2 CaCl2, pH 7.4 and ∼310 mOsm. High K+ solutions contained equimolar substitution of KCl (90 mm) for NaCl. Synaptic boutons were loaded with FM2-10 (400 μm; Invitrogen, Eugene, OR) under conditions outlined for each experiment. Destaining of hippocampal terminals with high-potassium challenge was achieved by direct perfusion of solutions onto the field of interest by gravity (2 ml/min). In a typical experiment, high potassium challenge was applied four times, the first for 90 s followed by three applications of 60 s each (each separated by 60 s intervals) to release all of the dye trapped in presynaptic terminals. All staining and destaining protocols were performed in the presence of 10 μm CNQX and 50 μm AP-5 to prevent recurrent activity. Field stimulation was applied through parallel platinum electrodes immersed into the perfusion chamber delivering 30 mA, 1 ms pulses. In all experiments, we selected isolated boutons (∼1 μm2; interbouton distance, >2 μm) for analysis and avoided apparent synaptic clusters. Images were obtained by a cooled-intensified digital CCD camera (Roper Scientific, Trenton, NJ) during illumination (1 Hz, 40 ms) at 480 ± 20 nm (505 dichroic long pass; 535 ± 25 band pass) via an optical switch (Sutter Instruments, Novato, CA). Images were acquired and analyzed using Axon Imaging Workbench Software (Molecular Devices). All statistical analyses were performed using Student’s two-tailed t test using the number of coverslips as “n” unless stated otherwise (∼100 puncta per coverslip). Experimental results are represented as means ± SEM.
To measure vesicle reuse, synapses were loaded with FM2-10 dye by 100 APs delivered at 10 Hz in the presence of 10 μm CNQX and 50 μm AP-5 to prevent recurrent activity. Dye was rapidly washed out (10 ml/min perfusion rate) with dye-free solution containing 2 mm Ca2+ and CNQX and AP-5 for 60 s. After this 60 s of fast perfusion, we continued to wash for an additional 9 min in 4 mm K+ Tyrode’s solution with 0 mm Ca2+, to remove any remaining surface dye, after which the dye trapped during the 100 AP loading was determined by maximally destaining the synapses with four rounds of 90 mm K+ Tyrode’s solution. The median fluorescence value obtained during this 100 AP loading was used as the zero time point, against which all subsequent time points were normalized. Here, we preferred to use the median fluorescence value rather than the mean fluorescence, because synaptic vesicle pool sizes show substantial heterogeneity and median fluorescence represents this heterogeneity better than the mean (Virmani et al., 2003). To measure vesicle reuse, we continued 10 Hz stimulation during the fast dye washout period for a time Δt, either 5, 15, 30, or 60 s corresponding to additional 50, 150, 300, or 600 APs. To determine the amount of dye lost during this extended stimulation, we subtracted the median fluorescence value from all the synapses imaged at each time point, from the median fluorescence of all synapses imaged at the zero time point (when no additional stimulation was applied during washout). This allowed us to plot the amount of dye loss during the additional Δt of stimulation at each time point, as a percentage of the dye that was endocytosed during 100 AP stimulation. This we take to correspond to the number of dye-loaded vesicles that were able to exocytose their dye during the time Δt. Because the dye was present only during the initial 100 APs, these curves provide us with a measure of vesicle reuse in the synapses (Ryan and Smith, 1995). It is important to note that the experimental protocol used here to detect the rate of synaptic vesicle reuse monitors reavailability of vesicles after the first 10 s of stimulation (to provide enough duration for clearly measurable dye uptake). In contrast, vesicles that recycle on a faster time scale (within the first 10 s) can also impact neurotransmission and thus alter electrophysiological readout at previous time points. During the analysis of these experiments, statistical significance was determined by applying a stringent value of p < 10−8 using the Kolmogorov–Smirnov (K–S) test.
Results
The kinetics of sustained neurotransmitter release in hippocampal versus neocortical cultures
To investigate the functional diversity of synapses in response to repetitive stimulation, we used dissociated cultures from neocortex and hippocampi of newborn rats. We analyzed synaptic function at least after 2 weeks in culture to allow sufficient time for synaptic properties to reach maturity. For this analysis, we selected moderate 10 Hz stimulation because previous studies have shown that this frequency leads to substantial synaptic depression as well as turnover of the total vesicle pool without saturation of the vesicle recycling machinery (Ryan and Smith, 1995; Klingauf et al., 1998; Sankaranarayanan and Ryan, 2001; Sara et al., 2002; Fernandez-Alfonso and Ryan, 2004). This setting, thus, allows ample dynamic range for potential plasticity. When we applied 10 Hz stimulation and recorded synaptic responses from neurons with pyramidal morphology in both cultures, synapses onto neocortical neurons showed more pronounced depression compared with hippocampal synapses of the same age (τfast, 0.9 ± 0.2 vs 3.5 ± 0.8 s; p < 0.01; relative amplitude of τfast, 65 ± 4 vs 50 ± 6%, for neocortical and hippocampal neurons, respectively) (Fig. 1A,B). In neocortical cultures, the amplitude of initial synaptic responses was slightly higher than in hippocampal cultures, but the difference did not reach significance [neocortical (n = 21), 3.5 ± 0.4 nA; hippocampal (n = 8), 2.9 ± 0.6 nA; p > 0.5]. This difference between the two depression patterns could not be attributed to factors such as differences in receptor desensitization or in the contribution of excitatory versus inhibitory synapses to overall activity. Application of cyclothiazide to block AMPA receptor desensitization decreased the time constant of rapid depression in both cultures, but the difference in the rates of depression between neocortical and hippocampal cultures was not substantially effected by the cyclothiazide treatment (τfast, 0.4 ± 0.1 and 2.9 ± 0.9 s; relative amplitude of τfast, 71 ± 5 and 60 ± 3%, for neocortical and hippocampal neurons, respectively) (Fig. 1C). The ratio of EPSCs and IPSCs determined after pharmacological isolation of the two current components was also similar between the two cultures (EPSC/IPSC: neocortical, 1.20 ± 0.30; hippocampal, 1.19 ± 0.23).

Differences in the dynamics of synaptic depression between neocortical and hippocampal neurons in culture. A, Sample traces of synaptic depression recorded from hippocampal (top traces) and neocortical (bottom traces) neurons in culture during 10 Hz stimulation (the first 10 responses and the 100th to 110th response are shown). B, Traces showing the average synaptic depression from a number of cells normalized to the amplitude of the first response (n = 21 cells and 8 cells for neocortex and hippocampus, respectively). Neocortical neurons depress significantly faster than hippocampal neurons in response to 10 Hz stimulation with significance (p < 0.01) emerging by the fifth response. C, Treatment with cyclothiazide (CTZ) to block AMPA receptor desensitization slightly (gray symbols) decreased the time constant of rapid depression in both neocortical (n = 4) and hippocampal (n = 8) cultures but maintained the difference in the rates of depression between the two cultures. Error bars indicate SE.
Dominance of alternate pathways for vesicle use in hippocampal and neocortical synapses
Because the difference between the synaptic depression kinetics was sustained over several seconds (>30 s), we asked whether there were differences in the rate of synaptic vesicle mobilization and reuse between the two synapse populations. To address this question, we stimulated both cultures at 10 Hz for 2 min in the presence of styryl dye FM2-10 to label the total recycling vesicle pool (Harata et al., 2001). After dye washout (∼10 min), we stimulated the cultures again at 10 Hz and monitored the kinetics of dye loss. The absolute amount of FM2-10 uptake during a 10 Hz, 2 min stimulation revealed that neocortical synapses have a significantly smaller total recycling pool size compared with hippocampal synapses (Fig. 2A). Interestingly, neocortical synapses released dye more slowly compared with hippocampal synapses consistent with their rapid synaptic depression kinetics (Fig. 2B).

Neocortical and hippocampal synapses have distinct kinetics of synaptic vesicle recycling. A, Synapses were loaded with FM2-10 using 1200 APs delivered at 10 Hz through field electrodes and, after a brief wash, were destained by 10 Hz, 90 s stimulation, followed by multiple rounds of 90 mm K+ to maximally destain the synapses. The total recycling pool size was measured by loading synapses using 1200 APs delivered at 10 Hz and, after extracellular dye washout, destaining the synapses using 90 mm K+. Hippocampal synapses showed a larger recycling pool size (p < 0.05; n = 5 coverslips each). B, Average dye destaining curves from a number of experiments show that neocortical synapses destain slower than hippocampal synapses, which was significant after 20 s of stimulation (p < 0.05; two-tailed t test; n = 5 coverslips each). The baseline by 90 s was not significantly different (p = 0.2). Error bars indicate SE. C, Vesicle reuse was measured using a pulse-chase experiment (see Materials and Methods). The plot shows the average percentage of reused vesicles for neocortical and hippocampal synapses as a function of the time of continued stimulation (Δt). With this protocol, neocortical synapses show significantly faster vesicle reuse than hippocampal synapses (n = 550–800 synapses from 6–7 coverslips for each time point per condition; asterisks indicate significance determined by applying a stringent value of p < 10−8 using the K–S test).
Two parallel processes sustain neurotransmitter release during repetitive stimulation, namely mobilization of reserve pool vesicles that have not yet exocytosed and reuse of recently endocytosed vesicles. Destaining curves specifically report dye release from vesicles, and therefore these curves are to a large extent blind to vesicle reuse because these vesicles would not contain significant amounts of dye once they recycle (for a detailed discussion, see Klingauf et al., 1998). In contrast, to monitor synaptic vesicle reuse, one needs to label a set of endocytosing vesicles with dye and detect reavailability of these vesicle for consecutive rounds of exocytosis at later time points (Ryan and Smith, 1995). Therefore, to test whether the neocortical and hippocampal synapses reuse vesicles at different rates, we monitored the rate of reavailability of styryl dye FM2-10 for release after uptake during 10 Hz stimulation for 10 s (Fig. 2C) (for a detailed description of this protocol, see Materials and Methods). The amount of dye uptake in response to this stimulation was not significantly different, suggesting that the rate of endocytosis during the initial 10 s of 10 Hz was similar [166 ± 16 and 143 ± 16 arbitrary units (a.u.) for neocortical and hippocampal synapses, respectively; p = 0.35; n = 7 coverslips each]. However, the increase in the availability of the dye for release in response to subsequent stimulations was slower in hippocampal cultures compared with neocortical cultures (Fig. 2C). This observation indicates that, during 10 Hz stimulation, hippocampal synapses do not significantly rely on vesicle reuse to sustain transmission (Sara et al., 2002; Fernandez-Alfonso and Ryan, 2004), whereas neocortical synapses maintain a faster rate of synaptic vesicle reuse at the same frequency. A similar difference in the two cultures can also be deduced from previous work. For instance, a comparison of synaptic vesicle reuse (also called “repriming”) rates measured in two studies performed in hippocampal (Ryan and Smith, 1995) and cortical (Di Paolo et al., 2002) cultures reveal a slower rate of vesicle reuse in hippocampal cultures. However, a direct comparison to our measurements is complicated by the fact that the stimulation frequencies in the two previous studies were different [20 Hz in Di Paolo et al. (2002) vs 10 Hz in Ryan and Smith (1995)].
In summary, despite their high level of sustained transmission, hippocampal synapses appeared to recycle vesicles much slower than neocortical synapses. Therefore, during 10 Hz stimulation, hippocampal synapses used more vesicles from the reserve pool as evidenced by their faster loss of dye during stimulation (Fig. 2B). In contrast, neocortical synapses depended more on the reuse of already exocytosed vesicles (Fig. 2C). This premise is also consistent with the observation that hippocampal synapses have a larger recycling pool to draw vesicles from, whereas neocortical synapses appear to rely on a smaller pool to maintain release (Fig. 2A). However, currently there is no known causal relationship between the recycling pool size and vesicle reuse rate of a particular synapse.
Comparative analysis of the network activity in hippocampal and neocortical cultures
The experiments presented above suggest that different synapse populations in the CNS may rely on different vesicle trafficking pathways to maintain release during repetitive stimulation. We next asked whether these two vesicle-recycling pathways could be differentially regulated. The neocortical and hippocampal synapses in vitro share general features of small central synapses (small vesicle pool sizes and few active zones), and they possess only subtle differences in their ultrastructural features (Harris and Sultan, 1995; Schikorski and Stevens, 1997; Mackenzie et al., 1999; Harata et al., 2001; Mozhayeva et al., 2002). A striking difference between the two culture preparations, however, is the level of network activity. When we quantified the level of synaptic network activity using whole-cell voltage-clamp recordings (in the presence of postsynaptic QX-314 to block AP firing in the target cell), the frequency of the network activity was significantly higher in hippocampal cultures compared with neocortical cultures (hippocampal, 6.57 ± 0.7 Hz, vs neocortical, 0.49 ± 0.13 Hz; p < 0.001; n = 6 cells each) (Fig. 3). However, the amplitudes of individual synaptic currents were somewhat smaller in hippocampal cultures (hippocampal, 0.63 ± 0.06 nA, vs neocortical, 1.14 ± 0.34 nA; p = 0.2; n = 6 cells). Here, we should note that the background network activity represented activation of multiple synapses as evidenced by the large amplitudes (approximately in nanoamperes) of individual events (at least an order of magnitude above the size of spontaneous miniature events).

Spontaneous network activity in neocortical and hippocampal cultures. Sample traces of spontaneous network activity recorded from neurons in neocortical cultures (top two traces) and hippocampal cultures (bottom two traces).
Figure 4 summarizes the current-clamp analysis of the network activity in neocortical and hippocampal cultures. Interestingly, the average frequency of action potential firing was not significantly different between neocortical neurons and hippocampal neurons (hippocampal, 0.5 ± 0.22 Hz, vs neocortical, 0.49 ± 0.17 Hz; p > 0.5; n = 6 cells each) (Fig. 4). In hippocampal cultures, a substantial fraction of the EPSPs failed to reach the threshold for action potential firing (Fig. 4, arrows), and as a consequence, the percentage of detectable subthreshold EPSPs was higher in hippocampal cultures (hippocampal, 55 ± 14%, vs neocortical, 17 ± 5%; p < 0.05; n = 6 cells). This finding correlates well with the low amplitude of network activity-triggered EPSCs detected in these cultures.

Current-clamp analysis of spontaneous network activity in neocortical and hippocampal cultures. Sample traces of action potentials and EPSPs recorded from neurons in neocortical cultures (top traces) and hippocampal cultures (bottom traces). The arrows point to subthreshold synaptic activity.
Chronic inhibition of network activity slows the rate of vesicle mobilization in hippocampal synapses
In the next set of experiments, we tested whether the level of network activity is a determinant of the pathway and the speed of vesicle trafficking. In hippocampal synapses, when we reduced the network activity level by incubation in TTX (to block AP firing) for 48 h, the rate of synaptic depression was increased. In contrast, incubation in PTX, aimed to diminish inhibition and facilitate excitatory transmission, did not cause a significant change in the kinetics of synaptic depression in response to 10 Hz stimulation (Fig. 5A,B). In addition, the amplitudes of the initial responses in the 10 Hz train were similar under all conditions (Fig. 5C).

Chronic reduction in spontaneous activity results in enhanced synaptic depression in hippocampal cultures. A, Sample traces of synaptic depression recorded from control (untreated) hippocampal neurons (left, top traces) or hippocampal neurons after 48 h of TTX (left, bottom traces) or PTX treatment (right traces). The first 10 responses and the 100th to 110th responses in a 600 AP train delivered at 10 Hz are shown. B, Average normalized response amplitudes show faster synaptic depression in neurons pretreated with TTX for 48 h compared with PTX-treated and control neurons (n = 8, 9, and 13 cells for control, TTX-, and PTX-treated respectively). C, Average amplitude of the first response in the train is unchanged after the treatments. Error bars indicate SE.
To understand the mechanisms underlying the alterations in neurotransmitter release, we investigated the kinetics of vesicle mobilization and reuse after the chronic treatments. Hippocampal synapses labeled with nearly maximal FM dye uptake (10 Hz for 2 min) displayed a slower rate of dye loss in response to 10 Hz stimulation after chronic TTX treatment (Fig. 6A). In contrast, dye release and vesicle mobilization was unaltered after PTX treatment. This finding suggests that the increase in the rate of depression induced by TTX treatment could be accounted for by a decrease in the rate of vesicle mobilization from the reserve pool. In the same experiments, the total recycling pool size measured by dye uptake during 1200 APs at 10 Hz was unaffected by the treatments (Fig. 6B). In electrophysiological experiments performed after TTX or PTX treatments, we detected a decreasing trend in the size of the readily releasable pool determined by integration of the area under the peak current elicited by hypertonic sucrose application (+500 mOsm). However, this decrease, which was especially notable after PTX treatment, did not reach statistical significance [charge transfer during sucrose application: control (n = 8), 7.7 ± 1.4 nC; TTX-treated (n = 9), 6.5 ± 0.9 nC (p > 0.05 vs control); PTX-treated (n = 7), 4.9 ± 0.8 nC (p = 0.06 vs control)] (see supplemental Fig. 1, available at www.jneurosci.org as supplemental material).

Chronic reduction in spontaneous activity slows vesicle mobilization in hippocampal synapses. A, Dye release from synapses loaded with FM2-10 using 1200 APs showed significantly slower release kinetics in TTX-treated synapses compared with control or PTX-treated cells. The time constant of decay for these traces is shown in the inset and is significantly higher for TTX-treated cultures (p < 0.01, two-tailed t test; n = 5–6 coverslips each). B, The average recycling pool size measured as dye uptake during 1200 APs at 10 Hz is not significantly different in treated synapses compared with controls (n = 5–6 coverslips each). C, Average FM2-10 uptake during a brief 10 Hz, 10 s stimulus (100 APs) is not significantly different between treated and control synapses (n = 7 coverslips each). D, The rate of vesicle reuse under repetitive stimulation was measured by continued stimulation after dye washout. Although TTX-treated synapses showed an increased dye release by 5 s compared with controls, the plateau was not significantly different. Conversely, PTX-treated synapses were similar to control synapses but had less dye loss at 60 s compared with controls (n = 550–800 synapses from 6–7 coverslips for each time point per condition; points are considered significant and indicated by an asterisk if p < 10−8 with K–S test). Error bars indicate SE.
Interestingly, when we manipulated the network activity levels (i.e., decrease in TTX or increase after incubation in PTX to block synaptic inhibition) and examined the reavailability of FM dye after initial uptake during 100 APs at 10 Hz, we detected little change in the rate of synaptic vesicle reuse or the amount of dye taken up during the 10 s labeling (Fig. 6C,D). One of the few significant alterations was a slight hastening of dye reavailability within 5 s after dye uptake in TTX-treated cultures; however, we should note that the 5 s time point is the least reliable because of the uncertainty about dye washout within this timeframe (residual dye can lead to an underestimate of vesicle reuse within this time frame). In addition, after PTX treatment, dye availability 60 s after initial loading was markedly reduced, suggesting inhibition of slow synaptic vesicle turnover.
Chronic increase in network activity augments the rate of vesicle reuse in neocortical cultures
To test whether synaptic vesicle trafficking in neocortical synapses can also adapt to modified network activity, we repeated the 48 h TTX or PTX treatments in this culture system. In striking contrast to hippocampal cultures, PTX treatment slowed synaptic depression, whereas TTX treatment did not significantly change the rate of synaptic depression (Fig. 7A,B). However, as in hippocampal cultures, the amplitudes of the initial responses in the 10 Hz train were not affected by the chronic treatments (Fig. 7C). We also did not detect a significant change in the size of the readily releasable pool of vesicles as measured by integration of the peak current response to hypertonic sucrose application after treatment with TTX or PTX [charge transfer during sucrose application: control (n = 10), 7.1 ± 0.6 nC; TTX-treated (n = 8), 7.2 ± 0.9 nC (p > 0.05 vs control); PTX-treated (n = 11), 5.9 ± 0.8 nC (p > 0.05 vs control)] (see supplemental Fig. 1, available at www.jneurosci.org as supplemental material). When we monitored the rate of vesicle mobilization using FM dye uptake and release in response to 10 Hz stimulation, neither of the treatments had a major effect on dye release (Fig. 8A). These experiments also revealed that the size of the total recycling pool (FM dye labeling after 10 Hz, 2 min AP stimulation) was relatively unchanged after the TTX or PTX treatment (Fig. 8B).

Chronic augmentation of spontaneous activity slows synaptic depression in neocortical cultures. A, Sample traces of synaptic depression recorded postsynaptically from control neocortical neurons (left, top traces) or neocortical neurons after 48 h of TTX (left, bottom traces) or PTX treatment (right traces). The first 10 responses and the 100th to 110th responses in a 600 AP train delivered at 10 Hz are shown. B, Average normalized response amplitudes show significantly slower synaptic depression in neurons pretreated with PTX for 48 h compared with TTX-treated and control neurons (n = 21, 15, and 10 cells for control, TTX-, and PTX-treated, respectively). C, Average amplitude of the first response in the train is unchanged by treatments. Error bars indicate SE.

Chronic augmentation of spontaneous activity facilitates synaptic vesicle reuse in neocortical synapses. A, FM dye release from synapses loaded using 1200 APs showed no change in release kinetics (n = 5–6 coverslips each). B, The average recycling pool size measured as dye uptake during 1200 APs at 10 Hz is not significantly different in treated synapses compared with controls (n = 5–6 coverslips each). C, Average FM2-10 uptake during a brief 10 Hz, 10 s stimulus (100 APs) is not significantly different between treated and control synapses (n = 5–7 coverslips each). D, Measuring the rate of vesicle reuse under repetitive stimulation, we observed that, whereas TTX-treated synapses showed significantly decreased reuse (or dye release) by 30–60 s compared with controls, PTX-treated synapses showed significantly faster reuse by the same time (n = 500–750 synapses from 5–7 coverslips for each time point per condition; points are considered significant and indicated by an asterisk if p < 10−8 with K–S test). Error bars indicate SE.
What then is the underlying change in synaptic vesicle trafficking that can account for alterations in synaptic depression in neocortical synapses? To address this question, we measured the rate of vesicle reavailability for release by monitoring FM dye loss after an initial round of dye uptake during 10 Hz, 10 s stimulation. Surprisingly, the rate of vesicle reavailability was significantly augmented after PTX treatment, although the amount of dye uptake during the 10 s stimulation did not change (Fig. 8C,D). This augmentation in vesicle reuse could account for the slower rate of synaptic depression observed after PTX treatment. In contrast, TTX treatment caused some decrease in the rate of vesicle reuse (Fig. 8D), which was not significantly reflected in the rate of synaptic depression detected electrophysiologically. Together, the rate of vesicle reuse in neocortical synapses responded robustly to changes in activity levels, whereas in hippocampal synapses the rate of vesicle mobilization was the main target for modification. In both cases, however, synaptic vesicle trafficking was modified in a direction to allow adaptation to an increased or decreased demand on neurotransmitter release imposed by the network activity.
The correspondence between neurotransmitter release kinetics and the rate of FM dye loss
The analysis presented in the previous sections is based on the premise that there is reliable correspondence between the kinetics of optical and electrophysiological measurements of presynaptic function. To test this correspondence, we compared the kinetics of the electrophysiologically detected synaptic depression to the optically monitored vesicle mobilization in hippocampal and neocortical synapses under all conditions. For this analysis, we aligned the average normalized integral of the electrophysiological current recordings and the FM dye destaining profiles obtained from the same culture. The integration of the current traces followed previously established procedures (Betz and Bewick, 1993; Sara et al., 2002). We scaled the fluorescence trace until it was aligned with the integrated current trace for the first 2 s of recording with the assumption that, at onset, all of the recycling vesicles contain FM dye as well as neurotransmitter. However, as stimulation progresses, recycled vesicles would not contain significant amounts of FM dye that could be detected as additional destaining; in contrast, the same vesicles would be refilled with neurotransmitter after endocytosis, which could then give rise to additional synaptic responses. This difference between the two reporters of vesicle fusion results in a deviation between the kinetics of FM dye destaining and neurotransmitter release at the time when recycled vesicles start to be reused (Betz and Bewick, 1992, 1993). In the case of hippocampal cultures, the first 30 s of fluorescent dye loss and electrophysiological recordings obtained during 10 Hz stimulation perfectly matched for all three conditions (Fig. 9A,C,E). This finding concurs with the premise that hippocampal synapses predominantly adjust synaptic vesicle mobilization rate to accommodate to changes in ambient activity levels. For neocortical synapses, we also detected a significant agreement between the time course of the optical and electrical signals (Fig. 9B,D,F). Under all conditions, the optical and electrical traces diverged only after 20 s, and there was no significant divergence after TTX treatment for 30 s (Fig. 9D). This observation indicates that, overall, there is significant correspondence between the two measures of synaptic transmission. In neocortical synapses, there was some divergence after 20 s under control as well as PTX treatment conditions; however, these differences were not as dramatic as seen in the rapid FM dye loading–unloading paradigm shown in Figure 8. Clearly, in cultures, FM dye loading–unloading paradigms are more sensitive methods to monitor vesicle reuse. This is mainly because in a culture preparation it is difficult to ensure a one-to-one match between the origins of optical and electrical signals as in neuromuscular junction preparations. In addition, the comparative method presents a level of arbitrariness during proper alignment and scaling of the electrical and optical signals, which may alter the estimate of the reuse time course. Specifically, the difference in vesicle reuse detected from the FM dye loading–unloading paradigm (Fig. 8D) emerges at a time point (within the first 2 s) when we needed to assume equal alignment of electrical and optical signals to be able to scale and compare their kinetics. The need for this rather arbitrary assumption for the alignment of the two signals may lead to the discrepancy seen in their estimates for the onset of synaptic vesicle reuse (for a detailed discussion, see Sara et al., 2002).
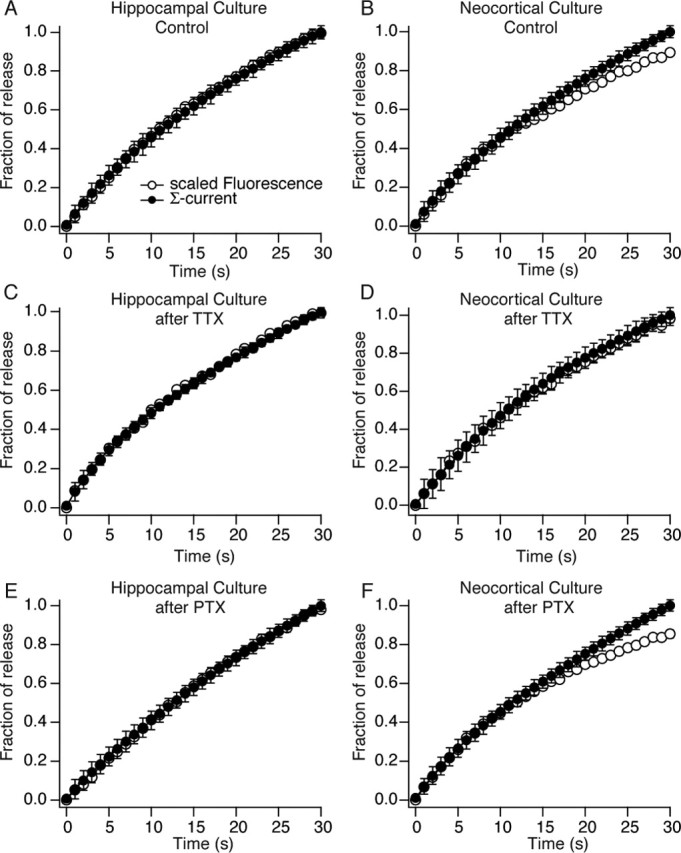
Comparison of FM dye destaining kinetics to neurotransmitter release in hippocampal and neocortical synapses. A, B, Comparison of the cumulative integral of synaptic current (filled circles) to scaled kinetics of fluorescence loss (open circles) from FM2-10-loaded synapses in hippocampal (A) and neocortical (B) cultures. Open circles represent average destaining kinetics scaled with the assumption that both electrophysiological and optical readout of exocytosis originate from the same pool of vesicles. C–F, The same analysis repeated after 48 h of treatment with TTX to block background network activity (C, D) and after 48 h of treatment with PTX to augment background network activity (E, F). Error bars indicate SE.
Properties of background network activity after treatments
Finally, we characterized the properties of the background network activity (shown in Figs. 3, 4) after TTX and PTX treatments in the two culture preparations. After 48 h, voltage-clamp experiments in hippocampal neurons revealed a PTX-dependent decrease in the frequency of background activity from 6.57 ± 0.7 to 0.25 ± 0.12 Hz (p < 0.001; n = 5), whereas TTX treatment did not cause a significant change (5.46 ± 1.37 Hz; p = 0.50; n = 5) (measurements were performed after drug washout). Current-clamp experiments also showed a decrease in action potential firing frequency in response to PTX treatment (down to 0.13 ± 0.12 from 0.50 ± 0.22 Hz; n = 5), although this decrease was short of statistical significance (p = 0.16). TTX treatment, however, did not cause a substantial change in action potential firing (0.44 ± 0.20 Hz; p = 0.93; n = 5). In neocortical cultures, TTX treatment increased the frequency of network activity from 0.49 ± 0.13 to 1.84 ± 0.34 Hz (p < 0.01; n = 7) (accordingly, action potential firing frequency increased from 0.49 ± 0.17 to 1.43 ± 0.58; p = 0.17; n = 5), and PTX treatment slightly decreased the activity to 0.13 ± 0.04 Hz (p < 0.05; n = 6) (action potential firing decreased to 0. 15 ± 0.10 Hz; p = 0.18; n = 5) (for sample traces, see supplemental Fig. 2, available at www.jneurosci.org as supplemental material). Amplitudes of individual synaptic events detected under voltage-clamp conditions were not significantly affected by the treatments (data not shown). As stated before, we also did not detect significant changes in the amplitudes of evoked synaptic responses after TTX and PTX treatments in both culture preparations (Figs. 5C, 7C). Previous studies have reported an increase in the amplitudes of miniature postsynaptic currents after chronic silencing of background activity (O’Brien et al., 1998; Turrigiano et al., 1998; Thiagarajan et al., 2005) (but see Harms and Craig, 2005). Our findings suggest that these alterations in spontaneous unitary events may not be reproducibly reflected in evoked neurotransmission. In a recent study, Wierenga and colleagues have also detected a substantial increase in evoked response amplitudes in young cortical cultures after chronic TTX treatment (Wierenga et al., 2005). However, our experimental conditions were different from the ones used by their study in at least two aspects. First, we used QX-314 in the pipette solution to block Na+ channels internally, which was reported to have a significant effect on amplification of dendritic synaptic responses especially after TTX treatment (Wierenga et al., 2005). Second, all of our experiments were performed on mature cultures (>14 d in vitro) to decrease variations caused by synaptic immaturity. In addition, the alterations in the background activity could not be attributed to changes in the balance of inhibition and excitation, because the ratio of EPSCs (recorded in the presence of picrotoxin) and IPSCs (recorded in the presence of CNQX) to overall evoked transmission was not significantly affected by these treatments in the two cultures [EPSC/IPSC: neocortical (control; n = 7), 1.20 ± 0.30; neocortical (TTX; n = 6), 1.05 ± 0.36; neocortical (PTX; n = 6), 1.55 ± 0.29; hippocampal (control; n = 10), 1.19 ± 0.23; hippocampal (TTX; n = 10), 0.90 ± 0.19; hippocampal (PTX; n = 13), 1.20 ± 0.17] (for sample traces, see supplemental Fig. 3, available at www.jneurosci.org as supplemental material).
Here, it is interesting to note that the modifications in background network activity occurred in a homeostatic direction countering the changes in activity levels. This is in striking contrast to the behavior of the kinetics of synaptic depression seen in other experiments. A plausible explanation to this apparent paradox may come from the recent experiments reported by Lau and Bi (2005), which demonstrated that to a large extent the background network activity in dissociated hippocampal cultures is governed by asynchronous neurotransmitter release, which may react differently to alterations in background activity levels. In contrast, synaptic depression in our experiments is driven by field stimulation, which mostly drives synchronous fusion events. It is plausible to envision that high-frequency repetitive stimulation driven by field stimulation leads to rapid pool depletion and thus limits the contribution of asynchronous release. In contrast, lower frequency stimulation driven by action potentials may provide an ample time window for asynchronous release during the relatively longer interstimulation intervals. Together with the finding that the two forms of fusion compete for the same pool of vesicles (Otsu et al., 2004), the increase in one form of release may be countered by a decrease in the other. An alternative, not necessarily mutually exclusive, mechanism may involve a homeostatic change in cellular excitability, which may affect the network activity more strongly than the release evoked by field stimulation. Field stimulations typically directly depolarize nerve terminals, and thus their effect does not strictly reflect voltage-gated Na+ channel properties (Desai et al., 1999). These possibilities will clearly require additional experiments to be tested rigorously.
Discussion
In this study, we used electrophysiology in combination with uptake and release of styryl dyes to monitor synaptic depression and vesicle recycling in dissociated hippocampal and neocortical cultures. This setting allowed us to examine the role of network activity in the regulation of synaptic release dynamics. Our results suggest that network activity is a critical regulator of synaptic vesicle trafficking in individual synapses. Synapses from these two brain regions used different pathways to sustain release under repetitive stimulation. During moderate stimulation, hippocampal synapses relied on vesicle mobilization from the reserve pool, whereas neocortical synapses depended on reuse of previously exocytosed vesicles. In response to chronic alterations in network activity, both hippocampal and neocortical synapses adjusted their synaptic vesicle trafficking kinetics and resulting synaptic response dynamics to meet the demand. In hippocampal cultures, the main target of regulation was the rate of synaptic vesicle mobilization, whereas in neocortical synapses synaptic vesicle reuse rate was the most amenable to regulation by activity. Thus, different synapses not only rely on different pathways for maintaining neurotransmitter release but they also use different strategies to adapt and respond to alterations in network activity levels.
In these experiments, the chronic activity-dependent changes in electrophysiological and optical measures mostly followed each other; however, there were also apparent inconsistencies between the two sets of data. For instance, in neocortical synapses, TTX treatment resulted in a significant reduction in the rate of vesicle reuse (Fig. 8D), which was not reflected in the electrophysiological readout of synaptic depression (Fig. 7B). The comparison of synaptic electrophysiological recordings and optical measures of vesicle recycling has been a valuable tool in dissecting out the relationship between the synaptic vesicle trafficking and neurotransmitter release (Betz and Bewick, 1992, 1993; Pyle et al., 2000; Stevens and Williams, 2000; Sara et al., 2002). However, this approach has caveats, which partly stem from the distinct nature of the two measures including the slow time course of optical recordings as well as their inability to distinguish excitatory versus inhibitory synapses. Excitatory and inhibitory neurotransmitter release may respond differently to chronic changes in activity (Moulder et al., 2004). The questions related to distinctions between the plasticity of vesicle trafficking in excitatory and inhibitory synaptic terminals can be better addressed by development of new optical tools that can specifically label the two synapse populations (Li et al., 2005). Also, it is important to acknowledge that synaptic depression occurs because of multiple factors such as Ca2+ channel inactivation (Xu and Wu, 2005) and changes in vesicle release probability (Moulder and Mennerick, 2005); thus, alterations in its time course cannot be solely attributed to vesicle depletion (Zucker and Regehr, 2002). Despite these caveats, our results show clear alterations in synaptic vesicle trafficking, which to a significant extent parallel changes in synaptic depression. Therefore, from our analysis, we cannot conclude that the changes we see in synaptic depression are exclusively caused by alterations in synaptic vesicle trafficking, but we can draw attention to parallels between the two processes.
Our results implicate alterations in molecular composition of the vesicle recycling machinery as a potential factor underlying these activity-dependent modifications in synaptic vesicle trafficking. We view alternative mechanisms, such as changes in the distribution and size of synaptic vesicle pools or rapid Ca2+ signaling, not as major contributors to our observations for the following reasons. First, the sizes of the recycling vesicle pool and the readily releasable pool, measured by both electrophysiological and optical readouts, were not significantly altered after the treatments that gave rise to changes in synaptic vesicle dynamics. The only detectable change was a decrease in readily releasable pool size after PTX treatment in hippocampal synapses, which did not reach significance. We cannot, however, exclude changes that may influence very short-term synaptic plasticity such as modification of vesicle release probability in response to action potentials (without a major change in pool sizes), which would be below the resolution of our optical recordings (Murthy et al., 2001; Moulder and Mennerick, 2005). The absence of substantial alterations in synaptic vesicle pool sizes is also consistent with the premise that functional differences in synaptic release dynamics do not necessarily arise from overt distinctions in synapse morphology (Xu-Friedman et al., 2001). Second, calcium dynamics in presynaptic terminals and calcium sensitivity of neurotransmitter release is unlikely to have changed significantly, because such a modification would have been reflected in initial synaptic response amplitudes. Molecular changes, in contrast, may involve the numerous targets in the presynaptic terminals including synaptotagmin 7, which can be regulated by global changes in activity (Piedras-Renteria et al., 2004), and different splice variants can alter vesicle trafficking pathways without significant alteration in kinetics of exocytosis or synapse morphology (Virmani et al., 2003). Chronic changes in the abundance of other critical synaptic vesicle recycling proteins or the efficacy of signaling cascades such as phosphoinositide turnover may also contribute to the activity-dependent modifications in vesicle trafficking (Micheva et al., 2003; Murthy and De Camilli, 2003).
As stated above, the changes we detected in synaptic depression and synaptic vesicle recycling were adaptive rather than homeostatic because they followed the direction of the manipulation and thus acted to reinforce the demand imposed on neurotransmitter release by the ambient activity. Although in the two culture systems activity regulates distinct vesicle trafficking pathways, the outcome of the regulation appears to be similar. In both systems, activity exerts positive-feedback regulation; thus, it reinforces the tonic neurotransmitter release either by increasing vesicle reuse or mobilization. In contrast, reduction in activity decreases the tonic phase and makes the phasic response decay faster, thus reducing overall neurotransmitter release. However, the initial set point of neurotransmitter release rate in both systems appears to be opposite. In previous studies, chronic changes in network activity have been shown to alter excitability of neurons as well as synaptic strength (Burrone et al., 2002; Turrigiano and Nelson, 2004). In accordance with these previous observations, in our experiments, the frequency of the spontaneous background activity detected after 48 h of drug treatment was altered in a homeostatic manner. In hippocampal neurons, PTX treatment resulted in a decrease in the frequency of the background activity, whereas TTX treatment did not cause a significant change. In neocortical cultures, TTX treatment increased the frequency of network activity and PTX treatment only slightly decreased the activity frequency. Amplitudes of individual events triggered by the network activity were not significantly affected by the treatments.
Our observations in mammalian CNS nerve terminals bear some resemblance to previous studies in crayfish neuromuscular junction and synaptic junctions onto rat slow- and fast-twitch muscle fibers. In both systems, the synaptic release dynamics could be converted from tonic to phasic (or vice versa) in parallel with chronic changes in activity (Lnenicka and Atwood, 1985, 1989; Reid et al., 2003). However, the differences in presynaptic machinery between tonic or phasic release was not linked to synaptic vesicle dynamics but rather to vesicle pool sizes, Ca2+ dependence of release, and the presynaptic glutamate synthesis (Shupliakov et al., 1995; Msghina et al., 1999; Quigley et al., 1999; Reid et al., 1999). In contrast, in the systems we analyzed here, the regulatory mechanisms targeted vesicle recycling kinetics. This strategy may be dictated by the small size of the vesicle pools available to central synapses, which makes alterations in vesicle dynamics a more feasible alternative to substantial modifications in synaptic vesicle pools (Harata et al., 2001). Together, the results we present here add a new dimension to presynaptic physiology of central synapses and reveal that the demand network activity imposes on neurotransmitter release acts as a potent endogenous regulator of synaptic vesicle recycling.
Footnotes
*T.V. and D.A. contributed equally to this work.
This work was supported by National Institute of Mental Health Grant MH068437 (E.T.K.). We thank C. Chung, J. Gibson, K. Huber, and L. Monteggia for helpful discussions and for critically reading this manuscript.
References
- Abbott LF, Regehr WG (2004). Synaptic computation. Nature 431:796–803. [DOI] [PubMed] [Google Scholar]
- Betz WJ, Bewick GS (1992). Optical analysis of synaptic vesicle recycling at the frog neuromuscular junction. Science 255:200–203. [DOI] [PubMed] [Google Scholar]
- Betz WJ, Bewick GS (1993). Optical monitoring of transmitter release and synaptic vesicle recycling at the frog neuromuscular junction. J Physiol (Lond) 460:287–309. [DOI] [PMC free article] [PubMed] [Google Scholar]
- Bewick GS (2003). Maintenance of transmitter release from neuromuscular junctions with different patterns of usage “in vivo.”. J Neurocytol 32:473–487. [DOI] [PubMed] [Google Scholar]
- Burrone J, O’Byrne M, Murthy VN (2002). Multiple forms of synaptic plasticity triggered by selective suppression of activity in individual neurons. Nature 420:414–418. [DOI] [PubMed] [Google Scholar]
- Desai NS, Rutherford LC, Turrigiano GG (1999). Plasticity in the intrinsic excitability of cortical pyramidal neurons. Nat Neurosci 2:515–520. [DOI] [PubMed] [Google Scholar]
- Di Paolo G, Sankaranarayanan S, Wenk MR, Daniell L, Perucco E, Caldarone BJ, Flavell R, Picciotto MR, Ryan TA, Cremona O, De Camilli P (2002). Decreased synaptic vesicle recycling efficiency and cognitive deficits in amphiphysin 1 knockout mice. Neuron 33:789–804. [DOI] [PubMed] [Google Scholar]
- Dittman JS, Kreitzer AC, Regehr WG (2000). Interplay between facilitation, depression, and residual calcium at three presynaptic terminals. J Neurosci 20:1374–1385. [DOI] [PMC free article] [PubMed] [Google Scholar]
- Dobrunz LE, Stevens CF (1997). Heterogeneity of release probability, facilitation, and depletion at central synapses. Neuron 18:995–1008. [DOI] [PubMed] [Google Scholar]
- Fernandez-Alfonso T, Ryan TA (2004). The kinetics of synaptic vesicle pool depletion at CNS synaptic terminals. Neuron 41:943–953. [DOI] [PubMed] [Google Scholar]
- Harata N, Pyle JL, Aravanis AM, Mozhayeva M, Kavalali ET, Tsien RW (2001). Limited numbers of recycling vesicles in small CNS nerve terminals: implications for neural signaling and vesicular cycling. Trends Neurosci 24:637–643. [DOI] [PubMed] [Google Scholar]
- Harms KJ, Craig AM (2005). Synapse composition and organization following chronic activity blockade in cultured hippocampal neurons. J Comp Neurol 490:72–84. [DOI] [PubMed] [Google Scholar]
- Harris KM, Sultan P (1995). Variation in the number, location and size of synaptic vesicles provides an anatomical basis for the nonuniform probability of release at hippocampal CA1 synapses. Neuropharmacology 34:1387–1395. [DOI] [PubMed] [Google Scholar]
- Klingauf J, Kavalali ET, Tsien RW (1998). Kinetics and regulation of fast endocytosis at hippocampal synapses. Nature 394:581–585. [DOI] [PubMed] [Google Scholar]
- Lau PM, Bi GQ (2005). Synaptic mechanisms of persistent reverberatory activity in neuronal networks. Proc Natl Acad Sci USA 102:10333–10338. [DOI] [PMC free article] [PubMed] [Google Scholar]
- Li Z, Burrone J, Tyler WJ, Hartman KN, Albeanu DF, Murthy VN (2005). Synaptic vesicle recycling studied in transgenic mice expressing synaptopHluorin. Proc Natl Acad Sci USA 102:6131–6136. [DOI] [PMC free article] [PubMed] [Google Scholar]
- Lnenicka GA, Atwood HL (1985). Age-dependent long-term adaptation of crayfish phasic motor axon synapses to altered activity. J Neurosci 5:459–467. [DOI] [PMC free article] [PubMed] [Google Scholar]
- Lnenicka GA, Atwood HL (1989). Impulse activity of a crayfish motoneuron regulated its neuromuscular synaptic properties. J Neurophysiol 61:91–96. [DOI] [PubMed] [Google Scholar]
- Lnenicka GA, Atwood HL, Marin L (1986). Morphological transformation of synaptic terminals of a phasic motoneuron by long-term tonic stimulation. J Neurosci 6:2252–2258. [DOI] [PMC free article] [PubMed] [Google Scholar]
- Mackenzie PJ, Kenner GS, Prange O, Shayan H, Umemiya M, Murphy TH (1999). Ultrastructural correlates of quantal synaptic function at single CNS synapses. J Neurosci 19:1-7RC13. [DOI] [PMC free article] [PubMed] [Google Scholar]
- Micheva KD, Buchanan J, Holz RW, Smith SJ (2003). Retrograde regulation of synaptic vesicle endocytosis and recycling. Nat Neurosci 6:925–932. [DOI] [PubMed] [Google Scholar]
- Moulder KL, Mennerick S (2005). Reluctant vesicles contribute to the total readily releasable pool in glutamatergic hippocampal neurons. J Neurosci 25:3842–3850. [DOI] [PMC free article] [PubMed] [Google Scholar]
- Moulder KL, Meeks JP, Shute AA, Hamilton CK, de Erausquin G, Mennerick S (2004). Plastic elimination of functional glutamate release sites by depolarization. Neuron 42:423–435. [DOI] [PubMed] [Google Scholar]
- Mozhayeva MG, Sara Y, Liu X, Kavalali ET (2002). Development of vesicle pools during maturation of hippocampal synapses. J Neurosci 22:654–665. [DOI] [PMC free article] [PubMed] [Google Scholar]
- Msghina M, Millar AG, Charlton MP, Govind CK, Atwood HL (1999). Calcium entry related to active zones and differences in transmitter release at phasic and tonic synapses. J Neurosci 19:8419–8434. [DOI] [PMC free article] [PubMed] [Google Scholar]
- Murthy VN, De Camilli P (2003). Cell biology of the presynaptic terminal. Annu Rev Neurosci 26:701–728. [DOI] [PubMed] [Google Scholar]
- Murthy VN, Schikorski T, Stevens CF, Zhu Y (2001). Inactivity produces increases in neurotransmitter release and synapse size. Neuron 32:673–682. [DOI] [PubMed] [Google Scholar]
- O’Brien RJ, Kamboj S, Ehlers MD, Rosen KR, Fischbach GD, Huganir RL (1998). Activity-dependent modulation of synaptic AMPA receptor accumulation. Neuron 21:1067–1078. [DOI] [PubMed] [Google Scholar]
- Otsu Y, Shahrezaei V, Li B, Raymond LA, Delaney KR, Murphy TH (2004). Competition between phasic and asynchronous release for recovered synaptic vesicles at developing hippocampal autaptic synapses. J Neurosci 24:420–433. [DOI] [PMC free article] [PubMed] [Google Scholar]
- Petersen CC (2002). Short-term dynamics of synaptic transmission within the excitatory neuronal network of rat layer 4 barrel cortex. J Neurophysiol 87:2904–2914. [DOI] [PubMed] [Google Scholar]
- Piedras-Renteria ES, Pyle JL, Diehn M, Glickfeld LL, Harata NC, Cao Y, Kavalali ET, Brown PO, Tsien RW (2004). Presynaptic homeostasis at CNS nerve terminals compensates for lack of a key Ca2+ entry pathway. Proc Natl Acad Sci USA 101:3609–3614. [DOI] [PMC free article] [PubMed] [Google Scholar]
- Pyle JL, Kavalali ET, Piedras-Renteria ES, Tsien RW (2000). Rapid reuse of readily releasable pool vesicles at hippocampal synapses. Neuron 28:221–231. [DOI] [PubMed] [Google Scholar]
- Quigley PA, Msghina M, Govind CK, Atwood HL (1999). Visible evidence for differences in synaptic effectiveness with activity-dependent vesicular uptake and release of FM1-43. J Neurophysiol 81:356–370. [DOI] [PubMed] [Google Scholar]
- Reid B, Slater CR, Bewick GS (1999). Synaptic vesicle dynamics in rat fast and slow motor nerve terminals. J Neurosci 19:2511–2521. [DOI] [PMC free article] [PubMed] [Google Scholar]
- Reid B, Martinov VN, Nja A, Lomo T, Bewick GS (2003). Activity-dependent plasticity of transmitter release from nerve terminals in rat fast and slow muscles. J Neurosci 23:9340–9348. [DOI] [PMC free article] [PubMed] [Google Scholar]
- Reig R, Gallego R, Nowak LG, Sanchez-Vives MV (2006). Impact of cortical network activity on short-term synaptic depression. Cereb Cortex in press. [DOI] [PubMed]
- Rizzoli SO, Betz WJ (2005). Synaptic vesicle pools. Nat Rev Neurosci 6:57–69. [DOI] [PubMed] [Google Scholar]
- Ryan TA, Smith SJ (1995). Vesicle pool mobilization during action potential firing at hippocampal synapses. Neuron 14:983–989. [DOI] [PubMed] [Google Scholar]
- Sankaranarayanan S, Ryan TA (2001). Calcium accelerates endocytosis of vSNAREs at hippocampal synapses. Nat Neurosci 4:129–136. [DOI] [PubMed] [Google Scholar]
- Sara Y, Mozhayeva MG, Liu X, Kavalali ET (2002). Fast vesicle recycling supports neurotransmission during sustained stimulation at hippocampal synapses. J Neurosci 22:1608–1617. [DOI] [PMC free article] [PubMed] [Google Scholar]
- Schikorski T, Stevens CF (1997). Quantitative ultrastructural analysis of hippocampal excitatory synapses. J Neurosci 17:5858–5867. [DOI] [PMC free article] [PubMed] [Google Scholar]
- Shupliakov O, Atwood HL, Ottersen OP, Storm-Mathisen J, Brodin L (1995). Presynaptic glutamate levels in tonic and phasic motor axons correlate with properties of synaptic release. J Neurosci 15:7168–7180. [DOI] [PMC free article] [PubMed] [Google Scholar]
- Stevens CF, Williams JH (2000). “Kiss and run” exocytosis at hippocampal synapses. Proc Natl Acad Sci USA 97:12828–12833. [DOI] [PMC free article] [PubMed] [Google Scholar]
- Thiagarajan TC, Lindskog M, Tsien RW (2005). Adaptation to synaptic inactivity in hippocampal neurons. Neuron 47:725–737. [DOI] [PubMed] [Google Scholar]
- Turrigiano GG, Nelson SB (2004). Homeostatic plasticity in the developing nervous system. Nat Rev Neurosci 5:97–107. [DOI] [PubMed] [Google Scholar]
- Turrigiano GG, Leslie KR, Desai NS, Rutherford LC, Nelson SB (1998). Activity-dependent scaling of quantal amplitude in neocortical neurons. Nature 391:892–896. [DOI] [PubMed] [Google Scholar]
- Virmani T, Han W, Liu X, Sudhof TC, Kavalali ET (2003). Synaptotagmin 7 splice variants differentially regulate synaptic vesicle recycling. EMBO J 22:5347–5357. [DOI] [PMC free article] [PubMed] [Google Scholar]
- Wierenga CJ, Ibata K, Turrigiano GG (2005). Postsynaptic expression of homeostatic plasticity at neocortical synapses. J Neurosci 25:2895–2905. [DOI] [PMC free article] [PubMed] [Google Scholar]
- Wu LG (2004). Kinetic regulation of vesicle endocytosis at synapses. Trends Neurosci 27:548–554. [DOI] [PubMed] [Google Scholar]
- Xu J, Wu LG (2005). The decrease in the presynaptic calcium current is a major cause of short-term depression at a calyx-type synapse. Neuron 46:633–645. [DOI] [PubMed] [Google Scholar]
- Xu-Friedman MA, Harris KM, Regehr WG (2001). Three-dimensional comparison of ultrastructural characteristics at depressing and facilitating synapses onto cerebellar Purkinje cells. J Neurosci 21:6666–6672. [DOI] [PMC free article] [PubMed] [Google Scholar]
- Zucker RS, Regehr WG (2002). Short-term synaptic plasticity. Annu Rev Physiol 64:355–405. [DOI] [PubMed] [Google Scholar]