

Abstract
The nucleus isthmi pars parvocellularis (Ipc) is a midbrain cholinergic nucleus that shares reciprocal, topographic connections with the optic tectum (OT). Ipc neurons project to spatially restricted columns in the OT, contacting essentially all OT layers in a given column. Previous research characterizes the Ipc as a visual processor. We found that, in the barn owl, the Ipc responds to auditory as well as to visual stimuli. Auditory responses were tuned broadly for frequency, but sharply for spatial cues. We measured the tuning of Ipc units to binaural sound localization cues, including interaural timing differences (ITDs) and interaural level differences (ILDs). Units in the Ipc were tuned to specific values of both ITD and ILD and were organized systematically according to their ITD and ILD tuning, forming a map of space. The auditory space map aligned with the visual space map in the Ipc. These results demonstrate that the Ipc encodes the spatial location of objects, independent of stimulus modality. These findings, combined with the precise pattern of projections from the Ipc to the OT, suggest that the role of the Ipc is to regulate the sensitivity of OT neurons in a space-specific manner.
Keywords: optic tectum, superior colliculus, multimodal, target selection, winner-take-all, spatial attention
Introduction
The optic tectum (OT; superior colliculus in mammals) is critically involved in localizing objects in space and preparing orienting responses to these objects (Wurtz and Albano, 1980; Sparks, 1986). The nucleus isthmi is found in all classes of vertebrates (Wang, 2003). In birds, the isthmic complex includes at least three nuclei: pars parvocellularis (Ipc), pars magnocellularis (Imc), and pars semilunaris (SLu) (see Fig. 1A). The Ipc and SLu both contain high concentrations of cholinergic neurons (Sorenson et al., 1989; Medina and Reiner, 1994; Hellmann et al., 2001) and, together, are homologous to the parabigeminal nucleus (PBN) in mammals (Diamond et al., 1992).
Figure 1.

Identification of the Ipc by immunohistochemical properties. A, Schematic of a transverse section through the midbrain; inset indicates the level and plane of section. The location of the OT, Ipc, Imc, and SLu are indicated. The dotted square indicates the section of tissue displayed in B-D. B, Nissl stain of transverse midbrain section showing electrolytic lesion (arrow) made as electrode exited the Ipc. C, Transverse section reacted with an antibody to ChAT, which labeled cholinergic somata. D, Transverse section reacted with an antibody to GAD, which labeled GABAergic terminals.
The Ipc forms precise, reciprocal, topographic connections with the OT (Hunt et al., 1977; Gunturkun and Remy, 1990; Woodson et al., 1991; Medina and Reiner, 1994; Wang et al., 2006). It receives input from a particular class of OT neurons located mostly in layer 10b (Woodson et al., 1991; Wang et al., 2004, 2006), and sends brush-like axonal terminations that extend in a narrow column throughout essentially all OT layers (Hunt et al., 1977; Tombol et al., 1995; Wang et al., 2006). It also receives a descending input from the gaze-control area in the forebrain (Knudsen et al., 1995). Many Ipc neurons discharge in synchronized bursts of high-frequency action potentials, and these bursts have been shown to be responsible for similar bursts that appear in the superficial layers of the OT (Marin et al., 2005).
Previous research has characterized the Ipc as a visual processor (Wang, 2003). Across a wide range of species, neurons in the nucleus isthmi respond to visual stimuli [teleost fish (Northmore, 1991)] and have spatially restricted visual receptive fields (RFs) that are organized into a topographic map of visual space [cat (Sherk, 1978); frog (Gruberg and Lettvin, 1980; Wang et al., 1981); pigeon (Yan and Wang, 1986; Wang and Frost, 1991); salamander (Wiggers and Roth, 1991)].
Characterization of the Ipc as a visual processor may reflect the fact that the species studied previously all depend primarily on vision for localizing stimuli. We studied the Ipc in the barn owl, a nocturnal predator that uses both hearing and vision to localize prey, to test the hypothesis that the Ipc processes spatial information independent of modality. We found that Ipc neurons in the owl respond strongly to auditory as well as visual stimuli, are tuned sharply to sound localization cues, and are organized according to their tuning to these cues to form a map of auditory space. Moreover, the auditory space map is aligned with the visual space map in the Ipc. The data demonstrate that the information the Ipc provides to the OT is space specific, but not modality specific. These results, together with the distinctive pattern of anatomical connections between the OT and Ipc, suggest that a primary function of the Ipc is to mediate multimodal, space-specific modulations of OT neuronal sensitivity.
Materials and Methods
Animals and surgical procedures.
A total of 16 barn owls (Tyto alba) were used in this study. All experimental procedures and treatments were approved by the Stanford University Institutional Animal Care and Use Committee and the National Institutes of Health Guide for the Care and Use of Laboratory Animals.
To secure the head during electrophysiological experiments, a fastener was cemented to the skull. Owls were anesthetized with 1% halothane mixed with nitrous oxide and oxygen (45%/55%). The skull was exposed and cleaned, and a small threaded plate was attached to the front of the skull with dental acrylic. The skin was then sutured, cleaned with betadine, and treated with lidocaine. The owl recovered in a warm box and was then returned to a large flight aviary where it was housed with other owls.
Electrophysiological recordings.
For electrophysiological experiments, the owl was anesthetized with 1% halothane mixed with nitrous oxide and oxygen (45%/55%) and suspended in a restraining tube in prone position. The head was fixed in position so that the visual axes were aligned with the origin of a calibrated tangent screen (the eyes of the owl are essentially stationary in the head). A craniotomy was opened above the caudal midbrain using stereotaxic coordinates. The use of halothane was then discontinued, and nitrous oxide and oxygen were administered continuously throughout the experiment.
Recordings were made with tungsten microelectrodes (10–15 MΩ at 1 kHz; FHC, Bowdoinham, ME or A-M Systems, Carlsborg, WA). The signal was amplified (RA-16; Tucker Davis Technologies, Alachua, FL) and a level discriminator was used to select the largest units for analysis. Electrode penetrations were made dorsoventrally with the electrode tilted 5° lateral to the sagittal plane to minimize damage to vasculature. To calibrate its position in the brain, the electrode was moved to the representation of contralateral 30–40° azimuth and −40° elevation in the OT space map. The Ipc was targeted by moving the electrode 1–2 mm medial from this position. The electrode passed through the inferior colliculus, a fiber tract, and then entered the Ipc at a depth of 1.3–2.0 cm relative to the surface of the forebrain. Ipc units exhibited a distinctive bursting firing pattern which was used to determine when the electrode entered and exited the Ipc. In a subset of experiments, lesions were made (cathodal current, 5μA, 10 s) as the electrode exited the Ipc (see Fig. 1B).
Visual stimuli.
Stimulus generation and data acquisition were controlled by a customized Matlab program (MathWorks, Natick, MA; program written by J. Bergan) interfacing with signal processing hardware (RA-16 and RP-2; Tucker Davis Technologies). The visual stimulus was a computer-generated dot, projected to various locations on a calibrated screen located 1 m in front of the bird. At each site, a white dot against a black background (positive-contrast) was presented at a series of azimuths (1° diameter dot; stationary or sweeping vertically; duration, 300–600 ms; elevation, best elevation; ISI, 1.2–1.5 s), and then at a series of elevations [1° diameter dot; stationary or sweeping horizontally; duration, 300–600 ms; azimuth, best azimuth; interstimulus interval (ISI), 1.2–1.5 s]. The stimuli were randomly interleaved in all tests.
Auditory stimuli.
Auditory stimuli were presented dichotically through earphones (ED-1941; Knowles Electronics, Itasca, IL) coupled to damping assemblies (BF-1743; Knowles Electronics) placed in the ear canals ∼5 mm from the tympanic membrane. The acoustic spectra were flat and equalized across the earphones to within ±2 dB amplitude and ±2 μs over a frequency range of 2–10 kHz.
The primary cue used by barn owls to localize the azimuth of sounds is interaural timing difference (ITD), the sound timing difference between the ears. The primary cue used by barn owls to localize the elevation of high-frequency (>4 kHz) sounds is interaural level differences (ILD), the sound level difference between the vertically asymmetrical ears (Payne, 1971; Coles and Guppy, 1988; Keller et al., 1998). At each site, broadband noise bursts were presented at a series of ITDs (level, 20–30 dB above threshold; frequency range, 2–10 kHz; rise/fall time, 0 ms; duration, 100 ms; ILD, best ILD; ISI, 1.0–1.2 s), and then at a series of ILDs (level, 20–30 dB above threshold; frequency range, 2–10 kHz; rise/fall time, 0 ms; duration, 100 ms; ITD, best ITD; ISI, 1.0–1.2 s). Tone bursts were then presented at a series of frequencies (level, 20–30 dB above threshold; rise/fall time, 5 ms; duration, 100 ms; ITD, best ITD; ILD, best ILD; ISI, 1.0–1.2 s). The stimuli were randomly interleaved in all tests.
Analysis of neural responses.
No selection criteria were applied to recording sites; data from all sites were collected and included in the results. The response to each parameter value in a tuning curve was calculated in the following way. First, the poststimulus response to each parameter value was quantified as the number of spikes occurring from the time of stimulus onset until either the time of stimulus offset or a maximum elapsed time (100 ms for auditory stimuli and 450 ms for visual stimuli), whichever was shorter. Then, an average baseline firing rate was calculated as the number of spikes before stimulus onset, averaged across all conditions, and normalized in duration to the poststimulus time window. The average baseline firing rate was subtracted from the poststimulus response to yield the response to each parameter value.
To test whether a site was tuned for a given parameter, a one-way ANOVA was run on the response to each parameter value. If the ANOVA showed a significant (p < 0.05) difference between the responses to the parameter values, the site was classified as tuned for that parameter. For sites that were tuned, the best value was quantified using the weighted average of all responses >50% of the maximum response (half-max). The range of values that elicited responses above half-max was the width at half-max (half-width) for that parameter. At some sites, the half-width could not be determined because responses did not drop below half-max on one or both sides of the tuning curve for the range of stimuli tested.
Latency analysis.
The latency of responses was assessed at a subset of sites with 30–50 repetitions of a 500 ms stationary auditory or visual stimulus presented at the preferred location. These stimuli were interleaved with stimuli at nonpreferred locations to prevent response habituation.
Functional topography.
The functional topography of the Ipc was assessed by correlating auditory and visual spatial tuning with electrode position in the Ipc. The effect of dorsoventral electrode position was assessed using sites recorded at different dorsoventral depths in the same electrode penetration. The effect of rostrocaudal electrode position was assessed using sites taken from electrode penetrations at different rostrocaudal positions. When more than one site was sampled in a penetration, the mean value for all sites recorded in that penetration was used to represent that rostrocaudal position.
Injections of anatomical tracers.
Anatomical tracers were injected into the OT and Ipc. To make an injection electrode, borosilicate glass (1 mm) was pulled on a vertical puller and the electrode tip was broken to a diameter of 15–20 μm. The electrode was filled with one of the tracers and lowered to the target site. Multiunit activity was recorded through the electrode using a silver wire. The retrograde tracer Fluoro-gold (10% in dH2O; Fluorochrome, Denver, CO) was iontophoresed by passing +5 μA from a constant current source (Grass stimulator; Grass Technologies, West Warwick, RI) for 10 min. The bidirectional tracers Fluoro-ruby (dextran tetramethylrhodamine; D1817; 10% in dH2O; Invitrogen Carlsbad, CA) and Alexa Fluor 488 (dextran; D22910; 10% in dH2O; Invitrogen) were iontophoresed with +6μA on a 50% duty cycle (10 s on/off) for 12 min. The bidirectional tracer biotinylated dextran amine (10% in KCl; Invitrogen) was iontophoresed with +3 μA on a 50% duty cycle (7 s on/off) for 10 min. After the injection, the electrode was left in place for 10 min, and then slowly removed from the brain.
Histology.
After 7–14 d of survival, the owl was deeply anesthetized with 5% halothane mixed with nitrous oxide and oxygen (45%/55%). The thoracic cavity was opened and Nembutal (0.5 cc) and heparin (0.3 cc) were injected into the left ventricle of the heart. For tracer injections, the owl was perfused transcardially with 300–500 ml of 0.1 m phosphate buffer (PB) containing lidocaine (3 ml/l), followed by 500 ml of 4% paraformaldehyde in PB. For lesion recovery, the fixative was 3.7% formaldehyde in PB. The brain was removed and sunk in 30% sucrose in fixative for 2 d before sectioning.
The brain was sliced in 40 μm frozen sections. Sections from electrolytically lesioned tissue were mounted onto slides and stained with cresyl violet. Sections from tissue that had been injected with fluorescent tracers were mounted onto slides and coverslipped using a ProLong Antifade kit (P-7481; Invitrogen) for visualization under a fluorescent microscope. Other sections were either reacted with an antibody to choline acetyltransferase (ChAT; the synthetic enzyme for acetylcholine, ACh) or with an antibody to glutamic acid decarboxylase (GAD; the synthetic enzyme for GABA). The ChAT antibody was kindly provided by Dr. Miles Epstein (University of Wisconsin, Madison, WI) and the GAD antibody by Dr. David Calkins (University of Rochester, Rochester, NY).
To visualize antibody labeling, an avidin-biotin-DAB reaction was used as follows. Endogenous peroxidases were quenched in 10% methanol and 1% H2O2 in PB for 30 min. Sections were rinsed in PB, then blocked for 1 h in serum (1% normal serum, 0.75% Triton X-100 in PB). Sections were rinsed in PB, and incubated in the primary antibody solution (1:500 chicken anti-ChAT or 1:2500 rabbit anti-GAD) in 1% normal serum, 0.1% Triton X-100 in PB at room temperature overnight. The next day, sections were rinsed in PB and incubated in biotinylated secondary antibody (1:500; BA-1000; Vector Laboratories, Burlingame, CA) for 1 h at room temperature. After several washes, sections were incubated sequentially in solutions of avidin and biotin-peroxidase complex (PK-6100; Vector Laboratories) for 1 h each. Sections were rinsed in PB and Tris-imidazole buffer, developed for 10–20 min in 0.05% DAB and 0.003% H2O2 in Tris-imidazole buffer, mounted on Superfrost Plus slides, dehydrated, cleared in xylenes, and coverslipped with Permount.
Results
Identification of the Ipc
The Ipc was identified on the basis of its immunohistochemical properties and anatomical connections (see Introduction). Somata in the Ipc were labeled densely for ChAT (Fig. 1C) and processes in the Ipc were labeled for GAD (Fig. 1D). The Ipc and OT shared precise, reciprocal connections. Bidirectional tracer injections into the OT labeled specific Ipc regions that were restricted both in the rostrocaudal (Fig. 2A) and dorsoventral axes (Fig. 2B). Each labeled region of the Ipc contained both retrogradely labeled somata and anterogradely labeled processes (Fig. 2A,B). In addition, bidirectional tracer injections into the Ipc labeled restricted regions of the OT. The anterograde projection from the Ipc to the OT displayed characteristic brush-like axonal terminations that extended in a narrow column throughout layers 2–13, with exceptionally dense terminations in the more superficial layers of the OT (Fig. 2C,D). In the same OT column, retrogradely labeled somata were located primarily in layer 10 (Fig. 2C).
Figure 2.
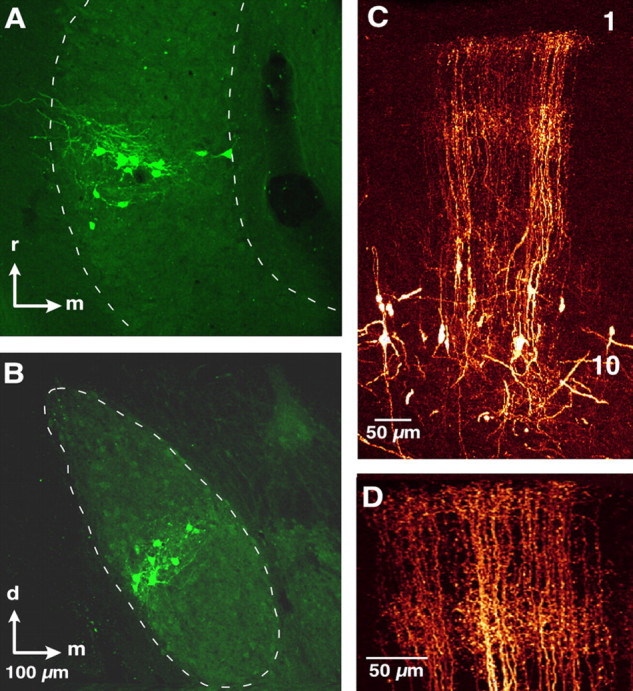
The Ipc and OT share reciprocal topographic connections. A, B, Injection of Alexa Fluor 488 bidirectional tracer into the OT labeled somata retrogradely and processes anterogradely in the same, restricted portion of the Ipc. Arrows indicate rostral (r), medial (m), and dorsal (d) directions; arrows, 100 μm. A, Horizontal section through the Ipc showing rostrocaudally restricted labeling. B, Transverse section through the Ipc showing dorsoventrally restricted labeling. C, Injection of Fluoro-ruby bidirectional tracer into the Ipc labeled somata retrogradely and processes anterogradely in the same, restricted portion of the OT. Transverse section through the OT oriented with the superficial layers at the top and the deep layers at the bottom. The location of layers 1 and 10 are indicated for reference. Labeled somata were primarily in layer 10, and columnar brush-like axonal terminations throughout layers 2–13. D, Magnified view of the anterogradely labeled brush-like endings in C.
The Ipc and OT were connected topographically, with rostral OT injections labeling regions in the rostral Ipc, and caudal OT injections labeling regions in the caudal Ipc. A total of 13 tracer injections were made in the OT of 7 owls. There was a strong correlation between the rostrocaudal position of the OT injection and the rostrocaudal position of the labeled Ipc region (r2 = 0.93; p < 0.0001; n = 13) (Fig. 3A). There was also a strong correlation between the dorsoventral position of the OT injection and the dorsoventral position of the labeled Ipc region (r2 = 0.87; p < 0.0001; n = 13) (Fig. 3B).
Figure 3.

The Ipc and OT are connected topographically. The relative position of an injection in the OT is shown on the abscissa, and the relative position of the labeling in the Ipc is shown on the ordinate. Each data point represents a single injection, and different symbols represent different owls. There is a correlation between both the rostrocaudal (A) and dorsoventral (B) position of the OT injection site and the corresponding location of Ipc labeling.
General response properties
Ipc sites were spontaneously active, and had a mean baseline firing rate of 35 ± 25 spikes/s (SD). Ipc neurons fired single action potentials and bursts of high-frequency action potentials both at baseline and in response to either auditory or visual stimuli (Fig. 4). To quantify Ipc responses, a level discriminator was set to select the largest units, and threshold crossings were counted. However, because action potentials often occurred in bursts that were synchronized across multiple neighboring units (Fig. 4A,B), it was not possible to isolate single units reliably, even with high impedance electrodes. Therefore, the data reported here are treated as multiunit responses.
Figure 4.

Ipc neurons fire in bursts of high-frequency action potentials at baseline and in response to auditory or visual stimuli. A, Waveform of Ipc activity. The arrow indicates the bursting activity that is magnified in B. B, Magnified view of complex spike waveform. C, E, Raster plots of responses at a single Ipc site to auditory (C) and visual (E) stimuli. Peristimulus time is shown on the abscissa; the gray zone indicates the time of stimulus presentation. Each dot represents the time that the neural signal crossed a voltage threshold. Each row on the ordinate represents a repeated presentation of the preferred auditory (C) or visual (E) stimulus for this site. The auditory stimulus was a noise burst at the best ITD and ILD at 20 dB above threshold, and the visual stimulus was a white dot against a black background (positive contrast) at the best visual azimuth and elevation. The preferred stimulus was interleaved with nonpreferred stimuli (data not shown) to prevent response habituation. D, F, Peristimulus time histograms of the data plotted in C and E, respectively. Peristimulus time is shown on the abscissa, and firing rate (spikes/second) in 5 ms bins is shown on the ordinate. The black bar indicates the time of stimulus presentation.
Responses to a noise burst or to a bright dot projected onto the tangent screen often consisted of a strong transient response followed by a slowly adapting sustained response (Fig. 4C–F). There was considerable variability in the time course of adaptation across sites (Figs. 4–8), and there was no apparent pattern to the distribution of transient or sustained responses for individual sites or across sites. At many sites, the sustained response persisted well beyond (>100 ms) the end of the stimulus (Fig. 5A,C).
Figure 5.

Ipc sites have spatially restricted visual RFs. A, C, Raster plots of the response of an Ipc site to a stationary, 1° positive contrast dot presented at different spatial locations. Peristimulus time is shown on the abscissa; the gray zone indicates time of stimulus presentation. The ordinate displays the azimuth (A) or elevation (C) of the visual stimulus. B, D, Histograms of the half-width of tuning to visual azimuth (B) or elevation (D) for all sites measured.
Figure 6.

Ipc sites have restricted auditory RFs. A, C, Raster plots of the response of an Ipc site to the binaural auditory localization cues ITD (A) and ILD (C). This site is from the same penetration as the site displayed in Figure 5. A negative ITD indicates left ear leading, and a negative ILD indicates left ear greater. B, D, Histograms of the half-width of tuning to ITD (B) or ILD (D) for all sites measured.
Figure 7.

Response strength increases with sound level. A, Raster plot of responses of an Ipc site to increasing sound level at its best ITD and ILD. Sound level is represented on the ordinate [average binaural level (ABL)]. Greater ABL values indicate increasing sound level. The response threshold was defined as the lowest sound level that elicited a response >1.5 SDs from the mean prestimulus firing rate. The arrowhead indicates the response threshold for this site. B, Responses to increases in ABL for all sites measured. The ordinate displays normalized firing rate (poststimulus response with average baseline firing rate subtracted, normalized to the maximum firing rate for that site). The abscissa displays sound level relative to response threshold. Error bars are SD.
Figure 8.

Ipc sites are tuned for frequency, and respond preferentially to high-frequency sounds. A, Raster plot of responses of an Ipc site to tonal stimuli. B, Half-widths of responses to tonal stimuli for all sites measured. The ordinate displays one bar for each site and the abscissa displays tone frequency. The center of each bar represents the preferred frequency for that site, and the length of the bar represents the half-width for that site.
Ipc sites typically exhibited spatially restricted RFs for both auditory and visual stimuli. Restricted auditory spatial RFs were apparent qualitatively in responses to sounds made with hand-held stimuli (rustling paper or snapping) presented from various locations around the owl. Quantitative analysis of auditory spatial tuning was based on responses to binaural localization cues (ITDs and ILDs) presented through earphones. Visual RFs were located qualitatively by moving a bright dot rapidly throughout the tangent screen, and were analyzed quantitatively with computer-controlled stimuli (see Materials and Methods). Minimum response latencies were measured for a subset of sites using repeated presentations of stationary auditory or visual stimuli centered in the RF of the site. The median auditory response latency was 14 ms (range, 12–22 ms; n = 17), and the median visual response latency was 60 ms (range, 39–92 ms; n = 16).
Visual response properties
Most Ipc sites had spatially restricted visual RFs. Sites responded to either stationary or moving visual stimuli, and stimuli that moved along the vertical dimension seemed qualitatively to elicit the strongest responses. Ninety-six percent of sites (26 of 27) were tuned for visual azimuth (p < 0.05, one-way ANOVA), and the median half-width was 10° (range, 7–33°; n = 24) (Fig. 5A,B). Ninety-five percent of sites (35 of 37) were tuned for visual elevation (p < 0.05, one-way ANOVA), and the median half-width was 19° (range, 7–81°; n = 31) (Fig. 5C,D). Thus, tuning for azimuth was, typically, about twice as sharp as tuning for elevation (see Discussion).
Auditory response properties
Nearly all Ipc sites were tuned sharply for the binaural sound localization cues ITD (auditory azimuth) and ILD (auditory elevation), measured at 20–30 dB above response threshold. All sites (45 of 45) were tuned for ITD (p < 0.05, one-way ANOVA), and the median half-width was 54 μs (range, 27–164 μs; n = 45) (Fig. 6A,B). Ninety-eight percent of sites (50 of 51) were tuned for ILD (p < 0.05, one-way ANOVA), and the median half-width was 13 dB (range, 6–55 dB; n = 47) (Fig. 6C,D).
Sound level had little effect on binaural tuning. Tuning for ITD was measured both at 10 and 30 dB above response threshold for 14 sites. This 20 dB (10-fold) increase in sound level caused best ITDs to change by a median of 5 μs (range, 0–12 μs; absolute value of difference in best ITD) and the half-width for ITD to change by a median of 5 μs (range, 0–26 μs; absolute value of difference in ITD half-width). There was no systematic effect of sound level on the direction of best ITD changes (median net change, +1 μs) or on the change in ITD half-widths (median net change, 0 μs).
Tuning for ILD was also measured at 10 and 30 dB above response threshold for 13 sites. The increase in sound level caused best ILDs to change by a median of 1 dB (range, 0–9 dB; absolute value of difference in best ILD) and the half-width for ILD to change by a median of 3 dB (range, 0–16 dB; absolute value of difference in ILD half-width). There was no systematic effect of sound level on changes in best ILD (median net change, +1 dB), and only a slight tendency toward larger half-widths at higher sound levels (median net change, +3 dB).
Although increases in sound level had little effect on the shape of ITD and ILD tuning curves, they did affect response strength. For sounds centered in the auditory RF (dichotic sounds at best ITD and best ILD), neural responses increased with sound level over a range of 40 dB (Fig. 7) (n = 39).
Most Ipc sites (88%; 23 of 26) were tuned for tone frequency (p < 0.05, one-way ANOVA). Sites were broadly tuned for tone frequency: the median half-width was 3.2 kHz (range, 1.7–4.8 kHz; n = 23) (Fig. 8), or 0.5 octaves (range, 0.3–1.3 octaves). Best frequencies were biased strongly to the high end of the barn owl's audible range, with a median best frequency of 6.1 kHz (range, 2.6–7.6 kHz; n = 23) (Fig. 8).
Functional topography
Both auditory space and visual space were represented topographically in the Ipc. Frontal space was represented rostrally, contralateral space caudally, upper space dorsally, and lower space ventrally. The visual space map was assessed based on RF centers at a subset of sites. For experiments in which data were collected from multiple electrode penetrations, the azimuths of visual RF centers shifted systematically with the rostrocaudal position of the electrode penetration (Fig. 9A), but did not vary systematically with dorsoventral position in the Ipc (data not shown). The map extended to at least 9° ipsilateral, the most ipsilateral RF center we recorded (site not shown in Fig. 9A because it was not from an experiment with multiple electrode penetrations). The elevation of visual RF centers changed systematically with dorsoventral electrode position along individual penetrations (Fig. 9B), but did not vary systematically with the rostrocaudal position of the electrode penetration (data not shown). Although the RF elevation of the more dorsal site was variable, the RF elevation of the second site was always located below that of the first site.
Figure 9.

The Ipc is organized as a bimodal space map. A, C, Each circle represents the center of a RF measured for an electrode penetration at a given rostrocaudal position. The abscissa represents electrode distance from the most rostral site recorded on that experiment day, and the ordinate represents the best visual azimuth (A) or best ITD (C) tuning (negative values represent ipsilateral space, and positive values represent contralateral space). For penetrations in which more than one site was measured, open circles indicate the mean value for all sites measured in that penetration, and vertical lines represent the range of values. For penetrations in which only a single site was measured, filled circles indicate the value for that site. The gray lines connect penetrations from a single experiment. B, D, Each circle represents the center of a RF measured for a site at a given dorsoventral position. The abscissa represents electrode distance from the most dorsal site recorded in that penetration, and the ordinate represents the best visual elevation (B) or best ILD (D) tuning for each site. The gray lines connect data points taken from a single penetration. Because of the small dorsoventral extent of the Ipc, a maximum of two sites were sampled per penetration. The number of data points differs between A and C and between B and D because at certain sites only auditory or visual spatial tuning was assessed.
The auditory space map was assessed based on tuning to ITD and ILD at a subset of sites. Best ITDs varied systematically with rostrocaudal position, with slightly ipsilateral-ear leading ITDs represented rostrally and progressively more contralateral-ear leading ITDs represented more caudally (Fig. 9C). Best ITDs did not change systematically along dorsoventral penetrations (data not shown). The most ipsilateral best ITD measured was 33 μs ipsilateral-ear leading (site not shown in Fig. 9C; same site referred to above). In contrast, best ILDs varied systematically with dorsoventral electrode position, with more left-ear greater values (corresponding to lower elevations in frontal space) represented at progressively more ventral recording sites (Fig. 9D). Best ILDs did not vary systematically with rostrocaudal position (data not shown).
Alignment of auditory and visual RFs
Auditory tuning for spatial cues varied systematically with visual RF location (Fig. 10). The relationship between best ITD and visual RF azimuth is shown in Figure 10A. The data were fit with a linear regression (r2 = 0.81; p < 0.0001; n = 29). Sites with visual RFs centered near 0° azimuth had best ITDs near 0 μs, and best ITDs increased with visual RF center at an average rate of 3.1 μs/° azimuth. These data indicate that the maps of auditory and visual space were mutually aligned in the Ipc.
Figure 10.
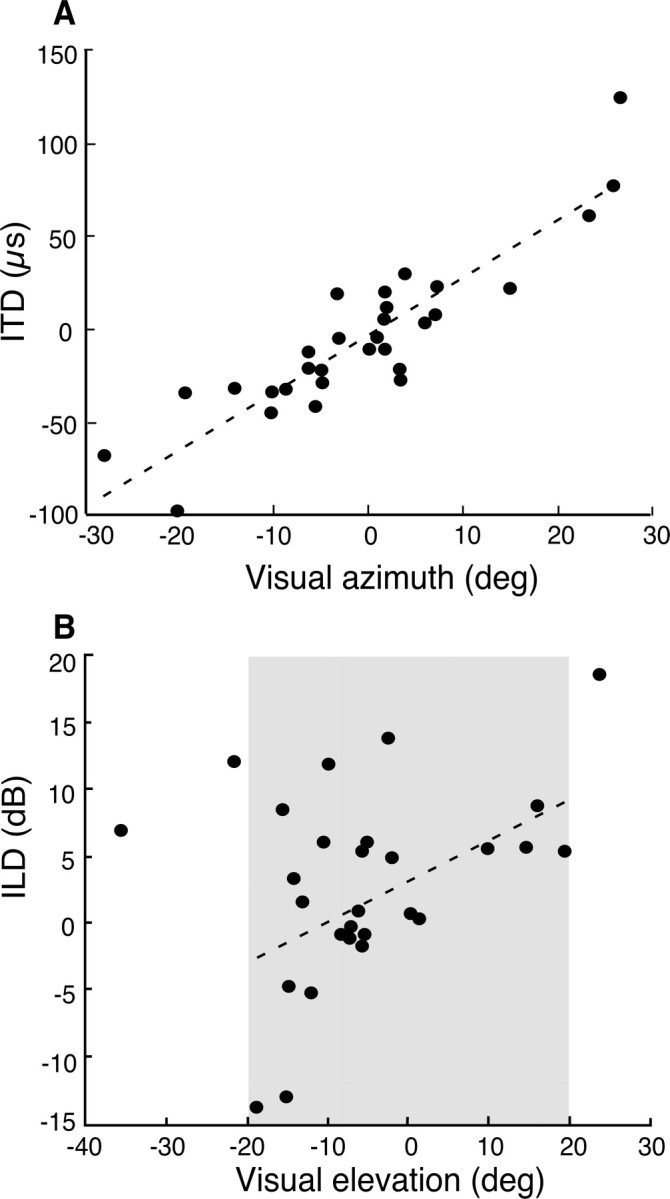
Representations of auditory and visual space are aligned in the Ipc. Each dot represents the auditory and visual tuning for a site. A, Best visual azimuth is plotted on the abscissa, and best ITD on the ordinate. A negative ITD indicates left ear leading sounds; a negative visual azimuth indicates left space. B, Best visual elevation is plotted on the abscissa and best ILD on the ordinate. A negative ILD indicates left ear greater. The gray zone represents the range of elevations over which high-frequency ILDs vary with stimulus elevation in frontal space.
The relationship between best ILD and visual RF elevation is shown in Figure 10B. Previous acoustic measurements (Payne, 1971; Coles and Guppy, 1988; Keller et al., 1998) have demonstrated that ILDs change monotonically with stimulus elevation only for high frequencies (>4 kHz) and only for frontal space within 20° of the horizon (Fig. 10B, gray area). Even within this zone, the correlation of ILD with elevation is highly frequency dependent. As expected from the acoustics and from the variable frequency tuning of Ipc sites, the correlation of best ILD with visual RF elevation was weaker (r2 = 0.21; p < 0.05; n = 25) (Fig. 10B) than the correlation of best ITD with visual RF azimuth.
Discussion
The owl Ipc is a bimodal nucleus with response properties similar to the OT
Neurons in the barn owl Ipc are driven strongly by auditory as well as visual stimuli. Ipc neurons are tuned for sound location by virtue of their sharp tuning for ITD and ILD, and are organized according to their binaural tuning to form a map of auditory space. The selectivity of Ipc neurons for auditory spatial cues is virtually unaffected by large changes in sound level, indicating a robust representation of stimulus location. Ipc neurons are tuned broadly for frequency and respond preferentially to the high frequencies that provide the owl with the highest spatial resolution (Fig. 8) (Payne, 1971; Knudsen and Konishi, 1979). These properties are in contrast to the sharp frequency tuning and tonotopic organization that characterize neural responses in the primary auditory pathway (for review, see Schreiner et al., 2000), and indicate that the Ipc is specialized for representing the location, rather than the acoustic properties, of an auditory stimulus. This conclusion is consistent with the observation that, in the cat PBN, (mammalian homolog of the Ipc) neurons are selective for the location of visual stimuli and not for visual parameters such as shape or contrast (Sherk, 1979).
The auditory and visual response properties of Ipc neurons are, in most respects, indistinguishable from those that have been recorded in the OT (Knudsen, 1982, 1984). The Ipc and OT both contain aligned representations of auditory and visual space, and the sharpness of tuning for auditory and visual stimuli are similar (Knudsen, 1982). In both structures, auditory tuning is broader than visual tuning. The median half-width of ITD tuning in the Ipc is 54 μs, equivalent to 22° azimuth using the conversion of 2.5 μs/° (Brainard and Knudsen, 1993). This width is more than twice the median half-width for visual tuning in azimuth. An equivalent comparison of ILD tuning with visual RF height is not possible because of the frequency-dependent, nonmonotonic relationship between ILD and elevation (Keller et al., 1998). The longer visual latencies observed in both the OT and the Ipc reflect the slower processing of visual signals in the retina as compared with auditory signals in the cochlea.
The similarities in response properties between the Ipc and the OT are consistent with the tight anatomical coupling that exists between these structures. Indeed, Marin et al. (2005) have shown that bursting activity in the superficial layers of the OT actually represents the discharges of Ipc terminal axons. Consistent with this finding, the minimum auditory and visual response latencies in the Ipc are in the same range as those reported for the superficial layers of the OT (DeBello and Knudsen, 2004). The layer 10b neurons that project to the Ipc most likely receive both auditory and visual input, because their bipolar dendrites extend up into the retinorecipient layers as well as into the deep layers of the OT (Wang et al., 2006). Ipc neurons then convey this bimodal spatial information to essentially all layers of the OT.
One respect in which responses in the Ipc differ from responses in the OT is in the precision of elevation coding. In the OT, visual RFs are slightly narrower in azimuth than in elevation, and RF shape varies from circular to vertically oval (Knudsen, 1982). In the Ipc, visual RFs are vertically oblong, and are on average twice as large in elevation as in azimuth. We do not know the cause of this difference in elevation coding between the Ipc and OT. One possibility is that stimulus elevation is represented imprecisely by individual Ipc neurons. This could be accounted for by the dorsoventrally elongated dendritic structure of Ipc neurons (Wang et al., 2006). Another nonexclusive possibility is that our multiunit recordings systematically included a broader range of elevation representations than of azimuth representations.
Visual response properties in the barn owl Ipc are generally similar to those observed in the pigeon Ipc (Wang and Frost, 1991). In both species, Ipc neurons have vertically oblong spatial RFs that are organized topographically to form a map of space. However, visual RFs appear to be larger in the pigeon than in the barn owl: pigeon RFs average 30° in width and 80° in length. Moreover, in contrast to the high resting discharge rates of Ipc units in the barn owl, pigeon Ipc units exhibit low resting discharge rates. We do not know whether these differences between species are real or are attributable to different experimental techniques.
Functions of the Ipc
The role of the Ipc in information processing is not yet fully understood. Previous studies have demonstrated that the Ipc is involved in regulating and refining visual responses in the OT (Gruberg et al., 1991; Schmidt, 1995; Wang et al., 1995, 2000; Dudkin and Gruberg, 2003). We have shown that Ipc neurons respond to both auditory and visual stimuli located in a restricted region of space. These results narrow the range of possible functions of the Ipc substantially. The Ipc is not involved in processing modality-specific information about stimulus identity or features. Rather, the Ipc represents exclusively spatial information.
The anatomical connectivity of the Ipc gives additional insight into potential roles for this nucleus. Unlike the OT, which receives sensory input from the retina and inferior colliculus, and sends motor output to brainstem control areas (among other connections) (Wurtz and Albano, 1980; Sparks, 1986; Stein and Meredith, 1993), the Ipc does not have known sensory or motor connections outside of the OT. Instead, the Ipc is positioned as a satellite nucleus of the OT, and the vast majority of its connections are with the OT, suggesting that its primary function is to modulate OT neurons.
One hypothesis is that the role of the Ipc is to regulate the sensitivity of neurons representing a given spatial location in the OT. Input from the Ipc arrives via axons that contact essentially every layer of the OT in a restricted column (Fig. 2C). Neurons in the different OT layers receive input from different sensory modalities and contribute to widely different circuits (Luksch, 2003; May, 2005) that are involved, presumably, in different kinds of computations. Given this connectivity, the Ipc is ideally positioned to regulate neuronal responsiveness for a specific spatial location across all modalities and computations.
Ipc neurons receive input from a restricted part of the OT space map and send projections back to the same part of the OT. The Imc, another nucleus in the isthmotectal circuit, also receives input from a restricted part of the OT space map, but it sends inhibitory projections to every location in the OT except for its input location (Wang et al., 2004). Given this circuitry, the isthmotectal circuit likely functions as a winner-take-all network (Koch and Ullman, 1985), with the Ipc acting to amplify responses for a given spatial location and the Imc inhibiting competing responses. This circuitry could select the most salient target, and Ipc neurons, by virtue of their projections to essentially all OT layers, could increase the sensitivity of OT neurons that process information from that location in space. Space-specific modulation of sensory sensitivity is a process that is fundamental to spatial attention (Goldberg and Wurtz, 1972; Desimone and Duncan, 1995; Treue, 2001; Reynolds and Chelazzi, 2004). Interestingly, ACh, the neurotransmitter of Ipc neurons, has been shown to contribute to attentional modulation in the cortex (for review, see Sarter and Bruno, 1997; Sarter et al., 2005).
In support of the hypothesis that the Ipc modulates OT sensitivity, the Ipc receives a projection from the forebrain arcopallial gaze fields (AGF) (Knudsen et al., 1995). The gaze control system has been shown, in several species, to be tightly coupled to top-down mechanisms that control sensory sensitivity (for review, see Moore et al., 2003). In monkeys, electrical microstimulation in the forebrain gaze control area can increase behavioral and neuronal sensitivity to stimuli positioned at the location in space represented by the site of microstimulation (Moore and Armstrong, 2003; Moore and Fallah, 2004). In owls, electrical microstimulation of the AGF increases the sensitivity and sharpens the spatial tuning of auditory responses in the OT (Winkowski and Knudsen, 2006). These top-down signals from the AGF could be another source of target selection information that the Ipc uses to regulate the sensitivity of OT neurons. This possibility is consistent with data from behaving cats, showing that neurons in the PBN respond strongly to visual stimuli to which eye saccades will be directed, but only weakly to identical stimuli that are behaviorally irrelevant (Cui and Malpeli, 2003).
We have shown that the Ipc responds to auditory as well as visual stimuli, and encodes stimulus location independent of modality. The Ipc has access to information relevant for target selection based on a combination of sensory input from the OT, winner-take-all dynamics within the isthmotectal circuit, and top-down signals from the forebrain. Ipc neurons contact essentially all layers in a restricted column of the OT, activating the OT with a spatially precise signal. We hypothesize that the role of the Ipc is to regulate the sensitivity of OT target neurons in a space-specific manner, and that this regulation of sensitivity is important for target selection and spatial attention. Direct experiments are required to test the validity of this hypothesis.
Footnotes
This work was supported by grants from the National Institutes of Health and the MacArthur Foundation to E.I.K. K.A.M. was supported by a National Institutes of Health predoctoral fellowship. We thank D. Winkowski for performing tracer injections used in this study. We also thank J. Bergan, A. Goddard, A. Keuroghlian, D. Winkowski, and I. Witten for helpful comments on this manuscript.
References
- Brainard and Knudsen, 1993.Brainard MS, Knudsen EI. Experience-dependent plasticity in the inferior colliculus: a site for visual calibration of the neural representation of auditory space in the barn owl. J Neurosci. 1993;13:4589–4608. doi: 10.1523/JNEUROSCI.13-11-04589.1993. [DOI] [PMC free article] [PubMed] [Google Scholar]
- Coles and Guppy, 1988.Coles RB, Guppy A. Directional hearing in the barn owl (Tyto alba) J Comp Physiol A Neuroethol Sens Neural Behav Physiol. 1988;163:117–133. doi: 10.1007/BF00612002. [DOI] [PubMed] [Google Scholar]
- Cui and Malpeli, 2003.Cui H, Malpeli JG. Activity in the parabigeminal nucleus during eye movements directed at moving and stationary targets. J Neurophysiol. 2003;89:3128–3142. doi: 10.1152/jn.01067.2002. [DOI] [PubMed] [Google Scholar]
- DeBello and Knudsen, 2004.DeBello WM, Knudsen EI. Multiple sites of adaptive plasticity in the owl's auditory localization pathway. J Neurosci. 2004;24:6853–6861. doi: 10.1523/JNEUROSCI.0480-04.2004. [DOI] [PMC free article] [PubMed] [Google Scholar]
- Desimone and Duncan, 1995.Desimone R, Duncan J. Neural mechanisms of selective visual attention. Annu Rev Neurosci. 1995;18:193–222. doi: 10.1146/annurev.ne.18.030195.001205. [DOI] [PubMed] [Google Scholar]
- Diamond et al., 1992.Diamond IT, Fitzpatrick D, Conley M. A projection from the parabigeminal nucleus to the pulvinar nucleus in Galago. J Comp Neurol. 1992;316:375–382. doi: 10.1002/cne.903160308. [DOI] [PubMed] [Google Scholar]
- Dudkin and Gruberg, 2003.Dudkin EA, Gruberg ER. Nucleus isthmi enhances calcium influx into optic nerve fiber terminals in Rana pipiens. Brain Res. 2003;969:44–52. doi: 10.1016/s0006-8993(03)02274-1. [DOI] [PubMed] [Google Scholar]
- Goldberg and Wurtz, 1972.Goldberg ME, Wurtz RH. Activity of superior colliculus in behaving monkey. II. Effect of attention on neuronal responses. J Neurophysiol. 1972;35:560–574. doi: 10.1152/jn.1972.35.4.560. [DOI] [PubMed] [Google Scholar]
- Gruberg and Lettvin, 1980.Gruberg ER, Lettvin JY. Anatomy and physiology of a binocular system in the frog Rana pipiens. Brain Res. 1980;192:313–325. doi: 10.1016/0006-8993(80)90886-0. [DOI] [PubMed] [Google Scholar]
- Gruberg et al., 1991.Gruberg ER, Wallace MT, Caine HS, Mote MI. Behavioral and physiological consequences of unilateral ablation of the nucleus isthmi in the leopard frog. Brain Behav Evol. 1991;37:92–103. doi: 10.1159/000114350. [DOI] [PubMed] [Google Scholar]
- Gunturkun and Remy, 1990.Gunturkun O, Remy M. The topographical projection of the nucleus isthmi pars parvocellularis (Ipc) onto the tectum opticum in the pigeon. Neurosci Lett. 1990;111:18–22. doi: 10.1016/0304-3940(90)90337-9. [DOI] [PubMed] [Google Scholar]
- Hellmann et al., 2001.Hellmann B, Manns M, Gunturkun O. Nucleus isthmi, pars semilunaris as a key component of the tectofugal visual system in pigeons. J Comp Neurol. 2001;436:153–166. [PubMed] [Google Scholar]
- Hunt et al., 1977.Hunt SP, Streit P, Kunzle H, Cuenod M. Characterization of the pigeon isthmo-tectal pathway by selective uptake and retrograde movement of radioactive compounds and by Golgi-like horseradish peroxidase labeling. Brain Res. 1977;129:197–212. doi: 10.1016/0006-8993(77)90001-4. [DOI] [PubMed] [Google Scholar]
- Keller et al., 1998.Keller CH, Hartung K, Takahashi TT. Head-related transfer functions of the barn owl: measurement and neural responses. Hear Res. 1998;118:13–34. doi: 10.1016/s0378-5955(98)00014-8. [DOI] [PubMed] [Google Scholar]
- Knudsen, 1982.Knudsen EI. Auditory and visual maps of space in the optic tectum of the owl. J Neurosci. 1982;2:1177–1194. doi: 10.1523/JNEUROSCI.02-09-01177.1982. [DOI] [PMC free article] [PubMed] [Google Scholar]
- Knudsen, 1984.Knudsen EI. Auditory properties of space-tuned units in owl's optic tectum. J Neurophysiol. 1984;52:709–723. doi: 10.1152/jn.1984.52.4.709. [DOI] [PubMed] [Google Scholar]
- Knudsen and Konishi, 1979.Knudsen EI, Konishi M. Mechanisms of sound localization in the barn owl (Tyto alba) J Comp Physiol A Neuroethol Sens Neural Behav Physiol. 1979;133:13–21. [Google Scholar]
- Knudsen et al., 1995.Knudsen EI, Cohen YE, Masino T. Characterization of a forebrain gaze field in the archistriatum of the barn owl: microstimulation and anatomical connections. J Neurosci. 1995;15:5139–5151. doi: 10.1523/JNEUROSCI.15-07-05139.1995. [DOI] [PMC free article] [PubMed] [Google Scholar]
- Koch and Ullman, 1985.Koch C, Ullman S. Shifts in selective visual attention: towards the underlying neural circuitry. Hum Neurobiol. 1985;4:219–227. [PubMed] [Google Scholar]
- Luksch, 2003.Luksch H. Cytoarchitecture of the avian optic tectum: neuronal substrate for cellular computation. Rev Neurosci. 2003;14:85–106. doi: 10.1515/revneuro.2003.14.1-2.85. [DOI] [PubMed] [Google Scholar]
- Marin et al., 2005.Marin G, Mpdozis J, Sentis E, Ossandon T, Letelier JC. Oscillatory bursts in the optic tectum of birds represent re-entrant signals from the nucleus isthmi pars parvocellularis. J Neurosci. 2005;25:7081–7089. doi: 10.1523/JNEUROSCI.1379-05.2005. [DOI] [PMC free article] [PubMed] [Google Scholar]
- May, 2005.May PJ. The mammalian superior colliculus: laminar structure and connections. Prog Brain Res. 2005;151:321–378. doi: 10.1016/S0079-6123(05)51011-2. [DOI] [PubMed] [Google Scholar]
- Medina and Reiner, 1994.Medina L, Reiner A. Distribution of choline acetyltransferase immunoreactivity in the pigeon brain. J Comp Neurol. 1994;342:497–537. doi: 10.1002/cne.903420403. [DOI] [PubMed] [Google Scholar]
- Moore and Armstrong, 2003.Moore T, Armstrong KM. Selective gating of visual signals by microstimulation of frontal cortex. Nature. 2003;421:370–373. doi: 10.1038/nature01341. [DOI] [PubMed] [Google Scholar]
- Moore and Fallah, 2004.Moore T, Fallah M. Microstimulation of the frontal eye field and its effects on covert spatial attention. J Neurophysiol. 2004;91:152–162. doi: 10.1152/jn.00741.2002. [DOI] [PubMed] [Google Scholar]
- Moore et al., 2003.Moore T, Armstrong KM, Fallah M. Visuomotor origins of covert spatial attention. Neuron. 2003;40:671–683. doi: 10.1016/s0896-6273(03)00716-5. [DOI] [PubMed] [Google Scholar]
- Northmore, 1991.Northmore DP. Visual responses of nucleus isthmi in a teleost fish (Lepomis macrochirus) Vision Res. 1991;31:525–535. doi: 10.1016/0042-6989(91)90103-c. [DOI] [PubMed] [Google Scholar]
- Payne, 1971.Payne RS. Acoustic location of prey by barn owls (Tyto alba) J Exp Biol. 1971;54:535–573. doi: 10.1242/jeb.54.3.535. [DOI] [PubMed] [Google Scholar]
- Reynolds and Chelazzi, 2004.Reynolds JH, Chelazzi L. Attentional modulation of visual processing. Annu Rev Neurosci. 2004;27:611–647. doi: 10.1146/annurev.neuro.26.041002.131039. [DOI] [PubMed] [Google Scholar]
- Sarter and Bruno, 1997.Sarter M, Bruno JP. Cognitive functions of cortical acetylcholine: toward a unifying hypothesis. Brain Res Brain Res Rev. 1997;23:28–46. doi: 10.1016/s0165-0173(96)00009-4. [DOI] [PubMed] [Google Scholar]
- Sarter et al., 2005.Sarter M, Hasselmo ME, Bruno JP, Givens B. Unraveling the attentional functions of cortical cholinergic inputs: interactions between signal-driven and cognitive modulation of signal detection. Brain Res Brain Res Rev. 2005;48:98–111. doi: 10.1016/j.brainresrev.2004.08.006. [DOI] [PubMed] [Google Scholar]
- Schmidt, 1995.Schmidt JT. The modulatory cholinergic system in goldfish tectum may be necessary for retinotopic sharpening. Vis Neurosci. 1995;12:1093–1103. doi: 10.1017/s095252380000674x. [DOI] [PubMed] [Google Scholar]
- Schreiner et al., 2000.Schreiner CE, Read HL, Sutter ML. Modular organization of frequency integration in primary auditory cortex. Annu Rev Neurosci. 2000;23:501–529. doi: 10.1146/annurev.neuro.23.1.501. [DOI] [PubMed] [Google Scholar]
- Sherk, 1978.Sherk H. Visual response properties and visual field topography in the cat's parabigeminal nucleus. Brain Res. 1978;145:375–379. doi: 10.1016/0006-8993(78)90871-5. [DOI] [PubMed] [Google Scholar]
- Sherk, 1979.Sherk H. A comparison of visual-response properties in cat's parabigeminal nucleus and superior colliculus. J Neurophysiol. 1979;42:1640–1655. doi: 10.1152/jn.1979.42.6.1640. [DOI] [PubMed] [Google Scholar]
- Sorenson et al., 1989.Sorenson EM, Parkinson D, Dahl JL, Chiappinelli VA. Immunohistochemical localization of choline acetyltransferase in the chicken mesencephalon. J Comp Neurol. 1989;281:641–657. doi: 10.1002/cne.902810412. [DOI] [PubMed] [Google Scholar]
- Sparks, 1986.Sparks DL. Translation of sensory signals into commands for control of saccadic eye movements: role of primate superior colliculus. Physiol Rev. 1986;66:118–171. doi: 10.1152/physrev.1986.66.1.118. [DOI] [PubMed] [Google Scholar]
- Stein and Meredith, 1993.Stein BE, Meredith MA. Cambridge, MA: MIT; 1993. The merging of the senses. [Google Scholar]
- Tombol et al., 1995.Tombol T, Egedi G, Nemeth A. Some data on connections of neurons of nuclei isthmi of the chicken. J Hirnforsch. 1995;36:501–508. [PubMed] [Google Scholar]
- Treue, 2001.Treue S. Neural correlates of attention in primate visual cortex. Trends Neurosci. 2001;24:295–300. doi: 10.1016/s0166-2236(00)01814-2. [DOI] [PubMed] [Google Scholar]
- Wang et al., 1981.Wang SJ, Yan K, Wang YT. Visual field topography in the frog's nucleus isthmi. Neurosci Lett. 1981;23:37–41. [PubMed] [Google Scholar]
- Wang, 2003.Wang SR. The nucleus isthmi and dual modulation of the receptive field of tectal neurons in non-mammals. Brain Res Brain Res Rev. 2003;41:13–25. doi: 10.1016/s0165-0173(02)00217-5. [DOI] [PubMed] [Google Scholar]
- Wang et al., 1995.Wang SR, Wang YC, Frost BJ. Magnocellular and parvocellular divisions of pigeon nucleus isthmi differentially modulate visual responses in the tectum. Exp Brain Res. 1995;104:376–384. doi: 10.1007/BF00231973. [DOI] [PubMed] [Google Scholar]
- Wang et al., 2000.Wang Y, Xiao J, Wang SR. Excitatory and inhibitory receptive fields of tectal cells are differentially modified by magnocellular and parvocellular divisions of the pigeon nucleus isthmi. J Comp Physiol A Neuroethol Sens Neural Behav Physiol. 2000;186:505–511. doi: 10.1007/s003590000102. [DOI] [PubMed] [Google Scholar]
- Wang et al., 2004.Wang Y, Major DE, Karten HJ. Morphology and connections of nucleus isthmi pars magnocellularis in chicks (Gallus gallus) J Comp Neurol. 2004;469:275–297. doi: 10.1002/cne.11007. [DOI] [PubMed] [Google Scholar]
- Wang et al., 2006.Wang Y, Luksch H, Brecha NC, Karten HJ. Columnar projections from the cholinergic nucleus isthmi to the optic tectum in chicks (Gallus gallus): a possible substrate for synchronizing tectal channels. J Comp Neurol. 2006;494:7–35. doi: 10.1002/cne.20821. [DOI] [PubMed] [Google Scholar]
- Wang and Frost, 1991.Wang YC, Frost BJ. Visual response characteristics of neurons in the nucleus isthmi magnocellularis and nucleus isthmi parvocellularis of pigeons. Exp Brain Res. 1991;87:624–633. doi: 10.1007/BF00227087. [DOI] [PubMed] [Google Scholar]
- Wiggers and Roth, 1991.Wiggers W, Roth G. Anatomy, neurophysiology and functional aspects of the nucleus isthmi in salamanders of the family Plethodontidae. J Comp Physiol A Neuroethol Sens Neural Behav Physiol. 1991;169:165–176. [Google Scholar]
- Winkowski and Knudsen, 2006.Winkowski DE, Knudsen EI. Top-down gain control of the auditory space map by gaze control circuitry in the barn owl. Nature. 2006;439:336–339. doi: 10.1038/nature04411. [DOI] [PMC free article] [PubMed] [Google Scholar]
- Woodson et al., 1991.Woodson W, Reiner A, Anderson K, Karten HJ. Distribution, laminar location, and morphology of tectal neurons projecting to the isthmo-optic nucleus and the nucleus isthmi, pars parvocellularis in the pigeon (Columba livia) and chick (Gallus domesticus): a retrograde labelling study. J Comp Neurol. 1991;305:470–488. doi: 10.1002/cne.903050310. [DOI] [PubMed] [Google Scholar]
- Wurtz and Albano, 1980.Wurtz RH, Albano JE. Visual-motor function of the primate superior colliculus. Annu Rev Neurosci. 1980;3:189–226. doi: 10.1146/annurev.ne.03.030180.001201. [DOI] [PubMed] [Google Scholar]
- Yan and Wang, 1986.Yan K, Wang SR. Visual responses of neurons in the avian nucleus isthmi. Neurosci Lett. 1986;64:340–344. doi: 10.1016/0304-3940(86)90352-6. [DOI] [PubMed] [Google Scholar]