

Abstract
Cytosolic N-terminal segments of many K+ channel subunits mediate rapid blockade of ion permeation by physical occlusion of the ion-conducting pore. For some channels with large cytosolic structures, access to the channel pore by inactivation domains may occur through lateral entry pathways or “side portals” that separate the pore domain and associated cytosolic structures covering the axis of the permeation pathway. However, the extent to which side portals control access of molecules to the channel or influence channel gating is unknown. Here we use removal of inactivation by trypsin as a tool to examine basic residue accessibility in both the N terminus of the native auxiliary β2 subunit of Ca2+-activated, BK-type K+ channels and β2 subunits with artificial inactivating N termini. The results show that, for BK channels, side portals define a protected space that precedes the channel permeation pathway and excludes small proteins such as trypsin but allows inactivation domains to enter. When channels are closed, inactivation domains readily pass through side portals, with a central antechamber preceding the permeation pathway occupied by an inactivation domain approximately half of the time under resting conditions. The restricted volume of the pathway through side portals is likely to influence kinetic properties of inactivation mechanisms, blockade by large pharmacological probes, and accessibility of modulatory factors to surfaces of the channel within the protected space.
Keywords: BK channels, inactivation mechanisms, channel structure, auxiliary β subunits, patch clamp, trypsin accessibility
Introduction
Rapid inactivation of voltage-dependent K+ (Kv) channels (Zhou et al., 2001) and large-conductance, Ca2+-activated K+ channels (BK) (Xia et al., 2003) involves insertion of a cytosolic hydrophobic N-terminal peptide segment into a position in the ion permeation pathway that obstructs ion flux. Such hydrophobic inactivation domains (IDs) can be either intrinsic to the N terminus of the pore-forming α subunits (Hoshi et al., 1990; Ruppersberg et al., 1991) or arise from N termini of associated auxiliary β subunits (Rettig et al., 1994; Rasmusson et al., 1997; Wallner et al., 1999; Xia et al., 1999). For many channels, a large cytosolic domain hanging from the membrane-embedded pore module almost certainly requires that IDs gain access to the channel through lateral entry pathways, termed side portals, that separate the pore domain from the cytosolic structure (Gulbis et al., 2000; Kobertz et al., 2000; Sokolova et al., 2001; Zhou et al., 2001). Consideration of the open-state structure of Ca2+-activated bacterial methanobacterium thermoautotrophicum (MthK) K+ channel (Jiang et al., 2002a) suggests that side portals may place significant constraints on access to the pore (see Fig. 1A). The role, if any, of side portals in defining access of molecules to the channel or in channel gating is unknown.
Figure 1.
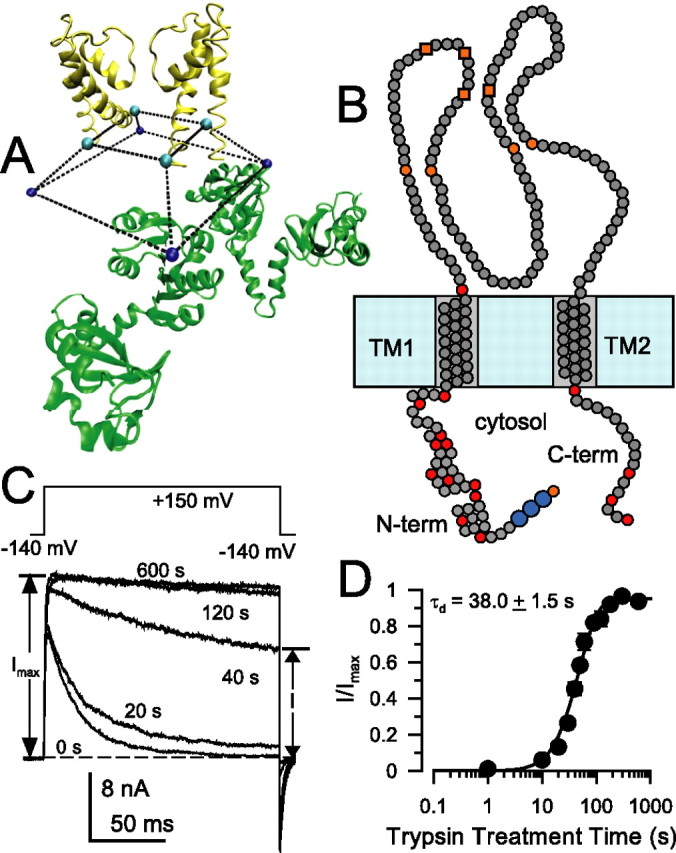
Characteristics of trypsin sensitivity of inactivation mediated by wild-type β2 N termini. A, The architecture of the cytosolic domain and pore domain of the MthK channel illustrates the idea that access of permeant ions and inactivation domains to the permeation pathway in many channels may occur via side portals. Here, two of the four MthK subunits are shown (inner RCK domains only), and the truncated square pyramid defines the volume delimited by the last residues in S6 (H90 in MthK) and first residues in the RCK domain. The specific structure of the linker connecting these residues is unknown. The distance between residues in different S6 helices is 26 Å. B, β2 subunits contain two transmembrane segments (TM1 and TM2), an extracellular loop with eight cysteine residues (4 orange circles correspond to cysteines shared with β1, β3, and β4 subunits; 4 orange boxes correspond to cysteines shared with β3 and β4), and a cytosolic N and C terminus. Basic residues on the cytosolic side are given as red circles, and basic residues delimiting transmembrane segments are also indicated. The larger blue circles indicate the FIW motif essential for β2 inactivation. C, Removal of inactivation by 0.1 mg/ml trypsin in wild-type α + β2 currents is essentially complete within ∼100 s. Currents were monitored by the indicated protocol with voltage steps to +150 mV with 10 μm Ca2+. Trypsin was applied for timed periods only between test steps. Times indicate cumulative periods of trypsin application. D, The fractional restoration of non-inactivating steady-state current from traces as in C is plotted as a function of trypsin (0.1 mg/ml) treatment time for a set of five patches. Recovery time course was fit with Equation 1, yielding a digestion time constant of τd = 38.0 ± 1.5 s, with n constrained to 2.0.
BK channels contain a large cytosolic domain appended to the pore-forming elements of the channel (Butler et al., 1993; Xia et al., 2004). Given that the cytosolic domain of BK channels shares homology with the cytosolic domain of the MthK channel (Jiang et al., 2002a), similarities in side portal architecture and the linkage between pore and cytosolic domain may exist. Inactivation of BK channels is mediated by N-terminal segments of auxiliary β subunits (Wallner et al., 1999; Xia et al., 1999, 2000, 2003). Previous work using artificial N termini in which polymeric amino acid chains of different length tether a hydrophobic inactivation motif to a β2 subunit has defined a minimal length of the N terminus that is necessary to permit inactivation (Xia et al., 2003). The short length of inactivation-competent N termini coupled with the large size of the BK cytosolic domains imply that IDs access their blocking site by passage through side portals. To examine constraints that side portals may play in defining accessibility on IDs or other molecules to the BK channel pore, here we examined the ability of trypsin to attack basic residues (i.e., arginine and lysine) in both the native β2 N terminus and the artificial N termini appended to the β2 subunit. By exploiting the fact that inactivation results in protection from digestion by trypsin, the results show that side portals, by excluding entry of trypsin, define a protected antechamber at the cytoplasmic end of the pore. Furthermore, when channels are in resting states, the results require that passage of IDs through side portals occurs readily, but only a single ID can occupy the antechamber at a time. Thus, for BK channels, side portal access and the dimensions of the antechamber may strongly influence several important functional properties of the channel.
Materials and Methods
Oocyte removal and culture.
Stage IV Xenopus laevis oocytes were harvested and used for cRNA injection as described previously (Xia et al., 1999, 2002). mSlo1 α and hβ2 cRNA were prepared at ∼1 μg/μl, and, after initial dilution of the α cRNA to 1:20 by volume, the injection solution was prepared at cRNA ratios of 1:2 (α/β2). Currents were recorded within 3–5 d.
Constructs and mutations.
The mSlo1 construct (GenBank accession number NP_034740) was identical to that in previous work (Xia et al., 1999, 2002) (L. Salkoff, Washington University School of Medicine, St. Louis, MO). Wild-type human β2 subunit (GenBank accession number NP_852006) was as described previously (Xia et al., 1999). Some of the mutated hβ2 constructs have been mentioned previously (Xia et al., 2003), whereas preparation of new hβ2 N-terminal mutations followed previously published procedures (Xia et al., 2003).
Electrophysiology.
Currents were recorded in the inside-out configuration (Hamill et al., 1981) using an Axopatch 200 amplifier (Molecular Devices, Sunnyvale, CA) and the Clampex program (Molecular Devices). Patch-clamp recording pipettes were made from borosilicate capillary tubes, had resistances of 1–3 MΩ, and were coated with Sylgard (Sylgard 184; Dow Corning, Midland, MI) before final remelting of the tip with a microforge.
Gigaohm seals were formed in frog Ringer's solution (in mm: 115 NaCl, 2.5 KCl, 1.8 CaCl2, and 10 HEPES, pH 7.4). The standard pipette/extracellular solution contained the following (in mm): 140 K-methanesulfonate, 20 KOH, 10 HEPES, and 2 MgCl2, pH 7.0. Solutions bathing the cytosolic membrane contained the following (in mm):140 potassium methanesulfonate, 20 KOH, 10 HEPES(H+), and either 5 EGTA (for nominally 0 Ca2+) or 5 N-(2-hydroxyethyl)ethylenediaminetriacetic acid (with Ca2+ added to make 10 μm free Ca2+). The latter solution was calibrated with a Ca2+-sensitive electrode using commercial Ca2+ calibration solutions (World Precision Instruments, Sarasota, FL). Excised patches were bathed in continuously flowing streams from a multibarrel local application system. Experiments were at ∼22–25°C. Salts were obtained from Sigma (St. Louis, MO).
Trypsin application methods.
Trypsin for all illustrated experiments was from porcine pancreas (type IX-S, catalog #T0303, chymotrypsin <1 U/mg protein; Sigma). Three different lots of T0303 were used. We also tested bovine pancreatic trypsin specifically treated with N-tosyl-l-phenylalanyl chloromethylketone (TPCK) to reduce chymotrypsin activity (Sigma catalog #T8802; chymotrypsin <0.1 N-benzoyl-l-tyrosine ethyl ester U/mg protein). No obvious differences between T0303 and T8802 were observed. A β2 N terminus in which all basic residues were neutralized to Q (β2–10Q) exhibited similar resistance to digestion by either T0303 and the TPCK-treated T8802. In contrast, porcine pancreatic trypsin (catalog #22715; United States Biochemicals, Cleveland, OH) resulted in rapid removal of inactivation of β2–10Q, indicative of chymotrypsin contamination.
Control experiments (supplemental Fig. 1, available at www.jneurosci.org as supplemental material) established that 0.1 mg/ml is on a linear portion of the relationship between the rate of trypsin-mediated removal of inactivation and [trypsin]. Furthermore, we were concerned that autodigestion by trypsin after initial preparation of a trypsin solution might alter the initial effective trypsin concentration among experiments. To minimize this concern, trypsin solutions were maintained on ice as long as possible before addition to the syringe reservoirs. Furthermore, in contrast to previous studies in which 0.5 mg/ml trypsin was used to remove inactivation (Solaro and Lingle, 1992; Xia et al., 1999), we used 0.1 mg/ml to minimize the concentration-dependent autodigestion process. By measuring the rates of removal of inactivation produced by nominal solutions of 0.1 mg/ml trypsin that were incubated for different periods of time at room temperature, we also established that, even for a 2 h period of autodigestion, the change in effective digestion rate is only ∼10–15% (supplemental Fig. 1, available at www.jneurosci.org as supplemental material).
Peak and steady-state BK current were monitored by 160 or 200 ms test steps to +150 mV after a 30–50 ms preconditioning step to −140 mV in the presence of 10 μm Ca2+. Between sets of test steps to monitor BK current, trypsin was applied for timed intervals while the patch was maintained at 0 mV in 0 μm Ca2+. For test of state dependence of trypsin accessibility, trypsin was applied during various test conditions [(1) 0 Ca2+, 0 mV; (2) 0 Ca2+, −80 mV; (3) 10 μm Ca2+, 0 mV]. Although the duration of each application of trypsin was precisely controlled, we cannot be sure of the precise time course of wash-in and washout of trypsin from the patch. For most experiments, trypsin was washed out from the patch for 5–10 s before voltage protocols to test BK current status. However, in experiments comparing use dependence of trypsin accessibility, care was taken to ensure that each patch was maintained in the particular test condition for at least 15 s after trypsin washout before test steps to monitor BK status were initiated. In all cases, voltage steps to monitor the status of BK current were applied only in the absence of trypsin and between successive trypsin applications. Trypsin application times represent the cumulative time of trypsin application.
Data analysis.
Analysis of current recordings was accomplished with either Clampfit (Molecular Devices) or programs written in this laboratory.
Rates of trypsin removal of inactivation were fit with the following function (Ding et al., 1998; Wang et al., 2002):
where Imax is the maximal outward current observed after removal of inactivation, τd is the time constant of the removal process, and n is a power factor. This function postulates that a single ID is sufficient for inactivation, but that n domains per channel must be cleaved by trypsin to remove inactivation (Ding et al., 1998; Wang et al., 2002). Empirically optimal fits to recovery time courses among different patches and datasets were obtained with n of ∼1.8–3.0. For initial comparisons of differences in τd among constructs, we constrained n = 2 to minimize the effect of random errors in n on estimates of τd. However, values of τd with n unconstrained are also reported. We also measured τd and n from individual patches and determined the mean and SD for those parameters for all patches for a particular construct. Overall, the mean τd estimated from the set of individual patches agreed well with that estimated from fitting the averaged data. Not unexpectedly, the mean n estimated from individual patches resulted in slightly larger estimates of n than estimated from fitting the averaged data but consistent with the general conclusions regarding the power term given in the text. Error limits on fitted estimates reflect the 90% confidence limit on that parameter.
Modeling of the trypsin-mediated removal of inactivation.
To model the trypsin-mediated removal of inactivation, the macroscopic simulation capabilities of the QUB software suite was used (State University of New York–Buffalo, Buffalo, NY). Parameters for all steps in the models were based on previous studies of BK activation and inactivation. The steady-state dependence of inactivation and inactivation on Ca2+ and voltage has been reasonably well defined for α + β2 channels (Ding and Lingle, 2002). Because both rates of inactivation and digestion by trypsin are slow relative to any transitions between closed (C) and open (O) states, the exact rates of closed–open gating transitions are not critical. Values for the channel opening rate, ko, and channel closing rate, kc, were chosen to yield open probabilities (Po) expected for our experimental conditions (see Table 3) and absolute rates were chosen to be in accordance with previous measurements of current activation and deactivation (Zhang et al., 2001; Horrigan and Aldrich, 2002). The microscopic rate of trypsin digestion of a single ID (kt) was set at 0.04 to yield a predicted time course for digestion by trypsin of τd = 25.0 s with a cooperativity factor of 4 (see Fig. 4E). The rates for onset and recovery from inactivation are based on previous information about the inactivation rates and steady-state open probability of α + β2 channels (Xia et al., 1999; Wang et al., 2002; Benzinger et al., 2006), for which the Po for α + β2 channels at 10 μm Ca2+ is ∼0.05 at −80 mV, ∼0.8 at 0 mV, and >0.95 at +60 mV (Xia et al., 1999). We assume that intrinsic inactivation rate, ki, is negligibly voltage dependent, being ∼12.5 s−1 (Xia et al., 1999; Wang et al., 2002). Steady-state inactivation data at 10 μm Ca2+ suggest that the probability of being inactivated (Pi) is ∼0.2 at −80 mV and ∼0.98 at 0 mV (Ding and Lingle, 2002). We have therefore adjusted the intrinsic rate of recovery from inactivation (kr) to yield a Pi consistent with previous observations (Wang et al., 2002). A full model accounting for protection against trypsin digestion both by inactivation and during resting conditions is given in the supplemental data (supplemental Fig. 2, available at www.jneurosci.org as supplemental material). Simulations using this full model are consistent with the partial models evaluated in the text.
Table 3.
Parameters for simulation of removal of inactivation by trypsin
| Condition | ko(s−1) | kc(s−1) | Po | ki (s−1) | kr(s−1) | Pi | kt* (s−1) | τd (s) | n |
|---|---|---|---|---|---|---|---|---|---|
| 0 Ca2+, 0 mV | 50 | 5000 | 0.01 | 12.5 | 1 | 0.93 | 28.0 | 3.95 | |
| 10 Ca2+, −80 mV | 50 | 950 | 0.05 | 12.5 | 50 | 0.2 | 25.3 | 4.00 | |
| 10 Ca2+, 0 mV | 2000 | 500 | 0.8 | 12.5 | 5 | 0.71 | 63.2 | 2.84 | |
| 10 Ca2+, +60 mV | 9800 | 200 | 0.98 | 12.5 | 0.2 | 0.98 | 1422.6 | 1.16 | |
| 10 Ca2+, 0 mV | 2000 | 500 | 0.8 | 12.5 | 1 | 0.93 | 225.8 | 1.64 | |
| 10 Ca2+, 0 mV | 2000 | 500 | 0.8 | 12.5 | 0.2 | 0.98 | 1140.5 | 1.19 | |
| 10 Ca2+, 0 mV | 2000 | 500 | 0.8 | 12.5 | 0.02 | 0.998 | 11443 | 1.05 | |
| Inactivated ID can be cleaved | |||||||||
| 0 Ca2+, 0 mV | 50 | 5000 | 0.01 | 12.5 | 1 | 0.93 | 0.004 | 27.8 | 3.94 |
| 10 Ca2+, −80 mV | 50 | 950 | 0.05 | 12.5 | 50 | 0.2 | 0.004 | 25.7 | 4.00 |
| 10 Ca2+, 0 mV | 2000 | 500 | 0.8 | 12.5 | 5 | 0.71 | 0.004 | 54.6 | 3.07 |
| 10 Ca2+, +60 mV | 9800 | 200 | 0.98 | 12.5 | 0.2 | 0.98 | 0.004 | 174.6 | 1.83 |
| 10 Ca2+, 0 mV | 2000 | 500 | 0.8 | 12.5 | 1 | 0.93 | 0.004 | 108.3 | 2.24 |
| 10 Ca2+, 0 mV | 2000 | 500 | 0.8 | 12.5 | 0.2 | 0.98 | 0.004 | 169.6 | 1.85 |
| 10 Ca2+, 0 mV | 2000 | 500 | 0.8 | 12.5 | 0.2 | 0.98 | 0.002 | 305.0 | 1.52 |
| 10 Ca2+, 0 mV | 2000 | 500 | 0.8 | 12.5 | 0.2 | 0.98 | 0.0004 | 714.4 | 1.3 |
| 10 Ca2+, 0 mV | 2000 | 500 | 0.8 | 12.5 | 0.02 | 0.998 | 0.004 | 198.4 | 1.74 |
| 10 Ca2+, 0 mV | 2000 | 500 | 0.8 | 12.5 | 0.02 | 0.998 | 0.002 | 407.44 | 1.43 |
| 10 Ca2+, 0 mV | 2000 | 500 | 0.8 | 12.5 | 0.02 | 0.998 | 0.0004 | 1720.3 | 1.18 |
Parameters for different simulations are given in columns 2–8, whereas values obtained from fitting Equation 1 to the simulated time course are given in columns 9–10. Bold conditions in column 1 correspond to simulations displayed on Figure 6.
Figure 4.
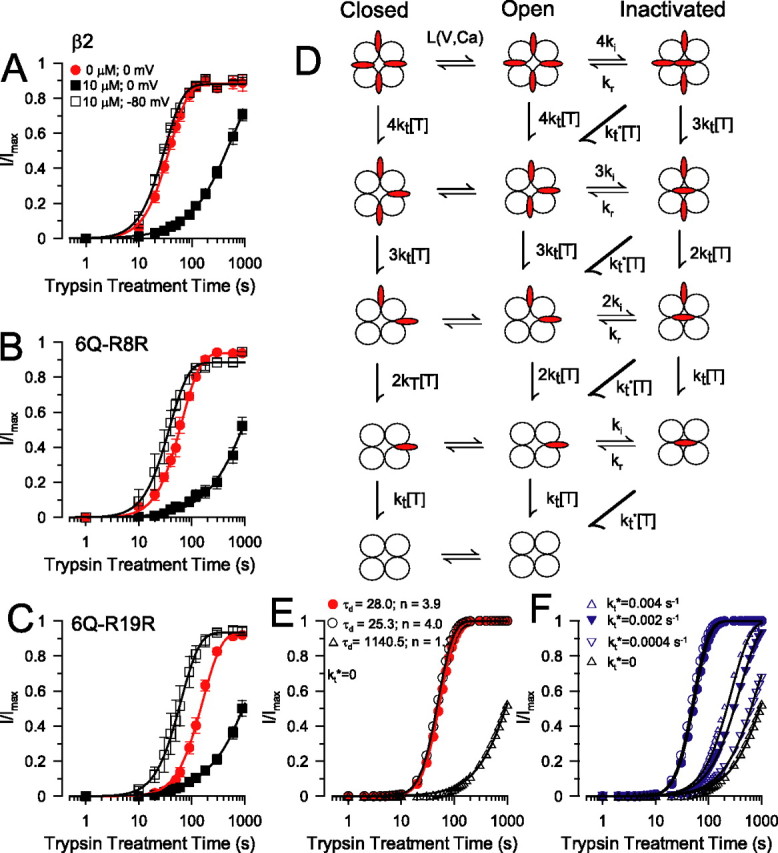
Inactivation protects against digestion by trypsin. A, The time course of removal of inactivation by 0.1 mg/ml trypsin in wild-type α + β2 channels was examined under three conditions: first, 0 mV, 0 μm Ca2+ (τd = 26.8 ± 0.5 s, n = 2; 5 patches) (note that this was a different set of patches from those shown in Fig. 1D); second, 0 mV, 10 μm Ca2+ (τd = 522.0 ± 43.7 s; n = 0.98 ± 0.03; 6 patches); third, −80 mV, 10 μm Ca2+ (τd = 21.7 ± 0.8 s; n = 2; 4 patches). B, The state dependence of removal of inactivation of the 6Q–R8R construct is displayed. Fitted curves correspond to the following: for 0 mV, 0 μm Ca2+, τd = 43.9 ± 1.4 s, n = 2, 4 patches; for 0 mV, 10 μm Ca2+, τd = 1205.3 ± 148.4 s, n = 0.91 ± 0.08, 6 patches; for −80 mV, 0 μm Ca2+, τd = 26.0 ± 0.6 s, n = 2, 5 patches. C, The state dependence of removal of inactivation of the 6Q–R19R construct is illustrated. Fitted curves correspond to the following: for 0 mV, 0 μm Ca2+, τd = 110.6 ± 4.2 s, n = 2, 4 patches; for 0 mV, 10 μm Ca2+, τd = 1268.1 ± 70.8 s, n = 0.94 ± 0.04, 4 patches; for −80 mV, 0 μm Ca2+, τd = 43.7 ± 0.7 s, n = 2, 4 patches. D, The model depicts a simple three-state inactivation process (C–O–I) with the addition of four independent trypsin cleavage steps to remove inactivation. Inactivation domains are indicated in red. The closed–open equilibrium is defined by L(V) with opening and closing rates, ko and kc, respectively. Inactivation onset for a single ID is defined by ki, and recovery from inactivation is defined by kr. kt defines the rate of cleavage of a single ID by trypsin (at 0.1 mg/ml). Diagonal transitions allow the inclusion, in some simulations, of a finite rate of digestion of an inactivated ID (kt*). E, The predicted time course of removal of inactivation was determined from the model for different activation conditions that approximate actual experimental conditions. Microscopic rates were chosen based on known properties of activation, inactivation, and trypsin digestion to approximate various experimental conditions (Table 3). The recovery time course is plotted for three conditions: (1) 0 mV, 0 Ca2+ (τd = 28.0 s; n = 3.9); (2) 0 mV, 10 μm Ca2+ (τd = 1140.5 s; n = 1.10); (3) −80 mV, 10 μm Ca2+ (τd = 25.3 s; n = 4.0). Values of τd and n were based on fits of Equation 1 to the simulated recovery time course. F, The consequences of finite digestion rates of inactivated IDs (kt* >0) is illustrated. Recovery time was examined when kt* was 10-, 20-, and 100-fold less than the digestion rate of resting IDs. Only when kt* ≪ kt is the predicted recovery time course consistent with the actual effects of trypsin observed in A–C. Filled and open circles correspond to the resting conditions shown in E.
Structural models.
Comparison of the structures of β2 (1JO6) (Bentrop et al., 2001), MthK (1LNQ) (Jiang et al., 2002a), and porcine pancreatic trypsin A-chain (1AVW) (Song and Suh, 1998) was done with VMD and PyMOL (DeLano, 2002).
Results
Trypsin removes inactivation of wild-type β2 subunits
The β2 subunit, like other BK β subunits (Knaus et al., 1994; Orio et al., 2002), contains two transmembrane segments (TM1 and TM2), an extracellular loop connecting TM1 and TM2, and both a cytosolic N terminus and a cytosolic C terminus (Fig. 1B). The β2 N terminus contains 45 residues with a total of 10 basic residues (Table 1). Residue 46, denoting the boundary between TM1 and the cytosolic N terminus, is also basic but not considered here. Trypsin at 0.1 mg/ml gradually removes inactivation of α + β2 currents (Fig. 1C). The time course of removal of inactivation (Fig. 1D) was fit with an equation assuming that complete removal of inactivation requires digestion of multiple IDs per channel (Wang et al., 2002) [(I(t)/Imax = (1 − exp(−t/τd))n] (Eq. 1, see Materials and Methods). When n = 4, the time constant (τd) derived from fitting Equation 1 approximates the microscopic rate of digestion of a single ID of the four per channel. For this set of patches, τd for α + β2 channels was 38.0 ± 1.5 s, assuming a power factor, n, of 2.0 (Table 2). With no constraint on n, τd = 35.1 ± 4.2 s and n = 2.23 ± 0.39.
Table 1.
Sequences of the human β 2 N terminus and mutated N termini
| 1 | 11 | 21 | 31 | 41 | |
|---|---|---|---|---|---|
| β2 | FIWTSGRTS | SSYRHDEKRN | IYQKIRDHDL | LDKRKTVTAL | KAGEDRAILL |
| 6Q | FIWTSGQTS | SSYQHDEQQN | IYQQIQDHDL | LDKRKTVTAL | KAGEDRAILL |
| 10Q | FIWTSGQTS | SSYQHDEQQN | IYQQIQDHDL | LDQQQTVTAL | QAGEDRAILL |
| β2–6QR8R | FIWTSGRTS | SSYQHDEQQN | IYQQIQDHDL | LDKRKTVTAL | KAGEDRAILL |
| FIW30Q | FIW | QQQQQQQQQQ | QQQQQQQQQQ | QQQQQQQQQQ | RAILL |
| FIW–KK28Q | FIW | KKQQQQQQQQ | QQQQQQQQQQ | QQQQQQQQQQ | RAILL |
| FIW–2QKK27Q | FIW | QQ-KKQQQQQ | QQQQQQQQQQ | QQQQQQQQQQ | RAILL |
The beginning of the first transmembrane segment is underlined. The bottom three are examples of artificial N termini.
Table 2.
Time constants (τd) of trypsin-mediated removal of inactivation
| Construct | τd ± 90% cl (s) | τd ± 90% cl (s) | n ± 90% cl (s) |
|---|---|---|---|
| β2 | 38.0 ± 1.5 | 35.1 ± 4.2 | 2.23 ± 0.39 |
| (26.8 ± 0.6) | (25.3 ± 1.7) | (2.20 + 0.23) | |
| 6Q–R8R | 43.9 ± 1.4 | 50.4 ± 3.8 | 1.7 ± 0.15 |
| 10Q–R8R | 40.3 ± 3.1 | 29.2 ± 5.8 | 3.19 ± 1.02 |
| 6Q–R19R | 110.6 ± 4.2 | 90.0 ± 2.7 | 2.60 ± 0.10 |
| 10Q–R19R | 34.5 ± 1.9 | 34.5 ± 5.8 | 2.01 ± 0.44 |
| Σ(6Q–R8R,6Q–R19R) | 31.4 | ||
| 6Q–R14R | 687.0 ± 31.1 | 857.1 ± 125.4 | 1.55 ± 0.23 |
| 10Q–R14R | 1299.2 ± 41.0 | 913.3 ± 106.2 | 2.86 ± 0.38 |
| 6Q–K18K | 661.7 ± 59.9 | 733.6 ± 44.0 | 1.88 ± 0.15 |
| 6Q–K24K | 1433.54 ± 37.6 | 1734.3 ± 212.0 | 1.72 ± 0.15 |
| 6Q–R26R | 1869.8 ± 170.0 | 4153.1 ± 2988 | 1.22 ± 0.40 |
| 10Q–R26R | 784.8 ± 26.5 | 637.5 ± 65.1 | 2.60 ± 0.36 |
| β2–R8Q,R19Q | 196.6 ± 12.0 | 158.9 ± 11.3 | 2.68 ± 0.27 |
| Σ(R14,K18,K24,R26) | 238.1 | ||
| β2–6Q | 2854.6 ± 220.3 | ||
| 10Q–K33K | 3195.3 ± 146.9 | ||
| 10Q–R34R | 2558.5 ± 141 | ||
| 10Q–K35K | 3406.0 ± 881.0 |
In column 2, τ d was determined from fitting Equation 1 to cumulative recovery data with n constrained to 2.0. cl reflects the 90% confidence limit on the fitted estimate of τ d. Column 3 provides values of τ d with n unconstrained, and column 4 provides the estimate for n.
For all constructs, three to seven patches were used to define the time course of digestion by trypsin.
Σ (6Q–R8R,6Q–R19R), in bold, is the predicted rate of digestion for 6Q–R8R,R19R based on the sum of the rates for 6Q–R8R and 6Q–R19R. This is compared to wild-type β2, also in bold.
Σ (R14,K18,K24,R26), in bold, is the calculated rate of digestion based on the sum of the rates for 6Q–R14R, 6Q–K18K, 6Q–K24K, and 6Q–R26R. This is compared to β2–R8Q,R19Q, also in bold, which contains the same four charged residues.
Additional values in parentheses for β 2 reflect a second set of patches obtained at a different time.
Mapping trypsin cleavage sites in the β2 N terminus
We first define the trypsin accessibility of basic residues in the native β2 N terminus. A mutated β2 N terminus in which the first six basic residues are changed to Q (Table 1, 6Q) still supports inactivation and is almost completely insensitive to 0.1 mg/ml trypsin (Fig. 2A,B). Similarly, a 10Q construct (Table 1) is resistant to digestion by trypsin (Fig. 2B). Thus, the four basic residues closest to TM1 are protected, and trypsin sensitivity of the wild-type β2 subunit results from attack on all or some of residues R8, R14, K18, R19, K24, or R26.
Figure 2.
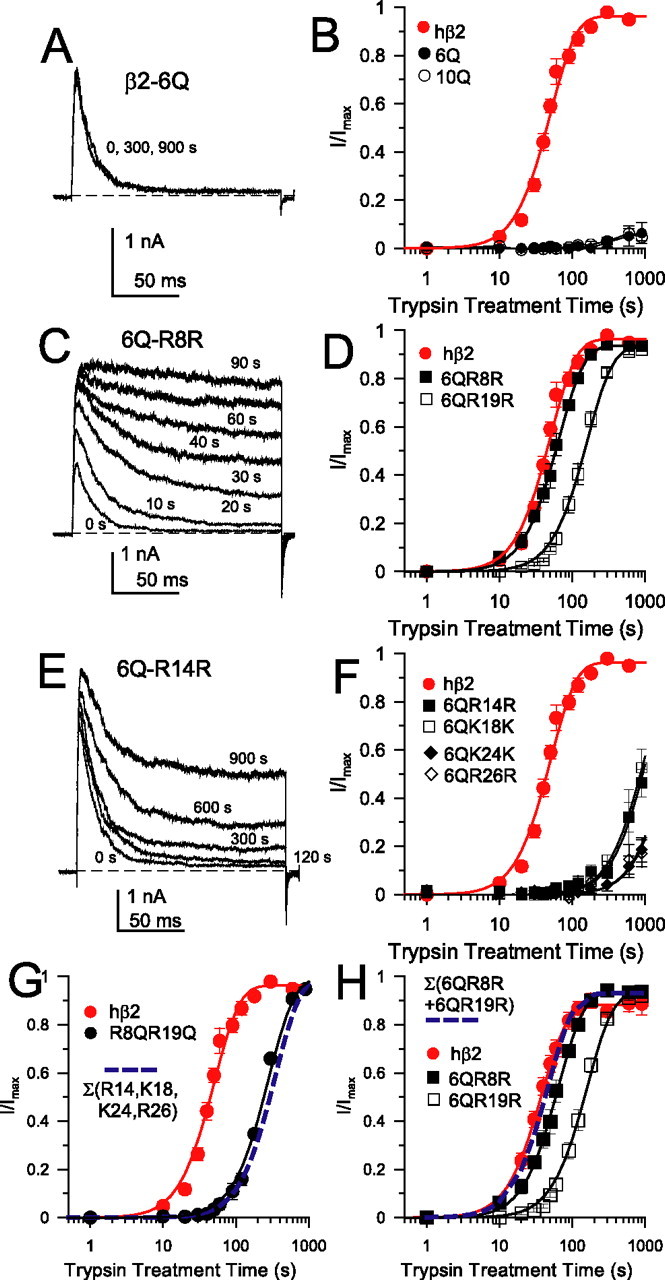
Differential sensitivity to trypsin of basic residues in the β2 N terminus. A, An N terminus with the first six basic residues neutralized to glutamine (β2–6Q) is resistant to digestion by trypsin. Currents were activated by voltage steps to +150 mV with 10 μm Ca2+. Application of 0.1 mg/ml trypsin for up to 900 s had no effect on inactivation. B, The time course of removal of inactivation for wild-type β2 subunits is compared with β2–6Q and β2–10Q constructs. For B, D, and F, each point represents the mean and SE for four to six patches. C, Trypsin readily removes inactivation in an N terminus in which the only basic residue of the first six in the N terminus is R8 (β2–6Q–R8R). Currents were activated by steps to +150 mV with 10 μm Ca2+. Numbers indicate the cumulative time of application of 0.1 mg/ml trypsin. D, The time course of removal of inactivation by trypsin for the 6Q–R8R and 6Q–R19R constructs is similar to wild-type β2 sensitivity. Solid lines are fits of Equation 1, with values summarized in Table 1. E, The 6Q–R14R construct exhibits much weaker sensitivity to trypsin. Currents were activated as in A and C. F, The time course of trypsin-mediated removal of inactivation for constructs 6Q–R14R, 6Q–K18K, 6Q–K24K, and 6Q–R26R is compared with wild-type β2. Solid lines are fits of Equation 1 with values given in Table 2. G, Trypsin-mediated removal of inactivation is shown for wild-type β2 (τd = 38.0 ± 1.5 s) and for the β2–R8QR19Q construct (τd = 196.6 ± 12.0 s). Solid lines through the points represent the best fit of Equation 1 with n = 2. The blue line is the predicted time course based on the sum of the rates of digestion for the four basic residues still present in β2–R8QR19Q, based on the measured rates of digestion of 6Q–R14R, 6Q–K18K, 6Q–K24K, and 6Q–R26R (τd = 238.1 s). H, The rates of digestion for 6Q–R8R and 6Q–R19R were shown along with the predicted digestion time course for a construct with both residues (blue line). The predicted rate of digestion for a construct containing both sensitive residues is similar to the wild-type β2 digestion rate, consistent with the idea that the overall digestion rate for β2 is defined solely by accessibility of R8 and R19.
Using a library of mutated β2 constructs (supplemental Table 1, available at www.jneurosci.org as supplemental material), we found that mutated N termini containing only a single target basic residue exhibited marked differential sensitivity to trypsin (Fig. 2). Constructs 6Q–R8R (Table 1, only R8 remains charged) (τd = 43.9 ± 1.4 s) and 6Q–R19R (τd = 110.6 ± 4.2 s) exhibited a trypsin sensitivity comparable with the wild-type N terminus (τd = 38.0 ± 1.5 s) (Fig. 2C,D). However, 6Q–R14R, 6Q–K18R, 6Q–R24R, and 6Q–K26K were relatively resistant to digestion by trypsin (Fig. 2E,F; Table 2) but were more sensitive to trypsin than the 6Q construct. Comparable results were obtained when only a single basic residue was preserved within the 10Q background. Thus, preferential attack on residues R8 and R19 appears primarily responsible for removal of inactivation in native wild-type β2 subunits. In support of this, in the β2–R8QR19Q construct, containing eight basic residues but lacking R8 and R19, the rate of trypsin removal of inactivation (τd = 196.6 ± 12.0 s) was approximately fivefold slower than for the wild-type β2 N terminus (Fig. 2G). Thus, the simultaneous presence of R14, K18, K24, and R26 results in trypsin sensitivity less than in constructs containing either R8 or R19 alone.
Several factors suggest that it is unlikely that mutationally caused structural changes account for the differential sensitivities we observe. First, the similarity of τd for cleavage of particular basic residues in either the 6Q or 10Q backgrounds suggests that mutation at positions 33, 34, 35, and 41 does not alter trypsin accessibility of other basic residues. Second, the observed τd of cleavage of β2–R8QR19Q (196.6 s) is in close agreement with that calculated (238.1 s) based on the sum of the individual rates of the other four trypsin-sensitive residues. This additivity suggests that individual mutations to glutamine do not significantly alter global structure. Similarly, the sum of the measured cleavage rates of 6Q–R8R and 6Q–R19R results in a predicted τd (31.4 s) (Table 2) similar to that of the wild-type τd (38.0 and 26.8 s for two sets of patches) (Fig. 2H). This additivity suggests that accessibility of R8 and R19 is not markedly altered in the 6Q (or 10Q) constructs.
Accessibility of lysine residues to digestion by trypsin in artificial N termini
The differential trypsin digestibility of basic residues in the β2 N terminus may arise from either specific structural characteristics of the N terminus or restrictions on access of the ∼20 kDa trypsin molecule to small volumes. We therefore examined the position dependence of trypsin sensitivity of basic residues inserted into artificial N termini. The critical inactivation motif, MFIW, was connected to TM1 by a linear chain of polyglutamines (poly-Q) (Xia et al., 2003) with two consecutive lysine residues inserted at different positions in the chain (Table 1) (supplemental Table 1, available at www.jneurosci.org as supplemental material). All constructs examined exhibited robust inactivating currents (Fig. 3). FIW–6QKK22Q represents a construct with the KK distant from TM1 and close to the MFIW motif (Fig. 3A). FIW–20QKK6Q positions the KK motif nearer to TM1 (Fig. 3B). FIW–27QKK has the KK pair immediately adjacent to TM1 (Fig. 3C). FIW–30Q contains no KK motif (Fig. 3D). When the poly-Q spacer between TM1 and KK is six or more residues, the time course of removal of inactivation by trypsin is comparable with removal of inactivation of wild-type β2 (Fig. 3E,G). At poly-Q spacings of 4, 2, or 0, removal of inactivation by trypsin still occurs but at rates approximately an order of magnitude less (Fig. 3F,G) than for spacings of 6–27 and comparable with rates of digestion of the relatively insensitive residues in the native β2 N terminus (as summarized in Fig. 3G). This residual effect of trypsin solely reflects digestion at the KK residues, because construct FIW–30Q without any charged residues is completely resistant to digestion by trypsin (Fig. 3D,F). The absence of specificity in digestion of the artificial N termini argues that specificity in cleavage of the β2 N terminus may arise from specific structural characteristics of the N terminus (Fig. 3H).
Figure 3.
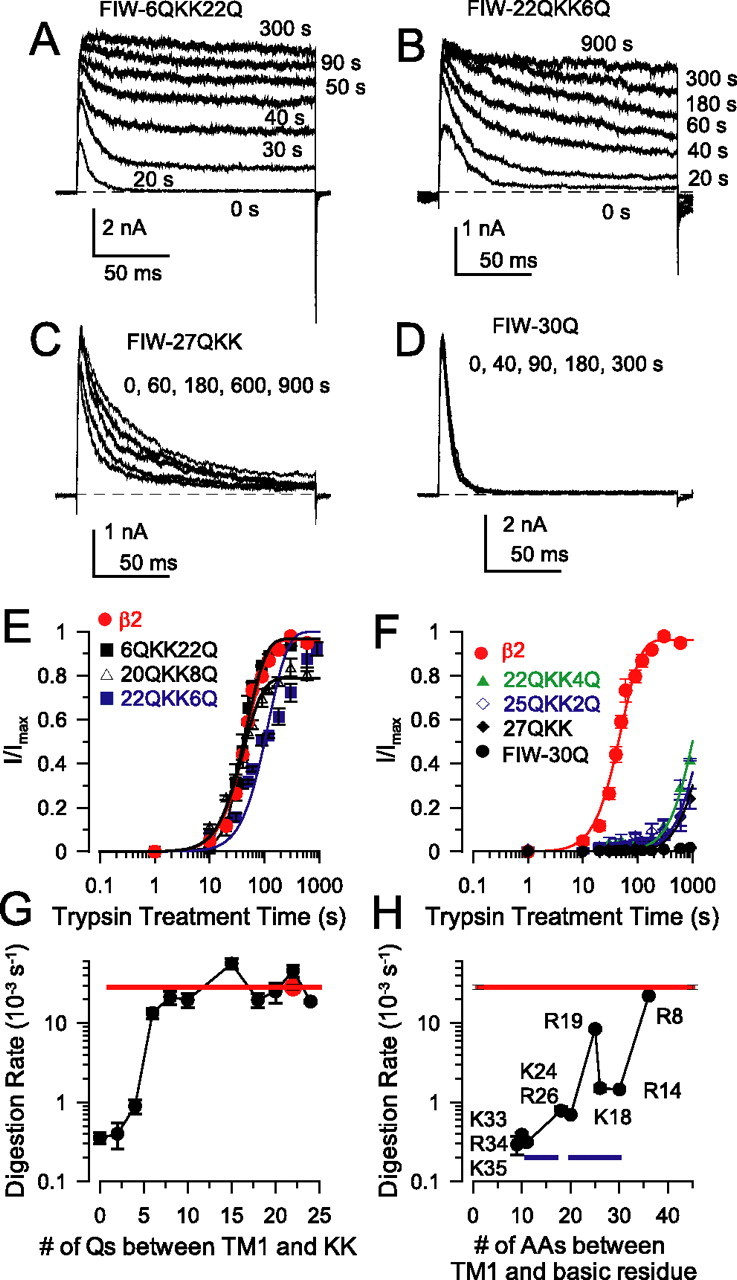
Trypsin readily cleaves basic residues in an artificial linker. A, Example traces show removal of inactivation for a β2 subunit with an artificial N terminus comprising FIW–6QKK22Q preceding TM1. B, Trypsin readily removes inactivation for the FIW–22QKK6Q construct with basic residues near TM1. C, With basic residues immediately abutting TM1 (FIW–27QKK), removal of inactivation by trypsin is slowed but still occurs. D, An N terminus lacking basic residues (FIW–30Q) is completely resistant to digestion by trypsin. E, The time course of removal of inactivation for artificial N termini with basic residues separated from TM1 by six or more residues is comparable with digestion of wild-type β2. F, With basic residues near TM1, the trypsin removal of inactivation is slowed but not abolished. Line represent fits of Equation 1, assuming recovery to ∼0.9 with n = 2. G, For N termini with a poly-Q linker, the rate of trypsin-mediated digestion of inactivation domains depends on the spacing between the paired basic residues and TM1. Each point represents the reciprocal of the fitted τd based on sets of at least four patches for each construct. The red line indicates the wild-type β2 digestion rate. H, The digestion rates for individual basic residues in the wild-type β2 N terminus are plotted as in G. Blue lines indicate segments thought to be α helical, probably resulting in protection against digestion.
Inactivation protects against digestion at positions R8 and R19
During inactivation, the N termini presumably undergo a relatively large conformational movement, perhaps conferring state-dependent changes in trypsin accessibility. We biased the channel population between either a resting condition or an inactivated condition by manipulation of holding potential, cytosolic Ca2+, or both. At 0 Ca2+ and 0 mV or 10 μm Ca2+ and −80 mV, most channels will occupy resting, closed states, whereas at 0 mV and 10 μm Ca2+, most channels will be inactivated at steady state (Ding and Lingle, 2002).
In wild-type β2 N termini, digestion by trypsin at 10 μm Ca2+ and 0 mV is slowed relative to removal of inactivation at 0 Ca2+ and 0 mV or 10 μm Ca2+ and −80 mV (Fig. 4A). These results suggest that residues R8 and R19 are more resistant to attack by trypsin when the channels are inactivated. Similar to β2, 10 μm Ca2+ at 0 mV also produced a slowing of τd for 6Q–R8R (Fig. 4B) and 6Q–R19R (Fig. 4C). The protection of residue R8 may not seem surprising, because it may occupy a position relatively protected within the ion permeation pathway. However, the protection of residue R19 suggests that even this portion of the N terminus undergoes marked structural or positional changes during inactivation. The possibility that the trypsin sensitivity of other residues changes during inactivation is excluded by the fact that the protection observed for the native β2 N terminus is similar to that observed for 6Q–R8R and 6Q–R19R. If R14, K18, K24, or R28 were significantly more sensitive to attack by trypsin, we would expect that the native β2 N terminus should not show a marked state-dependent protection.
When inactivated, inactivation domains may be completely resistant to digestion by trypsin
The half-time for removal of inactivation changes >10-fold between channels primarily in resting states compared with channels in inactivated states. Because binding of a single ID causes inactivation (Wang et al., 2002), under inactivating conditions, the four IDs per channel are in equilibrium among activated, pre-inactivated, and inactivated states. Perhaps three of the IDs still remain trypsin accessible, although one particle is protected. To test this idea, we evaluated a physically plausible model of inactivation and digestion by trypsin (Fig. 4D). We assume that trypsin-mediated digestion of each ID (kt) occurs independently and does not change between resting closed states and open states. However, when an ID produces inactivation, it is completely protected from digestion by trypsin.
Using sets of gating parameters for channel activation and inactivation defined from other experimental work (supplemental data, available at www.jneurosci.org as supplemental material), this digestion process was simulated. The appearance of channels in states with completely digested N termini then defines the time course of removal of inactivation by trypsin. Using Equation 1, the empirical τd and n for the simulated digestion time course was then determined (Table 3). A condition that favors inactivation (0 mV, 10 μm Ca2+) resulted in a slowing of the trypsin-mediated removal of inactivation with an increase in τd and reduction in n, approaching a theoretical limit of 1.0 (Fig. 4E). Based on parameters that approximate the three conditions we studied (Table 3) (supplemental information, available at www.jneurosci.org as supplemental material), the simulated digestion time course at 0 mV and 0 Ca2+ is similar to that at −80 mV and 10 μm Ca2+. At 0 mV and 10 μm Ca2+, a marked shift in digestion time course is predicted (Fig. 4E; for values, see Table 3). Based on reasonable parameter estimates for activation and inactivation rates, this model provides a good approximation of the experimental observations.
Before accepting the conclusion that an inactivated ID is completely protected from digestion by trypsin, we modified the model to assume a finite rate of digestion of an inactivated ID. Specifically, kt*, the intrinsic rate of digestion of an inactivated ID, was set to values 10-fold (0.04 s−1), 20-fold (0.02 s−1), and 100-fold (0.004 s−1) slower than the digestion rate of an ID in non-inactivated conformations (Fig. 4F). Even with kt* = kt/10, the predicted time course of removal of inactivation is much faster than what is observed experimentally. Thus, the intrinsic rate of digestion of inactivated IDs is probably substantially more than an order of magnitude slower than for resting IDs. We conclude that residues R8 and R19, when in the inactivated configuration, are completely resistant to digestion by trypsin.
The state dependence of R19 is somewhat surprising given its distance from the MFIW inactivation motif, because R19 seems unlikely to occupy a position deep within the pore. Two possibilities are, first, that an inactivation-dependent change in secondary structure involving R19 may reduce trypsin sensitivity or, second, that during inactivation R19 has entered a space from which trypsin is excluded. Perhaps trypsin is excluded from passing through the side portals, thereby protecting residues inside the side portals from digestion. The first possibility would predict that state dependence should be sequence specific, whereas the latter implies that state dependence would arise solely from the position of charges within the chain. We tested this by examining the state dependence of digestion of artificial N termini.
Basic residues positioned within 12 residues of the FIW motif in artificial N termini exhibit state dependence of trypsin digestion
The state dependence of trypsin digestibility was examined in six different artificial N termini each containing a pair of basic residues positioned at different separations from the FIW motif (supplemental Table 1, available at www.jneurosci.org as supplemental material). For constructs FIW–20QKK8Q (Fig. 5A) and FIW–17QKK10Q (Fig. 5B), there was no difference in the time course of trypsin-mediated removal of inactivation between 0 Ca2+, 0 mV or 10 μm Ca2+, 0 mV. For FIW–11QKK15Q (Fig. 5C), there was a suggestion of some state-dependent protection. However, constructs FIW–10QKK18Q (Fig. 5D), FIW–8QKK20Q (Fig. 5E), FIW–6QKK22Q (data not shown), and FIW–4QKK24Q (Fig. 5F) exhibited distinct inactivation-dependent protection. Only when all basic residues are within 12 residues of the tryptophan in the FIW motif is state-dependent protection against digestion observed (Fig. 5G). Thus, state dependence arises solely from the linear position of the basic residues in the chain.
Figure 5.

The state dependence of basic residue digestion in artificial N termini defines a restricted space from which trypsin is most likely occluded. A, For construct FIW–20QKK8Q–β2, inactivation does not protect the N termini from digestion by trypsin. Red symbols correspond to digestion in 0 Ca2+, 0 mV, and black symbols were obtained in 10 μm Ca2+, 0 mV. Estimates of τd and n are given in Table 4. B, For construct FIW–17QKK10Q–β2, inactivation does not protect against digestion by trypsin. C, For FIW–11QKK15Q–β2, inactivation does not appreciably protect against digestion by trypsin, although there is a suggestion of a somewhat slower component of digestion. D, For FIW–10QKK18Q–β2, application of 0.1 mg/ml trypsin in the presence of 10 μm Ca2+ at 0 mV markedly slows the removal of inactivation. E, For FIW–8QKK20Q–β2, inactivation protects against digestion by trypsin. F, For FIW–4QKK24Q, inactivation protects against digestion by trypsin. G, A linear map of the ability of inactivation to protect against digestion by trypsin for various N termini is shown. Basic residues are shown in red, the terminal orange and dark blue residues correspond to the MFIW inactivation epitope, and the three light blue residues are the beginning of TM1. On the top, FIW–12Q–TM1 corresponds to the minimal length required for an inactivation-competent artificial N terminal. Only N termini with the scissors show no protection against trypsin digestion when channels are inactivated. The vertical bar hypothesizes a barrier through which N termini pass such that, when MFIW is in its inactivated position, basic residues can no longer be attacked by trypsin. On the bottom, a hypothetical positioning of the wild-type β2 N terminus when inside this barrier is shown, with residues 10–17 and 20–30 denoted as α-helical triplets. The beginning of TM1 must be positioned close to the barrier.
This argues that, when FIW is tethered to its binding site, a basic residue at position 12 or closer to FIW resides within a space from which trypsin is physically excluded. We propose that the side portals of BK channels are small enough to prevent trypsin access to an antechamber formed within the side portals. A chain of 12 glutamines between FIW and TM1 is the minimum linker length necessary to sustain an inactivating N terminus (Fig. 5G) (Xia et al., 2003). Therefore, when the FIW–12Q–TM1 construct is fully extended, the distance between FIW to the position that TM1 exits the membrane is almost exactly the protected distance from the side portals to the binding site for FIW. Therefore, TM1 must exit the membrane in close juxtaposition to the elements that define the beginning of the narrow side entrances. To explain why residue R19 in the native β2 N terminus exhibits state dependence, we propose that the specific structure of the native β2 N terminus (e.g., α-helix, residues 10–18) positions R19 within the antechamber (Fig. 5G).
Inactivation domains transiently move in and out of the antechamber, but only one inactivation domain can occupy the antechamber at a time
One discrepancy between the model above and our experimental results is that the model predicts a power factor near 4 (in resting conditions), whereas power factors of 2–3 were measured for a variety of N termini in resting conditions. Given that inactivation results in a decrease in the power factor defined by Equation 1, this suggests that occupancy of the antechamber, independent of inactivation, might influence the power term under resting conditions. Specifically, suppose that IDs transiently move in and out through the side portals, such that for some fraction of time basic residues are protected from attack by trypsin, although not binding with high affinity within the antechamber. Two different formulations of this idea are given in Figure 6A. For the full model, all four IDs can independently move in and out of the side portals (with equilibrium constant P), becoming protected within the antechamber. In a reduced model denoted by the dotted rectangle (Fig. 6A), only a single ID can occupy the antechamber at a time. Using these models, we varied P to examine the impact of fractional occupancy [for a single ID, fractional occupancy = P/(1 + P)] within the putative antechamber on the predicted time course of digestion for channels in resting states. When four IDs can simultaneously occupy the antechamber, greater fractional occupancy slows the digestion time course (Fig. 6B). However, as occupancy of the antechamber increases, an ∼100-fold slowing of τd is associated with no change in n (Fig. 6C). In contrast, when only a single ID can occupy the antechamber at a time, increases in fractional occupancy both slow the predicted digestion time course (Fig. 6D) and reduce the power factor (Fig. 6E), with n varying between 1.0 and 4.0 over a 100-fold change in τd. Thus, a physically plausible model in which IDs can transiently move in and out of the protected space within the antechamber can result in power factors of 2–3 under resting conditions, but only in the case that only a single ID can occupy the antechamber at a time.
Figure 6.
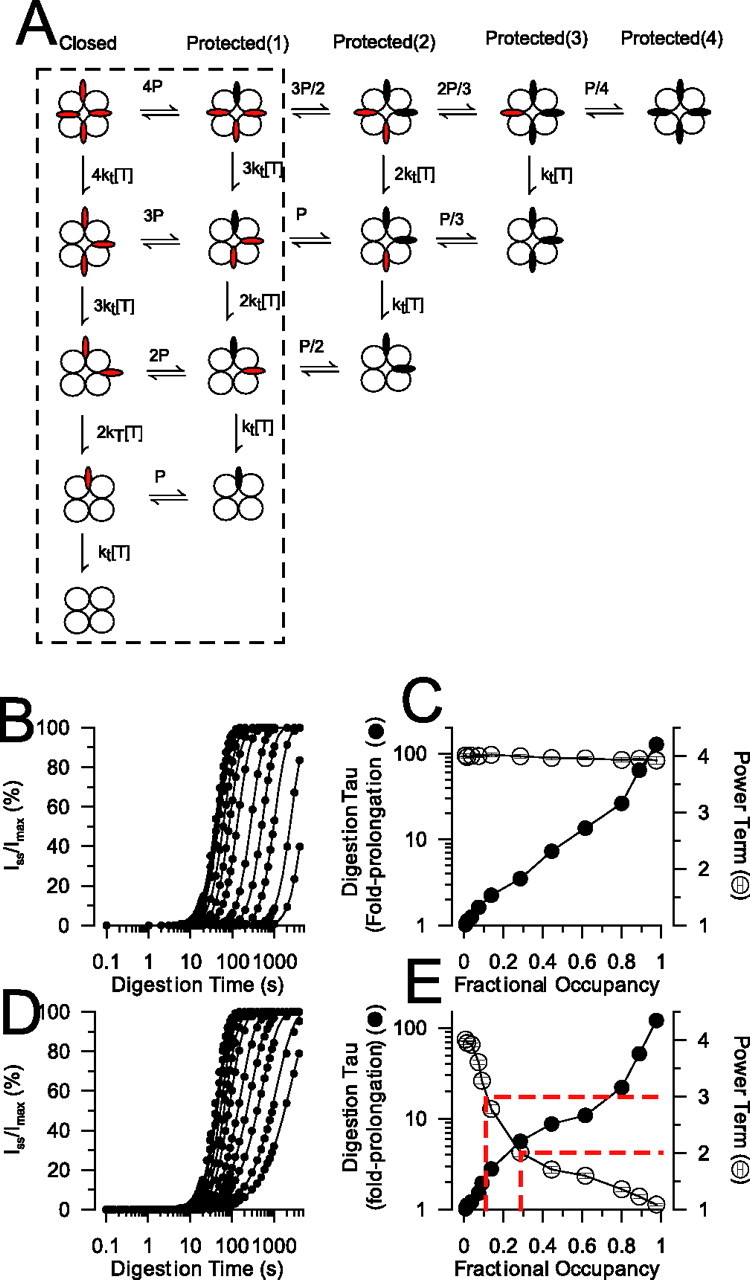
Under resting conditions, inactivation domains can pass in and out through the portals, but only one inactivation domain can occupy the antechamber at a time. A, The model summarizes two possible conditions involving movement of inactivation domains in and out of an antechamber from which trypsin is excluded. All states are assumed to be closed, but inactivation domains can exist either in accessible (red) or protected (black) conditions. The full model corresponds to a situation in which all four inactivation domains can independently move in and out of the antechamber, and the subscheme delimited by the dotted rectangle defines the case in which only one inactivation domain can bind within the antechamber at a time. B, For the model in which all four IDs can independently occupy the protected space within the antechamber, the predicted digestion time courses were determined for different effective fractional occupancies, in which effective fractional occupancy was defined as P/(1 + P). Higher values of P shift the digestion time course to the right. C, The time courses in B were fit with Equation 1 to yield τd and n. These values are plotted here (n, open circles; fold prolongation of τd, filled circles) as a function of the fraction of time an individual ID will spend inside the antechamber. For this model, the power factor under resting conditions is always ∼4. D, Predicted digestion time courses are shown for the model in which only a single ID can bind with the antechamber at a time. Increased fractional occupancy by a given ID results in a rightward shift in the recovery curves and a change in slope. E, The power factors (open circles) and fold prolongation of τd (filled circles) are shown as a function of fractional occupancy for the single occupancy model. The dotted lines denote the range of fractional occupancies associated with power factors between ∼2.0 and 3.0, corresponding to the range of experimentally observed power factors (2–3). This suggests that, for closed channels, an individual ID binds to a site within the antechamber ∼10–30% of the time. Over this range of fractional occupancies, the experimentally observed τd time course is ∼2.5- to 6-fold slower than the true microscopic digestion time constant.
If this correctly explains the experimentally observed digestion time courses, it allows determination of several aspects of the behavior of the β2 N terminus. For empirically observed power terms in the range of 2–3, the fold slowing of the observed τd relative to the microscopic time constant of digestion of a single ID by trypsin is in the range of 3–6 (Fig. 6E). With τd of ∼30 s, this would suggest a microscopic time constant for digestion of a single β2 ID of ∼5–10 s (a rate of 0.1–0.2 s−1). Furthermore, the analysis indicates that a single ID occupies the antechamber ∼15–30% of the time, whereas overall the antechamber is occupied by one of the four IDs approximately half the time. How might these results relate to other inactivating N termini? We predict that the equilibrium occupancy of the antechamber may reflect specific interactions of a given N terminus with features of the antechamber or the ease of moving in and out of the antechamber. As a consequence, under resting conditions and independent of the specific distribution of basic residues, alternative N termini may exhibit sensitivity to trypsin that differs somewhat from the β2 sensitivity, dependent on the fractional occupancy within the antechamber.
Discussion
We used the classical method of defining residue accessibility in native proteins through examination of trypsin digestion rates. Using the status of the BK channel inactivation mechanism as an indicator of the digestion process, quantitative comparisons of differential accessibility of basic residues were made and state-dependent changes associated with the inactivation process could be monitored. We found that the leading 16 residues of inactivated artificial N termini are protected from attack by trypsin. This corresponds exactly to the minimal length of residues in an artificial N terminus necessary to produce inactivation (Xia et al., 2003). The results therefore empirically define a protected volume at the cytosolic face of the channel but distinct from the permeation pathway, which we term an antechamber. This functional demonstration of a protected space corresponds well with evidence that, for many ion channels (Gulbis et al., 2000; Kobertz et al., 2000; Jiang et al., 2002a), cytosolic domains hanging from the membrane-embedded pore domain may require that permeant ions and other molecules access the permeation pathway by movement through so-called side portals. Here we discuss two aspects of our results: first, the implications concerning the native structure of the β2 N terminus and, second, implications concerning the dimensions and significance of the antechamber.
For channels in resting states, relative differences in digestion rates of particular basic residues will primarily reflect intrinsic structural characteristics of the β2 N terminus. In this regard, the present results are, in part, consistent with nuclear magnetic resonance (NMR) structures previously reported for the isolated 45 amino acid N-terminal β2 peptide (Bentrop et al., 2001). The isolated peptide in solution adopts a large family of structures, with two α-helical segments, residues 10–17 and 20–30. Peptide secondary structure will provide some protection against enzymatic digestion (Hubbard and Beynon, 2001), although α helices are not as disfavored as β sheets for proteinase attack. An α-helical structure over residues 10–17 and 20–30 may account for protection against digestion of R14, K24, and R26, whereas R8 positioned on the flexible initial segment of the N terminus is readily attacked. Residues on loops or turns are generally primary nick sites consistent with the sensitivity of position R19 but apparently inconsistent with the relative resistance of K18. Similarly, the resistance of residues K33, R34, K35, and K41 to trypsin does not agree simply with the NMR results and suggests that, in the native environment, these residues are part of a structure, perhaps through interaction with the α subunit, that confers complete protection against digestion by trypsin.
Evaluation of the state dependence of trypsin digestion shows that the β2 N terminus can enter a restricted space from which trypsin is completely excluded. Specifically, when the channel is inactivated, basic residues within the first 16 positions of an extended artificial N terminus are protected from digestion by trypsin. Interestingly, this is exactly the same chain length that is the minimum length necessary for an inactivation-competent N terminus. This 16 residue chain length can be used to estimate a specific physical distance. NMR results indicate that polyglutamine chains predominantly adopt a random coil chain in solution (Masino et al., 2002). The end-to-end root mean square length of a random coil of 16 residues is given approximately by (Creighton, 1993) yielding a length of ∼45.6 Å. However, during the protection experiment, the 16 residue chain is tethered within the pore. Because the chain is flexible and will occasionally be nearly fully extended, to be completely resistant to attack by trypsin, it is likely that the basic residues must be fully protected even when in that fully extended configuration. This suggests that the protected length defined by the 16 residues may more closely reflect a fully extended conformation, which is ∼60.8 Å. Conservatively then, trypsin is unable to approach closer than 45–60 Å from the axis of the permeation pathway.
What structural features of the BK channel might account for this restricted space? The MthK and BK channels seem likely to share a generally similar structural arrangement (Jiang et al., 2002a,b) in regards to the cytosolic structure and its connection to the S6 pore helix. Each MthK subunit contains within its cytosolic domain a specific structural motif termed the RCK domain (regulator of conductance for potassium) (Jiang et al., 2002a,b) with clear homology to a similar domain in BK channels. Therefore, the open conformation of the MthK K+ channel can be used to make a general estimate of the volume defined by the cytosolic ends of the S6 inner helices and the beginning of the cytosolic structure. Together, the four residues at the end of S6 and four residues at the beginning of the RCK domains define a truncated square pyramid (Fig. 7A), which we term the inner antechamber. For MthK, the height of the inner antechamber is ∼19 Å, whereas the distances from the axis of the pore to the top and bottom ends of the linkers are ∼13 and 26 Å. Based on the length estimates of the peptide chain over which basic residues are protected from digestion by trypsin, the protected volume extends for a distance almost twofold beyond the inner antechamber. We think it unlikely that, in open BK channels, the cytosolic end of the S6 helix could be sufficiently displaced relative to the open MthK channel to account for this. It seems more likely that the region protected from trypsin access begins well outside the dimensions defined by the inner antechamber. The simplest explanation is that the lateral margins of the protected space are defined, not by positions of the S6-to-RCK linkers, but simply represent the margins of the region of close apposition of the pore domain and the cytosolic domain (Fig. 7B). For comparison, from the Kv1.2 crystal structure (Long et al., 2005), the lateral radius from the axis of the pore to the outer membrane helices is ∼50 Å. Thus, it would not be surprising that the β2 TM segments would be positioned just outside the most outer α-subunit membrane helices at a distance of 45–60 Å from the permeation pathway axis.
Figure 7.
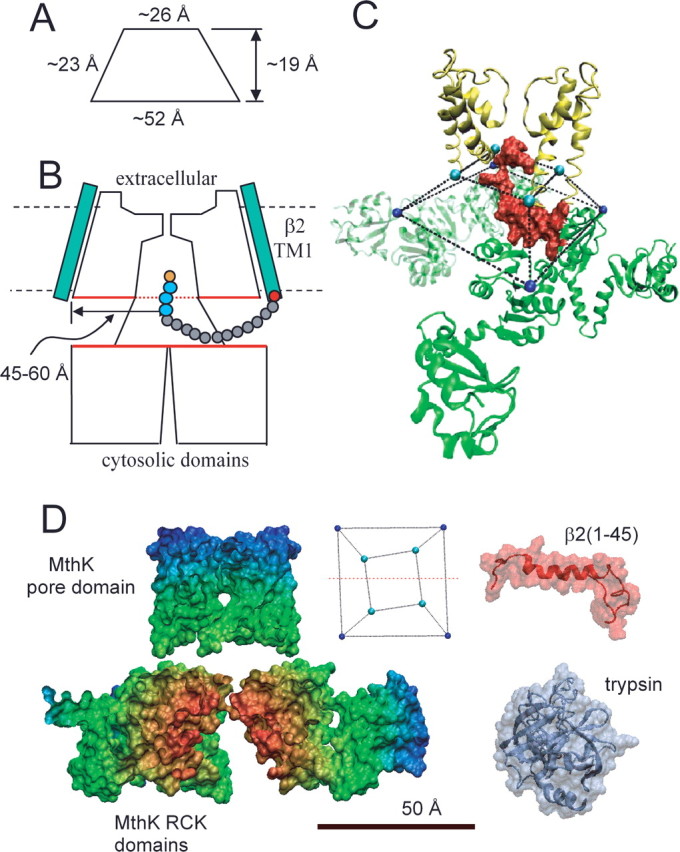
Considerations regarding the antechamber dimensions. A, The approximate dimensions of the truncated pyramid (side view) defined by residues at the end of S6 and beginning of RCK1 in MthK are given. B, A diagram of a possible relationship of a BK α subunit and the β2 subunit is shown. The β2 subunit is shown with a 16 amino acid N terminus ending with the MFIW inactivation motif (orange and blue residues). This 16 residue length defines the minimum necessary to permit any detectable inactivation (Xia et al., 2003), a length identical to that protected from digestion by trypsin. This suggests that the protected antechamber is larger than the volume circumscribed by the linkers between the S6 helices and the beginning of the cytosolic domains. The red boundaries of the pore domains and cytosolic domains denote the potential protected volume. The estimated distance from the axis of the permeation pathway to the edge of the protected disk is ∼45–60 Å. C, The initial 26 residues of the β2 N terminus are positioned within the volume circumscribed by the S6-to-RCK linkers, suggesting that a single inactivation domain is sufficiently to occupy the most of the antechamber. D, Comparison of space-filling structural models of MthK, the β2 N terminus (residues 1–45), and porcine pancreatic trypsin. For MthK, only residues on one side of a plane containing the axis of the permeation pathway (in inset, red line through truncated square pyramid defines the cut through the MthK structure) are shown. For β2, the underlying chain morphology is shown to emphasize the underlying flexibility that is probably essential to its action. The dimensions of trypsin exclude it from the compartment that separates the pore and cytosolic domains.
Based on ∼19 Å distance between the pore domain and cytosolic domains estimated from the MthK structure, exclusion of trypsin is not surprising and is consistent with the size of the A chain of trypsin (Fig. 7D). Given the vulnerability of ion channels to blockade by a variety of charged and uncharged moieties, it is tempting to speculate that these constraints on lateral access to the pore might help to reduce extraneous block or rectification that might arise from components of the intracellular soup. Of particular interest, a number of other cellular enzymes including soluble protein kinases and βγ G-protein dimers would be excluded from entering this restricted space.
Do changes in the side portal pathways occur during gating? Our results require that, under resting conditions, IDs can transiently pass in and out through the side portals, but only one ID can bind within the central antechamber at a time. Although the static pictures derived from crystal structures of channels with appended cytosolic material suggest that side portals are always open (Gulbis et al., 2000; Jiang et al., 2002a), there has been no specific experimental result that addresses this issue. Although our results cannot distinguish small differences in the ease of access of IDs to the antechamber between closed and open states, certainly occupancy of the antechamber by the β2 N terminus can occur readily under resting conditions. Thus, for BK channels, side portals in BK channels may be essentially static elements.
Our results indicate that, under resting conditions, there is a position of occupancy within the antechamber that can accommodate a single β2 ID. That only a single ID is allowed suggests that this site is within the central antechamber. Given the physical dimensions of the inner antechamber defined from the MthK structure (Figs. 1B, 7C,D) (Jiang et al., 2002a), it is certainly not surprising that only a single β2 N terminus can occupy the antechamber at a time.
The geometrical constraints imposed by side portals and an antechamber of finite dimension on access of molecules lead to several interesting speculations. First, for channels with antechambers, peptide domains that occupy the antechamber would be protected from enzymatic modifications such as phosphorylation reactions. Second, it is possible that some kinds of blocking effects on ion channels might involve obstruction of passage through side portals. Third, occupancy of the antechamber by an ID may help define kinetic characteristics of inactivation mechanisms. Thus, in channels with bulky cytosolic domains, the characteristics of side portals and antechambers leading to the permeation pathway may play a significant role in defining mechanisms of how such channels are regulated.
Table 4.
State-dependent digestion of artificial N termini
| Construct | 0 Ca2+, 0 mV |
10 μm Ca2+, 0 mV |
10 μm Ca2+, −80 mV |
|||
|---|---|---|---|---|---|---|
| τd (s) | n | τd | n | τd | n | |
| FIW4QKK24Q | 53.3 ± 7.4 | 2.6 ± 0.5 | 409.8 ± 67.8 | 1.1 ± 0.2 | 42.0 ± 7.7 | 3.0 ± 0.9 |
| FIW6QKK22Q | 59.0 ± 12.9 | 1.9 ± 0.4 | 583.0 + 44.6 | 1.0* | ||
| FIW8QKK20Q | 39.8 ± 11.3 | 1.7 ± 0.6 | 570.3 ± 206 | 0.9 ± 0.1 | ||
| FIW10QKK18Q | 50.8 ± 9.9 | 1.8 ± 0.5 | 348.8 ± 77.4 | 1.2 ± 0.1 | 25.4 ± 5.9 | 2.5 ± 0.9 |
| FIW11QKK15Q | 17.7 ± 2.7 | 3.3 ± 0.9 | 17.4 ± 1.7 | 3.7 ± 0.5 | 15.0 ± 0.6 | 4.0* |
| 325.7 ± 37.5 | 1.0* | |||||
| FIW17QKK10Q | 29.8 + 1.7 | 2.6 ± 0.22 | 48.5 ± 6.5 | 1.9 ± 0.3 | ||
| FIW20QKK8Q | 79.7 ± 8.9 | 1.7 ± 0.2 | 117.3 ± 14.9 | 1.04 ± 0.1 | 72.7 ± 8.9 | 1.7 ± 0.2 |
| FIW22QKK6Q | 74.6 ± 11.0 | 2.0* | ||||
Footnotes
This work was supported by National Institutes of Health Grants DK46564 and GM068580. We thank Yefei Cai and Yimei Yue for injection, care, and maintenance of oocytes and Drs. J. H. Steinbach, M. Crowder, and P. D. Lukasiewicz for comments on this manuscript.
References
- Bentrop D, Beyermann M, Wissmann R, Fakler B. NMR structure of the “ball-and-chain” domain of KCNMB2, the β2-subunit of large conductance Ca2+- and voltage-activated potassium channels. J Biol Chem. 2001;276:42116–42121. doi: 10.1074/jbc.M107118200. [DOI] [PubMed] [Google Scholar]
- Benzinger GR, Xia XM, Lingle CJ. Direct observation of a preinactivated, open state in BK channels with beta2 subunits. J Gen Physiol. 2006;127:119–131. doi: 10.1085/jgp.200509425. [DOI] [PMC free article] [PubMed] [Google Scholar]
- Butler A, Tsunoda S, McCobb DP, Wei A, Salkoff L. mSlo, a complex mouse gene encoding “maxi” calcium-activated potassium channels. Science. 1993;261:221–224. doi: 10.1126/science.7687074. [DOI] [PubMed] [Google Scholar]
- Creighton T. Structures and molecular properties. New York: Freeman; 1993. Proteins. [Google Scholar]
- DeLano W. The PyMOL molecular graphics system. San Carlos, CA: Delano Scientific; 2002. [Google Scholar]
- Ding JP, Lingle C. Steady-state and closed-state inactivation properties of inactivating BK channels. Biophys J. 2002;82:2448–2465. doi: 10.1016/S0006-3495(02)75588-4. [DOI] [PMC free article] [PubMed] [Google Scholar]
- Ding JP, Li ZW, Lingle CJ. Inactivating BK channels in rat chromaffin cells may arise from heteromultimeric assembly of distinct inactivation-competent and noninactivating subunits. Biophys J. 1998;74:268–289. doi: 10.1016/S0006-3495(98)77785-9. [DOI] [PMC free article] [PubMed] [Google Scholar]
- Gulbis JM, Zhou M, Mann S, MacKinnon R. Structure of the cytoplasmic beta subunit-T1 assembly of voltage- dependent K+ channels. Science. 2000;289:123–127. doi: 10.1126/science.289.5476.123. [DOI] [PubMed] [Google Scholar]
- Hamill OP, Marty A, Neher E, Sakmann B, Sigworth FJ. Improved patch-clamp techniques for high-resolution current recording from cells and cell-free membrane patches. Pflügers Arch. 1981;391:85–100. doi: 10.1007/BF00656997. [DOI] [PubMed] [Google Scholar]
- Horrigan F, Aldrich R. Coupling between voltage-sensor activation, Ca2+ binding and channel opening in large conductance (BK) potassium channels. J Gen Physiol. 2002;120:267–305. doi: 10.1085/jgp.20028605. [DOI] [PMC free article] [PubMed] [Google Scholar]
- Hoshi T, Zagotta WN, Aldrich RW. Biophysical and molecular mechanisms of Shaker potassium channel inactivation. Science. 1990;250:533–538. doi: 10.1126/science.2122519. [DOI] [PubMed] [Google Scholar]
- Hubbard S, Beynon RJ. Proteolysis of native proteins as a structural probe. In: Beynon R, Bond JS, editors. Proteolytic enzymes, a practical approach. Ed 2. New York: Oxford UP; 2001. pp. 233–264. [Google Scholar]
- Jiang Y, Lee A, Chen J, Cadene M, Chait BT, MacKinnon R. Crystal structure and mechanism of a calcium-gated potassium channel. Nature. 2002a;417:515–522. doi: 10.1038/417515a. [DOI] [PubMed] [Google Scholar]
- Jiang Y, Lee A, Chen J, Cadene M, Chait BT, MacKinnon R. The open pore conformation of potassium channels. Nature. 2002b;417:523–526. doi: 10.1038/417523a. [DOI] [PubMed] [Google Scholar]
- Knaus HG, Folander K, Garcia-Calvo M, Garcia ML, Kaczorowski GJ, Smith M, Swanson R. Primary sequence and immunological characterization of beta-subunit of high conductance Ca2+-activated K+ channel from smooth muscle. J Biol Chem. 1994;269:17274–17278. [PubMed] [Google Scholar]
- Kobertz WR, Williams C, Miller C. Hanging gondola structure of the T1 domain in a voltage-gated K+ channel. Biochemistry. 2000;39:10347–10352. doi: 10.1021/bi001292j. [DOI] [PubMed] [Google Scholar]
- Long SB, Campbell EB, Mackinnon R. Crystal structure of a mammalian voltage-dependent Shaker family K+ channel. Science. 2005;309:897–903. doi: 10.1126/science.1116269. [DOI] [PubMed] [Google Scholar]
- Masino L, Kelly G, Leonard K, Trottier Y, Pastore A. Solution structure of polyglutamine tracts in GST-polyglutamine fusion proteins. FEBS Lett. 2002;513:267–272. doi: 10.1016/s0014-5793(02)02335-9. [DOI] [PubMed] [Google Scholar]
- Orio P, Rojas P, Ferreira G, Latorre R. New disguises for an old channel: MaxiK channel beta-subunits. News Physiol Sci. 2002;17:156–161. doi: 10.1152/nips.01387.2002. [DOI] [PubMed] [Google Scholar]
- Rasmusson RL, Wang S, Castellino RC, Morales MJ, Strauss HC. The beta subunit, Kv beta 1.2, acts as a rapid open channel blocker of NH2-terminal deleted Kv1.4 alpha-subunits. Adv Exp Med Biol. 1997;430:29–37. doi: 10.1007/978-1-4615-5959-7_3. [DOI] [PubMed] [Google Scholar]
- Rettig J, Heinemann SH, Wunder F, Lorra C, Parcej DN, Dolly JO, Pongs O. Inactivation properties of voltage-gated K+ channels altered by presence of beta-subunit. Nature. 1994;369:289–294. doi: 10.1038/369289a0. [DOI] [PubMed] [Google Scholar]
- Ruppersberg JP, Frank R, Pongs O, Stocker M. Cloned neuronal IK(A) channels reopen during recovery from inactivation. Nature. 1991;353:657–660. doi: 10.1038/353657a0. [DOI] [PubMed] [Google Scholar]
- Sokolova O, Kolmakova-Partensky L, Grigorieff N. Three-dimensional structure of a voltage-gated potassium channel at 2.5 nm resolution. Structure. 2001;9:215–220. doi: 10.1016/s0969-2126(01)00578-0. [DOI] [PubMed] [Google Scholar]
- Solaro CR, Lingle CJ. Trypsin-sensitive, rapid inactivation of a calcium-activated potassium channel. Science. 1992;257:1694–1698. doi: 10.1126/science.1529355. [DOI] [PubMed] [Google Scholar]
- Song H, Suh S. Kunitz-type soybean trypsin inhibitor revisited: refined structure of its complex with porcine trypsin reveals an insight into the interaction between a homologous inhibitor from Erythrina caffra and tissue-type plasminogen activator. J Mol Biol. 1998;275:347–363. doi: 10.1006/jmbi.1997.1469. [DOI] [PubMed] [Google Scholar]
- Wallner M, Meera P, Toro L. Molecular basis of fast inactivation in voltage and Ca2+-activated K+ channels: a transmembrane beta-subunit homolog. Proc Natl Acad Sci USA. 1999;96:4137–4142. doi: 10.1073/pnas.96.7.4137. [DOI] [PMC free article] [PubMed] [Google Scholar]
- Wang Y-W, Ding JP, Xia X-M, Lingle CJ. Consequences of the stoichiometry of Slo1 α and auxiliary β subunits on functional properties of BK-type Ca2+-activated K+ channels. J Neurosci. 2002;22:1550–1561. doi: 10.1523/JNEUROSCI.22-05-01550.2002. [DOI] [PMC free article] [PubMed] [Google Scholar]
- Xia XM, Ding JP, Lingle CJ. Molecular basis for the inactivation of Ca2+- and voltage-dependent BK channels in adrenal chromaffin cells and rat insulinoma tumor cells. J Neurosci. 1999;19:5255–5264. doi: 10.1523/JNEUROSCI.19-13-05255.1999. [DOI] [PMC free article] [PubMed] [Google Scholar]
- Xia XM, Ding JP, Zeng XH, Duan K-L, Lingle CJ. Rectification and rapid activation at low Ca2+ of Ca2+-activated, voltage-dependent BK currents: consequences of rapid inactivation by a novel β subunit. J Neurosci. 2000;20:4890–4903. doi: 10.1523/JNEUROSCI.20-13-04890.2000. [DOI] [PMC free article] [PubMed] [Google Scholar]
- Xia XM, Zeng X-H, Lingle CJ. Multiple regulatory sites in large-conductance calcium-activated potassium channels. Nature. 2002;418:880–884. doi: 10.1038/nature00956. [DOI] [PubMed] [Google Scholar]
- Xia XM, Ding JP, Lingle CJ. Inactivation of BK channels by the NH2 terminus of the β2 auxiliary subunit: an essential role of a terminal peptide segment of three hydrophobic residues. J Gen Physiol. 2003;121:125–148. doi: 10.1085/jgp.20028667. [DOI] [PMC free article] [PubMed] [Google Scholar]
- Xia XM, Zhang X, Lingle CJ. Ligand-dependent activation of Slo family channels is defined by interchangeable cytosolic domains. J Neurosci. 2004;24:5585–5591. doi: 10.1523/JNEUROSCI.1296-04.2004. [DOI] [PMC free article] [PubMed] [Google Scholar]
- Zhang X, Solaro CR, Lingle CJ. Allosteric regulation of BK channel gating by Ca2+ and Mg2+ through a non-selective, low affinity divalent cation site. J Gen Physiol. 2001;118:607–635. doi: 10.1085/jgp.118.5.607. [DOI] [PMC free article] [PubMed] [Google Scholar]
- Zhou M, Morais-Cabral JH, Mann S, MacKinnon R. Potassium channel receptor site for the inactivation gate and quaternary amine inhibitors. Nature. 2001;411:657–661. doi: 10.1038/35079500. [DOI] [PubMed] [Google Scholar]