

Abstract
Major depression represents a complex mental disorder. The identification of biological markers that define subtypes of major depressive disorder would greatly facilitate appropriate medical treatments, as well as provide insight into etiology. Reduced activity of the cAMP signaling system has been implicated in the etiology of major depression. Previous work has shown low adenylyl cyclase activity in platelets and postmortem brain tissue of depressed individuals. Here, we investigate the role of the brain type VII isoform of adenylyl cyclase (AC7) in the manifestation of depressive symptoms in genetically modified animals, using a combination of in vivo behavioral experiments, gene expression profiling, and bioinformatics. We also completed studies with humans on the association of polymorphisms in the AC7 gene with major depressive illness (unipolar depression) based on Diagnostic and Statistical Manual of Mental Disorders IV criteria. Collectively, our results demonstrate a sex-specific influence of the AC7 gene on a heritable form of depressive illness.
Keywords: adenylyl cyclase, association study, depression, haplotype, human, mouse models, genetic polymorphisms
Introduction
Major depression, as defined by the Diagnostic and Statistical Manual of the American Psychiatric Association (1994), is among the most common forms of mental illness in the United States. The estimated prevalence for a lifetime diagnosis of major depression is 16%, with women having two times the risk of men (Blazer et al., 1994). Depression is the cause of substantial medical, personal, social, and economic burden (McDaniel, 2000). The relatively slow progress in elucidating the intricate neurobiology of depression has been attributed to the complex and heterogeneous nature of this disorder, which results from the contribution of multiple genetic and environmental factors (Nestler et al., 2002a).
There is strong evidence to suggest that cAMP-mediated events play an important role in the pathophysiology of depression. Many studies implicate the activity of the cAMP signaling cascade, including elements such as protein kinase A (PKA) and cAMP response element-binding protein (CREB) (a transcriptional activator), in the actions of antidepressant drugs (Donati and Rasenick, 2003). The role of the cAMP metabolizing enzyme phosphodiesterase in the signs of depression has also been debated (Houslay et al., 2005). Interestingly, fewer studies have focused on the enzymes that generate cAMP [i.e., the family of adenylyl cyclases (ACs)]. Previous reports indicated that treatment of rats with antidepressants increased guanosine 5′-[β,γ-imido]triphosphate and fluoride-stimulated adenylyl cyclase activity in brain (Menkes et al., 1983; Donati and Rasenick, 2003), and our own studies indicated significant differences in forskolin-stimulated adenylyl cyclase activity in platelets of depressed subjects compared with nondepressed controls (Menninger and Tabakoff, 1997; Hines and Tabakoff, 2005). The mammalian family of adenylyl cyclases consists of nine membrane-bound forms and one member of the family that is localized to the cell cytosol (Cooper, 2003). Each of the adenylyl cyclases is coded by a separate gene, and each has regulatory features and anatomical localization that distinguish it from other family members (Hanoune and Defer, 2001). Thus, it becomes important to consider the individuality of the adenylyl cyclases to investigate their role in disorders such as depression.
Quantitative trait locus (QTL) analysis has been used to identify chromosomal regions that influence the outcome of tests for depression used in experiments with rodents, i.e., the forced swim test (FST) and tail suspension test (TST) (Yoshikawa et al., 2002). Although four QTLs have been identified for the FST and five for the TST in the mouse genome, one QTL on chromosome 8 is common to both of these behavioral tests (Yoshikawa et al., 2002). We noted that the chromosome 8 region defined by that QTL harbored the gene for the type VII (AC7) adenylyl cyclase isoform. Interestingly, the syntenic region of human chromosome 16, within which human AC7 is localized, had also been noted to be associated with unipolar major depression in humans (Maes et al., 1994). Based on these observations, we focused our attention on the potential role of AC7 in depression. Using both animal models and a human population, we demonstrated a sex-specific influence of the AC7 gene on depression.
Materials and Methods
Generation of AC7 transgenic (Adcy7huTG) mice
Mice that overexpress human AC7 in the brain were generated and characterized as described previously (Yoshimura et al., 2000). Oocytes of C57BL/6/SJL mice were used as repositories for the transgene, and the Adcy7 huTG mice on this genetic background were backcrossed with C57BL/6 mice.
Generation of AC7 heterozygous “knockdown” mice
A genomic clone was isolated from a mouse genomic library (bacteriophage λ library) derived from the 129 S6/SvEv inbred mouse strain (Stratagene, La Jolla, CA) according to the standard method of plaque hybridization (Sambrook et al., 1989). A mouse cDNA clone for AC7 (Hellevuo et al., 1995a), which encodes the putative catalytic domain, was used as a hybridization probe. Several fragments derived from the isolated genomic clone were subcloned into a plasmid vector, pBluescript II SK. The DNA sequence of the clone was determined by the AmpliTaq FS cycle sequencing reaction, with dRhodamine- and BigDye-labeled dye terminators, at the University of Colorado Cancer Center DNA Sequencing and Analysis Core (GenBank accession number AY494946). Comparison of the genomic sequence and the cDNA sequence revealed that the genomic clone covered a partial cDNA sequence of ∼3 kb (nucleotide positions 1633–4556), which encodes the AC7 protein starting at amino acid position 319 to the C terminus. The cloned DNA contained a total of 19 exons. To generate AC7 knock-out mice, we chose to disrupt exon 3, which encodes part of the highly conserved C1a domain of AC7 (Hellevuo et al., 1995a).
Four DNA fragments were sequentially inserted into a plasmid vector, pKO V902 (Lexicon Genetics, The Woodlands, TX), as described below, to construct a mouse AC7 gene targeting vector named pKO-AC7(TK). A 1.8 kb fragment (PstI–144 to SmaI–1920; numbers correspond to the nucleotide positions in the genomic sequence) was subcloned into the BglII site using a BglII linker. A neomycin resistance gene cassette (1.6 kb) from pKO SelectNeo (Lexicon) was subcloned into the AscI site. The herpes simplex virus thymidine kinase gene cassette (2.0 kb) was subcloned into the RsrII site. A 11.0 kb fragment (SmaI–1920 to EcoRI–11044) in pBluescript II SK was cut out using XbaI and EcoRI and subcloned using the same restriction enzymes to linearize pKO V902 containing the above three fragments. pKO-AC7(TK) was linearized by EcoRI digestion for transfection into embryonic stem (ES) cells. The AC7 gene was targeted in AB2.2-Prime ES cells (Lexicon) following the protocol of the supplier, using G418 and ganciclovir. Drug-resistant colonies were isolated and screened for homologous recombination by PCR and Southern blotting. Three clones that had the AC7 null mutation were isolated, and the karyotypes of the three ES cell clones were examined by making in situ metaphase chromosome spreads and by the GTG-banding technique. All three clones showed the normal male karyotype. However, there were some abnormalities such as polyploidy.
Genomic DNA was isolated from ES cells (and mouse tails) by SDS/proteinase K digestion followed by alcohol precipitation. For initial screening of AC7 gene targeting in ES cells, PCR was performed using primers (AC7-F2) 5′ upstream of the AC7 gene, outside of the region encompassed by the targeting vector, and primers (Neo-R2) within the neomycin resistance gene cassette. All primers are shown in supplemental Table 1 (available at www.jneurosci.org as supplemental material). The targeted allele was detected as a 2044 bp fragment. As an internal control, an 1804 bp fragment was amplified using primers Csn-F (forward) and Csn-R (reverse). For routine genotyping of mice, the targeted allele was detected as a 557 bp PCR fragment using primers AC7-F3 and Neo-R2. The wild-type allele was detected as a 456 bp fragment using primers AC7-F3 and AC7-R2. For Southern blotting, genomic DNA was digested with either XbaI or BamHI and separated in a 0.6% agarose gel. The blot was analyzed by either the 5′ probe (152 bp; corresponding to nucleotide position 5–156 of the genomic sequence) prepared by PCR or the 3′ probe (1.8 kb; EcoRI–11,044 to BamHI–12,795).
C57BL/6 blastocysts were used for injection of the targeted ES cells (Ramirez-Solis et al., 1993; Stewart, 1993). A total of 15 chimeric male mice were produced by blastocyst injection of AC7-targeted ES cells (two clones). The chimeras derived from one ES cell clone showed germ-line transmission of the targeted AC7 allele. The male chimeric mice were mated with C57BL/6 female mice. The offspring were backcrossed with either C57BL/6 or 129 S6/SvEv mice (Taconic Farms, Hudson, NY). Mice backcrossed to C57BL/6 mice were used for this study.
To generate AC7 null mutant mice (Adcy7 −/−), an AC7 heterozygote (Adcy7 +/−) intercross was performed. Mating of heterozygous mice (Adcy7 +/− × Adcy7 +/−) yielded only seven Adcy7 −/− mice of 170 weaned pups. The genotypes were 50 +/+, 113 +/−, and 7 −/−. Genotyping of fetuses (at various stages of gestation) revealed a higher incidence of homozygous knock-out mice (18 of the 196 genotyped) but also a high incidence of mortality (12 of 18 were already dead). Adcy7 +/− mice appeared to be normal and anatomically indistinguishable from wild-type littermates.
All mice used in the experiments described here were 60–90 d old.
Mouse behavioral tests
The FST was performed using a glass cylinder (60 cm high × 30 cm diameter) filled with water to a depth of 45 cm. Water temperature was maintained at 22–23°C. Water was replaced after every three mice. On the first day, the mice were placed into the water and behavior was videotaped for 15 min (pretest) from the side of the cylinder. At 24 h after the pretest, mice were retested for 6 min under identical conditions (test). Data reported are from the test day. Videotapes were digitized and analyzed using ForcedSwimScan (CleverSys, Reston, VA). The software analyzes animal behavior frame by frame and records the duration of immobility (defined as floating with minimal hindlimb movement).
To conduct the TST, mouse tails were passed through a small hole drilled in the center of a 150 mm plastic culture dish before being taped (adhesive tape) ∼1 cm from the tip of the tail to a shelf 150 cm above the floor. A 6 min test session was used during which the behavior of the mouse was videotaped. Duration of immobility was determined from the tapes by a trained investigator who was blind to the genotype and gender of the animals.
Gene expression analysis
Naive mice were killed by CO2 exposure, and whole brains were removed and frozen on dry ice. Brains were stored at −70°C until used. Total RNA was extracted from whole brains using either the Trizol reagent (Invitrogen, Carlsbad, CA) or RNeasy Midi kits (Qiagen, Valencia, CA). An additional cleanup of total RNA was performed using the RNeasy Mini kit (Qiagen). Affymetrix (Santa Clara, CA) GeneChip oligonucleotide arrays (MGU74A arrays version 2.0) were used for expression analysis. Double-stranded cDNA was synthesized from total RNA and was used to obtain biotin-labeled cRNA by an in vitro transcription reaction. Biotin-labeled cRNA was fragmented and hybridized with the GeneChip Arrays. Arrays were subsequently stained with streptavidin–phycoerythrin and scanned on an Affymetrix Gene Array Scanner. Five mice of each gender from each line were used for microarray analysis; cRNA derived from each individual mouse was hybridized to a separate array. The ages and generations of the lines of Adcy7huTG, Adcy7 +/−, and wild-type (Adcy7wt and Adcy7 +/+, respectively) mice used for microarray analysis are shown in supplemental Table 2 (available at www.jneurosci.org as supplemental material).
A detailed description of all gene expression analyses is provided in the supplemental Methods (available at www.jneurosci.org as supplemental material). In summary, data were normalized using the Robust Multi-array Average algorithm (RMA) (Irizarry et al., 2003). To compare gene expression in brains of Adcy7wt and Adcy7huTG mice, we used a permutation procedure, as described previously (Tabakoff et al., 2003). We also took advantage of the availability of two different lines of transgenic mice (11004 and 11012), which were used as replicates in a t test noise distribution analysis, described by Eaves et al. (2002). Genes that were found to be differentially expressed in the same direction in both replicate transgenic lines, by both statistical analyses (p < 0.05), were considered to be differentially expressed.
To compare gene expression in brains of Adcy7 +/+ and Adcy7 +/− mice, two statistical analyses were also used. The first was the permutation procedure described above. The second was t tests, followed by correction for multiple comparisons using the false discovery rate. Genes identified in common by both statistical procedures (p < 0.05) were considered to be differentially expressed.
For determination of expression QTLs (eQTLs), a QTL analysis was performed in which the phenotype was gene expression. We analyzed gene expression profiles in whole brains of 30 BXD recombinant inbred strains (four to six mice per strain, RNA from individual mice hybridized to separate arrays) using Affymetrix MOE 430 version 2 arrays (data available at http://inia.uchsc.edu). The mice used for this analysis were all male, 70–90 d old. Probe set intensity values were normalized and summarized with RMA. Mean expression levels within strains were used in a QTL analysis implemented in the R/qtl program (Broman et al., 2003) using a set of 1774 informative markers (Saba et al., 2006). Empirical p values for logarithm of odds (LOD) scores were calculated for each transcript by permutation (p < 0.05, significant; 0.05 < p < 0.1, suggestive). Chromosomal localizations of significant eQTLs and differentially expressed genes were determined and were manually compared with QTLs for the forced swim test and tail suspension test (Yoshikawa et al., 2002) using software developed by the Center for Computational Pharmacology at the University of Colorado at Denver and Health Sciences Center (http://inia.uchsc.edu). Differentially expressed genes that had an eQTL that overlapped a behavioral QTL for a particular trait were considered as candidate genes for that trait (Saba et al., 2006).
Quantitative real-time PCR
AC7.
Quantitative real-time (qRT)-PCR (Prism 7700 Sequence Detection System; Applied Biosystems, Foster City, CA) was used to quantitate the expression of the transgene (human ADCY7) in four male and four female Adcy7huTG and Adcy7wt mice. The expression levels of the human transgene in certain brain areas of male mice have been published previously (Donohue et al., 2005). Levels of endogenous mouse Adcy7 mRNA in brains of four Adcy7 +/+ and four Adcy7 +/− knockdown mice of each sex were determined using microarray analysis or RT-PCR. Sequence-specific TaqMan probes and primer sets for human ADCY7 were designed using PrimerExpress software (Applied Biosystems); probes and primers for mouse Adcy7 were designed by Applied Biosystems. The probes and primers are described in supplemental Table 1 (available at www.jneurosci.org as supplemental material). RNA was extracted as described previously, and all samples were assayed in triplicate on a single plate for Adcy7huTG and Adcy7wt mice and on a single plate for Adcy7 +/+ and Adcy7 +/− mice. After correction for endogenous control glyceraldehyde-3-phosphate dehydrogenase mRNA, the relative quantities of each transcript were calculated as described by Livak and Schmittgen (2001).
Confirmation of differentially expressed genes in brains of female Adcy+/+ versus Adcy+/− mice.
Probes and primers that corresponded to the regions of the genes of interest that were targeted by the Affymetrix probes were obtained from Applied Biosystems (supplemental Table 1, available at www.jneurosci.org as supplemental material). RNA was extracted from brains of four Adcy7 +/− female mice and four Adcy7 +/+ female mice, and all samples were assayed in triplicate, using two different amounts of cDNA, on a single plate. After correction for the endogenous control 18S rRNA, the relative quantities of each transcript were calculated as described by Livak and Schmittgen (2001).
Immunoblotting for AC7 protein
Antiserum was generated in rabbits against a peptide sequence within the C1b region of AC7 (ETHVPNGRRPKSVPQRHRRTC). A basic local alignment search tool search revealed that this peptide sequence is not conserved in other isoforms of adenylyl cyclase and also revealed no homology with other proteins. The generation of the polyclonal antiserum, and affinity purification and characterization of the antibody, are described in detail in supplemental Methods (available at www.jneurosci.org as supplemental material). Immunoblotting of AC7 in mouse brain was performed essentially as described previously (Donohue et al., 2005). Mice were killed with CO2, and hippocampus and cerebellum were dissected. Brain tissue was homogenized using a Polytron in 10 mm Tris-HCl buffer, pH 7.4, containing 1 mm EDTA, 0.25 m sucrose, and protease and phosphatase inhibitor cocktails (Sigma, St. Louis, MO) and centrifuged at 1600 × g (10 min, 4°C). The protein concentration of the supernatant was determined using the BCA method (Pierce, Rockford, IL). Protein (5–10 μg) was separated on 4–12% Bis-Tris polyacrylamide gels (NuPAGE gels; Invitrogen) and transferred to nitrocellulose membranes. The blots were incubated with primary antibody to AC7 (1:3000) and monoclonal antibody to β-tubulin (1:10,000; BD PharMingen, San Diego, CA), followed by goat anti-rabbit IgG (1:10,000) and goat anti-mouse IgG (1:30,000) coupled to horseradish peroxidase. The blots were stained using enhanced chemiluminescence reagent (PerkinElmer, Boston, MA). After exposure to x-ray film, protein bands were quantitated by image analysis using Quantity One software (version 4.5.1; Bio-Rad, Hercules, CA). Results were calculated as volume of the appropriate bands, and levels of AC7 protein were corrected based on β-tubulin levels.
Measurement of AC7 activity in mouse brain
In these experiments, to minimize stress, mice were repeatedly handled for 1 week and singly housed 1 d before the experiment. Mice were killed by CO2 inhalation. Brains were quickly removed and placed on an ice-cold block. The hippocampus was rapidly dissected and placed in ice-cold oxygenated Krebs–Ringer bicarbonate buffer (KRB) (Sigma). Tissue was cut into 50 × 50 μm prisms on a McIlwain tissue chopper (Brinkmann Instruments, Westbury, NY), washed in oxygenated KRB, and allowed to recover for 15 min at room temperature.
Aliquots (200 μl) of the hippocampal prisms were incubated at 32°C for 10 min in oxygenated KRB in the presence of 3-isobutyl-1-methylxanthine (IBMX) (500 μm) and in the presence or absence of propranolol (200 μm). Phorbol 12,13-dibutyrate (PDBu) (1 μm) or vehicle was then added, and samples were incubated for another 10 min. Samples were then treated with isoproterenol (10 mm) or vehicle and incubated for 10 min. Samples were then centrifuged [10,000 rpm, Eppendorf (Hamburg, Germany) 5415C centrifuge] at 4°C. The cAMP concentration in the supernatant was measured using the Amersham cAMP Biotrak EIA System (GE Healthcare, Piscataway, NJ), according to the instructions of the manufacturer. The pellet was homogenized in ice-cold 0.1 m HCl, and the cAMP concentration was measured using a cAMP Competitive ELISA kit (Pierce, Rockford, IL). Protein concentration was determined with a BCA assay (Pierce).
Total cAMP production in supernatant plus pellet, which was attributable to AC7 activity, was calculated as the difference between the cAMP concentration (picomoles per milligram of protein) in samples incubated in the presence of IBMX, PDBu, and isoproterenol and samples incubated in the presence of IBMX, PDBu, isoproterenol, and propranolol. In preliminary experiments, no differences in AC7 activity were noted between Adcy7 +/+ and Adcy7wt mice, and therefore activity in Adcy7huTG and Adcy7 +/− mice was compared with that in Adcy7wt mice. In each experiment, tissue from one Adcy7huTG, one Adcy7 +/−, and one Adcy7wt mouse was included. Male and female mice were assayed in separate experiments. All assays were performed in triplicate.
Human study population
In 1988, the World Health Organization (WHO) and the International Society for Biomedical Research on Alcoholism (ISBRA) initiated a multicenter international study with a primary goal of identifying state and/or trait markers of alcohol and drug abuse and mental health disorders. In this cross-sectional study, there were a total of 1863 participants who completed the WHO/ISBRA Interview Schedule (described below) and provided both blood and urine samples at one of the participating clinical centers (Helsinki, Finland; São Paulo, Brazil; Sapporo, Japan; Montreal, Canada; and Sydney, Australia). There were a total of 605 individuals in the Montreal subset, of which 90.1% (545 subjects) self-reported to be Caucasian. The Montreal participants were selected for genetic analysis because they were predominantly Caucasian, representative of both genders, and had a higher prevalence of individuals with a history of major depressive disorder compared with the other populations (Table 1).
Table 1.
Characteristics of Montreal Study Population a
| Characteristic | Major depressive disorder (DSM-IV) | No major depressive disorder | p value |
|---|---|---|---|
| Total number of subjects | 153 | 344 | |
| Familial depression b | 67 (43.8%) | ||
| Gender | |||
| Male | 63 (41.2%) | 190 (55.2%) | |
| Female | 90 (58.8%) | 154 (44.8%) | <0.01 c |
| Age (mean ± SD years) | 37.1 ± 11.3 | 37.7 ± 12.0 | 0.58 d |
| Lifetime marijuana dependence | 21 (13.7%) | 12 (3.5%) | <0.01 e |
| Lifetime alcohol dependence or abuse | 121 (79.1%) | 188 (54.7%) | <0.01 e |
a Excludes 48 individuals who were not analyzed because of insufficient DNA. Numbers in parentheses denote percentage of total number of subjects in respective category.
b A diagnosis of familial depression is assigned when individuals exhibit both a diagnosis of DSM-IV major depression and at least one of their first-degree family members is ascertained to have been depressed through the interview of the proband.
c Comparison between proportions of males and females in the categories of major depressive disorder (DSM-IV) and no major depressive disorder (χ 2).
d Comparison between categories of major depressive disorder (DSM-IV) and no major depressive disorder (Student's t test).
e Comparison between proportions of subjects in the categories of major depressive disorder (DSM-IV) and no major depressive disorder (χ 2).
The interview instrument for this WHO/ISBRA study was a modified version of the Alcohol Use Disorder and Associated Disabilities Interview Schedule (AUDADIS) (Hasin et al., 1997) (see below). The WHO/ISBRA Interview Schedule is a comprehensive questionnaire regarding alcohol and drug use, psychiatric disorders, as well as family history of alcohol abuse and mental disorders (Glanz et al., 2002). All diagnoses of psychiatric disorders, including family history, were based on Diagnostic and Statistical Manual of Mental Disorders IV (DSM-IV) criteria. In a recent version of the AUDADIS, test–retest reliability was assessed for the diagnosis of depression and family history of depression (Grant et al., 2003). The κ value for major depression was 0.59, and the range of intraclass correlation coefficients for family history of depression was 0.72–0.82 (considered “excellent”) (Grant et al., 2003). “Familial depression” is defined as an individual who had both a DSM-IV diagnosis of major depression during their lifetime and had a first-degree relative who had a DSM-IV diagnosis of major depression during their lifetime.
All subjects provided written consent, and all clinical centers participating in this study received an Institutional Review Board (or similar body) approval for the protocol in accordance with the National Institutes of Health Guidelines for Protection from Risk of Human Subjects.
Microsatellite and single nucleotide polymorphisms genotyping
Whole-genome amplification of genomic DNA samples was performed using a modified primer extension preamplification method (Anchordoquy et al., 2003). Genotyping of the AACA tetranucleotide repeat polymorphism (D16S2967) (Hellevuo et al., 1997), located in the 3′ untranslated region (UTR) of the AC7 gene (ADCY7), was conducted with an ABI Prism 3100 Genetic Analyzer (Applied Biosystems) according to the protocol of the manufacturers. This polymorphism has been shown previously to have five alleles, ranging from (ACAA)4 to (ACAA)8 (Hellevuo et al., 1997)
Single nucleotide polymorphisms (SNPs) were identified from both the Single Nucleotide Polymorphism Database (dbSNP) and the Applied Biosystems databases. Genotyping was performed using TaqMan SNP Genotyping Assays (Applied Biosystems) according to the protocol of the manufacturer for the following SNPs (in parentheses are the dbSNP identification numbers): hCV1232083 (rs34346733), hCV1168861 (rs2302716), hCV11777577 (rs4785211), hCV25605094 (rs17289102), hCV9606780 (rs1064448), hCV183346 (rs34582796), hCV148486 (rs11644386), and hCV1168827 (rs6500311) (see Fig. 3). For quality control purposes, DNA samples from six “standard” individuals were assayed in duplicate on each 96-well plate. Laboratory personnel were blinded with respect to case-control status.
Figure 3.

Location of all analyzed SNPs and the (AACA) tetranucleotide repeat (D16S2967) in relation to the ADCY7 locus on human chromosome 16. Markers span a region of ∼150 kb, with the tetranucleotide repeat located in the 3′ untranslated region of the ADCY7 gene. Celera SNP identification numbers are indicated for all SNPs, in addition to dbSNP identification numbers (rs numbers) when available. SNP locations are based on public database information (dbSNP build 35.1).
Haplotype block identification and phase determination
Haplotype blocks were identified using Haploview version 3.2 (Barrett et al., 2005), a software that uses a two-marker expectation–maximization algorithm to estimate maximum likelihood values for deriving an estimate of linkage disequilibrium (LD) (D′). Haplotype blocks were identified based on criteria defined by Gabriel et al. (2002). Haplotypes were ascertained for each individual using PHASE version 2.1 (Stephens et al., 2001; Stephens and Donnelly, 2003), which uses a Bayesian statistical method for reconstructing haplotypes from population data. This software can handle SNP and microsatellite data and can compensate for missing data.
Statistical analysis for human marker and haplotype data
All statistical analyses were done with a statistical software package (SAS version 9.1; SAS, Cary, NC). Odds ratios (ORs) and 95% confidence intervals (CIs) were computed using logistic regression. Univariate and multivariate logistic regression were used to examine the independent effects of ADCY7 alleles on major and familial depression.
The association for each allele was assessed based on the presence or absence of each allele independently. Analyses with the ADCY7, seven-repeat allele [(AACA)7] were initially performed by recoding and modeling heterozygosity and homozygosity as dummy variables (0 or 1) and computing the respective odds ratios compared with the presence of no (AACA)7 alleles. These results suggested an “additive model,” so all analyses presented were based on an additive model (0, 1, or 2) for the ADCY7, seven-repeat allele [(AACA)7].
To identify potential confounders, several variables were also assessed as independent predictors of familial depression, such as alcohol and drug dependence and various demographic and personality parameters. With the exception of age and gender, only variables identified as potential confounders were included in the final multivariate model. Based on these analyses, the final multivariate models included age (continuous), gender, lifetime history of marijuana dependence, and lifetime history of alcohol dependence or abuse. We compared the group of “familially depressed” subjects with two types of control groups: (1) a control group consisting of individuals who had neither familial nor nonfamilial depression (Table 1, Table 4); (2) a control group consisting of the nondepressed individuals combined with the nonfamilially depressed individuals (data not shown). Similar results were evidenced using either of the control groups.
Table 4.
Frequency of the most common haplotypes among familial depressed and non-depressed individuals a , b , c
| Haplotype | Controls n (%) | Familial depression n (%) |
|---|---|---|
| CT5AT | 146 (21.2) | 26 (19.4) |
| CT6GC | 92 (13.4) | 19 (14.2) |
| CT6AT | 80 (11.6) | 10 (7.5) |
| CG6AT | 160 (23.3) | 32 (23.9) |
| TG7AT | 150 (21.8) | 40 (29.9) |
a A diagnosis of familial depression is assigned when individuals exhibit both a diagnosis of DSM-IV major depression and at least one of their first-degree family members is ascertained to have been depressed through the interview of the proband.
b Individuals with missing genotype information for the AACA repeat polymorphism are included.
c The haplotype block contains four SNPs (hCV25605094, hCV9606780, hCV183346, and hCV148486) and the microsatellite marker.
To identify a “high-risk” haplotype, the frequencies for the most common haplotypes (>2.5%) were compared among cases and controls. The association between SNPs identified as part of the haplotype block and the ADCY7, seven-repeat allele [(AACA)7], was confirmed using linear regression. Univariate and multivariate logistic regression was used to examine the additive effect of the high-risk haplotype on familial depression. To account for uncertainty in phase predictions, a weighted regression model based on the estimated probabilities of each haplotype for every individual was used.
Results
We created transgenic mice that overexpress human AC7 in the brain (Adcy7huTG) (Yoshimura et al., 2000) and AC7 heterozygous knockdown mice in which one copy of the AC7 gene was disrupted (Adcy7 +/−). Although the disruption of both copies of the AC7 gene produced death in the fetus, the Adcy7 +/− and Adcy7huTG mice appeared to be normal and were behaviorally indistinguishable from their littermates in open-field behavioral tests (L. Snell and T. Hanania, unpublished data). Both the Adcy7huTG and Adcy7 +/− mice used in our behavioral studies were backcrossed to C57BL/6J mice for at least 10 generations before being used in the reported work.
Genetic manipulation of AC7 influences depression-like behavior in mice
As determined by RT-PCR, mRNA for mouse Adcy7 in whole brain was reduced by 69% in female Adcy7 +/− mice compared with female Adcy7 +/+ mice and 44% in male Adcy7 +/− mice compared with male Adcy7 +/+ mice [relative quantity (2−ΔΔCt): males, Adcy7 +/−, 0.45, p < 0.001, mixed-model analysis; females, Adcy7 +/−, 0.31, p < 0.007, mixed-model analysis, n = 3–4 mice per group]. The overexpression of human AC7 mRNA in brains of male Adcy7huTG mice is demonstrated in reports by Yoshimura et al. (2000) and Donohue et al. (2005). Significant overexpression of human AC7 mRNA was again demonstrated in whole brain of male as well as female Adcy7huTG mice by qRT-PCR [relative quantity (2−ΔΔCt) compared with Adcy7wt: males, Adcy7huTG, 20,050; females, Adcy7huTG, 7255; p < 0.0001 for both sexes, mixed-model analysis; n = 4 mice per group]. Complete qRT-PCR data are provided in supplemental Table 3 (available at www.jneurosci.org as supplemental material).
The affinity-purified antibody generated against the C1b peptide from human ADCY7 identified a band at ∼100 kDa in AC7-transfected human embryonic kidney HEK293 cells, which was not detectable in nontransfected cells or after preabsorption of the antibody with the C1b peptide (supplemental Methods and Fig. 1, available at www.jneurosci.org as supplemental material). We assessed mouse and human AC7 proteins in hippocampus of Adcy7huTG, Adcy7wt, Adcy7 +/+, and Adcy7 +/− mice (supplemental Methods and Fig. 2, available at www.jneurosci.org as supplemental material). In male Adcy7huTG mice, hippocampal AC7 protein levels were increased 41% compared with male Adcy7wt mice (n = 4 mice per group; p < 0.05, one-tailed paired t test). AC7 protein levels were decreased 30% in hippocampus of male Adcy7 +/− mice compared with male Adcy7 +/+ mice (n = 3 mice per group; p < 0.05, one-tailed paired t test). In female Adcy7huTG mice, hippocampal AC7 protein levels were increased 46% compared with female Adcy7wt mice (n = 3 mice per group; p < 0.005, one-tailed paired t test). Hippocampal AC7 protein was decreased 26% in female Adcy7 +/− mice compared with female Adcy7 +/+ mice (n = 4 mice per group; p = 0.025, one-tailed paired t test).
Figure 1.

Behavioral tests with genetically modified AC7 mice. Percentage difference in immobility was calculated by dividing the time of immobility (seconds) for each mouse within a genetically modified line of mice by the mean time of immobility for the corresponding wild-type (WT) mice. Data from two mice were excluded because their responses were more than 2 SDs away from the mean. p values were computed using a t test comparing the percentage difference between genetically modified and corresponding wild-type mice, with *p < 0.05 considered statistically significant. A, FST. Transgenics (TG): male Adcy7huTG and Adcy7wt (n = 13 and 9, respectively) and female Adcy7huTG and Adcy7wt (n = 5 and 9, respectively) mice from the 11012 line, generation 14, were used. Heterozygous knockdown (HET): male Adcy7 +/− and Adcy7 +/+ (n = 8 and 9, respectively) and female Adcy7 +/− and Adcy7 +/+ (n = 7 and 10, respectively) mice from the 507 line, generation 11 or 12, were used. Females, *p = 0.03 comparing Adcy7huTG to Adcy7wt and *p = 0.05 comparing Adcy7 +/− to Adcy7 +/+. No significant differences were observed for males. B, TST. Transgenics: male Adcy7huTG and Adcy7wt (n = 9 and 10, respectively) and female Adcy7huTG and Adcy7wt (n = 9 and 10, respectively) mice from the 11004 line, generation 11, were used. Heterozygous knockdown: male Adcy7 +/− and Adcy7 +/+ (n = 16 and 9, respectively) and female Adcy7 +/− and Adcy7wt (n = 6 and 16, respectively) mice from the 507 line, generation 11 or 12, were used. † p < 0.06, female Adcy7huTG compared with Adcy7wt mice.
Figure 2.
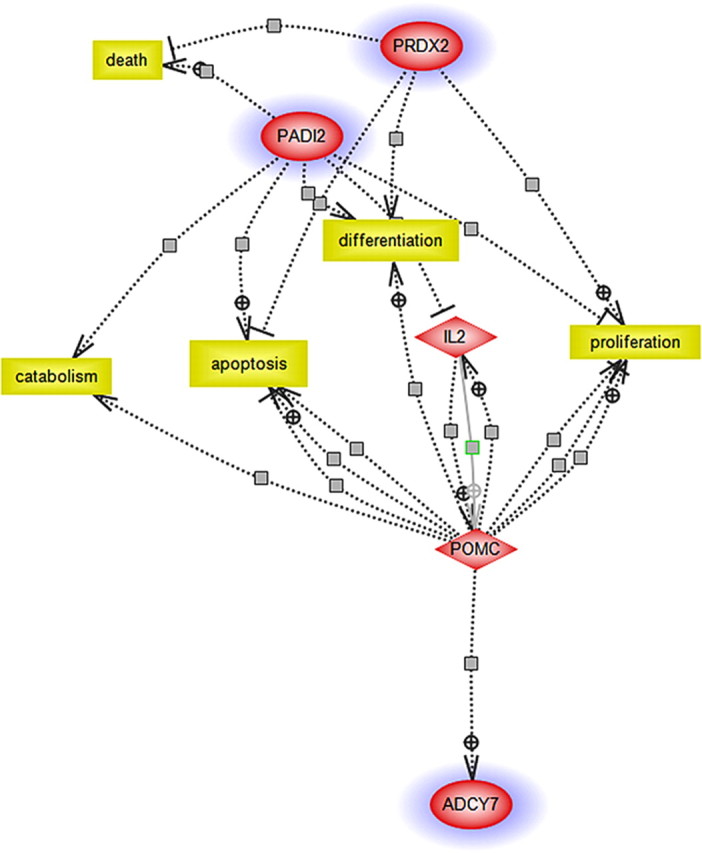
Relationships among differentially expressed genes in brains of female Adcy7 +/− mice. Possible interactions and pathways were ascertained using PathwayAssist (Stratagene). This software allows the importation of microarray data and generates relationships among the identified genes (proteins), small molecules, and cellular processes using information contained in curated and automatically created databases (PubMed and other public sources). Differentially expressed genes are indicated by blue halos. This pathway implicates endogenous opiate/stress systems (pro-opiomelanocortin) and the immune system [interleukin-2 (IL-2)], as well as the differentially expressed genes, as contributors to the behaviors measured in the female Adcy7 +/− mice. PRDX2, Peroxiredoxin 2; PADI2, type II peptidyl arginine deiminase.
To further validate differences in AC7 protein in the transgenic and knockdown mice, we assayed enzyme activity in brain tissue from these animals. All adenylyl cyclase isoforms (with the exception of the soluble form) are expressed in brain (Sunahara and Taussig, 2002). However, these enzymes display different regulatory characteristics. In particular, the activities of AC2 and AC7 are strongly stimulated by agents, such as PDBu, that activate PKC (Yoshimura and Cooper, 1993; Jacobowitz and Iyengar, 1994; Hellevuo et al., 1995b; Sunahara and Taussig, 2002; Nelson et al., 2003). Using HEK cells transfected with AC7 and human erythroleukemia cells that endogenously express AC7, we and others have also shown that stimulation of AC7 activity by agonists acting through Gs-protein is potentiated by phorbol ester activation of PKC to a much greater extent (approximately fourfold) than AC2 (Watson et al., 1994; Hellevuo et al., 1995b; Nelson et al., 2003). Assessment of adenylyl cyclase activity characteristics in cells transfected with a single enzyme isoform provides important information regarding regulatory characteristics. To assay the activity of a single enzyme isoform in brain, on the background of other expressed enzyme isoforms, requires careful consideration of these characteristics. Our approach was to take advantage of the unique regulatory properties of AC7 to determine differences in activity of this enzyme isoform in the genetically manipulated mice. Our measure of activity was the difference between PDBu-stimulated activity measured in the presence of propranolol and isoproterenol-stimulated activity measured in the presence of PDBu without propranolol. This procedure makes use of the fact that potentiation of isoproterenol stimulation of activity by PKC activation is most prominent for AC7 (Watson et al., 1994). Importantly, although agonist-stimulated activity of AC2 is also potentiated, to a lesser extent, by phorbol ester treatment (Yoshimura and Cooper, 1993; Watson et al., 1994), we noted that AC2 expression was not altered in brains of Adcy7huTG or Adcy7 +/− mice; therefore, AC2 activity becomes part of the background activity. Our results showed that, in hippocampal tissue from female mice, the difference between phorbol ester-activated activity (basal) and isoproterenol-stimulated activity, in the presence of phorbol ester treatment, was highest in Adcy7huTG mice (12.3 ± 1.4 pmol cAMP/mg protein; mean ± SEM; n = 3 mice), lowest in Adcy7 +/− mice (2 ± 1.6 pmol cAMP/mg protein; n = 3), and intermediate in Adcy7wt mice (4.7 ± 1.5 pmol cAMP/mg protein; n = 3; p < 0.01, Adcy7huTG compared with Adcy7 +/− and Adcy7wt, ANOVA and post hoc tests). In male mice, the differences were in the same direction: Adcy7huTG, 16 ± 8.5 pmol cAMP/mg protein, n = 3 mice, mean ± SEM; Adcy7 +/−, 3.4 ± 1.2 pmol cAMP/mg protein, n = 3; Adcy7wt, 9.7 ± 4.2 pmol cAMP/mg protein, n = 3. Although the activity differences were in the same direction in males and females, these differences did not reach statistical significance in the males (p < 0.1).
We evaluated Adcy7huTG and Adcy7 +/− mice in two well validated behavioral models used to assess behavioral despair (“depression”) and the efficacy of antidepressant agents in rodents: the Porsolt FST (Sunal et al., 1994) and the TST (Steru et al., 1985; Mayorga and Lucki, 2001). Both tests are based on an immobility response to an inescapable adverse situation. The duration of immobility has been inferred as a measure of behavioral despair, in which a longer duration of immobility is indicative of a greater degree of depressive-like behavior (Porsolt, 2000; Nestler et al., 2002b).
In the FST, female Adcy7huTG mice displayed an increased duration of immobility compared with wild-type controls (Fig. 1 A). There was less immobility in female Adcy7 +/− versus Adcy7 +/+ mice, suggesting that higher AC7 expression is associated with more depressive-like behavior, and lower AC7 expression is associated with less depressive-like behavior in female mice. No significant differences were observed using the FST in male mice (Fig. 1 A).
In the TST, female Adcy7huTG mice again displayed a longer duration of immobility compared with Adcy7wt mice. Although a slight diminution in the duration of immobility was evidenced in female Adcy7 +/− mice compared with their Adcy7 +/+ littermates, female Adcy7 +/− mice did not have a significantly shorter duration of immobility than Adcy7 +/+ mice. Among the males, no significant differences in behavior using the TST were observed for either the Adcy7huTG or Adcy7 +/− mice compared with their respective (Adcy7wt or Adcy7 +/+) controls (Fig. 1 B).
To examine whether the difference in depression-like behavior in female Adcy7huTG and Adcy7 +/− mice extends to differences in “anxiety,” the female mice were tested on the elevated plus maze (Cryan and Holmes, 2005). In this test, neither the fraction of time spent in the open arms of the plus maze nor the fraction of open arm entries differed significantly in Adcy7huTG versus Adcy7wt or Adcy7 +/− versus Adcy7 +/+ mice (data not shown).
Microarray analysis did not demonstrate differences in mRNA levels for any other AC isoforms represented on the arrays [AC2, AC3, AC4, AC6, AC7 (mouse), AC8, and AC9] in brains of male or female Adcy7huTG mice compared with respective Adcy7wt controls. Mouse AC7 mRNA measured by microarray analysis was reduced in brains of male and female Adcy7 +/− mice compared with Adcy7 +/+ controls, to a degree similar to that found by RT-PCR (described above). There were no significant differences in mRNA levels for any of the other AC isoforms in Adcy7 +/− mice compared with Adcy7 +/+ controls.
Gene expression patterns in whole brains of Adcy7 huTG, Adcy7 +/−, Adcy7wt, and Adcy7 +/+ mice
To determine whether alterations in AC7 expression affected the expression of other genes in the brain, whole-brain gene expression profiles of AdcyhuTG and Adcy7 +/− mice and their respective controls (Adcy7wt and Adcy7 +/+) were determined using Affymetrix oligonucleotide arrays. Array data were normalized, and statistically significant differences in gene expression were determined as described in Materials and Methods (Tabakoff et al., 2003; Saba et al., 2006). Using two types of statistical analyses that control for multiple comparisons (at a significance level of p < 0.05), there were no transcripts differentially expressed in brain between Adcy7huTG and Adcy7wt male or female mice. The mouse microarrays (MGU74A version 2 from Affymetrix) do not recognize mRNA for human AC7, which is overexpressed in the Adcy7huTG mice. Because there are no significant transcriptional differences other than the human AC7 gene expression between Adcy7huTG and Adcy7wt mice, yet the female mice display differences in behavior in tests related to depression, the AC7 gene, which is localized within a behavioral QTL for the forced swim test and tail suspension test (chromosome 8, 86.6–126.6 Mb) (Yoshikawa et al., 2002), is a prime candidate gene for influencing these tests in the Adcy7huTG female mice.
Comparison of brain gene expression profiles between male Adcy7 +/− and Adcy7 +/+ controls showed that, at a significance level of p < 0.05, there were no differentially expressed transcripts (except for AC7). In contrast to males, there were 30 differentially expressed transcripts (in addition to AC7), at the significance level of p < 0.05, with control for multiple comparisons, between female Adcy7 +/− and Adcy7 +/+ mice (supplemental Table 4, available at www.jneurosci.org as supplemental material). The 30 differentially expressed transcripts were subjected to additional filtering procedures, as described in Materials and Methods. eQTL analysis indicated that eight of the transcripts had significant or suggestive LOD scores (supplemental Table 4, available at www.jneurosci.org as supplemental material). Of these transcripts, two had significant eQTLs that overlapped with previously described behavioral QTLs for the forced swim test or tail suspension test (Yoshikawa et al., 2002), and the genes coding these transcripts may therefore be considered as additional candidates (in addition to AC7) that affect behavior of the Adcy7 +/− female mice in these tests. The two transcripts that passed all of our filters are peroxiredoxin 2 and type II peptidyl arginine deiminase. The differences in these two transcripts were also assessed by qRT-PCR using mRNA from whole brains of female Adcy7 +/+ and Adcy7 +/− mice. The level of mRNA for peroxiredoxin 2 was significantly lower in brains of female Adcy7 +/− mice (relative quantity of 0.35 compared with Adcy7 +/+; p < 0.009, Student's t test; n = 8 mice). However, there was no significant difference between female Adcy7 +/+ and Adcy7 +/− mice with respect to the whole-brain mRNA levels for type II peptidyl arginine deiminase, as measured by qRT-PCR (supplemental Table 3, available at www.jneurosci.org as supplemental material). We noted previously (Saba et al., 2006) that qRT-PCR is less suitable for validation of microarray results when the magnitude of differential expression is small (13% for type II peptidyl arginine deiminase) because of the variability of the qRT-PCR technique (Bustin and Nolan, 2004). Therefore, we decided to introduce both of the differentially expressed transcripts and AC7 into a program, PathwayAssist (Stratagene), that uses co-citations to generate relationships between the entered elements (supplemental Methods, available at www.jneurosci.org as supplemental material). The relational pathway that was generated by PathwayAssist (Fig. 2) included, in addition to the three genes that were entered into the program, the endogenous opiate and ACTH precursor peptide [pro-opiomelanocortin (POMC)] and the immune system signaling molecule interleukin-2 (see Discussion).
Genetic variation in ADCY7 is associated with familial depression in humans
Our data from the Adcy7 mouse models suggest that the manipulation of AC7 expression levels in the brain influences depression-like behavior. Combined with the gene expression profiles of the mouse brain, the results suggest that increased depression-like behavior in female transgenic mice may be a result of an increase in brain AC7 expression. Given this premise, we evaluated the association of polymorphisms in the human ADCY7 gene with major depressive disorder in a human population.
Using a Caucasian population from Montreal, Canada (Table 1) (Glanz et al., 2002), we initially examined the relationship between a tetranucleotide (AACA) repeat polymorphism in the 3′ UTR of the ADCY7 gene (D16S2967) (Fig. 3) with major depressive disorder (DSM-IV). This polymorphism was selected because of its putative role in regulation of gene expression based on its location within the 3′ UTR (Hellevuo et al., 1997). In the overall population, the AACA genotype was in Hardy–Weinberg equilibrium (p = 0.70). The observed allele frequencies for the AACA repeat polymorphisms among all genotyped individuals with no previous history of DSM-IV major depressive disorder (n = 321) were 22.9% for (AACA)5, 53.7% for (AACA)6, and 23.2% for (AACA)7. Among all genotyped individuals who met the DSM-IV criteria for diagnosis of major depressive disorder sometime during their lifetime (n = 151), the frequencies were 20.2, 54.0, and 25.8%, respectively. Neither the (AACA)4 nor the (AACA)8 alleles were observed in this population [although they have appeared at very low frequencies in our other populations (Hellevuo et al., 1997 and data not shown)].
To further explore the relationship between the (AACA) repeat polymorphism and major depressive disorder, we conducted both univariate and multivariate logistic regression controlling for potential confounding variables, specifically sex, age, lifetime history of alcohol dependence/abuse, and lifetime history of marijuana dependence. The cross-sectional design of our study is limiting because of the inability to identify those individuals who have not yet experienced a diagnosis of major depression but will eventually experience one during their lifetime. Given this caveat, we also explored the relationship between the presence of the (AACA) repeat polymorphism and the reported occurrence of a family history of major depression (DSM-IV) among first-degree relatives of our probands (Merikangas et al., 2002). Because our work with mice suggested a sex-specific effect of AC7, we assessed these relationships between AC7 polymorphisms and depression separately for men and women. We observed an increased risk for major depression among females with the (AACA)7 allele compared with all other alleles; however, this did not reach statistical significance (adjusted OR of 1.28 per (AACA)7 allele; 95% CI of 0.82–2.01; p = 0.28). We did observe a significant relationship between the (AACA)7 allele and the occurrence of a family history of depression in females [adjusted OR of 1.70 per (AACA)7 allele; 95% CI of 1.08–2.68; p = 0.02] (Table 2). Because it has been suggested that a predisposing genetic factor for depression should appear at a higher frequency among individuals (subjects) whose family members also display the disorder (Jennison and Johnson, 1998), we further examined the relationship between the (AACA)7 allele and depression in familially depressed individuals. The familially depressed individuals were defined as individuals who had both a history of major depression during their lifetime and had a first-degree relative with a history of major depression. Among individuals with familial depression, the frequencies of the (AACA)5, (AACA)6, and (AACA)7 alleles were 19.4, 48.5, and 32.1%, respectively. Based on both univariate and multivariate analyses, a significant association was observed for the (AACA)7 allele and familial depression (Table 3). Compared with all other alleles, an increased risk for familial depression was observed with the (AACA)7 allele [adjusted OR of 1.84 per (AACA)7 allele; 95% CI of 1.17–2.88; p = 0.008]. Overall, we observed an approximate twofold increased risk for the (AACA)7 allele and familial depression when males and females were grouped together. When subjects were stratified by gender, this association was borderline in terms of statistical significance among males (p = 0.08) and statistically significant among females only (p = 0.04) (Table 3).
Table 2.
Association of AACA repeat polymorphism in ADCY7 with family history of depression
| Genotype | Family history
a
n (%) |
Unadjusted OR (95% CI) | p | Adjusted OR (95% CI) b | p | |
|---|---|---|---|---|---|---|
| Yes | No | |||||
| Males and Females | ||||||
| No (AACA)7 allele | 74 (55) | 199 (59) | 1.0 (reference) | 1.0 (reference) | ||
| (AACA)7 (additive) | 60 (45) | 139 (41) | 1.23 (0.89–1.70) | 0.20 | 1.32 (0.94–1.85) | 0.11 |
| Females | ||||||
| No (AACA)7 allele | 39 (51) | 102 (65) | 1.0 (reference) | 1.0 (reference) | ||
| (AACA)7 (additive) | 37 (49) | 56 (35) | 1.73 (1.12–2.68) | 0.01 | 1.70 (1.08–2.68) | 0.02 |
| Males | ||||||
| No (AACA)7 allele | 35 (60) | 97 (54) | 1.0 (reference) | 1.0 (reference) | ||
| (AACA)7 (additive) | 23 (40) | 83 (46) | 0.82 (0.50–1.37) | 0.45 | 0.95 (0.56–1.60) | 0.84 |
a Family history of major depressive disorder in a first-degree family member.
b Age, gender (for combined analysis), personal history of alcohol abuse or dependence, and personal history of marijuana dependence were included in the multivariate model.
Table 3.
Association of AACA repeat polymorphism in ADCY7 with familial depression
| Genotype | Familial depression
a
n (%) |
Unadjusted OR (95% CI) | p | Adjusted OR (95% CI) b | p | |
|---|---|---|---|---|---|---|
| Cases | Controls c | |||||
| Males and Females | ||||||
| No (AACA)7 allele | 33 (49) | 187 (58) | 1.0 (reference) | 1.0 (reference) | ||
| (AACA)7 (additive) | 34 (51) | 134 (42) | 1.57 (1.04–2.36) | 0.03 | 1.84 (1.17–2.88) | 0.008 |
| Females | ||||||
| No (AACA)7 allele | 20 (48) | 90 (63) | 1.0 (reference) | 1.0 (reference) | ||
| (AACA)7 (additive) | 22 (52) | 54 (37) | 1.80 (1.06–3.04) | 0.03 | 1.82 (1.04–3.22) | 0.04 |
| Males | ||||||
| No (AACA)7 allele | 13 (52) | 97 (55) | 1.0 (reference) | 1.0 (reference) | ||
| (AACA)7 (additive) | 12 (48) | 80 (45) | 1.32 (0.67–2.58) | 0.42 | 1.97 (0.93–4.18) | 0.08 |
a A diagnosis of familial depression is assigned when individuals exhibit both a diagnosis of DSM-IV major depression and at least one of their first-degree family members is ascertained to have been depressed through the interview of the proband.
b Age, gender (for combined analysis), personal history of alcohol abuse or dependence, and personal history of marijuana dependence were included in the multivariate model.
c The control group for familial depression includes nondepressed subjects only.
To explore the possibility that the (AACA)7 allele may be in linkage disequilibrium with some other unidentified functional variant in the region of the AC7 gene, we conducted a haplotype analysis. We selected eight SNPs spanning the ADCY7 gene region (Fig. 3 illustrates the eight SNPs used in our analysis). On average, 95.8% of the individuals were successfully genotyped for these SNPs. The minor allele frequencies ranged from 15 to 50% for the selected SNPs. All markers were determined to be in Hardy–Weinberg equilibrium. Using Haploview version 2.05, two haplotype blocks surrounding the 3′ UTR repeat were identified (Fig. 4). The block within the ADCY7 gene region contained two SNPs (hCV9606780 and hCV25605094) that were, respectively, 984 and 9020 bp away from the microsatellite marker. Both of these SNPs were significantly associated with the microsatellite marker (p < 0.0001). To evaluate whether the observed associations are potentially a reflection of population stratification, SNPs with published allele frequencies that are dependent on ethnicity (hCV1232083, hCV183346, and hCV1168827) were evaluated. No associations were observed between these individual SNPs and familial depression.
Figure 4.

Linkage disequilibrium (LD) relationships of genotyped SNPs across the ADCY7 locus. Haploview version 2.05 (Barrett et al., 2005) was used to estimate linkage disequilibrium and identify haplotype blocks. LD was computed using a two-marker expectation–maximization (EM) algorithm to estimate maximum likelihood values for deriving an estimate of linkage disequilibrium (D′). Based on criteria defined by Gabriel et al. (2002), two haplotype blocks that each included two SNPs (8 kb) were identified. Only block 1 was located within the ADCY7 gene. The tetranucleotide repeat in the 3′ untranslated region of the ADCY7 gene is located 984 bp from hCV9606780. Each square represents the LD relationships between SNPs, with red denoting strong LD and a high degree of statistical confidence.
An additional haplotype block containing two SNPs (hCV183346 and hCV148486) was identified adjacent to the 3′ UTR repeat but located within the bromodomain BRD7 gene region. As indicated by the high values of linkage disequilibrium within this region, it is likely that the entire region containing the two adjacent haplotype blocks may in fact represent one block. Using Phase version 2.1 (Stephens and Donnelly, 2003), haplotypes were predicted for each individual with the microsatellite marker and two SNPs (hCV9606780 and hCV25605094) residing in the ADCY7 gene region, as well as with the microsatellite marker and the four surrounding SNPs (hCV9606780, hCV25605094, hCV183346, and hCV148486) residing in the region encompassing the two haplotype blocks. The results were very similar, so only the results for the larger block are presented. Eighteen haplotypes were observed with the five markers in the haplotype block (i.e., hCV25605094, hCV9606780, the ADCY7 five-, six-, or seven-repeat allele, hCV183346, and hCV148486), with five of the haplotypes having a frequency of >2.5%. The frequency of the most common haplotypes among familially depressed and nondepressed individuals is presented in Table 4. As illustrated in Table 4, the TG7AT haplotype was more prevalent among individuals with familial depression than controls. Compared with individuals (both males and females) without the identified TG7AT haplotype, the high-risk haplotype was associated with a statistically significant 1.8-fold increased risk for familial depression in the total population (Table 5). Furthermore, this relationship was gender specific, i.e., only statistically significant in women (adjusted OR of 2.21; 95% CI of 1.23–3.96; p = 0.008).
Table 5.
Association of TG7AT haplotype with familial depression
| Haplotype a | Familial depression
b
n (%) |
Unadjusted OR (95% CI) | p | Adjusted OR (95% CI) c | p | |
|---|---|---|---|---|---|---|
| Cases | Controls d | |||||
| Males and females | ||||||
| No TG7AT allele | 35 (52) | 208 (60) | 1.0 (reference) | 1.0 (reference) | ||
| TG7AT allele (additive) | 32 (48) | 136 (40) | 1.56 (1.03–2.36) | 0.04 | 1.82 (1.15–2.88) | 0.01 |
| Females | ||||||
| No TG7AT allele | 20 (48) | 99 (64) | 1.0 (reference) | 1.0 (reference) | ||
| TG7AT allele (additive) | 22 (52) | 55 (36) | 1.93 (1.15–3.26) | 0.01 | 2.21 (1.23–3.96) | 0.008 |
| Males | ||||||
| No TG7AT allele | 15 (60) | 109 (57) | 1.0 (reference) | 1.0 (reference) | ||
| TG7AT allele (additive) | 10 (40) | 81 (43) | 1.07 (0.52–2.19) | 0.85 | 1.34 (0.61–2.94) | 0.46 |
a More than 88% of the individuals had predicted haplotypes with >80% certainty. A weighted regression model based on the estimated probabilities of each haplotype for every individual was utilized.
b A diagnosis of familial depression is assigned when individuals exhibit both a diagnosis of DSM-IV major depression and at least one of their first-degree family members is ascertained to have been depressed through the interview of the proband.
c Age, gender (for combined analysis), personal history of alcohol abuse or dependence, and personal history of marijuana dependence were included in the multivariate model.
d The control group for familial depression includes nondepressed subjects only.
Discussion
This study makes use of genetically modified mice, nonhuman animal models of depression, genomic information on gene expression in brain, and QTL information to provide evidence for candidate genes that influence behaviors associated with depression in mice. The most prominent of the identified candidate genes was then investigated in a genetic association study in a population of unrelated humans. The animal and human studies reveal a sex-specific genetic relationship of the adenylyl cyclase type VII gene (Adcy7) with the diagnosis of major depressive disorder in humans and in behavior related to depression in mice.
The female Adcy7huTG mice consistently showed more depression-like behavior (immobility), regardless of the test used. Because the microarray data did not reveal any differences in transcript expression between brains of female (or male) Adcy7huTG mice and their Adcy7wt controls, one can suggest that the overexpression of human AC7 in brains of the transgenic mice represents a key factor in the phenotype of increased depression-related behavior, as measured using both the FST and TST. This suggestion may be tempered by considerations of the sensitivity of the microarray analysis and the possibility that more changes in gene expression attributable to altered AC7 expression could occur if the system were activated, e.g., by stressful conditions. Nevertheless, the localization of the AC7 gene in a QTL region associated with both of these behavioral tests of depression supports an important role for AC7 in the depression phenotype.
Although several reports have appeared recently regarding quantitative measures and activity status of PKA and CREB proteins in the CNS of animals that differ in the behavioral tests of depression (FST and TST) and/or after animals have been treated with antidepressants, the data are not uniform (Carlezon et al., 2005). The influence of increases or decreases in the activity of the cAMP signaling pathway on depressive behavior may be a function of the anatomical area of brain being examined (Nibuya et al., 1996; Thome et al., 2000; Pliakas et al., 2001; Carlezon et al., 2005). In a previous study, we observed increased levels of phosphorylation of Ser-34 on dopamine and cAMP-regulated phosphoprotein-32, a PKA-mediated event, in the nucleus accumbens of the Adcy7huTG mice compared with Adcy7wt mice but not in the striatum (Donohue et al., 2005). Thus, one can postulate that the overexpression of AC7 in the brain of the Adcy7huTG mice has functional consequences but not in all brain areas. Such results can arise for many reasons, including unequal transcription and/or translation of AC7 across brain areas.
In a preliminary in situ hybridization analysis, we observed higher levels of AC7 mRNA expression in the hippocampus, medial habenular nucleus, and paraventricular nucleus of the male and female Adcy7huTG mice compared with the Adcy7wt controls (supplemental Methods, Fig. 3, Table 1, available at www.jneurosci.org as supplemental material). The increased AC7 expression in the habenula of the Adcy7huTG mice may be of particular interest, because increased metabolic activity in the habenula has been reported in three different animal models of depression, in rats selectively bred for congenital helplessness (Caldecott-Hazard et al., 1988; Shumake et al., 2003), and in humans with high Hamilton depression scores (Morris et al., 1999).
Our data suggest that reduced levels of endogenous AC7 in the Adcy7 +/− mice protect against some manifestations of depression (as observed for female Adcy7 +/− mice in the forced swim test). However, the reduction in AC7 expression did not produce significant differences in behavior when measured in the TST. Although the FST and TST seem to measure similar behavior and at least one QTL region for the two tests overlap, each test also has unique QTL regions associated with it (Yoshikawa et al., 2002). Thus, the processes measured by these tests are likely mediated, in part, by different genetic mechanisms. Our finding that other genes (in addition to AC7) were differentially expressed in brains of female Adcy7 +/− compared with Adcy7 +/+ mice provides a possible basis for the different behavioral responses in the two tests. One of these differentially expressed genes, peroxiredoxin 2, which is expressed at higher levels in the wild-type mice, is localized in, and has an expression (e)QTL within, a behavioral QTL for both the tail suspension and forced swim tests (supplemental Table 4, available at www.jneurosci.org as supplemental material). However, the other differentially expressed gene, peptidyl arginine deiminase, is localized within, and has an eQTL within, a behavioral QTL that is unique to the tail suspension test (supplemental Table 4, available at www.jneurosci.org as supplemental material). The analysis of the relationship between peroxiredoxin 2, peptidyl arginine deiminase, and AC7 uncovers a pathway that involves POMC and interleukin 2 (Fig. 2). Both of these systems have been linked to stress and depression (Anisman et al., 2002; Nemeroff and Vale, 2005). These findings suggest that it is not only the decrease in AC7 expression in the female Adcy7 +/− mice that may influence behavior in the tests of depression but that other related changes in brain gene expression may selectively modulate behavior in particular tests.
It has been repeatedly found that the prevalence of depression in women is higher than that in men (Earls, 1987; Blazer et al., 1994), and it has been suggested that this gender difference is related to major depression that is comorbid with anxiety disorder (Breslau et al., 1995). We found no evidence that female Adcy7huTG or Adcy7 +/− mice differed from controls in anxiety-related behaviors (elevated plus maze). In animal models of depression, differences in immobility between males and females have been attributed to both steroid hormonal and nonhormonal influences (Kennett et al., 1986; Alonso et al., 1991; Palanza, 2001; Galea et al., 2002). A role of AC7 in the control of ACTH and glucocorticoid release during stress has been proposed (Antoni et al., 2003), and, as noted, differentially expressed genes related to the ACTH system (POMC) were found in brains of female Adcy7 +/− mice (Fig. 2). Interestingly, a factor analysis suggested that baseline immobility in the TST reflects “stress reactivity” (Liu and Gershenfeld, 2003). These results are consistent with a hypothesis that altered expression of AC7 in the female mice may interact with stress-related hormones to affect the behavioral responses to the stress of the forced swim and tail suspension tests.
The mouse data led us to evaluate the association of a polymorphism in the human AC7 gene with a diagnosis of major depressive disorder in humans. The results demonstrated a significant association in women between a tetranucleotide repeat polymorphism [(AACA)7] in the 3′ untranslated region of the AC7 gene (ADCY7), as well as a haplotype containing the repeat polymorphism, and the phenotype of familial depression (DSM-IV depression in the subject and in a first-degree relative of that subject). It should be noted that the haplotype block includes the genomic region spanning both ADCY7 and BRD7. BRD7 is a novel bromodomain gene that is believed to be involved in signal-dependent transcriptional regulation. Recent data suggest that BRD7 may play a role in certain cancers (Zhou et al., 2004), yet there is no evidence to suggest that it is involved in the etiology of any psychiatric disorder.
There is considerable evidence linking the 3′ UTRs of genes to translational control (Xie et al., 2005), but association of the 3′ UTR region with various regulatory factors (e.g., short RNAs or proteins) affects translation through mechanisms that are not completely understood (Kuersten and Goodwin, 2003). Our preliminary in vitro studies (Pronko et al., 2005) suggest an influence of different length (AACA) polymorphisms in the ADCY7 3′ UTR on transcriptional/translational efficiency, as assessed in a firefly luciferase assay. The upstream (5′) region of the ADCY7 gene contains at least four estrogen response-“like” elements that could interact with 3′ control elements to regulate AC7 levels in a gender-specific manner (Tsai and O'Malley, 1994; Darimont et al., 1998; Hart and Davie, 2002).
It needs to be clear that our results point to an association between polymorphisms in the ADCY7 gene and a familial form of depression, i.e., there is a difference in allele frequency between depressed women with a family history of depression and controls. Caution is needed when relying on the report of the interviewee regarding the presence of clinical depression in their first-degree relatives. Gershon and Guroff (1984) have indicated that the κ values for diagnostic agreement between a clinician's diagnosis of unipolar depression in an individual and a relative's report is 0.42, which is considered fair. Structured interviews such as the one we used can optimize the acquisition of family history information (Heun and Muller, 1998; Ptok et al., 2001). Nevertheless, the lack of direct interview data from the relatives of the subjects represents a significant limitation in a population-based study.
In summary, we identified a sex-specific influence of the ADCY7 gene on depression, using both animal models and an association study in a human population. A recent publication by Kendler et al. (2006) demonstrated that major depression was almost twice as heritable in women compared with men and “that some genetic risk factors are sex-specific in their effects.” Polymorphisms in the ADCY7 gene that potentially affect the level of expression of AC7 in brain may represent one of such “risk factors.”
Footnotes
This work was supported in part by National Institute on Alcohol Abuse and Alcoholism/National Institutes of Health Grants AA U01 13489–Integrated Neuroscience Initiative on Alcoholism Project and AA R01 13162 (B.T.), and by the Banbury Fund. We thank Natalie Thomas for outstanding technical assistance.
Contributor Information
Collaborators: World Health Organization/International Society for Biomedical Research on Alcoholism Study on State and Trait Markers of Alcohol Use and Dependence Investigators
References
- Alonso SJ, Castellano MA, Afonso D, Rodriguez M. Sex differences in behavioral despair: relationships between behavioral despair and open field activity. Physiol Behav. 1991;49:69–72. doi: 10.1016/0031-9384(91)90232-d. [DOI] [PubMed] [Google Scholar]
- American Psychiatric Association. Ed 4. Washington, DC: American Psychiatric Association; 1994. Diagnostic and statistical manual of mental disorders. [Google Scholar]
- Anchordoquy HC, McGeary C, Liu L, Krauter KS, Smolen A. Genotyping of three candidate genes after whole-genome preamplification of DNA collected from buccal cells. Behav Genet. 2003;33:73–78. doi: 10.1023/a:1021007701808. [DOI] [PubMed] [Google Scholar]
- Anisman H, Hayley S, Turrin N, Merali Z. Cytokines as a stressor: implications for depressive illness. Int J Neuropsychopharmacol. 2002;5:357–373. doi: 10.1017/S1461145702003097. [DOI] [PubMed] [Google Scholar]
- Antoni FA, Sosunov AA, Haunso A, Paterson JM, Simpson J. Short-term plasticity of cyclic adenosine 3′,5′-monophosphate signaling in anterior pituitary corticotrope cells: the role of adenylyl cyclase isotypes. Mol Endocrinol. 2003;17:692–703. doi: 10.1210/me.2002-0369. [DOI] [PubMed] [Google Scholar]
- Barrett JC, Fry B, Maller J, Daly MJ. Haploview: analysis and visualization of LD and haplotype maps. Bioinformatics. 2005;21:263–265. doi: 10.1093/bioinformatics/bth457. [DOI] [PubMed] [Google Scholar]
- Blazer DG, Kessler RC, McGonagle KA, Swartz MS. The prevalence and distribution of major depression in a national community sample: the National Comorbidity Survey. Am J Psychiatry. 1994;151:979–986. doi: 10.1176/ajp.151.7.979. [DOI] [PubMed] [Google Scholar]
- Breslau N, Schultz L, Peterson E. Sex differences in depression: a role for preexisting anxiety. Psychiatry Res. 1995;58:1–12. doi: 10.1016/0165-1781(95)02765-o. [DOI] [PubMed] [Google Scholar]
- Broman KW, Wu H, Sen S, Churchill GA. R/qtl: QTL mapping in experimental crosses. Bioinformatics. 2003;19:889–890. doi: 10.1093/bioinformatics/btg112. [DOI] [PubMed] [Google Scholar]
- Bustin SA, Nolan T. Pitfalls of quantitative real-time reverse-transcription polymerase chain reaction. J Biomol Tech. 2004;15:155–166. [PMC free article] [PubMed] [Google Scholar]
- Caldecott-Hazard S, Mazziotta J, Phelps M. Cerebral correlates of depressed behavior in rats, visualized using 14C-2-deoxyglucose autoradiography. J Neurosci. 1988;8:1951–1961. doi: 10.1523/JNEUROSCI.08-06-01951.1988. [DOI] [PMC free article] [PubMed] [Google Scholar]
- Carlezon WA, Jr, Duman RS, Nestler EJ. The many faces of CREB. Trends Neurosci. 2005;28:436–445. doi: 10.1016/j.tins.2005.06.005. [DOI] [PubMed] [Google Scholar]
- Cooper DM. Regulation and organization of adenylyl cyclases and cAMP. Biochem J. 2003;375:517–529. doi: 10.1042/BJ20031061. [DOI] [PMC free article] [PubMed] [Google Scholar]
- Cryan JF, Holmes A. The ascent of mouse: advances in modelling human depression and anxiety. Nat Rev Drug Discov. 2005;4:775–790. doi: 10.1038/nrd1825. [DOI] [PubMed] [Google Scholar]
- Darimont BD, Wagner RL, Apriletti JW, Stallcup MR, Kushner PJ, Baxter JD, Fletterick RJ, Yamamoto KR. Structure and specificity of nuclear receptor-coactivator interactions. Genes Dev. 1998;12:3343–3356. doi: 10.1101/gad.12.21.3343. [DOI] [PMC free article] [PubMed] [Google Scholar]
- Donati RJ, Rasenick MM. G protein signaling and the molecular basis of antidepressant action. Life Sci. 2003;73:1–17. doi: 10.1016/s0024-3205(03)00249-2. [DOI] [PubMed] [Google Scholar]
- Donohue T, Hoffman PL, Tabakoff B. Effect of ethanol on DARPP-32 phosphorylation in transgenic mice that express human type VII adenylyl cyclase in brain. Alcohol Clin Exp Res. 2005;29:310–316. doi: 10.1097/01.alc.0000156179.22112.0f. [DOI] [PubMed] [Google Scholar]
- Earls F. Sex differences in psychiatric disorders: origins and developmental influences. Psychiatr Dev. 1987;5:1–23. [PubMed] [Google Scholar]
- Eaves IA, Wicker LS, Ghandour G, Lyons PA, Peterson LB, Todd JA, Glynne RJ. Combining mouse congenic strains and microarray gene expression analyses to study a complex trait: the NOD model of type 1 diabetes. Genome Res. 2002;12:232–243. [PubMed] [Google Scholar]
- Gabriel SB, Schaffner SF, Nguyen H, Moore JM, Roy J, Blumenstiel B, Higgins J, DeFelice M, Lochner A, Faggart M, Liu-Cordero SN, Rotimi C, Adeyemo A, Cooper R, Ward R, Lander ES, Daly MJ, Altshuler D. The structure of haplotype blocks in the human genome. Science. 2002;296:2225–2229. doi: 10.1126/science.1069424. [DOI] [PubMed] [Google Scholar]
- Galea LA, Lee TT, Kostaras X, Sidhu JA, Barr AM. High levels of estradiol impair spatial performance in the Morris water maze and increase “depressive-like” behaviors in the female meadow vole. Physiol Behav. 2002;77:217–225. doi: 10.1016/s0031-9384(02)00849-1. [DOI] [PubMed] [Google Scholar]
- Gershon ES, Guroff JJ. Information from relatives. Diagnosis of affective disorders. Arch Gen Psychiatry. 1984;41:173–180. doi: 10.1001/archpsyc.1984.01790130069010. [DOI] [PubMed] [Google Scholar]
- Glanz J, Grant B, Monteiro M, Tabakoff B. WHO/ISBRA study on state and trait markers of alcohol use and dependence: analysis of demographic, behavioral, physiologic, and drinking variables that contribute to dependence and seeking treatment. International Society on Biomedical Research on Alcoholism. Alcohol Clin Exp Res. 2002;26:1047–1061. [PubMed] [Google Scholar]
- Grant BF, Dawson DA, Stinson FS, Chou PS, Kay W, Pickering R. The alcohol use disorder and associated disabilities interview schedule-IV (AUDADIS-IV): reliability of alcohol consumption, tobacco use, family history of depression and psychiatric diagnostic modules in a general population sample. Drug Alcohol Depend. 2003;71:7–16. doi: 10.1016/s0376-8716(03)00070-x. [DOI] [PubMed] [Google Scholar]
- Hanoune J, Defer N. Regulation and role of adenylyl cyclase isoforms. Annu Rev Pharmacol Toxicol. 2001;41:145–174. doi: 10.1146/annurev.pharmtox.41.1.145. [DOI] [PubMed] [Google Scholar]
- Hart LL, Davie JR. The estrogen receptor: more than the average transcription factor. Biochem Cell Biol. 2002;80:335–341. doi: 10.1139/o02-038. [DOI] [PubMed] [Google Scholar]
- Hasin D, Carpenter KM, McCloud S, Smith M, Grant BF. The Alcohol Use Disorder and Associated Disabilities Interview Schedule (AUDADIS): reliability of alcohol and drug modules in a clinical sample. Drug Alcohol Depend. 1997;44:133–141. doi: 10.1016/s0376-8716(97)01332-x. [DOI] [PubMed] [Google Scholar]
- Hellevuo K, Berry R, Sikela JM, Tabakoff B. Localization of the gene for a novel human adenylyl cyclase (ADCY7) to chromosome 16. Hum Genet. 1995a;95:197–200. doi: 10.1007/BF00209401. [DOI] [PubMed] [Google Scholar]
- Hellevuo K, Yoshimura M, Mons N, Hoffman PL, Cooper DM, Tabakoff B. The characterization of a novel human adenylyl cyclase which is present in brain and other tissues. J Biol Chem. 1995b;270:11581–11589. doi: 10.1074/jbc.270.19.11581. [DOI] [PubMed] [Google Scholar]
- Hellevuo K, Welborn R, Menninger JA, Tabakoff B. Human adenylyl cyclase type 7 contains polymorphic repeats in the 3′ untranslated region: investigations of association with alcoholism. Am J Med Genet. 1997;74:95–98. doi: 10.1002/(sici)1096-8628(19970221)74:1<95::aid-ajmg19>3.0.co;2-m. [DOI] [PubMed] [Google Scholar]
- Heun R, Muller H. Interinformant reliability of family history information on psychiatric disorders in relatives. Eur Arch Psychiatry Clin Neurosci. 1998;248:104–109. doi: 10.1007/s004060050025. [DOI] [PubMed] [Google Scholar]
- Hines LM, Tabakoff B. Platelet adenylyl cyclase activity: a biological marker for major depression and recent drug use. Biol Psychiatry. 2005;58:955–962. doi: 10.1016/j.biopsych.2005.05.040. [DOI] [PubMed] [Google Scholar]
- Houslay MD, Schafer P, Zhang KY. Keynote review: phosphodiesterase-4 as a therapeutic target. Drug Discov Today. 2005;10:1503–1519. doi: 10.1016/S1359-6446(05)03622-6. [DOI] [PubMed] [Google Scholar]
- Irizarry RA, Hobbs B, Collin F, Beazer-Barclay YD, Antonellis KJ, Scherf U, Speed TP. Exploration, normalization, and summaries of high density oligonucleotide array probe level data. Biostatistics. 2003;4:249–264. doi: 10.1093/biostatistics/4.2.249. [DOI] [PubMed] [Google Scholar]
- Jacobowitz O, Iyengar R. Phorbol ester-induced stimulation and phosphorylation of adenylyl cyclase 2. Proc Natl Acad Sci USA. 1994;91:10630–10634. doi: 10.1073/pnas.91.22.10630. [DOI] [PMC free article] [PubMed] [Google Scholar]
- Jennison KM, Johnson KA. Alcohol dependence in adult children of alcoholics: longitudinal evidence of early risk. J Drug Educ. 1998;28:19–37. doi: 10.2190/BRRQ-W96E-UGJN-GA9R. [DOI] [PubMed] [Google Scholar]
- Kendler KS, Gatz M, Gardner CO, Pedersen NL. A Swedish national twin study of lifetime major depression. Am J Psychiatry. 2006;163:109–114. doi: 10.1176/appi.ajp.163.1.109. [DOI] [PubMed] [Google Scholar]
- Kennett GA, Chaouloff F, Marcou M, Curzon G. Female rats are more vulnerable than males in an animal model of depression: the possible role of serotonin. Brain Res. 1986;382:416–421. doi: 10.1016/0006-8993(86)91355-7. [DOI] [PubMed] [Google Scholar]
- Kuersten S, Goodwin EB. The power of the 3′ UTR: translational control and development. Nat Rev Genet. 2003;4:626–637. doi: 10.1038/nrg1125. [DOI] [PubMed] [Google Scholar]
- Liu X, Gershenfeld HK. An exploratory factor analysis of the tail suspension test in 12 inbred strains of mice and an F2 intercross. Brain Res Bull. 2003;60:223–231. doi: 10.1016/s0361-9230(03)00033-9. [DOI] [PubMed] [Google Scholar]
- Livak KJ, Schmittgen TD. Analysis of relative gene expression data using real-time quantitative PCR and the 2(-Delta Delta C(T)) Method. Methods. 2001;25:402–408. doi: 10.1006/meth.2001.1262. [DOI] [PubMed] [Google Scholar]
- Maes M, Delanghe J, Scharpe S, Meltzer HY, Cosyns P, Suy E, Bosmans E. Haptoglobin phenotypes and gene frequencies in unipolar major depression. Am J Psychiatry. 1994;151:112–116. doi: 10.1176/ajp.151.1.112. [DOI] [PubMed] [Google Scholar]
- Mayorga AJ, Lucki I. Limitations on the use of the C57BL/6 mouse in the tail suspension test. Psychopharmacology (Berl) 2001;155:110–112. doi: 10.1007/s002130100687. [DOI] [PubMed] [Google Scholar]
- McDaniel J. Depression, medical illness, and health care. In: Levenson J, editor. Depression. Philadelphia: American College of Physicians; 2000. pp. 1–21. [Google Scholar]
- Menkes DB, Rasenick MM, Wheeler MA, Bitensky MW. Guanosine triphosphate activation of brain adenylate cyclase: enhancement by long-term antidepressant treatment. Science. 1983;219:65–67. doi: 10.1126/science.6849117. [DOI] [PubMed] [Google Scholar]
- Menninger JA, Tabakoff B. Forskolin-stimulated platelet adenylyl cyclase activity is lower in persons with major depression. Biol Psychiatry. 1997;42:30–38. doi: 10.1016/S0006-3223(96)00245-4. [DOI] [PubMed] [Google Scholar]
- Merikangas KR, Chakravarti A, Moldin SO, Araj H, Blangero JC, Burmeister M, Crabbe J, Jr, Depaulo JR, Jr, Foulks E, Freimer NB, Koretz DS, Lichtenstein W, Mignot E, Reiss AL, Risch NJ, Takahashi JS. Future of genetics of mood disorders research. Biol Psychiatry. 2002;52:457–477. doi: 10.1016/s0006-3223(02)01471-3. [DOI] [PubMed] [Google Scholar]
- Morris JS, Smith KA, Cowen PJ, Friston KJ, Dolan RJ. Covariation of activity in habenula and dorsal raphe nuclei following tryptophan depletion. NeuroImage. 1999;10:163–172. doi: 10.1006/nimg.1999.0455. [DOI] [PubMed] [Google Scholar]
- Nelson EJ, Hellevuo K, Yoshimura M, Tabakoff B. Ethanol-induced phosphorylation and potentiation of the activity of type 7 adenylyl cyclase. involvement of protein kinase C delta. J Biol Chem. 2003;278:4552–4560. doi: 10.1074/jbc.M210386200. [DOI] [PubMed] [Google Scholar]
- Nemeroff CB, Vale WW. The neurobiology of depression: inroads to treatment and new drug discovery. J Clin Psychiatry. 2005;66([Suppl 7]):5–13. [PubMed] [Google Scholar]
- Nestler EJ, Barrot M, DiLeone RJ, Eisch AJ, Gold SJ, Monteggia LM. Neurobiology of depression. Neuron. 2002a;34:13–25. doi: 10.1016/s0896-6273(02)00653-0. [DOI] [PubMed] [Google Scholar]
- Nestler EJ, Gould E, Manji H, Buncan M, Duman RS, Greshenfeld HK, Hen R, Koester S, Lederhendler I, Meaney M, Robbins T, Winsky L, Zalcman S. Preclinical models: status of basic research in depression. Biol Psychiatry. 2002b;52:503–528. doi: 10.1016/s0006-3223(02)01405-1. [DOI] [PubMed] [Google Scholar]
- Nibuya M, Nestler EJ, Duman RS. Chronic antidepressant administration increases the expression of cAMP response element binding protein (CREB) in rat hippocampus. J Neurosci. 1996;16:2365–2372. doi: 10.1523/JNEUROSCI.16-07-02365.1996. [DOI] [PMC free article] [PubMed] [Google Scholar]
- Palanza P. Animal models of anxiety and depression: how are females different? Neurosci Biobehav Rev. 2001;25:219–233. doi: 10.1016/s0149-7634(01)00010-0. [DOI] [PubMed] [Google Scholar]
- Pliakas AM, Carlson RR, Neve RL, Konradi C, Nestler EJ, Carlezon WA., Jr Altered responsiveness to cocaine and increased immobility in the forced swim test associated with elevated cAMP response element-binding protein expression in nucleus accumbens. J Neurosci. 2001;21:7397–7403. doi: 10.1523/JNEUROSCI.21-18-07397.2001. [DOI] [PMC free article] [PubMed] [Google Scholar]
- Porsolt RD. Animal models of depression: utility for transgenic research. Rev Neurosci. 2000;11:535–538. doi: 10.1515/revneuro.2000.11.1.53. [DOI] [PubMed] [Google Scholar]
- Pronko S, Yoshimura M, Kaiser A, Tabakoff B. Role of the tetranucleotide repeat [AACA]n of 3′ noncoding region in AC7 on gene expression. Alcohol Clin Exp Res. 2005;40([Suppl 1]):i43–i44. [Google Scholar]
- Ptok U, Seeher C, Jessen F, Papassotiropoulos A, Heun R. Inter-rater reliability of family history information on psychiatric disorders in relatives. Eur Arch Psychiatry Clin Neurosci. 2001;251:279–283. doi: 10.1007/pl00007546. [DOI] [PubMed] [Google Scholar]
- Ramirez-Solis R, Davis AC, Bradley A. Gene targeting in embryonic stem cells. Methods Enzymol. 1993;225:855–878. doi: 10.1016/0076-6879(93)25054-6. [DOI] [PubMed] [Google Scholar]
- Saba L, Bhave SV, Grahame N, Bice P, Lapadat R, Belknap J, Hoffman PL, Tabakoff B. Candidate genes and their regulatory elements: alcohol preference and tolerance. Mamm Genome. 2006;17:669–688. doi: 10.1007/s00335-005-0190-0. [DOI] [PubMed] [Google Scholar]
- Sambrook PN, Cohen ML, Eisman JA, Pocock NA, Champion GD, Yeates MG. Effects of low dose corticosteroids on bone mass in rheumatoid arthritis: a longitudinal study. Ann Rheum Dis. 1989;48:535–538. doi: 10.1136/ard.48.7.535. [DOI] [PMC free article] [PubMed] [Google Scholar]
- Shumake J, Edwards E, Gonzalez-Lima F. Opposite metabolic changes in the habenula and ventral tegmental area of a genetic model of helpless behavior. Brain Res. 2003;963:274–281. doi: 10.1016/s0006-8993(02)04048-9. [DOI] [PubMed] [Google Scholar]
- Stephens M, Donnelly P. A comparison of bayesian methods for haplotype reconstruction from population genotype data. Am J Hum Genet. 2003;73:1162–1169. doi: 10.1086/379378. [DOI] [PMC free article] [PubMed] [Google Scholar]
- Stephens M, Smith NJ, Donnelly P. A new statistical method for haplotype reconstruction from population data. Am J Hum Genet. 2001;68:978–989. doi: 10.1086/319501. [DOI] [PMC free article] [PubMed] [Google Scholar]
- Steru L, Chermat R, Thierry B, Simon P. The tail suspension test: a new method for screening antidepressants in mice. Psychopharmacology (Berl) 1985;85:367–370. doi: 10.1007/BF00428203. [DOI] [PubMed] [Google Scholar]
- Stewart CL. Production of chimeras between embryonic stem cells and embryos. Methods Enzymol. 1993;225:823–855. doi: 10.1016/0076-6879(93)25053-5. [DOI] [PubMed] [Google Scholar]
- Sunahara RK, Taussig R. Isoforms of mammalian adenylyl cyclase: multiplicities of signaling. Mol Interv. 2002;2:168–184. doi: 10.1124/mi.2.3.168. [DOI] [PubMed] [Google Scholar]
- Sunal R, Gumusel B, Kayaalp SO. Effect of changes in swimming area on results of “behavioral despair test.”. Pharmacol Biochem Behav. 1994;49:891–896. doi: 10.1016/0091-3057(94)90239-9. [DOI] [PubMed] [Google Scholar]
- Tabakoff B, Bhave SV, Hoffman PL. Selective breeding, quantitative trait locus analysis, and gene arrays identify candidate genes for complex drug-related behaviors. J Neurosci. 2003;23:4491–4498. doi: 10.1523/JNEUROSCI.23-11-04491.2003. [DOI] [PMC free article] [PubMed] [Google Scholar]
- Thome J, Sakai N, Shin K, Steffen C, Zhang YJ, Impey S, Storm D, Duman RS. cAMP response element-mediated gene transcription is upregulated by chronic antidepressant treatment. J Neurosci. 2000;20:4030–4036. doi: 10.1523/JNEUROSCI.20-11-04030.2000. [DOI] [PMC free article] [PubMed] [Google Scholar]
- Tsai MJ, O'Malley BW. Molecular mechanisms of action of steroid/thyroid receptor superfamily members. Annu Rev Biochem. 1994;63:451–486. doi: 10.1146/annurev.bi.63.070194.002315. [DOI] [PubMed] [Google Scholar]
- Watson PA, Krupinski J, Kempinski AM, Frankenfield CD. Molecular cloning and characterization of the type VII isoform of mammalian adenylyl cyclase expressed widely in mouse tissues and in S49 mouse lymphoma cells. J Biol Chem. 1994;269:28893–28898. [PubMed] [Google Scholar]
- Xie X, Lu J, Kulbokas EJ, Golub TR, Mootha V, Lindblad-Toh K, Lander ES, Kellis M. Systematic discovery of regulatory motifs in human promoters and 3′ UTRs by comparison of several mammals. Nature. 2005;434:338–345. doi: 10.1038/nature03441. [DOI] [PMC free article] [PubMed] [Google Scholar]
- Yoshikawa T, Watanabe A, Ishitsuka Y, Nakaya A, Nakatani N. Identification of multiple genetic loci linked to the propensity for “behavioral despair” in mice. Genome Res. 2002;12:357–366. doi: 10.1101/gr.222602. [DOI] [PubMed] [Google Scholar]
- Yoshimura M, Cooper DM. Type-specific stimulation of adenylyl cyclase by protein kinase C. J Biol Chem. 1993;268:4604–4607. [PubMed] [Google Scholar]
- Yoshimura M, Wu PH, Hoffman PL, Tabakoff B. Overexpression of type 7 adenylyl cyclase in the mouse brain enhances acute and chronic actions of morphine. Mol Pharmacol. 2000;58:1011–1016. doi: 10.1124/mol.58.5.1011. [DOI] [PubMed] [Google Scholar]
- Zhou J, Ma J, Zhang BC, Li XL, Shen SR, Zhu SG, Xiong W, Liu HY, Huang H, Zhou M, Li GY. BRD7, a novel bromodomain gene, inhibits G1-S progression by transcriptionally regulating some important molecules involved in ras/MEK/ERK and Rb/E2F pathways. J Cell Physiol. 2004;200:89–98. doi: 10.1002/jcp.20013. [DOI] [PubMed] [Google Scholar]