

Abstract
Visual object recognition relies critically on learning. However, little is known about the effect of object learning in human visual cortex, and in particular how the spatial distribution of training effects relates to the distribution of object and face selectivity across the cortex before training. We scanned human subjects with high-resolution functional magnetic resonance imaging (fMRI) while they viewed novel object classes, both before and after extensive training to discriminate between exemplars within one of these object classes. Training increased the strength of the response in visual cortex to trained objects compared with untrained objects. However, training did not simply induce a uniform increase in the response to trained objects: the magnitude of this training effect varied substantially across subregions of extrastriate cortex, with some showing a twofold increase in response to trained objects and others (including the right fusiform face area) showing no significant effect of training. Furthermore, the spatial distribution of training effects could not be predicted from the spatial distribution of either pretrained responses or face selectivity. Instead, training changed the spatial distribution of activity across the cortex. These findings support a dynamic view of the ventral visual pathway in which the cortical representation of an object category is continuously modulated by experience.
Keywords: recognition, perception, visual, fMRI, occipital, fusiform
Introduction
Object recognition and discrimination rely critically on learning (Goldstone, 1998; Schyns et al., 1998; Tanaka, 2001; Sheinberg and Logothetis, 2002; Op de Beeck et al., 2003; Palmeri et al., 2004), yet little is known about how learning affects object representations in the brain. Here, we conduct a broad exploration of the nature and spatial distribution of the effects of object discrimination training in the human ventral visual pathway.
The brain regions most critical for object recognition are found in the ventral pathway of the primate visual system (Logothetis and Sheinberg, 1996; Grill-Spector, 2003; Tanaka, 2003). However, little is known about the effect of object learning in human visual cortex and in particular how the spatial distribution of training effects relates to the distribution of object and face selectivity across the cortex. Neurophysiological recordings in monkeys have shown that training on discrimination and recognition of objects is associated with changes in the strength and object selectivity of neural responses (Miyashita et al., 1993; Ringo, 1996; Booth and Rolls, 1998; Kobatake et al., 1998; Baker et al., 2002; Sigala and Logothetis, 2002; Rainer et al., 2004; Freedman et al., 2006). However, because neurophysiological studies cannot easily sample a wide area of cortex, these investigations have not determined whether the changes in neural responses with training are widespread across the ventral visual pathway, or whether they are restricted to specific regions within this pathway. The few functional magnetic resonance imaging (fMRI) studies that have investigated neural effects of object training in humans (Gauthier et al., 1999; Grill-Spector et al., 2000; Gauthier and Tarr, 2002; Kourtzi et al., 2005; Sigman et al., 2005) have focused on regions of interest (ROI) analyses, and they did not addressed the distribution of training effects across the extrastriate cortex, in particular how training effects relate to the spatial distribution of pretrained object selectivity and face selectivity. Thus, although it has been suggested that changes in object representations caused by training might be restricted to small subregions of the ventral visual pathway (Logothetis et al., 1995; Gauthier et al., 1999; Henson et al., 2000), little is known about the magnitude, sign, and spatial distribution of training effects across visual cortex.
We scanned subjects before and after object discrimination training to ask whether and how training changes the spatial distribution of activation across the cortex. Our results indicate that training produces an overall increase in the response to trained objects, but the spatial distribution of this training effect is not homogeneous. Training increases the response much more in some regions in the visual cortex (e.g., right lateral occipital gyrus) than in other regions. Furthermore, the strength of the training effect in a subregion of cortex cannot be predicted simply from the response of that subregion before training. Finally, no significant training effect was found in the fusiform face area. Thus, training appears to change the spatial distribution of activity to trained objects in a way that cannot be predicted either from the spatial distribution of pretrained responses or from face selectivity.
Materials and Methods
Subjects
Nine right-handed participants (three males) participated in this experiment. All were college or graduate students in the Boston area. Informed consent was obtained and all procedures were approved by the Institutional Review Boards of Massachusetts Institute of Technology and Massachusetts General Hospital.
Stimuli
We used custom algorithms written in Matlab to create three new classes of objects: smoothies, spikies, and cubies (Fig. 1). These classes were designed to have different shape properties and to seem novel (i.e., they did not immediately suggest associations with everyday object categories).
Figure 1.

Stimuli (Stim) and tasks used in the training experiment. For each of the three classes (smoothies, spikies, and cubies), exemplars were constructed from a four-dimensional object space. Each exemplar had a value from 0 to 5 on each of four shape dimensions. The top three rows show exemplars from each class: value 0 on each dimension (far left), value 5 on one dimension and value 0 on the other dimensions (middle four exemplars), and value 5 on each dimension (far right). The bottom half of the figure shows the task used to train subjects in shape discrimination.
Within each object class, we manipulated four shape dimensions (Fig. 1). Most dimensions were a composite of several simple shape parameters (e.g., size/thickness of several shape protrusions), and different dimensions changed aspects in different locations on the stimuli. Thus, objects could not be discriminated by looking at only a small part of each object, and more than one location of the object had to be taken into account to attain good discrimination performance.
Each dimension was manipulated in six steps (values 0–5). Each class contained 1296 (64) exemplars with an integer step on each dimension. From these objects, we chose 80 reference objects distributed across the four-dimensional object space in each class. For each of these objects, we created eight extra exemplars that differed from that reference object by half a step on only one dimension. The distance between objects in a class was expressed as the number of integer steps difference on each dimension, summed across dimensions, so the maximum distance was (6 − 1) × 4 = 20 (for objects with an extreme value on each dimension). The construction of the object space avoids recognition of individual exemplars given that each object class consisted of a high number of exemplars that covered the space with a density that was much higher than behavioral “just-noticeable differences” (even for trained subjects) (see Fig. 2).
Figure 2.

Sensitivity (d') in the shape discrimination task as a function of time (training session). Sensitivity is shown separately for small (0.5), intermediate (2 and 4), and large (8 and 12) distances in object space (see Materials and Methods for explanation of distance metric). Performance is shown for the first block of trials in each of the 10 training sessions and in the test session. For the test session at the end of the experiment, the data for the trained object class are shown with filled symbols and the data for the untrained classes with open symbols. Error bars show the SEM across subjects.
These object exemplars were shown at about the same size during training and scanning with a maximum size of 8 visual degrees. Stimulus presentation and response registration was controlled using PsychToolbox (Brainard, 1997; Pelli, 1997).
Shape discrimination training
Subjects were trained with one object class (counterbalanced across subjects, three subjects per class) during at least 10 training sessions, each lasting ∼1 h. The length of this training (in number of hours and number of training days) is longer than any of the previous fMRI studies with an object training procedure (Gauthier et al., 1999; Kourtzi et al., 2005; Sigman et al., 2005). The training task is illustrated in Figure 1. In each trial, five object images were shown one at a time (one reference and four test objects; stimulus duration 300 ms; interstimulus interval, 1000 ms), and subjects had to determine for each of the test objects whether it matched the reference object (left key press) or not (right key press). The reference object was one of the 80 reference objects of a class; the test objects could be any object from the same class. The percentage of match stimuli was 50%. Subjects were told that they could use any stimulus feature for the discrimination, except object position (which was randomized for each individual stimulus with 3.5 visual degrees as the maximum position offset from the fixation point). The first training session started with task instructions, followed by at least 10 practice trials (40 responses) with everyday objects to assess proper understanding of the instructions and to acquaint subjects to the speed of object presentation and responses.
Each training session consisted of three blocks of 80 trials (with five stimuli per trial; this amounts to a total of 1200 stimulus presentations per training session). The first block of trials was used to compare performance across sessions (see Fig. 2). This block had the same uniform distribution of “nonmatch” images from five distance conditions (0.5, 2, 4, 8, and 12) throughout the whole experiment (“method of constant stimuli”), and no feedback was given to signal the correctness of responses. In the two other blocks, difficulty was adapted to each subject's performance aiming for between 70 and 75% correct, and color feedback was provided after each response. In these blocks, visual feedback was given at the end of the interstimulus interval by means of a foveal colored square (1.5 × 1.5°) indicating the response was correct (green), incorrect (red), or that no valid response was registered (white).
Most subjects seemed to reach a steady performance level before or around the fifth training session. Furthermore, their verbal reports indicated that they were consciously using most but not all four shape dimensions. To make them aware of all dimensions, we started the later training sessions of all subjects with a short rapid stimulus presentation with object exemplars presented at a rate of three per second, without an interstimulus interval or a position offset, and with successive objects changing on only one dimension. With this presentation, even very small object changes are obvious. The further protocol and stimuli of each training session (with three blocks of 80 trials) was not changed.
After all training sessions and the second scan session, we tested performance for all three object classes in an extra test session at distances 0.5, 2, 4, 8, and 12, and without color feedback. After this session, we asked subjects whether some of the object classes resembled “real-life objects” and, if so, which objects.
Behavioral performance as shown in Figure 2 is computed from the first block of trials in each session (the block that contained trials with the same stimulus distance across all sessions). Performance is expressed in units of sensitivity (d'), which reflects the difference between standardized hit rate (hits are the correct responses for stimuli that did not match the reference stimulus of that trial) and standardized false alarm rate (false alarms are the incorrect responses for stimuli that matched the reference stimulus of that trial).
Significant sensitivity for individual shape dimensions was assessed in the last three training sessions by calculating the 95%-confidence intervals of the difference in performance between two sets of trials for each dimension: trials with stimuli with a large distance on that dimension and trials with stimuli with a small or zero distance on that dimension but with the same overall distance on other dimensions as the first set of trials.
Scanning
Subjects were scanned two times, once before and once after the shape discrimination training. Scanning was performed at the Martinos Center for Biomedical Imaging at Massachusetts General Hospital (Charlestown, MA) in a 3T Siemens (Erlangen, Germany) Trio magnet with an eight-channel phased-array head coil. Functional images were acquired with an echo-planar imaging sequence including an integrated parallel acquisition technique (105 time points per time series; repetition time, 3 s; echo time, 37 ms; 128 × 128 matrix; 1.4 × 1.4 mm in-plane voxel size; 20 slices approximately perpendicular to the calcarine sulcus covering the entire occipital and occipitotemporal cortex with slice a thickness of 2 mm and interslice gap of 0.4 mm). Note that dorsal and anterior parts of the cortex (e.g., parietal and frontal areas) were not covered by our slices. In each session, we also acquired a T1-weighted anatomical image. We made sure that head position in the post-training session was very similar to the position in the pretraining session. Furthermore, post-training slices were positioned manually to be as close as possible to the slices in the first session by visual comparison of pretraining and post-training overlays of the slice outlines on the anatomy.
Functional runs consisted of object runs (with presentation of smoothies, spikies, and cubies) and localizer runs (used to identify ROI) acquired in an interleaved manner in pairs (object 1, object 2, localizer 1, localizer 2, object 3, object 4, localizer 3, localizer 4, object 5, object 6).
Object runs.
Object runs consisted of 15 s blocks of fixation spot, smoothies, spikies, cubies, and Fourier-scrambled images. Stimuli were presented around the foveal position (maximum position offset from fixation point was 3.5 visual degrees) for 300 ms with a 450 ms interstimulus interval (20 stimuli per 15 s block). There were four 15 s blocks for each condition in each run and 80 different stimuli (the reference objects from the training task) per condition. We acquired four to six object runs in each session for each subject (at least 320 stimulus presentations per object class per scan session).
Localizer runs.
Localizer runs consisted of 15 s blocks of fixation spot, human faces, objects, outdoor scenes, and Fourier-scrambled images. In each block, stimulus position was either in the left visual field or the right visual field (border of the stimulus 1.3 visual degrees from the foveal position), with a jitter in the vertical stimulus position of maximum 2° from the horizontal midline. This lateralized stimulus position provided us with a crude localizer of parafoveal retinotopic cortex. The contrast of [contralateral > ipsilateral] reveals a continuous activation from the calcarine sulcus up to the border between retinotopic and object-selective cortex (Grill-Spector, 2003). We acquired four localizer runs in each session for each subject.
FMRI task.
Subjects performed a demanding color-change detection task during all runs. This task required subjects to press a key each time an object had a different color than the previous object (three changes in each block of 20 stimuli). Low-saturated color was added to the gray-scale images by increasing the value of one color channel and decreasing the value of the other channels by a factor c. This parameter was the same for all conditions in a run, but it was adapted between runs to keep the task demanding for the subjects.
The trained shape differences were irrelevant for the color task, and this had several advantages. First, subjects received no training in shape discrimination for the two untrained object classes. If subjects had performed the training task in the scanner, then the pretraining scan session would have provided subjects with training in all object classes, not only the to-be-trained object class. Second, the training caused superior performance on the trained objects in the training task, and this performance difference in the second scan session (and related attention or difficulty confounds) would have made the interpretation of the data difficult. Using the color task instead, there was no difference in performance between trained and untrained objects during the post-training scans, either in the percentage of detected color changes (87 and 88%, respectively; t(8) = 1.28; p > 0.20) or reaction time (458 ms and 463 ms, respectively; t(8) = 0.71; p > 0.40). Thus, differences in color task performance cannot explain differences between trained and untrained object classes in blood oxygen level-dependent (BOLD) response. Finally, Gauthier et al. (2000) showed that effects of expertise in face-selective cortex are correlated with behavioral measures of expertise in an orthogonal task but not in an object discrimination task, which is an additional argument to use an orthogonal task.
Analysis of imaging data
Data were analyzed with the Freesurfer functional analysis stream (surfer.nmr.mgh.harvard.edu/) (Dale et al., 1999; Fischl et al., 1999), and froi (froi.sourceforge.net), as well as custom Matlab code. Preprocessing involved motion correction, smoothing with a Gaussian kernel of 3 mm full width at half maximum, and normalization of the mean signal amplitude in each functional run. The predictor for each stimulus condition (0 or 1 at each time point) was convolved with a gamma function, and the general linear model was used to compute the response of each voxel in each condition. The response for each condition in each voxel is expressed in units of percent signal change (PSC), which is the response in each condition minus the response in the fixation condition, normalized by the mean signal value at each voxel. Significance maps of the brain were computed by performing t tests for pair-wise comparisons of conditions, and thresholded at p = 0.0001 (uncorrected for multiple comparisons). We used this same statistical threshold throughout all analyses to define regions of interest. The average response across all voxels of an ROI was computed for each individual subject, and this response was combined across subjects by averaging.
The preprocessing did not involve any spatial normalization of subjects in a common reference space (e.g., Talairach transformations). Given the anatomical variability between subjects, such normalization would obscure finer spatial patterns in activations, certainly at the high resolution that we used. We performed a registration of the functional images of each subject in each session to that subject's anatomical image. We used the resulting transformation parameters only to map the anatomically defined V1/V2 ROI to the functional images, and for the illustration of activation loci shown in Figure 4 and supplemental Figure S2, available at www.jneurosci.org as supplemental material. All other results do not involve any registration to individual or group anatomies.
Figure 4.
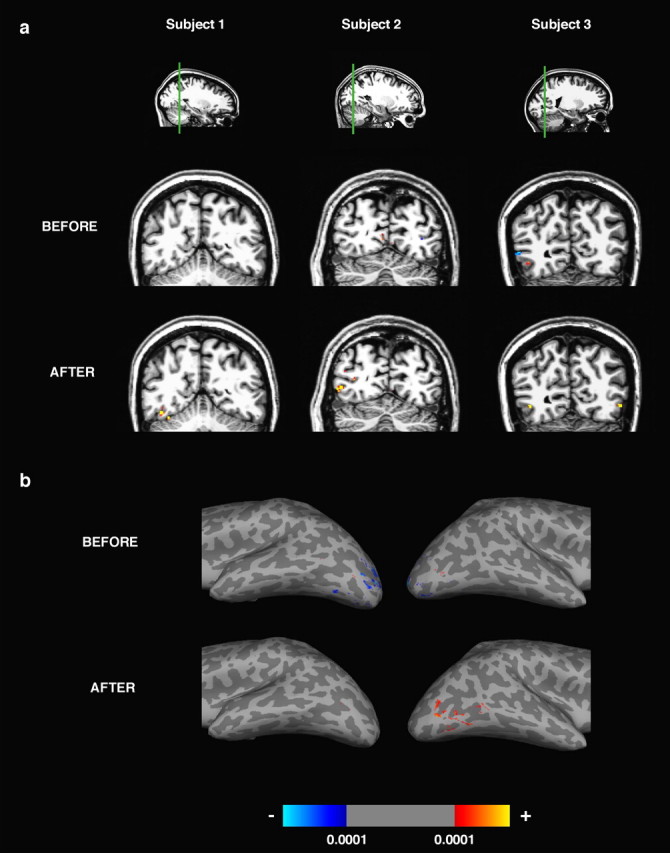
Functional activations for trained objects before and after training. Activations (significance maps thresholded at p < 0.0001, uncorrected) are shown for the contrast [trained > untrained], with red/yellow indicating positive contrast and blue indicating negative contrast. a, Functional activation overlaid on a coronal anatomical slice for three subjects. The left, middle, and right subjects were trained with the smoothies, spikies, and cubies, respectively. These subjects were representative in the size of training effects seen across the population. Slices are shown with right hemisphere at the left. b, Functional activation overlaid on a ventrolateral view of the inflated brain of a fourth subject (trained with the smoothies).
Before statistical analyses, data were preprocessed in two ways that differed in the reference image used to align all functional volumes (Cox, 1996). In the first preprocessing stream, data from the two sessions were processed independently and aligned to the first image in the first functional time series of each session. This independent preprocessing of the two sessions was used for all analyses that did not require single-voxel alignment (whole-volume analysis and ROI analysis). In the second preprocessing stream, the functional data of the two sessions of each subject were coaligned directly (without an intermediate step through anatomical data) by aligning all data to the first image of the pretrained session. These coaligned data were used in two analyses: comparing pretrained and post-trained spatial distribution of activity across all visually active voxels, and investigating the pretraining response of voxels with a significant post-trained preference for trained objects (trained voxels).
Comparison of pretrained and post-trained distribution of activity.
We investigated the relation between pretrained and post-trained responses across all visually active voxels (see Fig. 6, scatter plots). Visually active voxels were defined as all voxels that responded significantly stronger than fixation (p < 0.0001, uncorrected) to at least one of the three object classes in at least one of the two sessions. We followed the standard from previous studies of distributed response patterns where the response of each voxel in each session is normalized to a mean of zero by subtracting the mean response across all object classes (Haxby et al., 2001). The relation between pretrained and post-trained responses was investigated with Pearson product moment correlations and orthogonal regression. Orthogonal regression (Van Huffel and Vandewalle, 1991) minimizes the perpendicular distances from the data points to the regression line, and is preferable over standard linear regression in cases where both variables are (noisy) measurements. With orthogonal regression, the slope of the fitted line does not equal Pearson's correlation. For example, in the schematic scatter plot of Figure 3a, the slope of the line fitted with orthogonal regression reflects the global orientation in the cloud of points (slope of 1), even though the correlation between the two coordinates is smaller than 1.
Figure 6.

Effect of training on the spatial distribution of responses across cortex. a–c, Scatter plots of the normalized response in individual voxels before training versus after training for the trained object class (a) and for the two untrained object classes (b, c). All visually active voxels of all subjects are visualized together (analyses are done per subject). Each crosshair in the scatter plots represents the data from one voxel. The response of each voxel in each session was normalized to a mean of zero by subtracting the mean response across all object classes (Haxby et al., 2001). As described in the text, the data of trained and untrained classes show two differences that are significant across subjects: the trained object class is associated with higher post-trained responses than the untrained object classes, and the correlation between pretrained and post-trained responses is lower for the trained class than for the untrained classes. d, Effect of training on the percentage of correct discrimination when the pretrained distribution of responses is used to categorize the post-trained activation maps. Discrimination is shown separately for pair-wise comparisons that involve the trained object class and for other pair-wise comparisons, and as a function of cortical region. Cortical regions are retinotopic cortex and three subdivisions of object-selective cortex that are labeled according to their preferred object class: voxels with a significant preference for the trained objects before and/or after training (Trained), voxels with a significant preference for one untrained object class above another untrained object class before and/or after training (Untrained), and voxels with a significant selectivity for objects over scrambled images before and/or after training but without any specific selectivity for one object class above another (No preference). The error bars show the SEM across subjects.
Figure 3.

Different ways in which training could change the strength and spatial distribution of activity across cortex. The blue crosshairs in these panels represent for four hypothetical subregions the response before and after training for an object class that was not trained during the training phase, and the schematic blue line represents the corresponding regression line. The red arrows and corresponding regression line illustrate three ways in which training could change these responses if this object class would be trained during training. a, Additive offset; training could increase or decrease activity with a constant that is the same in each subregion (all red arrows are identical). b, Multiplicative gain; the increase or decrease in activity could depend on the pretrained response in each subregion, with for example the strongest increase in activity in subregions with the strongest pretrained activity (red arrows largest on the right). This will change the slope of the regression line. c, Change in spatial distribution of activity; the effect of training could vary between voxels in a way that is not related to pretrained response (red arrows of variable length). This will change the correlation between pretraining and post-training responses across voxels (represented by the aspect ratio of the blue and red ellipse for untrained and trained objects, respectively).
Discrimination index using pretrained and post-trained distribution of activity.
he percent correct discrimination was calculated from pair-wise comparisons of correlation coefficients, following previously described methods (Haxby et al., 2001; Spiridon and Kanwisher, 2002). A given pair-wise comparison between object classes A and B was deemed a correct identification of class A if the correlation coefficient between the pretrained and post-trained maps of class A was higher than that between the pretrained map of A and the post-trained map of B. For each subject, we calculated a separate index for the two pair-wise comparisons that involve the trained object class as one of the two object classes, and for the pair-wise comparison between the two untrained object classes. These two indices are shown for different cortical regions in Figure 6d. As discussed by Spiridon and Kanwisher (2002), the percent correct discrimination is influenced strongly by voxel set size (lower performance for smaller set sizes). To be able to compare the performance between regions with a different total size and between subjects, we selected as voxel set size the number of voxels in the smallest region found across regions and across subjects, N = 21. If a region in a subject was larger, then the correct discrimination for that region in that subject is based on the average performance over 100 different subsets of 21 randomly selected voxels.
Pretraining responses of trained voxels.
The second use of the between-session alignment is in the investigation of the pretraining responses of voxels with significant post-training selectivity for trained versus untrained objects (trained voxels). To select these voxels, we used runs 1, 2, 5, and 6 of the object runs of the post-training session as selection runs. Runs 3 and 4 were used as test runs to quantify training effects independently from the data used to select the voxels. Similar results were obtained with other divisions of the data in selection runs and test runs.
Validation of between-session alignment.
Control analyses showed that the between-session alignment worked well. Voxels with a post-training preference for stimulus conditions that were not expected to be changed by training (untrained stimuli) showed the same preference before training (see Results) (supplemental material SM4 and supplemental Figure S3c, available at www.jneurosci.org as supplemental material). Furthermore, we always compare results for the trained class with results for the untrained classes, and conclusions are based on a difference between trained and untrained classes. Given that blocks with trained and untrained classes were presented intermittently, any problem with coregistration would affect both conditions equally. Finally, we confirmed that the quality of the between-session alignment with this method is at least as good as with a method in which each functional session is coregistered with an anatomical reference image (see supplemental material SM1, available at www.jneurosci.org as supplemental material).
Magnitude of training effects.
The training index, shown for different ROIs in Figure 5, is computed as [PSC(trained objects post-training) − PSC(untrained objects post-training)] − [PSC(trained objects pretraining) − PSC(untrained objects pretraining)].
Figure 5.

Effect of training on responses (percentage signal change from fixation condition) in ROIs. a, PSC for trained and untrained object classes before and after training for three regions of interest: LOC, right FFA (rFFA), and foveal V1/V2. Error bars show the SEM across subjects of the difference in the response between trained and untrained objects. Asterisks indicate cases in which trained and untrained conditions were significantly different (*p < 0.05; **p < 0.001). b, The training index in each of these ROIs. The error bars show the SEM across subjects of the training index in each ROI. Asterisks indicate ROIs in which the training index was significantly different from zero (*p < 0.05; **p < 0.001). c, PSC for trained and untrained object classes before and after training for four subregions of LOC: right LO (RLO), left LO (LLO), right pFs (RpFs), and left pFs (LpFs). Conventions are as in a. d, The training index in each of the subregions of LOC. Conventions are as in b.
Whenever we compared trained versus untrained, this was a comparison of the data for the trained class with the data of the two untrained classes. Strictly speaking, the label “trained” is not meaningful before training (when all classes are still untrained). We use the label “trained before training” to refer to the object class that is trained during the training sessions, and “untrained before training” refers to the two object classes not shown during training.
Results
Effect of training on behavioral performance
As shown in Figure 2, discrimination training markedly improved discrimination performance (d') from the first to the last training session (t(8) = 4.84; p < 0.001, paired t test). Exemplars within each object class could be different along up to four shape dimensions and in the last three sessions, individual subjects showed a significant sensitivity (p < 0.05) for a median of three of these four shape dimensions (see Materials and Methods). Although subjects showed an overall improvement even for untrained objects, much of the training effect was specific to the trained class: discrimination performance after training was significantly higher for trained compared with untrained classes (t(8) = 4.07; p < 0.005, paired t test).
Effect of training on class-specific activations in visual cortex
As mentioned in the Introduction, it is not clear how training effects are distributed across visual cortex. Several distinct possibilities can be distinguished. The simplest possibility is that training produces an overall change or additive offset in the magnitude of the BOLD response that is constant across visual cortex. Importantly, this change could either be an overall increase in the response after training, or an overall decrease. In its strongest version, an additive offset would result in the same training effect in each visually responsive subregion, such that the spatial distribution of activity across cortex will not change. This is illustrated in Figure 3a. In this figure, the blue crosshairs refer to the combination of hypothetical pretraining and post-training responses expected for objects that are not trained during the training phase. The red arrows refer to the hypothetical additive offset caused by training expected for objects that are trained during the training phase.
In contrast, the size of the training effect in each subregion might be proportional to the response in that subregion to the to-be-trained objects before training, a pattern we will refer to here as a multiplicative gain (Fig. 3b). For example, if training increases the response in visual cortex, then a multiplicative gain would give the largest increase in subregions with the largest pretrained response. This kind of training effect would amount to a strengthening of the already existing spatial distribution of activity associated with an object class, akin to the proposed effects of attention at the single-neuron level (McAdams and Maunsell, 1999). As illustrated by the blue and red line in Figure 3b, a multiplicative gain would increase the slope obtained by orthogonal regression of the post-trained responses to the pretrained responses (see Materials and Methods).
A rejection of each of these predictions would mean that training changes the spatial distribution of activity across cortex in a way that is not determined by the pretrained responsiveness to the trained stimulus. As illustrated in Figure 3c, positive evidence for such a change in the spatial distribution of activity would be a lower correlation between pretrained and post-trained responses for trained objects compared with the correlation for untrained objects. These possibilities are not mutually exclusive, and hybrids are possible. The test of the specific predictions of these few hypotheses will inform us about which combination provides the best account of the effect of training.
One specific proposal of how training might change the spatial distribution of activity, is that training will increase the response in face-selective regions, especially the right fusiform face area (rFFA), even for objects that did not activate this area strongly before training (Diamond and Carey, 1986; Gauthier et al., 1999). Although previous studies have argued in favor of this “expertise hypothesis” (Gauthier et al., 1999, 2000; Xu, 2005), the design and analyses in these studies were not suited to differentiate the expertise hypothesis from other effects such as an additive offset or a multiplicative gain. We will investigate whether the predictions of this hypothesis hold when subjects are trained to discriminate objects.
To characterize the effect of training, the fMRI data were analyzed in four different ways, which we discuss in turn: (1) comparison of the number of voxels across visual cortex that prefer trained to untrained stimuli (or vice versa) after versus before training; (2) comparisons of the response to trained versus untrained stimuli before versus after training within functionally defined ROIs; (3) voxel-wise analyses of the effect of training on the distributed response pattern across visual cortex; and (4) comparison of the response to trained versus untrained stimuli before versus after training in voxels with maximal post-training preference for trained objects.
Does training produce increases or decreases in response?
We performed a whole-volume analysis of the data for each session independently (without between-session coregistration). For each subject, we selected all voxels that were significantly activated (p < 0.0001, uncorrected) in the contrast [trained vs untrained] (Fig. 4). Significantly more voxels preferred trained above untrained objects after training compared with before (mean number of voxels ± SE across subjects; 366 ± 124 after training vs 82 ± 31 before training; t(8) = 2.8; p < 0.02, paired t test); there was no significant difference in the number of voxels preferring untrained to trained objects after and before training (62 voxels after vs 167 voxels before training; t(8) = 1.7; p > 0.1). Figure 4 illustrates this difference between the two sessions in four subjects. Each of these subjects showed more voxels activated with the contrast [trained > untrained] after training than before training. These activated voxels were not all clustered together in a single contiguous region, but instead formed multiple small clusters (see How large are the largest training-related response increases). Many of these small subregions found with the contrast [trained > untrained] were intermingled or overlapping with more numerous and larger subregions significantly activated in the contrast [objects > scrambled], a contrast that is typically used to define object-selective cortical regions (supplemental Fig. S2, available at www.jneurosci.org as supplemental material). In summary, training was associated with an increased response in multiple subregions of extrastriate visual cortex.
How do training effects relate to pretrained responses and object and face selectivity?
The previous analysis indicates that training increased the response to trained compared with untrained objects in at least some subregions in and around object-selective cortex. This result does not show how widespread this effect is. All visual regions might show the same effect (additive offset), and we might have simply missed it in many regions because the effect is small and we use thresholded maps. In contrast, the location of the effects might be related to pretraining response strength (multiplicative gain), it might be centered around face-selective regions, or it might change the spatial distribution of activity across cortex in some other way. To test these hypotheses, we performed a ROI analysis in three ROIs: the lateral occipital complex (LOC; from the contrast [objects > phase-scrambled objects]), the rFFA (from the contrast [faces > objects]), and foveal V1/V2 (anatomically defined as the area around the posterior tip of the calcarine sulcus). These ROIs were defined separately within each scanning session (before and after training). Supplemental Figure S2 (available at www.jneurosci.org as supplemental material) illustrates the between-session replicability of the functional activations used to define the functional ROIs for the case of [objects > scrambled images]. When performed in isolation, ROI analyses can miss important information outside these ROIs (Friston et al., 2006; Saxe et al., 2006), but they provide critical information about the distribution of effects and their relationship to other functional criteria when used in combination with whole-volume analyses (see Results, Does training produce increases or decreases in response?) and distributed pattern analyses (see Results, What is the effect of training on the distributed response pattern across visual cortex?).
The average response in each of these ROIs before and after training is shown in Figure 5a. Training effects were revealed by a two-factor repeated-measures ANOVA that found a significant interaction between session (before vs after training) and stimulus condition (trained vs untrained) in LOC (F(1,8) = 50.09; p < 0.001), but not in rFFA (F(1,8) < 1) or foveal V1/V2 (F(1,8) = 3.73; p > 0.05). Furthermore, the difference between responses to trained and untrained stimuli in the post-training scan session was significant in LOC (t(8) = 5.77; p < 0.001, paired t test), but not in rFFA (t(8) < 1) or foveal V1/V2 (t(8) = 1.16; p > 0.25). In none of these areas did we find a significant (p < 0.05) main effect of session or training. The differences between areas in the interaction between session and stimulus condition were consistent across subjects, as indicated by a significant three-way interaction between area (LOC, rFFA, and V1/V2), session, and stimulus condition (F(2,7) = 13.80; p < 0.005).
These data are summarized with a training index that compares the activation difference between trained and untrained classes after training while subtracting out pretrained differences (see Materials and Methods). The higher this index, the more the BOLD response was increased for the trained object class relative to the untrained object classes. As shown in Figure 5b, the only region showing a significantly positive training index is LOC. Furthermore, a direct between-area comparison revealed that the training index was significantly stronger in LOC than in rFFA (t(8) = 2.5; p < 0.05) or foveal V1/V2 (t(8) = 4.86; p < 0.001, paired t test). Finally, LOC was the only region in which the training index was positively correlated across subjects with the behavioral improvement subjects showed during training (LOC, r = 0.65, p = 0.03; rFFA, r = 0.19, p > 0.20; foveal V1/V2, r = −0.29, p > 0.5). The correlation in LOC was significantly stronger than the correlation in V1/V2 (p < 0.05), but not significantly different from the correlation in rFFA (p = 0.16).
As discussed previously (Grill-Spector, 2003), the LOC is a large region of interest that extends from lateral occipital gyrus to the ventral surface of the brain (fusiform gyrus). In a more detailed analysis (Fig. 5c,d), we chose four smaller ROIs in the LOC: object-selective voxels in the right lateral occipital cortex (right LO), left LO, right ventral surface [commonly referred to as right posterior fusiform (right pFs)] and left ventral surface (left pFs). The training index was significantly different from zero in all these regions with the exception of left pFs (training index in left pFs, p = 0.051). The training index was significantly larger in the LO than in pFs (t(8) = 4.13; p < 0.005, paired t test). In addition, the training effect in the LO but not pFs was significantly correlated across subjects with the behavioral improvement subjects showed during training (LO, r = 0.83, p < 0.01; pFs, r = 0.32, p > 0.40) (supplemental Fig. S4, scatter plots of behavioral improvement and training index, available at www.jneurosci.org as supplemental material). The correlation in the LO was significantly stronger than the correlation in the FFA (p < 0.05) and in V1/V2 (p < 0.01). Furthermore, the training index was significantly larger in the two right ROIs than in the two left ROIs (t(8) = 2.38; p < 0.05, paired t test). Interestingly, there was also a large difference between the LO and pFs in their overall responsiveness before training (1.45 PSC and 0.81 PSC, respectively), whereas right and left ROIs responded similarly to the novel object classes before training (1.14 PSC and 1.13 PSC, respectively).
The differential training effects found in these ROIs (LOC, rFFA, foveal V1/V2, and the subdivisions of the LOC) falsify several of the hypotheses. The significant differences in training effects between the ROIs are not consistent with an additive offset. A multiplicative gain might explain some of the differences between regions. It is consistent with the strongest training effects in LOC (as we found) because this region responded more strongly to the to-be-trained objects before training than did rFFA or foveal V1/V2, and it is also consistent with the stronger training effects in the LO compared with pFs. If we describe the training effect by a divisive index (e.g., the post-trained response to trained objects divided by the post-trained response to untrained objects), then the LOC is still the only region with a significant training effect (LOC, t(8) = 6.56, p < 0.001; rFFA, t(8) = 0.06, p > 0.4; V1/V2, t(8) = 1.98, p > 0.05), but a direct between-area comparison revealed that the divisive training index was not significantly stronger in the LOC than in the other two areas (t test, p > 0.20). However, a multiplicative gain cannot account for the fact that right LOC showed training effects almost twice as large as left LOC (each responding similarly to the trained objects before training). This indicates that training changes the spatial distribution of activity across cortex, in this case between right and left hemisphere. Thus, the ROI results provide only partial support for the multiplicative gain hypothesis.
The lack of significant training effects in rFFA is inconsistent with the expertise hypothesis. We focused on the right FFA because that was the region and hemisphere claimed to show effects of training and experience (Gauthier et al., 1999), but the left FFA did not show a positive training index either (t(8) = 0.87; p > 0.4). The verbal reports of our subjects after the experiment provide a clue why some previous studies may have seen training effects in the rFFA. The subject with the highest rFFA training index in our study was the only subject that reported interpreting the training stimuli as being face-like (specifically, as “women wearing hats;” for this subject the training stimuli were smoothies). This one subject was an outlier in the size of the rFFA training index (0.38 PSC) compared with the rFFA training index in the other eight subjects (mean, −0.01 PSC, SD, 0.15). None of the other subjects reported interpreting the smoothies as face-like (although FFA responded more strongly to smoothies than spikies or cubies across all subjects) (supplementary material SM2, available at www.jneurosci.org as supplemental material). The other two subjects trained with smoothies did not show a large training index (−0.04 PSC and −0.03 PSC). Thus, the training index in rFFA varied substantially across subjects, and the subjective interpretation of the objects during training might be one of the factors underlying this variability.
In summary, training increased the response to trained relative to untrained objects in object-selective cortex, especially in the right lateral occipital gyrus. No significant effect of training was observed in primary visual cortex or face-selective cortex. This spatial distribution of training effects is not consistent with an additive offset and the expertise hypothesis.
What is the effect of training on the distributed response pattern across visual cortex (voxel-wise analyses)?
The ROI analyses suggested that a multiplicative gain might explain part of the results (only training effects in LOC, a region that had a large pretraining response), but that in addition training changed the spatial distribution of responses across cortex (e.g., the much larger training effect in the right than in left LOC, whereas pretraining responses were the same in the two hemispheres). We tested the spatial distribution of training effects in more detail. An important requirement for a detailed investigation of the relationship between pretrained and post-trained responses across voxels is the ability to compare the responses of individual voxels between the two sessions. In all previous analyses described here (and in all previous published training studies), the two sessions were processed independently and relatively large regions of interest were defined based on identical criteria in each session. In all of the following analyses, we analyzed the two sessions as one large session, registering all volumes of a subject to the same functional reference volume (see Materials and Methods). Although this registration across sessions cannot be perfect, extensive analyses indicate that it is good (see Results) (supplemental material SM1, available at www.jneurosci.org as supplemental material). Further, any registration errors would affect trained and untrained stimuli to the same extent and thus cannot bias our conclusions about training effects because these conclusions are based on comparisons between trained and untrained stimuli. This between-session alignment allowed us to investigate at a more detailed level how pretraining responses change after training. We investigated the effect of training on the distributed pattern of responses across all visually active voxels, an average of 12,122 voxels per subject (see Materials and Methods).
The variation of responses for each object class across voxels can be summarized for each subject as a scatter plot in which each data point represents a voxel with the pretrained response on the x-axis and the post-trained response on the y-axis, as shown schematically in Figure 3. The scatter plot pooled across all subjects is shown in Figure 6a–c. As in previous studies (Haxby et al., 2001; Spiridon and Kanwisher, 2002), we used the normalized response in each voxel for each object class in the two sessions, so that for each voxel the average response across the three object classes was zero in each session (see Materials and Methods).
The effect of training on overall responsiveness is captured for each subject by calculating the training index (see Materials and Methods) for this entire population of visually active voxels. Averaged across subjects, this training index was 0.13 PSC (SEM, 0.02), significantly different from zero (t(8) = 6.12; p < 0.001). This indicates that the response of a visually active voxel was on average 0.13 PSC higher for the trained object class than for the untrained object classes. Thus, in agreement with the conclusion from previous analyses, training is associated with an increase in the average response to the trained objects across visual cortex.
A multiplicative gain would induce a difference between the scatter plot for trained objects and the scatter plots for untrained objects: the strongest training-related response increase should be found in voxels with the strongest pretrained response. As shown in Figure 3b, this would result in an increased regression slope when post-trained responses are predicted from pretrained responses with orthogonal regression (see Materials and Methods). Without training effects, we expect a slope of 1 for all object classes, reflecting the fact that voxels with a difference in pretraining response of 1 PSC are expected to have an average difference in post-training response of 1 PSC. A multiplicative gain effect would increase the regression slope for the trained objects to a level significantly higher than 1. This prediction was not confirmed: although a trend was observed, there was no significant difference across subjects (t(8) = 0.97; p > 0.3, paired t test) in the regression coefficient for the trained object class (median, 1.17) compared with the coefficient for the untrained classes (median, 1.03).
Thus, these results do not support a multiplicative gain (because training effects in each voxel could not be predicted from pretrained responses in that voxel). Alternatively, training may change the spatial distribution of activity across the cortex: if training alters the spatial distribution of the responses to the trained objects, then training will reduce the correlation between pretraining and post-training responses for the trained objects compared with untrained objects. That is, some voxels with a low pretraining response might have a large training-related increase in response, whereas other voxels with a higher pretraining response might show less of an increase or even a reduction in response. This training-related between-session variability in responsiveness would not be as great for the untrained objects, and as a consequence a change in the spatial distribution of activity would be manifested by a lower correlation between the pretraining and post-training response distribution for the trained objects compared with the correlation found for untrained objects (Fig. 3c). Consistent with this prediction, we found that the correlation between pretrained and post-trained responses across voxels was significantly lower across subjects (t(8) = 2.41; p < 0.05, paired t test) for the trained object class (r = 0.26) than for the untrained object classes (r = 0.34). Nevertheless, this between-session correlation remained significant and positive even for the trained object class (t(8) = 4.98; p < 0.005), indicating that the change in distribution of activity resulting from training only partially altered the pretraining distribution of activity.
Additional analyses indicate that the two reported effects of training, increased responsiveness overall and a change in the distribution of activity, were not completely distributed across the visual cortex. As described in more detail in the supplementary material (SM3, available at www.jneurosci.org as supplemental material), we selected two large and mutually exclusive subpopulations from all visually active voxels: the retinotopic cortex and object-selective cortex. Training effects were much stronger in the object-selective cortex than in retinotopic cortex. The training index was larger in the object-selective cortex than in retinotopic cortex (t(8) = 3.26; p < 0.02, paired t test), and the change in distribution of activity (measured by the lower between-session correlation for trained compared with untrained objects) was more pronounced in the object-selective cortex than in retinotopic cortex (t(8) = 2.47; p < 0.05).
Within the object-selective cortex, the training-related change in distribution of activity spanned functionally distinct subregions. The lower between-session correlation for trained compared with untrained objects was present in several mutually exclusive subpopulations of object-selective voxels (supplemental material SM3, available at www.jneurosci.org as supplemental material): voxels with a significant preference for the trained objects before and/or after training (t(8) = 3.66; p < 0.01, paired t test), voxels with a significant preference for one untrained object class above another untrained object class before and/or after training (t(8) = 2.38; p < 0.05), and voxels with a significant preference for objects above scrambled images before and/or after training but without any specific selectivity for one object class above another (t(8) = 3.04; p < 0.02). Thus, changes in the distribution of activity do not only occur in subregions that show selectivity for the trained class (before or after training), but also occur in regions with a preference for an untrained class and in regions with an overall preference for objects over scrambled images (without a specific selectivity for smoothies, spikies, or cubies). These analyses indicate that the change in the spatial distribution of activity is distributed across several subregions in the object-selective cortex.
Thus, training changed the spatial distribution of activity across the object-selective visual cortex in a way that is not consistent with a multiplicative gain.
The correlations that we have calculated here have been used before to calculate a pair-wise discrimination index (Haxby et al., 2001; Spiridon and Kanwisher, 2002). This discrimination index captures how well object classes can be distinguished based on the spatial distribution of responses, and above-chance performance (> 50%) shows that activation maps in one subset of the data can be quite accurately categorized based on activation maps from another subset. In our study, the two subsets of data are the pretrained and the post-trained scan session. We expect above-chance performance in a discrimination between two untrained object classes. However, given that the spatial distribution of responses is changed because of training, we expect lower performance in a discrimination between the trained object class and an untrained class. Figure 6d shows the results for the same subregions that were described above. We found similar discrimination performance for trained and untrained objects in the retinotopic cortex (t(8) = 1.30; p = 0.23, paired t test). In contrast, lower discrimination performance for trained than for untrained objects was seen in voxels with a significant preference for the trained objects before and/or after training (t(8) = 3.55; p < 0.01) in voxels with a significant preference for one untrained object class above another untrained object class before and/or after training (t(8) = 2.28; p = 0.052), and in voxels with a significant preference for objects above scrambled images before and/or after training but without a preference for one object class above another (t(8) = 2.48; p < 0.05). These results using the discrimination index confirm the correlation analyses, showing that patterns of response for trained objects have changed more during the training interval than patterns of response for untrained objects.
How large are the largest training-related response increases?
The fact that training changed the spatial distribution of activity across the object-selective cortex means that the effect of training on responses in some voxels was different from the effect of training in other voxels. As a consequence, we would expect to find some focal subregions in which training effects are much larger than the average training-related response increase in the object-selective cortex. The obvious candidates for voxels with maximal training-induced selectivity are the aforementioned voxels with a post-training preference for trained compared with untrained object classes (illustrated in Fig. 3). To quantify the size of training effects in these voxels, we cannot use the same data as the data used for identifying the voxels. This would lead to an over-estimation of the size of training effects in these voxels in comparison to the effects computed in the previously mentioned and independently localized ROIs. To avoid this problem, we divided the post-training runs into “selection runs” and “test runs” (see Materials and Methods), and we used the selection runs to independently identify voxels activated significantly (p < 0.0001, uncorrected) in the contrast [trained > untrained] (here referred to as trained voxels), excluding from this set any voxels with a significant preference for contralateral stimuli. We then used the test runs to quantify the training effects in these trained voxels identified from the selection runs.
As shown in Figure 7, the preference for trained objects in these selected trained voxels (91 voxels on average per subject) was also found in the post-training test runs (t(8) = 7.81; p < 0.001, paired t test), indicating that it is a reliable preference. Strikingly, these voxels responded about twice as strongly to exemplars from the trained class (0.88 PSC) as to exemplars from the untrained class (0.44 PSC) after training. Importantly, no significant preference for the to-be-trained objects was found in these voxels before training (t(8) = 1.18; p > 0.2, paired t test). The training index in these voxels was 0.37 PSC (computed using only the test runs of the post-training session). A control analysis presented in supplementary material (SM4, supplemental Fig. S3c, available at www.jneurosci.org as supplemental material) shows that preferences for untrained object classes transfer across sessions, so this lack of transfer of preferences across sessions in trained voxels is caused by training and not problems with across-session coregistration.
Figure 7.

Percentage signal change for trained and untrained object classes in trained voxels. Trained voxels were selected based on a significant post-training preference for trained objects over untrained objects. Data are shown for different sets of runs: post-training selection runs (the post-training runs used to select the voxels), post-training test runs (the other runs in the post-training scan session), and pretraining runs (all runs in the first scan session). The error bars show the SEM across subjects of the difference in the response between trained and untrained objects.
Thus, these trained voxels show a strong training-related increase in responsiveness without a clear pretraining preference for the trained objects. In addition, as shown in supplemental material SM4 (available at www.jneurosci.org as supplemental material), the large training effect in these trained voxels is not caused by particularly strong object selectivity or face selectivity, nor is it caused by a strong pretraining response to trained objects. In sum, the results of the analyses of these trained voxels are not consistent with a multiplicative gain or the expertise hypothesis, and they strongly support the idea that training changes the spatial distribution of activity across cortex in a way that is not related to pretraining responses or face selectivity.
The focus in this section on the relatively small number of voxels with significant post-training selectivity might suggest that training effects are localized to one or a few small subregions around the object-selective cortex. However, this is not supported by our data. As shown in detail in supplemental material SM5 (available at www.jneurosci.org as supplemental material), the trained voxels consisted of a relatively high number of local clusters of voxels. This local clustering of object selectivity and preferences for trained objects is illustrated visually in Figure 8, where we use a multidimensional color scale to represent the selectivity of all visually responsive voxels in two subsets of post-training runs for three subjects. Some of the object selectivity was clearly replicable across these datasets, despite the relatively low number of runs (each of the nine subjects showed a positive correlation of selectivity across voxels between these two sets of runs, with an average correlation of 0.34; SEM = 0.04). In addition, the color maps show the overall effect that trained objects elicited stronger responses than untrained objects. Finally, these high-resolution selectivity maps clearly illustrate the existence of multiple subregions with a preference for trained above untrained objects.
Figure 8.
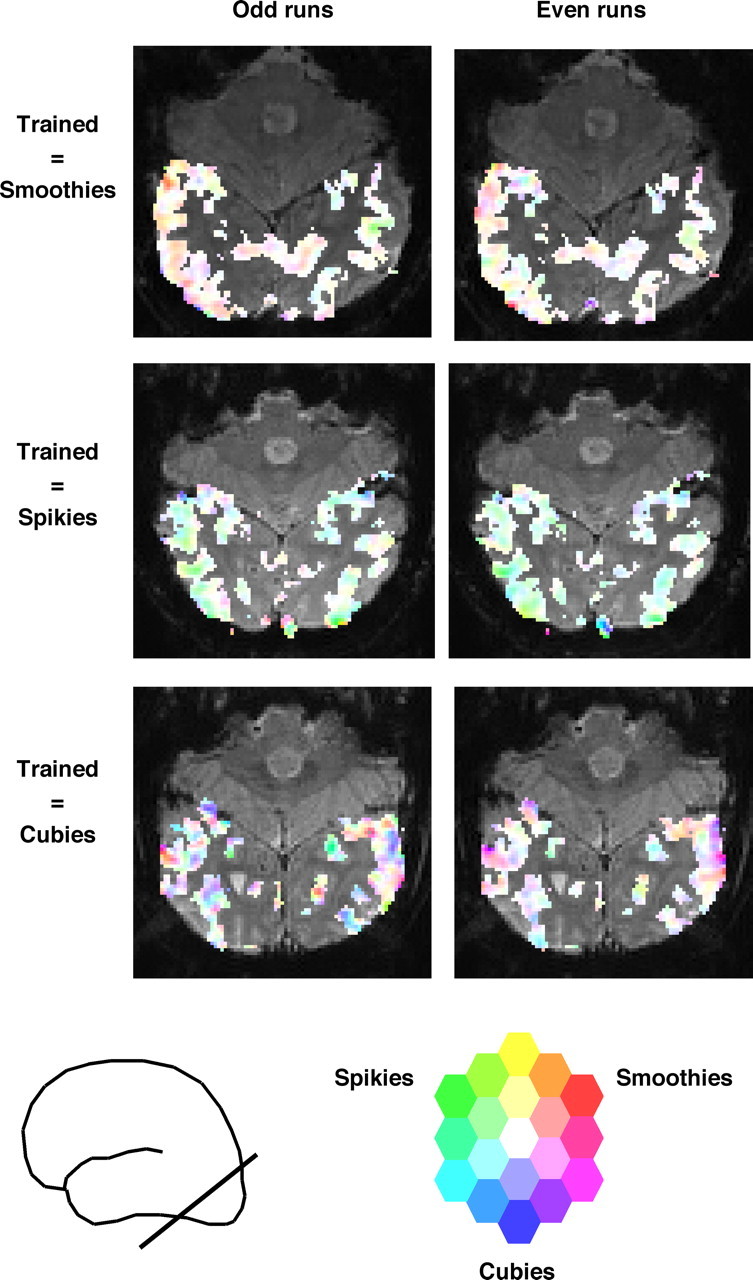
Stimulus preferences after training in odd and even runs. Stimulus preference is represented by a continuous color scale. Saturation represents the amount of selectivity (no saturation = white = same response to each object class), and hue represents which object class is preferred. This scale was applied to each voxel that was visually responsive. This color scale is overlaid on one unsmoothed functional slice in each of three subjects. The approximate position of the slices is represented by the line intersecting the brain pictogram.
To summarize, we analyzed several regions of interest, the distributed response pattern across all visually active voxels, and the voxels with the most significant post-training preference for trained objects. These analyses converge on the conclusion that training increases responsiveness to trained objects in visual cortex, and that it changes the spatial distribution of activity across the visual cortex in a way that is not consistent with a multiplicative gain or the expertise hypothesis. This training-related response increase and change in distribution of activity were relatively distributed across small subregions in and around the object-selective cortex.
Discussion
Our study provides a new characterization of the effect of object discrimination training across the ventral visual pathway. First, training produces increased responses to trained compared with untrained objects; training-related decreases in response were not found. Second, training effects are not uniformly distributed across the ventral visual pathway: whereas some subregions of the extrastriate cortex responded twice as strongly to trained compared with untrained objects after training (and not differently to these stimuli before training), other cortical regions (such as rFFA and foveal V1/V2) showed no significant effect of training. Third, the spatial distribution of training effects cannot be accounted for fully in terms of a change in the gain of the response to trained stimuli, nor is it related to face selectivity. In contrast, training changes the spatial distribution of activity across the visual cortex, and training effects were distributed across multiple subregions in high-level object-selective cortex.
Several novel aspects of our method were important for obtaining these results. First, our relatively high-resolution scanning (1.4 × 1.4 × 2 mm voxel size) involves considerably less averaging across distinct neural populations than occurs in the more standard resolutions used in human fMRI studies. This reduction in “partial voluming” in the present study is likely important to detect two-fold training effects distributed across small subregions. Individual-subject analyses are also important for avoiding the loss of resolution entailed in the necessarily imperfect registration across individual brains. Further, some of our analyses were based on a between-session alignment of the functional data for each subject, providing more detailed information about the spatial distribution of training effects compared with more traditional region-of-interest analyses. The combination of these methods enabled us to show large training effects in relatively small and discontiguous cortical regions.
Several aspects of the design of our study are important for understanding the scope of our conclusions. First, we studied the object-specific effects of training by using untrained objects as the baseline condition. Second, subjects performed a control task in the scanner for which the trained object differences were not relevant (see Materials and Methods). Thus, we studied effects of training that transfer across task conditions, and that are not confounded by changes in performance or task difficulty. Third, like all previous studies of complex object learning (Gauthier et al., 1999; Grill-Spector et al., 2000; Kourtzi et al., 2005), our study does not distinguish between effects of active training and effects of passive exposure. The strongest evidence that our fMRI training effects are relevant for task performance is our finding that the strength of training effects in the object-selective cortex is correlated with behavioral improvements. Fourth, no study has investigated long-term retention of the behavioral and neural effects of object learning, which is an important topic for future research. Finally, we measured changes in the response to whole object classes, rather than changes in the response to individual exemplars. With the resolution of fMRI it might be difficult to find differential responses to very similar exemplars of object classes (e.g., two different faces), but it will be important for future studies to test whether training may change the response to individual exemplars of the trained class.
Although our study is the first to investigate the effects of object discrimination training throughout the human visual cortex at this high resolution, several related studies have been reported previously. Our finding that training increases responses to trained objects in the extrastriate cortex is consistent with most previous human imaging and monkey physiology studies that used training procedures (Logothetis et al., 1995; Kobatake et al., 1998; Gauthier et al., 1999; Grill-Spector et al., 2000; Grill-Spector, 2003; Xu, 2005; Yue et al., 2006), although some studies have found decreased responses (Baker et al., 2002; Kourtzi et al., 2005). Effects in low-level visual cortex have been found after training on simpler stimuli (Schiltz et al., 1999; Schoups et al., 2001; Schwartz et al., 2002; Furmanski et al., 2004; Yang and Maunsell, 2004) or after training to segment relevant stimuli from a distractor background (Kourtzi et al., 2005; Sigman et al., 2005). Together, this pattern of results across studies suggests that the strongest effects of training occur at the cortical levels most critical for performance on the trained task.
Our study adds several critical findings to this literature. First, we formulated and tested several basic hypotheses about how training might change the spatial distribution of activity across the visual cortex. We found that training does not act simply as a gain mechanism, a finding that argues against the idea that training induces an overall increase in attention or arousal for trained compared with untrained objects (overall differences in attention are also inconsistent with the equal behavioral performance during scanning for trained vs untrained objects). Rather than changing the overall gain of visual responses, training changes the spatial distribution of activity across the visual cortex, most notably in high-level object-selective cortex.
Second, in contrast to a previous study claiming that effects of training with complex objects are primarily found in the rFFA (Gauthier et al., 1999), we found training effects in the object-selective cortex but not in the rFFA. The existence of training effects in non-face-selective cortex is not in contradiction with the previous work, because some of the data in that study suggested substantial training effects in the object-selective cortex (Gauthier et al., 1999; Yue et al., 2006). Thus, it is likely that the effects seen previously reflected a more general training-related increase in response that was not restricted to face-selective regions. Nevertheless, training effects in the rFFA were absent in our study whereas the previous work found significant effects. There were several differences between these studies that might explain this discrepancy. Previous studies have emphasized the importance of “configural processing” with very familiar objects in relation to activation in the FFA, but it is controversial whether any highly familiar nonface objects are processed “configurally” in the same way as faces (Gauthier and Bukach, 2006; McKone and Robbins, 2006). It remains a topic for further investigation whether the training effects observed here in extrastriate cortex reflect neural selectivity for the entire object shape, or for more local components or features of the trained objects.
One other important factor to explain differences between studies may be that the stimuli used previously by Gauthier et al. (1999) (“Greebles”) can be seen as human-like, an interpretation that was encouraged because subjects learned proper names for the Greebles, and were trained to recognize them at the “gender,” “family,” and “individual” level. Indeed, the one subject in our study who construed our stimuli as human-like (specifically, as “women wearing hats”) was also the only subject who showed training effects in the face-selective cortex. Thus, training effects in the rFFA may arise only when subjects construe the stimuli as face-like or human-like. Finally, although many studies have proposed that lab-training paradigms provide a valid way to test the relationship between expertise and face selectivity (Gauthier et al., 1999; Gauthier and Logothetis, 2000; Gauthier and Tarr, 2002; Palmeri and Gauthier, 2004), 10 h of lab training is a far cry from a lifetime of experience, and the present study does not address the effects of long-term expertise. Two previous studies have shown effects of real-world expertise in the face-selective cortex (Gauthier et al., 2000; Xu, 2005), but these studies did not investigate the response pattern beyond the face-selective cortex to exclude hypotheses such as an additive offset or a multiplicative gain.
Overall, our results are consistent with the proposal that training results in the creation of new object representations in high-level visual cortex (Henson et al., 2000), and that the largest effects of training occur in regions that already process stimulus properties that are relevant during training, even if stimuli were not initially processed that way. Thus, as we showed here that training on object discrimination leads to enhanced activity in and around the object-selective cortex, others have argued that training to categorize human-like forms increases the response to these stimuli in the rFFA (Gauthier et al., 1999), training subjects to use novel objects as navigational landmarks leads to enhanced responses in the parahippocampal place area (Janzen and van Turennout, 2004), and training subjects to use novel objects as tools leads to enhanced responses in regions that respond strongly to tools (Weisberg et al., 2006). However, our study also revealed differences in the size of training effects at a finer scale between subregions of the object-selective cortex. We were not able to explain this spatial distribution of training effects by the distribution of either face selectivity or pretraining response. It remains to be determined what other factor explains this spatial distribution.
In sum, we found that training increases responses and changes their distribution across the object-selective cortex. There was no simple relationship between the distribution of training effects and the distribution of face selectivity or pretrained responsiveness. Future investigations into the underlying neuronal mechanisms may make the most rapid progress by combining human and monkey fMRI studies, which enable sampling a broad region of cortex in a similar way in the two species, with higher resolution techniques such as single-unit recording (Tsao et al., 2006).
Footnotes
This work was supported by National Eye Institute Grants EY13455 and R21-NS0490SZ (N.G.K.), the McGovern Institute for Brain Research, the National Center for Research Resources (NCRR) (P41-RR14075, R01 RR16594-01A1, and the NCRR Biomedical Informatics Research Network Morphometric Project BIRN002), and the Mental Illness and Neuroscience Discovery Institute. H.P.O. was supported by the Human Frontiers Science Program and the Fund for Scientific Research, Flanders. We thank T. Benner, S. Dang, N. Knouf, K. Kwong, and L. Wald for technical support, S. Rindler and C. Hemond for help with the statistical analyses, and D. Cox, J. Haushofer, R. Schwarzlose, E. Vul, and G. Yovel for helpful comments on this manuscript.
References
- Baker et al., 2002.Baker CI, Behrmann M, Olson CR. Impact of learning on representation of parts and wholes in monkey inferotemporal cortex. Nat Neurosci. 2002;5:1210–1216. doi: 10.1038/nn960. [DOI] [PubMed] [Google Scholar]
- Booth and Rolls, 1998.Booth MC, Rolls ET. View-invariant representations of familiar objects by neurons in the inferior temporal visual cortex. Cereb Cortex. 1998;8:510–523. doi: 10.1093/cercor/8.6.510. [DOI] [PubMed] [Google Scholar]
- Brainard, 1997.Brainard DH. The psychophysics toolbox. Spat Vis. 1997;10:433–436. [PubMed] [Google Scholar]
- Cox, 1996.Cox RW. AFNI: software for analysis and visualization of functional magnetic resonance neuroimages. Comput Biomed Res. 1996;29:162–173. doi: 10.1006/cbmr.1996.0014. [DOI] [PubMed] [Google Scholar]
- Dale et al., 1999.Dale AM, Fischl B, Sereno MI. Cortical surface-based analysis. I. Segmentation and surface reconstruction. NeuroImage. 1999;9:179–194. doi: 10.1006/nimg.1998.0395. [DOI] [PubMed] [Google Scholar]
- Diamond and Carey, 1986.Diamond R, Carey S. Why faces are and are not special: an effect of expertise. J Exp Psychol Gen. 1986;115:107–117. doi: 10.1037//0096-3445.115.2.107. [DOI] [PubMed] [Google Scholar]
- Fischl et al., 1999.Fischl B, Sereno MI, Dale AM. Cortical surface-based analysis. II. Inflation, flattening, and a surface-based coordinate system. NeuroImage. 1999;9:195–207. doi: 10.1006/nimg.1998.0396. [DOI] [PubMed] [Google Scholar]
- Freedman et al., 2006.Freedman DJ, Riesenhuber M, Poggio T, Miller EK. Experience-dependent sharpening of visual shape selectivity in inferior temporal cortex. Cereb Cortex. 2006;16:1631–1644. doi: 10.1093/cercor/bhj100. [DOI] [PubMed] [Google Scholar]
- Friston et al., 2006.Friston KJ, Rotshtein P, Geng JJ, Sterzer P, Henson RN. A critique of functional localisers. NeuroImage. 2006;30:1077–1087. doi: 10.1016/j.neuroimage.2005.08.012. [DOI] [PubMed] [Google Scholar]
- Furmanski et al., 2004.Furmanski CS, Schluppeck D, Engel SA. Learning strengthens the response of primary visual cortex to simple patterns. Curr Biol. 2004;14:573–578. doi: 10.1016/j.cub.2004.03.032. [DOI] [PubMed] [Google Scholar]
- Gauthier and Bukach, (2006).Gauthier I, Bukach C. Should we reject the expertise hypothesis? Cognition. 2006 doi: 10.1016/j.cognition.2006.05.003. in press. [DOI] [PubMed] [Google Scholar]
- Gauthier and Logothetis, 2000.Gauthier I, Logothetis N. Is face recognition not so unique, after all? Cognit Neuropsychol. 2000;17:125–142. doi: 10.1080/026432900380535. [DOI] [PubMed] [Google Scholar]
- Gauthier and Tarr, 2002.Gauthier I, Tarr MJ. Unraveling mechanisms for expert object recognition: bridging brain activity and behavior. J Exp Psychol Hum Percept Perform. 2002;28:431–446. doi: 10.1037//0096-1523.28.2.431. [DOI] [PubMed] [Google Scholar]
- Gauthier et al., 1999.Gauthier I, Tarr MJ, Anderson AW, Skudlarski P, Gore JC. Activation of the middle fusiform “face area” increases with expertise in recognizing novel objects. Nat Neurosci. 1999;2:568–573. doi: 10.1038/9224. [DOI] [PubMed] [Google Scholar]
- Gauthier et al., 2000.Gauthier I, Skudlarski P, Gore JC, Anderson AW. Expertise for cars and birds recruits brain areas involved in face recognition. Nat Neurosci. 2000;3:191–197. doi: 10.1038/72140. [DOI] [PubMed] [Google Scholar]
- Goldstone, 1998.Goldstone RL. Perceptual learning. Annu Rev Psychol. 1998;49:585–612. doi: 10.1146/annurev.psych.49.1.585. [DOI] [PubMed] [Google Scholar]
- Grill-Spector, 2003.Grill-Spector K. The neural basis of object perception. Curr Opin Neurobiol. 2003;13:159–166. doi: 10.1016/s0959-4388(03)00040-0. [DOI] [PubMed] [Google Scholar]
- Grill-Spector et al., 2000.Grill-Spector K, Kushnir T, Hendler T, Malach R. The dynamics of object-selective activation correlate with recognition performance in humans. Nat Neurosci. 2000;3:837–843. doi: 10.1038/77754. [DOI] [PubMed] [Google Scholar]
- Haxby et al., 2001.Haxby JV, Gobbini MI, Furey ML, Ishai A, Schouten JL, Pietrini P. Distributed and overlapping representations of faces and objects in ventral temporal cortex. Science. 2001;293:2425–2430. doi: 10.1126/science.1063736. [DOI] [PubMed] [Google Scholar]
- Henson et al., 2000.Henson R, Shallice T, Dolan R. Neuroimaging evidence for dissociable forms of repetition priming. Science. 2000;287:1269–1272. doi: 10.1126/science.287.5456.1269. [DOI] [PubMed] [Google Scholar]
- Janzen and van Turennout, 2004.Janzen G, van Turennout M. Selective neural representation of objects relevant for navigation. Nat Neurosci. 2004;7:673–677. doi: 10.1038/nn1257. [DOI] [PubMed] [Google Scholar]
- Kobatake et al., 1998.Kobatake E, Wang G, Tanaka K. Effects of shape-discrimination training on the selectivity of inferotemporal cells in adult monkeys. J Neurophysiol. 1998;80:324–330. doi: 10.1152/jn.1998.80.1.324. [DOI] [PubMed] [Google Scholar]
- Kourtzi et al., (2005).Kourtzi Z, Betts LR, Sarkheil P, Welchman AE. Distributed neural plasticity for shape learning in the human visual cortex. PLOS Biol. 2005;3:e204. doi: 10.1371/journal.pbio.0030204. [DOI] [PMC free article] [PubMed] [Google Scholar]
- Logothetis and Sheinberg, 1996.Logothetis NK, Sheinberg DL. Visual object recognition. Annu Rev Neurosci. 1996;19:577–621. doi: 10.1146/annurev.ne.19.030196.003045. [DOI] [PubMed] [Google Scholar]
- Logothetis et al., 1995.Logothetis NK, Pauls J, Poggio T. Shape representation in the inferior temporal cortex of monkeys. Curr Biol. 1995;5:552–563. doi: 10.1016/s0960-9822(95)00108-4. [DOI] [PubMed] [Google Scholar]
- McAdams and Maunsell, 1999.McAdams CJ, Maunsell JH. Effects of attention on orientation-tuning functions of single neurons in macaque cortical area V4. J Neurosci. 1999;19:431–441. doi: 10.1523/JNEUROSCI.19-01-00431.1999. [DOI] [PMC free article] [PubMed] [Google Scholar]
- McKone and Robbins, (2006).McKone E, Robbins R. The evidence rejects the expertise hypothesis: reply to Gauthier and Bukach. Cognition. 2006 doi: 10.1016/j.cognition.2006.05.014. in press. [DOI] [PubMed] [Google Scholar]
- Miyashita et al., 1993.Miyashita Y, Date A, Okuno H. Configurational encoding of complex visual forms by single neurons of monkey temporal cortex. Neuropsychologia. 1993;31:1119–1131. doi: 10.1016/0028-3932(93)90036-y. [DOI] [PubMed] [Google Scholar]
- Op de Beeck et al., 2003.Op de Beeck H, Wagemans J, Vogels R. The effect of category learning on the representation of shape: dimensions can be biased but not differentiated. J Exp Psychol Gen. 2003;132:491–511. doi: 10.1037/0096-3445.132.4.491. [DOI] [PubMed] [Google Scholar]
- Palmeri and Gauthier, 2004.Palmeri TJ, Gauthier I. Visual object understanding. Nat Rev Neurosci. 2004;5:291–303. doi: 10.1038/nrn1364. [DOI] [PubMed] [Google Scholar]
- Palmeri et al., 2004.Palmeri TJ, Wong AC, Gauthier I. Computational approaches to the development of perceptual expertise. Trends Cogn Sci. 2004;8:378–386. doi: 10.1016/j.tics.2004.06.001. [DOI] [PubMed] [Google Scholar]
- Pelli, 1997.Pelli DG. The VideoToolbox software for visual psychophysics: transforming numbers into movies. Spat Vis. 1997;10:437–442. [PubMed] [Google Scholar]
- Rainer et al., 2004.Rainer G, Lee H, Logothetis NK. The effect of learning on the function of monkey extrastriate visual cortex. PLoS Biol. 2004;2:E44. doi: 10.1371/journal.pbio.0020044. [DOI] [PMC free article] [PubMed] [Google Scholar]
- Ringo, 1996.Ringo JL. Stimulus specific adaptation in inferior temporal and medial temporal cortex of the monkey. Behav Brain Res. 1996;76:191–197. doi: 10.1016/0166-4328(95)00197-2. [DOI] [PubMed] [Google Scholar]
- Saxe, et al. (2006).Saxe R, Brett M, Kanwisher N. Divide and conquer: a defense of functional localizers. NeuroImage. 2006;30:1088–1096. doi: 10.1016/j.neuroimage.2005.12.062. discussion 1097–1089. [DOI] [PubMed] [Google Scholar]
- Schiltz et al., 1999.Schiltz C, Bodart JM, Dubois S, Dejardin S, Michel C, Roucoux A, Crommelinck M, Orban GA. Neuronal mechanisms of perceptual learning: changes in human brain activity with training in orientation discrimination. NeuroImage. 1999;9:46–62. doi: 10.1006/nimg.1998.0394. [DOI] [PubMed] [Google Scholar]
- Schoups et al., 2001.Schoups A, Vogels R, Qian N, Orban G. Practising orientation identification improves orientation coding in V1 neurons. Nature. 2001;412:549–553. doi: 10.1038/35087601. [DOI] [PubMed] [Google Scholar]
- Schwartz et al., 2002.Schwartz S, Maquet P, Frith C. Neural correlates of perceptual learning: a functional MRI study of visual texture discrimination. Proc Natl Acad Sci USA. 2002;99:17137–17142. doi: 10.1073/pnas.242414599. [DOI] [PMC free article] [PubMed] [Google Scholar]
- Schyns et al., (1998).Schyns PG, Goldstone RL, Thibaut JP. The development of features in object concepts. Behav Brain Sci. 1998;21:1–17. doi: 10.1017/s0140525x98000107. discussion 17–54. [DOI] [PubMed] [Google Scholar]
- Sheinberg and Logothetis, 2002.Sheinberg DL, Logothetis NK. Perceptual learning and the development of complex visual representations in temporal cortical neurons. In: Fahle M, Poggio T, editors. Perceptual learning. Cambridge: MIT; 2002. pp. 95–124. [Google Scholar]
- Sigala and Logothetis, 2002.Sigala N, Logothetis NK. Visual categorization shapes feature selectivity in the primate temporal cortex. Nature. 2002;415:318–320. doi: 10.1038/415318a. [DOI] [PubMed] [Google Scholar]
- Sigman et al., 2005.Sigman M, Pan H, Yang Y, Stern E, Silbersweig D, Gilbert CD. Top-down reorganization of activity in the visual pathway after learning a shape identification task. Neuron. 2005;46:823–835. doi: 10.1016/j.neuron.2005.05.014. [DOI] [PMC free article] [PubMed] [Google Scholar]
- Spiridon and Kanwisher, 2002.Spiridon M, Kanwisher N. How distributed is visual category information in human occipito-temporal cortex? An fMRI study. Neuron. 2002;35:1157–1165. doi: 10.1016/s0896-6273(02)00877-2. [DOI] [PubMed] [Google Scholar]
- Tanaka, 2001.Tanaka JW. The entry point of face recognition: evidence for face expertise. J Exp Psychol Gen. 2001;130:534–543. doi: 10.1037//0096-3445.130.3.534. [DOI] [PubMed] [Google Scholar]
- Tanaka, 2003.Tanaka K. Columns for complex visual object features in the inferotemporal cortex: clustering of cells with similar but slightly different stimulus selectivities. Cereb Cortex. 2003;13:90–99. doi: 10.1093/cercor/13.1.90. [DOI] [PubMed] [Google Scholar]
- Tsao et al., 2006.Tsao DY, Freiwald WA, Tootell RB, Livingstone MS. A cortical region consisting entirely of face-selective cells. Science. 2006;311:670–674. doi: 10.1126/science.1119983. [DOI] [PMC free article] [PubMed] [Google Scholar]
- Van Huffel and Vandewalle, 1991.Van Huffel S, Vandewalle J. Philadelphia: SIAM; 1991. The total least squares problem: computational aspects and analysis. [Google Scholar]
- Weisberg et al. (2006).Weisberg J, van Turennout M, Martin A. A neural system for learning about object function. Cereb Cortex. 2006 doi: 10.1093/cercor/bhj176. in press. [DOI] [PMC free article] [PubMed] [Google Scholar]
- Xu, 2005.Xu Y. Revisiting the role of the fusiform face area in visual expertise. Cereb Cortex. 2005;15:1234–1242. doi: 10.1093/cercor/bhi006. [DOI] [PubMed] [Google Scholar]
- Yang and Maunsell, 2004.Yang T, Maunsell JH. The effect of perceptual learning on neuronal responses in monkey visual area V4. J Neurosci. 2004;24:1617–1626. doi: 10.1523/JNEUROSCI.4442-03.2004. [DOI] [PMC free article] [PubMed] [Google Scholar]
- Yue et al., 2006.Yue X, Tjan BS, Biederman I. What makes faces special? Vision Res. 2006;46:3802–3811. doi: 10.1016/j.visres.2006.06.017. [DOI] [PMC free article] [PubMed] [Google Scholar]