

Abstract
The orchestration of simple motor tasks by the cerebellum results in coordinated movement and the maintenance of balance. The cerebellum integrates sensory and cortical information to generate the signals required for the coordinated execution of simple motor tasks. These signals originate in the firing rate of Purkinje cells, each of which integrates sensory and cortical information conveyed by granule cell synaptic inputs. Given the importance of the granule cell input–Purkinje cell output function for cerebellar computation, this algorithm was determined. Using several stimulation paradigms, including those that mimicked patterns of granule cell activity similar to those observed in vivo, we quantified the poststimulus maximum firing rate and number of extra spikes in response to granule cell synaptic input. Both of these parameters linearly encoded the strength of synaptic input when inhibitory synaptic transmission was blocked. This linear algorithm was independent of the location or temporal pattern of synaptic input. With inhibitory synaptic transmission intact, the maximum firing rate, but not the number of extra spikes, encoded the strength of granule cell synaptic input. Furthermore, the maximum firing rate of Purkinje cells linearly encoded the strength of synaptic input whether or not the activation of granule cells resulted in a pause in Purkinje cell firing. On the basis of the data presented, we propose that Purkinje cells encode the strength of granule cell synaptic input in their maximum firing rate with a linear algorithm.
Keywords: activity, cerebellum, computational algorithm, granule cell, Purkinje neurons, synaptic communication
Introduction
The cerebellum coordinates movement by generating the signals needed for the precise execution of motor tasks. To compose and orchestrate these signals, the cerebellum continuously samples sensory and cortical information from brain regions and sensory modalities related to the programming and the execution of movement (Ito, 1984).
The cerebellum consists of many repeats of a simple computational unit, the detailed anatomical architecture of which was elucidated over a century ago by Ramon y Cajal (1904, 1911). Within the cerebellar cortex, mossy fibers relay sensory and cortical information to granule cells via excitatory synaptic connections. The axons of granule cells (parallel fibers) pass through the granule and Purkinje cell layers to the molecular layer where they bifurcate and extend in either direction to contact the dendrites of Purkinje cells and several classes of interneurons. In addition to directly receiving excitatory input from granule cells, Purkinje cells also receive feedforward inhibitory inputs from molecular layer interneurons, which also receive inputs from granule cells (Palay and Chan-Palay, 1974). Purkinje cells, the sole output of the cerebellar cortex, integrate these inputs and send the processed information to neurons of the deep cerebellar nuclei (DCN), which further process and subsequently transmit the signals needed for motor coordination (Ito, 1984).
The firing rate of Purkinje cells is modulated in correlation with the execution of motor tasks such as smooth eye pursuit, maintenance of postures, various self-initiated limb movements, and locomotion (Thach, 1968, 1970; Lisberger and Fuchs, 1978; Udo et al., 1981; Ito, 1984). For example, the firing rate of Purkinje cells changes in consistent temporal relationship with the movement of the wrist (Thach, 1968) and is monotonically related to eye velocity during smooth-pursuit eye movements (Lisberger and Fuchs, 1978; Miles et al., 1980; Stone and Lisberger, 1990). It is direct input from >150,000 granule cell synapses (Napper and Harvey, 1988) and the associated feedforward inhibition that modulates the firing of Purkinje cells during these tasks. Given the importance of the granule cell input–Purkinje cell output function for cerebellar computation, we sought to determine whether Purkinje cells encode the strength of granule cell synaptic input in their firing and, if so, to delineate the relationship between these parameters.
To determine the computational algorithm with which Purkinje cells encode the strength of excitatory granule cell synaptic input, we activated beams of parallel fibers or patches of granule cells by electrical stimulation or photolytic release of glutamate. We measured the somatic membrane potential and quantified the maximum poststimulus firing rate and the number of extra spikes after stimulations of varying synaptic strength. Independent of the stimulation paradigm used and in the presence or absence of inhibition, we found that the maximum poststimulus firing rate increased linearly with the strength of granule cell synaptic input.
Materials and Methods
Slice preparation.
Wistar rats 12–26 d of age were anesthetized with halothane and decapitated. All experiments were performed in accordance with the guidelines and recommendations set by the Albert Einstein College of Medicine. Equal numbers of younger [postnatal day 12 (P12) to 19] and older (P19–P26) animals were used for these experiments, and there were no differences in the data collected in the animals of different age groups. Sagittal 300-μm-thick slices were made from the cerebellar vermis using a modified Oxford vibratome. Slices were kept at room temperature until use (1–4 h) in recording solution containing the following (in mm): 125 NaCl, 2.5 KCl, 26 NaHCO3, 1.25 NaH2PO4, 1 MgCl2, 2 CaCl2, and 10 glucose, at a pH of 7.4 when gassed with 5% CO2/95% O2.
Electrophysiological recordings.
Slices were placed in a recording chamber on the stage of an upright Olympus (Tokyo, Japan) microscope, and Purkinje cells were visualized using a 40× water-immersion objective (numerical aperture 0.8) with infrared optics. The slices were constantly superfused at a rate of 1.5 ml/min with the recording solution containing 100 μm picrotoxin (Sigma, St. Louis, MO) and 1 μm CGP 55845 [(2S)-3-[[(1S)-1-(3,4-dichlorophenyl)ethyl]amino-2-hydroxypropyl] (phenylmethyl)phosphinic acid] (Tocris, Ellisville, MO) to block GABAA (Yoon et al., 1993) and GABAB (Davies et al., 1993) receptors. These blockers were omitted when the role of inhibition was evaluated. The temperature of the bathing solution was adjusted to 35 ± 1°C. Several experiments were conducted with a flow rate of 5 ml/min, during which the principal findings were reaffirmed (see supplemental material 1, available at www.jneurosci.org).
Extracellular recordings were made from single Purkinje cells using a home-made differential amplifier and glass pipette electrodes filled with the recording solution. With visual guidance, the recording electrodes were placed next to the soma along the axon of Purkinje cells where the greatest voltage deflections were obtainable (200–1000 μV).
Whole-cell recordings were performed with an Optopatch amplifier (Cairn Research, Kent, UK) with electrodes pulled from borosilicate glass with a resistance of 1–3 MΩ when filled with internal solution. Unless noted, the internal solution used for whole-cell voltage-clamp recordings contained the following (in mm): 70 Cs-gluconate, 10 CsF, 20 CsCl, 10 EGTA, 10 HEPES, and 3 Na2ATP, pH 7.4, with CsOH. This intracellular solution also contained 2 mm QX-314 [N-(2,6-dimethylphenylcarbamoylmethyl)-triethylammonium bromide] to block voltage-gated sodium channels. Series resistance (typically 5–8 MΩ) was compensated by 70–80%. EPSCs were recorded in Purkinje cells whole-cell voltage clamped at −60 mV.
The internal solution used for whole-cell current-clamp recordings contained the following (in mm): 120 K- methyl sulfate, 10 KCl, 4 MgATP, 1.8 MgCl2, 14 Na-creatine PO4, 0.01 EGTA, and 10 HEPES, pH 7.2 with KOH. When noted, this intracellular solution also contained 2 mm QX-314 to block voltage-gated sodium channels. When voltage-gated sodium channels were blocked, sufficient current was injected such that at the beginning of each recording the membrane potential was −55 mV.
Extracellular data were sampled at 10 kHz, and whole-cell data were sampled at 20 kHz using an analog-to-digital converter (PCI-MIO-16XE-10; National Instruments, Austin, TX) and acquired and analyzed using custom software written in LabView (National Instruments).
Electrical stimulation.
The electrical stimulus was either a single 200 μs current pulse or three 100 μs pulses presented at 75 Hz using a constant current stimulator (Digitimer, Welwyn Garden City, UK) and theta glass pipettes pulled to tip widths of 80–100 μm (unless noted otherwise). A home-made timing device was used to time-lock stimulations to occur with an action potential during spontaneous firing. We used bipolar stimulation with a large separation between the two poles of the electrode with the reasoning that it would produce a more linear relationship between the strength of stimulation and the number of granule cells and/or fibers activated. Such a configuration results in a wide and fairly uniform electric field between the two poles with a strength that is a linear function of the stimulation intensity. Furthermore, the large separation allows for the activation of a sufficient number of cells and fibers between the two poles to achieve the desired range of excited inputs. Because the strength of the field between the two poles is significantly larger than that outside the poles, the majority of activated inputs are likely to reside between the poles of the electrode. The linear relationship between the strength of stimulation and the resulting EPSCs reported in Results suggests that this configuration performed as predicted.
When stimulating in the granule cell layer, the stimulation electrode was positioned perpendicular to the Purkinje cell under study. To stimulate a beam of parallel fibers, stimulating electrodes were placed in the molecular layer ≈100 μm from the soma of the Purkinje cell under study. For each cell, the minimum stimulus intensity was defined as that which, on average, increased the firing rate by 15 spikes/s above baseline. The stimulus intensities used typically ranged from the minimal stimulus intensity to that which increased the firing rate of a Purkinje cell to ≈250 spikes/s. To average between cells, where appropriate, the stimulus intensity was normalized to the minimal stimulus intensity. CNQX (10 μm; Tocris) was added to the bathing solution at the end of each experiment to ensure that responses were synaptic, and Purkinje cells were not stimulated directly.
Photolytic stimulation.
Granule cells were also activated by the local photolysis of glutamate. The energy source for glutamate photolysis was a multi-line UV Coherent (Santa Clara, CA) Innova 300C kyrpton ion laser. The energy output of the laser was adjusted to 300 mW, and an accusto-optical modulator (Neos Technologies, Melbourne, FL) was used to gate (1 ms) and regulate the intensity of the UV pulse (0–100%). The laser light was transmitted to the microscope via a fiber optic cable, collimated, and positioned via a pair of galvos (Cambridge Technology, Cambridge, MA) driven by the data acquisition software. The laser light was focused to form a 40-μm-diameter spot in the granule cell layer and positioned at least 50 μm away from the Purkinje cell under study. MNI-caged l-glutamate (1 mm; Tocris) was added to the bathing solution and recirculated over the slice to allow pre-equilibration. When used in conjunction with extracellular and current-clamp recordings monitoring action potential firing, photorelease was also time-locked to occur with the firing of an action potential using a home-made timing device. MNI-caged l-glutamate (1 mm) is neither an agonist nor an antagonist for glutamate receptors (Canepari et al., 2001).
Data analysis.
The data acquisition and analysis program was written in house using LabView software. The duration of a Purkinje cell response to stimulation was defined as the time taken for the instantaneous firing rate (reciprocal of individual interspike intervals) poststimulus to return to within 2 SDs of the average prestimulus baseline firing rate. The baseline firing rate was calculated by averaging the 20 prestimulus instantaneous firing rates. Given the extreme regularity of the spontaneous firing of Purkinje cells and the fact that the coefficient of variation of individual interspike intervals is ≈5% (Walter et al., 2006), the average firing rate calculated from the average instantaneous firing rate is very close to the true average firing rate obtained by counting the number of spikes per second. The poststimulus maximum firing rate was defined as the maximum instantaneous firing rate in the response. The number of extra spikes was calculated by counting the number of spikes that occurred during the response and subtracting from it the number of spikes that occurred before stimulus for the same length of time. The latter was established by multiplying the baseline firing rate by the response duration.
For experiments with inhibitory synaptic transmission intact, a pause was defined as an interspike interval >2 SDs of the average baseline interspike interval. Average data are presented as mean ± SEM unless noted otherwise.
Results
The poststimulus maximum firing rate and the number of extra spikes increase linearly with the strength of granule cell synaptic input
The intrinsic spontaneous firing rate of Purkinje cells is continuously modulated by input from granule cell axons that relay sensory and cortical information from mossy fibers (Ito, 1984). We first determined the granule cell input–Purkinje cell output function by establishing the relationship between the strength of granule cell synaptic input and the activity of Purkinje cells in the absence of inhibitory synaptic transmission. To avoid alterations in the rate and pattern of activity of Purkinje cells, we used extracellular recordings and monitored the activity of individual visually identified cells in acutely prepared cerebellar slices.
To establish the relationship between the strength of synaptic stimulation and the activity of a Purkinje cell, we electrically stimulated a patch of granule cells immediately beneath the Purkinje cell under study (Fig. 1A). This stimulation location was chosen because in vivo, in response to a discrete tactile sensory input, Purkinje cells in crus II are excited mainly by the activation of granule cells directly beneath them (Bower and Woolston, 1983; Jaeger and Bower, 1994). To ensure that from trial to trial the synaptic input arrived at a time when Purkinje cell somatic and dendritic voltage-gated channels were at comparable biophysical states, we coordinated the occurrence of the electrical stimulation such that it was always delivered concurrent with an action potential in the target cell.
Figure 1.

The maximum firing rate and extra spikes of a Purkinje cell are a linear function of the strength of electrical stimulation of its synaptic inputs. A, The activity of visually identified Purkinje cells was monitored with extracellular recordings, whereas the granule cell layer immediately below them was electrically stimulated in the presence of 100 μm picrotoxin and 1 μm CGP 55845 to block ionotropic and metabotropic inhibitory synaptic transmission. For the experiments shown, the stimulus was a single 200-μs-long constant current electrical pulse. The strength of the stimulus current was varied from trial to trial in random order. Ai, Individual circles denote the instantaneous firing rate of a Purkinje cell before and after stimulation of the granule cell layer. The granule cell layer was stimulated with 20, 30, and 40 μA intensities. Increasing the strength of stimulation increased the firing rate of the cell, which then decreased monotonically to baseline levels. Aii, In the raster plot shown, vertical bars indicate the time of occurrence of Purkinje cell action potentials 150 ms before and after the delivery of an electrical stimulation. Different stimulation intensities are shown. Increasing the strength of electrical stimulation in the same cell increased the poststimulus firing frequency. Aiii, The maximum (instantaneous) poststimulus firing rates for the cell shown in Aii are plotted. Each symbol represents a single trial, with the solid line representing the linear regression fit to the data (R2 = 0.92). Aiv, Average data from four cells show that the poststimulus maximum firing rate of Purkinje cells linearly increases as a function of the stimulus intensity. To average between cells, the stimulus intensity was normalized to the minimal stimulus intensity. The solid line represents the linear regression fit to the data (R2 = 0.98). Av, Average data from the same four cells as in Aiv show that the number of poststimulus extra spikes linearly increases as a function of the stimulus intensity. To average between cells, the stimulus intensity was normalized to the minimal stimulus intensity. The solid line represents the linear regression fit to the data (R2 = 0.94). Avi, The number of extra spikes increases linearly with poststimulus maximum firing rate responses to the same stimulations in a Purkinje cell. The solid line represents the linear regression fit to the data (R2 = 0.90). B, The experiments presented replicate those in A, with the modification that the stimulus was composed of a train of three 100-μs-long current pulses delivered at 75 Hz. This paradigm replicates the average activity of granule cells in vivo in response to discrete sensory inputs. The first stimulus of the burst was timed to occur simultaneously with the firing of an action potential in the target cell. A linear relationship between the poststimulus maximum firing rate and poststimulus extra spikes of Purkinje cells and the strength of electrical stimulation is also found with this paradigm. The stimulation intensities in Bi were 14, 16, and 18 μA. The linear regression fits to data presented in Biii–Bvi had R2 values of 0.88, 0.98, 0.98, and 0.96, respectively. The data in Biv and Bv are averages from the same five cells. Calibration: 25 ms, 50 spikes/s. Stim., Stimulation; inst., instantaneous.
Stimulation of granule cells rapidly increased the rate of activity of Purkinje cells, which then returned to baseline monotonically (Fig. 1Ai). The increase in the poststimulus firing rate resulted in the firing of more action potentials, extra spikes, after stimulus compared with the same duration of time before stimulus. In principle, both the increased firing rate and the number of extra spikes fired can encode the strength of granule cell synaptic input and were thus quantified. For each cell, we increased the strength of electrical stimulation up to a level that increased the poststimulus maximum firing rate (maximum instantaneous firing rate) to ≈250 spikes/s. This represents the range over which in vivo the firing of Purkinje cells is modulated during motor tasks (Thach, 1970; Espinoza and Smith, 1990; Marple-Horvat et al., 1998; Hirata and Highstein, 2001).
We found that the poststimulus maximum firing rate of Purkinje cells increased linearly with the strength of electrical stimulation (Fig. 1Aii–Aiv). A similar linear relationship was found between the number of extra spikes and the stimulation strength (Fig. 1Av). Because with different stimulation strengths the kinetics of the decline of the firing rate were similar (Fig. 1Ai), there was a linear relationship between the number of extra spikes and poststimulus maximum firing rate (Fig. 1Avi). The stimulation strengths that increased the maximum firing rate from 50 to 250 spikes/s resulted in the firing of zero to five extra spikes.
To be able to correlate the strength of electrical synaptic stimulation with the amount of charge injected into Purkinje cells by granule cell synaptic inputs, in parallel experiments we established the relationship between the strength of electrical stimulation and the resulting EPSCs in voltage-clamped Purkinje cells (Fig. 2A). As predicted from the large diameter of the theta glass bipolar electrode, we found a linear relationship between these two parameters in all six cells examined (Fig. 2A). The linearity of the relationship between the strength of electrical stimulation and the resulting EPSCs thus shows that increasing the amplitude of the EPSCs linearly increases the maximum firing rate and the number of poststimulus extra spikes of Purkinje cells.
Figure 2.

The maximum firing rate of a Purkinje cell is a linear function of the strength of its granule cell synaptic input. A, A Purkinje cell was voltage clamped at −60 mV, and EPSCs were recorded in response to single electrical stimulations of the granule cell layer at varying strengths. Peak EPSC amplitudes increased linearly with the strength of stimulation in the same cell. The top inset shows EPSCs corresponding to stimulations of 8, 30, 50, and 80 μA. Calibration: 25 ms, 200 pA. The bottom inset shows the total charge injected into the same cell by each EPSC. The relationship between the total EPSC charge and the strength of stimulation is also linear. The solid lines represent linear regression fits to the data, each with an R2 value >0.96. B, C, To obtain the relationship between EPSC amplitude and poststimulus maximum firing rate, EPSCs were recorded in voltage-clamped Purkinje cells in response to granule cell stimulation intensities for which the poststimulus maximum firing rates were previously determined extracellularly (C, inset). The solid lines represent linear regression fits to the data, each with an R2 value of 0.98. D, The poststimulus maximum firing rates of Purkinje cells are plotted as a function of the corresponding peak EPSC amplitudes as determined in B. The maximum firing rates of the Purkinje cells are also plotted as a function of the total charge injected by the corresponding EPSCs (inset). On average, approximately 1 nA of inward current, or approximately 8 pC of charge, was sufficient to increase the maximum firing rate to ≈250 spikes/s. Data are from five cells, with each symbol representing a different cell. All average data are shown as mean ± SD. Stim int, Stimulus intensity; Max inst fr, maximum instantaneous firing rate.
Burst activation of granule cells does not alter the linear granule cell input–Purkinje cell output function
Recently, it has been demonstrated in vivo that in response to a discrete sensory stimulus, granule cells fire a burst of approximately three action potentials at ≈75 Hz (Chadderton et al., 2004). To more closely mimic physiological conditions, we re-evaluated the input–output relationship of Purkinje cells using a similar burst stimulation paradigm. A patch of granule cells was electrically stimulated with a train of three stimuli at 75 Hz. Although the first stimulus was time-locked to occur with a spontaneously occurring action potential, the subsequent stimuli were presented independent of the firing of the target cell. Using this protocol, we also found that the poststimulus maximum firing rate and the number of extra spikes increased linearly with the strength of stimulation in all five cells examined (Fig. 1B). Therefore, the linear input–output function is maintained with a burst stimulation paradigm that mimics the activity of granule cells in vivo.
Synchronous injection of approximately 8 pC by granule cell synaptic inputs increases the firing rate of Purkinje cells to ≈250 spikes/s
In vivo, sensory and cortical inputs associated with a motor task drive the firing rate of Purkinje cells as high as ≈250 spikes/s. It would be useful to estimate how much charge needs to be injected by granule cell synaptic inputs to increase the firing rate of a Purkinje cell to ≈250 spikes/s. To accomplish this, the maximum firing rate of a Purkinje cell was first measured in response to an electrical stimulation using extracellular recordings as described. The cell was then whole-cell voltage clamped at −60 mV, and the corresponding EPSC was recorded in response to the same stimulation (Fig. 2B). To improve space clamp, we blocked voltage-gated potassium and sodium channels by using a cesium-based intracellular solution to which 2 mm QX-314 was added. We ascertained that we voltage clamped the same Purkinje cell for which we had previously measured the poststimulus maximum firing rate extracellularly by checking that the extracellularly monitored activity of the cell ceased after achieving whole-cell configuration. In two of the five cells tested, we were able to obtain EPSCs corresponding to several maximum firing rate values. With these experiments, we found that, on average, a maximum peak amplitude of approximately 1 nA, or approximately 8 pC of total EPSC charge, was needed to drive the firing rate of a Purkinje cell to ≈250 spikes/s (Fig. 2C,D).
Asynchronous injection of approximately 30 pC by granule cell synaptic inputs is needed to increase the firing rate of Purkinje cells to ≈250 spikes/s
Our estimate that the injection of approximately 8 pC of charge increases the firing rate of Purkinje cells to ≈250 spikes/s is based on experiments in which granule cells were electrically stimulated. In these experiments, the stimulation synchronously activated the synaptic inputs, a condition that differs from the asynchronous activation of these synapses with physiological stimuli (Jaeger and Bower, 1994; Chadderton et al., 2004). The synchronous activation of the synaptic inputs may be more effective in increasing the firing rate of a Purkinje cell than if the same number of inputs were activated asynchronously. Given such a scenario, a greater number of synaptic inputs may need to be activated to drive a cell to 250 spikes/s. To determine the impact of asynchronous activation, we replaced electrical stimulation with photorelease of glutamate over a patch of granule cells, because with this method of stimulation it is unlikely that all of the granule cells activated will reach threshold to fire action potentials at the same time or fire the same number of action potentials.
Caged glutamate (1 mm) was added to the bathing solution and allowed to equilibrate with the slice. Light from a krypton ion laser was focused to form a 40 μm spot in the specimen plane and positioned on a patch of granule cells immediately below the Purkinje cell under study (Fig. 3A). With the photorelease of glutamate, the EPSCs were much slower to peak and took much longer to decay than the EPSCs obtained with electrical granule cell stimulation (Fig. 3B). The asynchronous activation of granule cells was also apparent in the increased noise of the EPSCs. Based on the kinetics of the EPSCs resulting from glutamate photorelease and the increased noise of the EPSCs, it is clear that this method of stimulation achieved its goal of asynchronously exciting granule cells (Fig. 3B).
Figure 3.

The strength of asynchronous granule cell activity is linearly encoded in the maximum firing rate and extra spikes of Purkinje cells. A, To avoid the nonphysiological synchronous activation of granule cells, localized photorelease of glutamate was substituted for electrical stimulation. UV light from a laser was focused onto a 40-μm-diameter spot and was positioned on the granule cell layer immediately below the Purkinje cell under study. One-millisecond-long pulses of varying intensity were used to photorelease glutamate from caged glutamate to activate the targeted granule cells. Similar to electrical stimulations, the photolysis pulse was delivered coincident with an action potential in the target Purkinje cell. B, EPSCs in Purkinje cells voltage clamped at −60 mV were recorded after activation of granule cells with electrical stimulation (top traces) or photorelease of glutamate (bottom traces) at four different stimulation strengths. The timing of the stimulation is depicted by the arrow. As judged by the kinetics and noise of the resulting EPSCs, glutamate photolysis activated the target granule cells relatively asynchronously. Calibration: 50 ms, 200 pA. C, The peak amplitude and the total charge (inset) of EPSCs increased linearly as a function of the intensity of the photolysis pulse in the same cell. Solid lines represent linear regression fits to the data (R2 = 0.96 and 0.94 for the inset). Average data are shown as mean ± SD. D, The poststimulus maximum firing rate was measured with extracellular recordings in response to photorelease of different concentrations of glutamate. In five cells examined, the maximum firing rate increased linearly with the amount of glutamate photoreleased. Different symbols represent different cells. Solid lines show linear regression fits to data for each cell (R2 > 0.94 in each case). E, The number of poststimulus extra spikes was measured with extracellular recordings in response to photorelease of different concentrations of glutamate. In five cells examined (same as in D), the number of poststimulus extra spikes increased linearly with the amount of glutamate photoreleased. Different symbols represent different cells. Solid lines show linear regression fits to data for each cell (R2 > 0.87 in each case). F, The poststimulus maximum firing rate and peak EPSC amplitudes in response to photorelease of glutamate were measured in the same cell with extracellular and whole-cell voltage-clamp recordings, respectively. The poststimulus maximum firing rate was a linear function of the peak EPSC amplitude, or total EPSC charge (inset). On average, approximately 30 pC was required to increase the maximum firing rate to ≈250 spikes/s. Different cells are represented by different symbols. Average data are shown as mean ± SD. Max inst fr, Maximum instantaneous firing rate; inst, instantaneous.
One-millisecond pulses of various intensities were applied to photorelease different concentrations of glutamate onto the granule cells. The energies of photolysis pulses used were such that even 100% photolysis power was submaximal and did not photolyze all of the targeted caged glutamate. This, combined with the fact that photolysis occurred in a volume several orders of magnitude smaller than the total volume of the recirculated caged glutamate solution meant that increasing the energy of the UV photolysis pulse from trial to trial linearly increased the concentration of photoreleased glutamate. In all five cells examined, we found that the peak EPSC amplitude (Fig. 3C), the total charge injected by the EPSC (Fig. 3C, inset), the maximum firing rate of a Purkinje cell (Fig. 3D), and the number of extra spikes (Fig. 3E) increased linearly with the amount of glutamate photoreleased.
Similar to the experiments described in Figure 2B, we then performed sequential extracellular and whole-cell voltage-clamp recordings to determine the current needed to increase the firing rate of a Purkinje cell. On average, the peak amplitude of the EPSCs that drove the cell to fire at ≈250 spikes/s, approximately 0.6 nA, was less than that obtained with electrical stimulation (compare Figs. 2D, 3F). However, the asynchronous activation of granule cell synaptic inputs resulted in EPSCs that injected more total charge than synchronous activations that drove cells to the same firing rates (Figs. 2D, 3F). On average, approximately 30 pC of total EPSC charge was needed to increase the firing rate of Purkinje cells to ≈250 spikes/s when granule cell synaptic inputs were activated asynchronously.
The input–output function of Purkinje cells is independent of whether a patch of granule cells or a beam of parallel fibers is activated
Although the firing rate of a Purkinje cell is a linear function of the current injected into the soma (Llinas and Sugimori, 1980a), EPSCs originate in the dendrites. These dendrites express a high density of P/Q voltage-gated calcium channels (Regan, 1991; Usowicz et al., 1992) and are the origin of calcium spikes (Llinas and Sugimori, 1980b). Given the highly dynamic and excitable nature of the dendrites, we wondered whether the observed linearity was a consequence of the experimental design in which a patch of granule cells was stimulated. With this paradigm, it is likely that the activated synapses were dispersed across the dendritic tree. Such a dispersed input may not have sufficiently depolarized any one location of the dendrites to impose nonlinearity on the input–output function by activating a large number of voltage-gated channels. To examine this possibility, the input–output relationship was also determined with the activation of a beam of parallel fibers.
To activate a beam of parallel fibers, the stimulation electrode was positioned within the molecular layer, and the parallel fibers were electrically activated using the electrical burst stimulation paradigm described previously (Fig. 4A). We first ensured that with beam stimulations the number of activated parallel fibers increased linearly with the strength of electrical stimulation by whole-cell voltage clamping the cells and measuring the total charge of EPSCs. In all four cells examined, the relationship was linear (Fig. 4B). With extracellular recordings, we next examined the relationship between the strength of parallel fiber stimulation and the poststimulus maximum firing rate of Purkinje cells and found it also to be linear in all five cells examined (Fig. 4C). These experiments demonstrated that the input–output function of Purkinje cells is linear whether they receive synaptic input as a beam of parallel fibers or via activation of a patch of granule cells.
Figure 4.

The maximum firing rate is a linear function of the synaptic current injected by a beam of parallel fiber synaptic input. A, A Purkinje cell was voltage clamped at −60 mV, and the total charge injected by an EPSC was recorded in response to electrical stimulation. The stimulus consisted of three 100 μs current pulses presented at 75 Hz with a pipette positioned in the molecular layer. B, The total charge injected by an EPSC increased linearly with the strength of parallel fiber stimulation for an individual Purkinje cell (R2 = 0.98). C, The poststimulus maximum firing rate increased linearly with the strength of parallel fiber stimulation for an individual Purkinje cell (R2 = 0.87). Each symbol represents a single trial. D, To obtain the relationship between total charge injected by an EPSC and poststimulus maximum firing rate, the total charge injected by an EPSC was recorded in a voltage-clamped Purkinje cell in response to a molecular layer stimulation intensity for which the poststimulus maximum firing rate was previously determined extracellularly. Each symbol represents a different cell. inst, Instantaneous.
Using extracellular recordings followed by whole-cell voltage-clamp recordings in the same cell, we estimated the total charge needed to increase the firing rate of a Purkinje cell to ≈250 spikes/s with beam stimulations (Fig. 4D). As expected from the relative similarity in the stimulation paradigms, on average the amount of charge needed to increase the firing rate of the Purkinje cells to ≈250 spikes/s with on beam burst stimulations (approximately 38 pC) was comparable to that found with asynchronous activation of a patch of granule cells with glutamate photolysis (approximately 30 pC).
Somatic membrane potential is a linear function of the strength of granule cell synaptic input
Although extracellular recording allows the monitoring of the activity of a neuron without perturbing it, it does not provide any information about the absolute membrane potential. To examine changes in the absolute membrane potential as a function of the strength of synchronous and asynchronous synaptic input, we performed a number of whole-cell current-clamp recordings.
Purkinje cells were whole-cell current clamped, and current was injected to maintain the membrane potential at approximately −70 mV, a potential at which Purkinje cells do not fire spontaneously. Every 12 s, the amplitude of the hyperpolarizing current injected was reduced for 2.5 s and the cell was allowed to fire spontaneously (Fig. 5A). One second after the onset of spontaneous firing and coincident with the firing of an action potential, a patch of granule cells immediately beneath the Purkinje cell was electrically stimulated.
Figure 5.
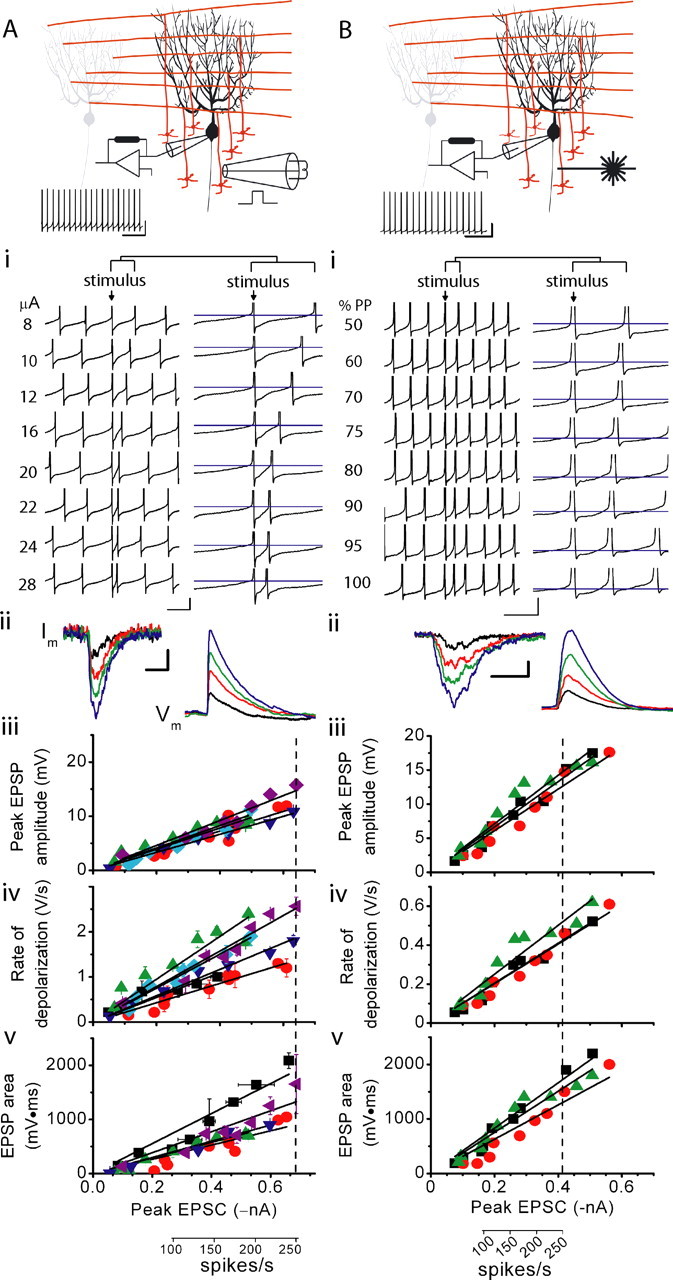
Increasing the strength of granule cell synaptic input linearly increases somatic membrane potential. A, Purkinje cells were whole-cell current clamped, and current was injected to maintain the membrane potential at approximately −70 mV. The amplitude of the hyperpolarizing current injected was reduced for 2.5 s, and the cell was allowed to fire spontaneously. One second into spontaneous firing, a bipolar stimulating electrode was used to electrically stimulate the granule cell layer immediately below the Purkinje cell. As with extracellular recordings, the stimulus was delivered coincident with an action potential in the target Purkinje cell. The spontaneous firing of a Purkinje cell is shown. Calibration: 100 ms, 20 mV. Ai, The responses of the cell shown above to different strengths of electrical stimulation are shown. As can be seen in the compressed (left) and expanded (right) traces, the maximum firing rate of the Purkinje cell increased with the strength of stimulation. For clarity, action potentials are truncated. The blue line indicates −50 mV in the traces on the right (expanded). Calibration: 20 ms, 10 mV for left traces; 8 ms, 10 mV for right traces. Aii, Purkinje cells were voltage clamped at −60 mV with QX-314 in the pipette to block voltage-gated sodium channels, and the granule cell layer was electrically stimulated to record EPSCs. The same cell was then current clamped at −55 mV, and the same stimulation strengths were applied to the granule cell layer to record the corresponding EPSPs. Calibration: 10 ms, 100 pA for current traces (left); 50 ms, 2 mV for voltage traces (right). Aiii, Scatter plot of peak EPSP amplitudes versus the peak amplitude of corresponding EPSCs. Each symbol indicates a different cell. Solid lines show linear regression fits to data for each cell (R2 > 0.87 in each case with the mean R2 = 0.93 ± 0.02). The dashed line indicates the peak EPSC needed to drive Purkinje cells to 250 spikes/s. Aiv, Scatter plot of the rate of EPSP depolarization versus the peak amplitude of the corresponding EPSCs. Each symbol indicates a different cell. Solid lines show linear regression fits to data for each cell (R2 > 0.82 in each case with the mean R2 = 0.92 ± 0.06). Av, Scatter plot of the EPSP area versus the peak amplitude of the corresponding EPSCs. Each symbol indicates a different cell. Solid lines show linear regression fits to data for each cell (R2 > 0.82 in each case with the mean R2 = 0.90 ± 0.06). B, The experiments presented replicate those in A, with the modification that 1-ms-long UV pulses of varying intensity were used to photorelease glutamate from caged glutamate in the granule cell layer immediately beneath the Purkinje cell under study to mimic asynchronous release. In Bi, the blue line indicates −50 mV in the traces on the right (expanded). In Biii–Bv, solid lines show linear regression fits to data for each cell [R2 > 0.92 (Biii, Biv), R2 > 0. 90 in (Bv)]. Also, the dashed line indicates the peak EPSC needed to drive Purkinje cells to 250 spikes/s. Calibration: B, 50 ms, 20 mV; Bi, 20 ms, 10 mV for the left traces (compressed) and 5 ms, 8 mV right traces (expanded); Bii, 50 ms, 100 pA for the current traces (left) and 140 ms, 3 mV for the voltage traces (right).
Similarly to that seen with extracellular recording, electrical stimulation of the granule cell layer increased the firing rate of the whole-cell current-clamped Purkinje cells (Fig. 5Ai). Furthermore, in all four cells examined, the maximum firing rate of Purkinje cells increased linearly with the strength of electrical stimulation (Fig. 5Ai). Qualitatively, it was apparent that the membrane potential immediately after the stimulation depolarized in proportion with the strength of stimulation (Fig. 5Ai). However, the presence of action potentials made it difficult to accurately quantify the underlying synaptic depolarizations.
To evaluate the amplitude and time course of synaptic depolarizations, and their relationship to the strength of synaptic input, voltage-gated sodium channels in the Purkinje cells were blocked by including QX-314 in the internal patch pipette solution. Current was injected to achieve a membrane potential of approximately −55 mV, a value that under our experimental conditions approximates the average potential between action potentials in spontaneously firing Purkinje cells (Womack et al., 2004). A patch of granule cells beneath the Purkinje cell was then electrically activated at various stimulation intensities. We quantified the peak amplitude, rate of depolarization, and area of the EPSP but restricted our analysis to EPSPs that drive Purkinje cells to fire up to ≈250 spikes/s. A comparison of EPSCs generated by single granule cells in Purkinje cells voltage clamped with our potassium- and cesium-based intracellular pipette solutions showed that the peak amplitude of the EPSC measured with the potassium-based solution was ≈70% of that recorded with the cesium-based solution (see supplemental material 2, available at www.jneurosci.org). Therefore, stimulations were restricted to those that generated currents with peak amplitudes from approximately 25 to 700 pA (Fig. 5Aii–Av).
The peak EPSP amplitude increased as a linear function of the current amplitude in all six cells examined (Fig. 5Aiii). On average, the membrane potential depolarized by ≈10 mV in response to stimuli that drive the Purkinje cell to fire at ≈250 spikes/s (Fig. 5Aiii). Despite the ambiguity in quantifying the peak EPSP amplitudes when Purkinje cells were allowed to fire action potentials, the depolarizations appeared, nonetheless, markedly smaller (typically ≈2 mV) than the 10 mV EPSPs measured here (Fig. 5Ai,Aiii). This is likely the consequence of a decrease in the input resistance of Purkinje cells brought about by activation of additional conductances when the cells are allowed to fire action potentials. Similar observations were made by Jaeger and Bower (1994).
In addition to the peak EPSP amplitude, the rate of rise of the EPSP also increased linearly with the amplitude of the glutamate-evoked current in all six cells examined and ranged from ≈1 to 3 V/s at currents that drive Purkinje cells to fire at ≈250 spikes/s (Fig. 5Aiv). In agreement with previous findings that the number of extra spikes increases linearly with the strength of granule cell synaptic input (Fig. 1Av), the EPSP area also increased linearly as a function of the glutamate-evoked current amplitude in all six cells examined (Fig. 5Av).
Although the peak amplitude, rate of rise, and area of the EPSPs increase linearly with the amplitude of currents that increase the firing of Purkinje cells from ≈50 to 250 spikes/s, increasing the strength of stimulation far beyond this range resulted in EPSPs with markedly altered kinetics that often triggered calcium spikes and were not a linear function of the strength of input (see supplemental material 3, available at www.jneurosci.org). Because there is no evidence to suggest that such responses are physiologically relevant, they were not pursued.
We also used current-clamp recordings to examine the membrane potential of Purkinje cells in response to the asynchronous photolytic activation of granule cells. In all three cells examined, the maximum firing rate and the EPSP profile increased monotonically with the strength of photolysis (Fig. 5Bi). As expected, the time course of EPSPs in the presence of QX-314 was significantly longer than that with synchronous stimulations, and the peak, rate of rise, and area of the EPSPs increased linearly with the peak amplitude of the glutamate-evoked currents (Fig. 5Bii–Bv). Similarly to that seen with synchronous stimulations, on average Purkinje cells were depolarized by ≈10 mV with stimulations that increased the firing of Purkinje cells to ≈250 spikes/s (Fig. 5Biii). Again, these depolarizations were greater than those observed when the cell was allowed to fire action potentials (Fig. 5Bi).
The input–output relationship of Purkinje cells is linear in the presence of feedforward inhibition
In addition to making excitatory synaptic inputs onto Purkinje cells, granule cells also make excitatory synaptic contacts onto basket and stellate cell interneurons, which provide feedforward inhibition onto Purkinje cells (Ito, 1984). It has been proposed that the fast feedforward inhibition provided by on-beam molecular layer interneurons shortens the excitatory response of a Purkinje cell to granule cell synaptic input (Brunel et al., 2004; Mittmann et al., 2005). The inhibition of Purkinje cells by these “on-beam” interneurons may, in principle, alter the linear input–output relationship reported here. Therefore, we examined whether the input–output function obtained with granule cell activation remains linear in the presence of inhibitory synaptic transmission.
We electrically stimulated the granule cell layer immediately beneath the Purkinje cell similarly to the experiments shown in Figure 1A, but in the absence of blockers of inhibitory synaptic transmission (Fig. 6A). To preserve as much of the feedforward circuitry as possible, extracellular recordings were made from Purkinje cells ≈100 μm beneath the surface of the slice. In all 10 cells studied and with all strengths of electrical stimulation used, the responses of Purkinje cells to granule cell layer stimulation contained pauses (50–300 ms) in firing (Fig. 6B,C). The pauses in Purkinje cell firing were attributable to the excitation of interneurons by granule cell synaptic input and not attributable to direct electrical stimulation, because pauses were abolished after application of 10 μm CNQX (Fig. 6B). The onset of the pause was extremely fast such that, on average, it constituted the first interspike interval in most responses. Increasing the strength of stimulation of the granule cell layer increased the probability of occurrence of an action potential before the pause (Fig. 6C). On average, at lower stimulation intensities, an action potential occurred before the pause in only 29.9 ± 9.1% of the responses. This increased to 44.2 ± 11.8% at higher stimulation intensities. Our results are in agreement with previous reports that feedforward inhibition plays a major role in shaping the responses of Purkinje cells to granule cell stimulation (Brunel et al., 2004; Mittmann et al., 2005). It is proposed that the fast onset of feedforward inhibition rapidly limits excitatory postsynaptic potentials and thus increases the precision of timing of the most immediate poststimulus action potential (Brunel et al., 2004; Mittmann et al., 2005). As discussed, we found that in the majority of cases, an action potential did not precede the pause produced by feedforward inhibition. Thus, although feedforward inhibition clearly plays a major role in shaping the response of Purkinje cells to granule cell synaptic input, feedforward inhibition does not solely regulate the precision of action potential timing.
Figure 6.
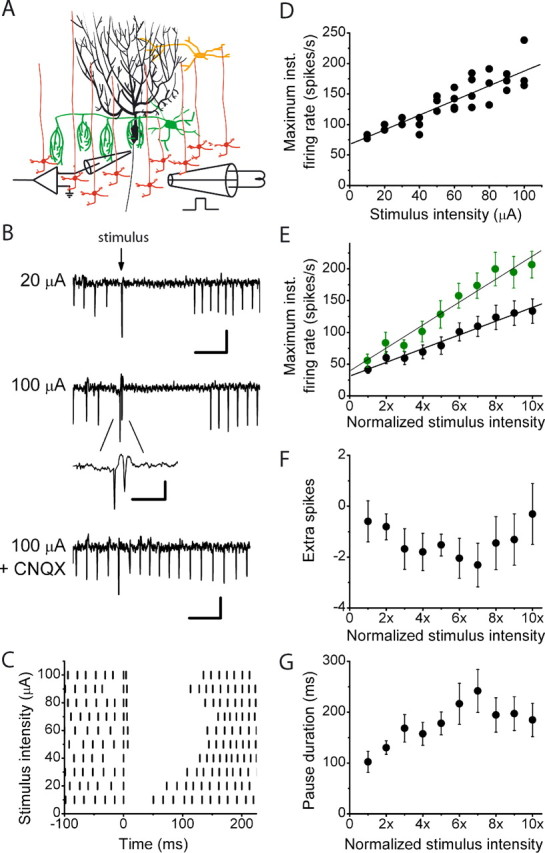
In the presence of feedforward inhibition, the maximum firing rate of a Purkinje cell is a linear function of the strength of its granule cell synaptic input. A, In the absence of inhibitory synaptic transmission blockers, the activity of visually identified Purkinje cells was monitored with extracellular recordings, whereas the granule cell layer immediately beneath them was electrically stimulated with bipolar electrodes 80–100 μm in diameter The stimulus was a single 200-μs-long constant current electrical pulse that was delivered concurrently with an action potential in the target Purkinje cell. The strength of the stimulus current was varied from trial to trial in random order. B, Sample extracellular recordings show the response of an individual Purkinje cell to granule cell layer stimulations of 20 and 100 μA. The response of a Purkinje cell to a 100 μA stimulation is abolished in the presence of 10 μm CNQX, confirming that interneurons are activated by granule cell synaptic input and are not being directly stimulated. Calibration: (in descending order) 50 ms, 400 μV; 10 ms, 400 μV; 50 ms, 300 μV. C, In the raster plot, vertical bars indicate the time of occurrence of Purkinje cell action potentials 100 ms before and 225 ms after the delivery of an electrical stimulation. Different stimulation intensities are shown. Increasing the strength of electrical stimulation in the same cell increased the poststimulus firing frequency. D, The maximum poststimulus firing rates for the cell shown in C are plotted. Each symbol represents a single trial, with the solid line representing the linear regression fit to the data (R2 = 0.81). E, Average data from 10 cells (black circles) show that the poststimulus maximum firing rate of Purkinje cells linearly increases as a function of the stimulus intensity. To average between cells, the stimulus intensity was normalized to the minimal stimulus intensity. The solid line represents the linear regression fit to the data (R2 = 0.98). Average data (mean ± SEM) from five cells with maximum firing rates that reached 200 spikes/s (green circles) show that the poststimulus maximum firing rate of Purkinje cells linearly increases as a function of the stimulus intensity. The stimulus intensity was normalized to the minimal stimulus intensity. The solid line represents the linear regression fit to the data (R2 = 0.96). F, Average data from the same 10 cells as in E show that there is no relationship between the strength of granule cell layer stimulation and the number of poststimulus extra spikes. The stimulus intensity was normalized to the minimal stimulus intensity. G, Average data from the same 10 cells as in E and F show that although the pause duration initially increases with the strength of granule cell layer stimulation, the relationship is not linear over the entire range examined.
There was variability from cell to cell, but, in general, with increases in stimulation intensity, the pause duration either increased monotonically or showed an initial increase followed by a decrease. When averaged across all cells, the pause duration increased over lower intensities and then had no significant relationship with higher stimulus intensities (Fig. 6G). Because at all stimulus intensities there was a pause in firing, on average with intact inhibition, the number of poststimulus extra spikes was negative. Furthermore, in contrast to the experiments done in the absence of inhibition, there was no clear relationship between the number of poststimulus extra spikes and the strength of stimulation (Fig. 6F).
The firing rate of Purkinje cells was sometimes higher after the pause in firing compared with prestimulus levels. Because response duration was defined as the time taken for the firing rate to come back to within 2 SDs of the prestimulus firing rate, in cases in which synaptic inhibition did not allow for an action potential before the pause, the poststimulus maximum firing rate occurred after the pause. In all cells tested and with all strengths of stimulation used, the activation of a patch of granule cells immediately beneath a Purkinje cell increased its poststimulus maximum firing rate compared with its prestimulus rates (Fig. 6C–E). Despite the major influence that inhibition had on the response of Purkinje cells to granule cell layer stimulation, remarkably we found that the relationship between the strength of granule cell layer stimulation and the maximum firing rate of Purkinje cells remained linear. The relationship was linear even in cells in which the poststimulus maximum firing rate occurred before the pause at some stimulation strengths and after the pause at others (Fig. 6C,D). As expected, larger stimulation intensities were required to increase the firing rate of Purkinje cells with inhibition intact. Because the resistance of the bipolar electrodes limited the maximum stimulation intensities used, on average the poststimulus maximum firing rate of all 10 cells examined did not exceed ≈150 spikes/s (Fig. 6E). Evaluation of the relationship in a subset of cells for which the resistance of the bipolar electrode was not a limiting factor demonstrated that the relationship remained linear over an extended range of firing rates (Fig. 6E).
Because, in theory, the strength of granule cell synaptic input can be encoded both in the number of extra spikes and the poststimulus maximum firing rate, throughout this study we have quantified the relationship between these two parameters and the strength of granule cell layer stimulation. Whereas in the presence of feedforward inhibition the number of extra spikes failed to encode the strength of input over the entire range examined, under all experimental conditions the poststimulus maximum firing rate linearly encoded the strength of granule cell synaptic input.
In the experiments described above, the poststimulus pause resulted in a prominent decrease in the firing rate of a Purkinje cell. During the execution of motor tasks in vivo, the firing rate of Purkinje cells can increase without any associated decrease. Therefore, as one would expect, there must exist patches of granule cells that when activated do not result in significant feedforward inhibition and do not generate pauses in Purkinje cell firing. We wondered whether the relationship between the strength of granule cell input and the maximum firing rate of Purkinje cells would remain linear with the activation of such patches.
To more selectively activate a subset of granule cells, we reduced the size of the bipolar stimulating electrode to ≈40 μm. We found that in the same slice, electrical stimulations that elicited pauses when the electrode was located in one position did not decrease the firing rate when the electrode was repositioned to another location (Fig. 7A–C). We evaluated the relationship between the strength of granule cell layer stimulation and the maximum firing rate of Purkinje cells at locations that, when activated, did not produce a pause. The input–output function remained linear when the granule cells in these patches were activated (Fig. 7D). To examine the extent to which inhibition shaped these responses, we also established the input–output function in the presence of blockers of inhibitory synaptic transmission. Although blocking inhibitory synaptic transmission did not affect the linearity of the relationship over the range examined, it increased the effectiveness of a stimulus. This was apparent in the 2.6-fold increase in the slope of the maximum firing rate versus stimulus intensity curve (Fig. 7D).
Figure 7.
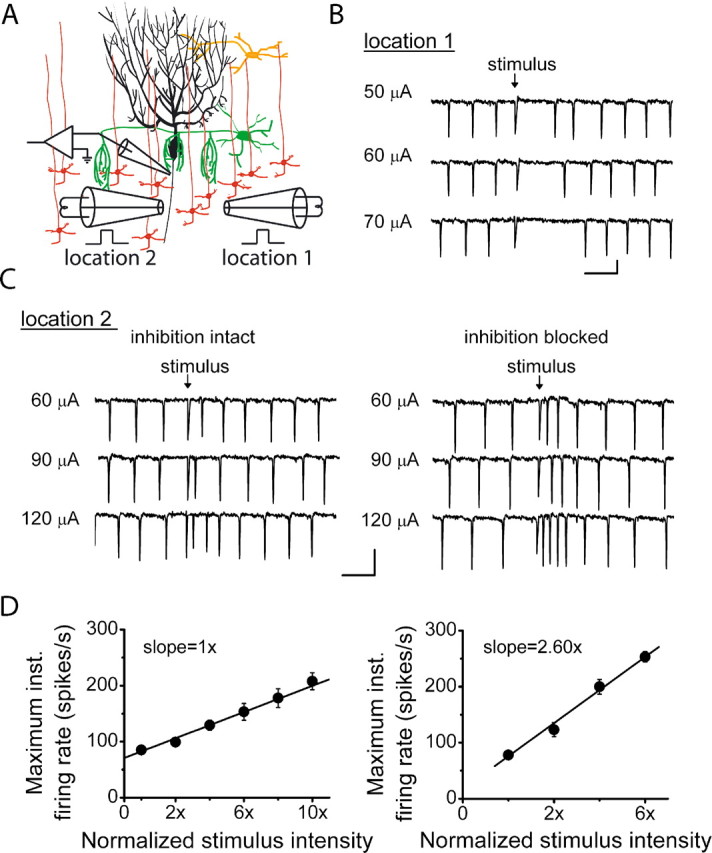
The computational algorithm of Purkinje cells is not affected by inhibitory inputs. A, In the absence of inhibitory synaptic transmission blockers, the activity of visually identified Purkinje cells was monitored with extracellular recordings, and the granule cell layer was electrically stimulated with bipolar electrodes 40 μm in diameter. The location of the bipolar electrode was placed underneath the Purkinje cell in locations that generated inhibitory (location 1) and excitatory (location 2) Purkinje cell responses. B, Sample recordings show the response of a Purkinje cell to granule cell layer stimulations of 50, 60, and 70 μA at location 1. Calibration: 20 ms, 250 μV. C, Sample recordings show the response of the same Purkinje cell in A to granule cell layer stimulations of 60, 90, and 120 μA at location 2 in the presence and absence of 100 μm picrotoxin and 1 μm CGP 55845. Calibration: 20 ms, 500 μV. D, Average data from three cells show that with inhibition intact, the poststimulus maximum firing rate of Purkinje cells linearly increases with the strength of granule cell layer stimulation. Average data from the same three cells with inhibition blocked also reveals a linear input–output function, but with a 2.6-fold higher slope. To average between cells, the stimulus intensity was normalized to the minimal stimulus intensity. Solid lines show linear regression fits to data (R2 > 0.98 in each case). inst., Instantaneous.
Changes in Purkinje cell membrane potential after activation of granule cell synaptic inputs in the presence of feedforward inhibition
Using whole-cell recordings, we also examined synaptic currents and changes in membrane potential after stimulation of the granule cell layer with intact inhibition. Bipolar stimulating electrodes similar to those used for experiments described in Figure 6 were placed in the granule cell layer directly beneath Purkinje cells whole-cell voltage clamped at various membrane potentials (−30 to −60 mV). Although we limited the whole-cell recordings to Purkinje cells located within the more superficial cell layers, in all four cells examined the fast excitatory inward current was followed by a slower inhibitory outward current. The proportion of the peak inward versus peak outward current was variable from cell to cell and depended on the strength of stimulation (Fig. 8B).
Figure 8.

The membrane potential of Purkinje cells in the presence of intact inhibition. A, In the absence of blockers of inhibitory synaptic transmission, a Purkinje cell was whole-cell patch clamped, and the membrane currents or potentials were recorded in response to various strengths of single electrical stimulations of the granule cell layer applied with bipolar electrodes 80–100 μm in diameter (similar to those used in Fig. 6). B, The currents recorded in a voltage-clamped Purkinje cell in response to various stimulation strengths (color-coded as in the graph). Calibration: 5 ms, 100 pA. The bottom inset plots peak EPSC (filled circles) and IPSC (open circles) amplitudes versus stimulus intensity. C, In the absence of blockers of inhibitory synaptic transmission, the response of a Purkinje cell to electrical stimulation of the granule cell layer immediately beneath it using the whole-cell current-clamp protocol of Figure 5Ai is shown. Calibration: 10 ms, 10 mV. For clarity, action potentials are truncated.
In whole-cell current-clamp recordings similar to those described for Figure 5Ai, pauses in Purkinje cell firing could be seen after electrical stimulation of the granule cell layer. In the example shown, and as seen with extracellular recordings, increasing the strength of stimulation initially increased the pause duration while further increases both increased the pause duration and allowed for the generation of an action potential before the pause (Fig. 8C). With even greater strengths of stimulation, the interval decreased between the two spikes occurring before the pause, and the pause duration shortened (Fig. 8C). Similar results were obtained in three of the six cells examined. In the remaining cells examined, the same relationship was obtained between the strength of stimulation and pause duration, although an action potential did not occur before the pause. Furthermore, in half of the cells studied, the increase in pause duration was clearly associated with the extent to which the membrane hyperpolarized during the pause.
It is noteworthy that the whole-cell data differ from those obtained with extracellular recordings in two ways. First, the duration of pauses obtained with whole-cell recordings (20–65 ms) were shorter than those obtained with extracellular recordings (50–300 ms). This could be because visualized whole-cell recordings necessitated the examination of more superficial Purkinje cells. Compared with the more deeply located cells studied with extracellular recordings, the more superficial cells may not have received as many inhibitory synaptic inputs. It is also possible that during whole-cell recordings, dialysis of the cell with the internal patch pipette solution altered the chloride reversal potential. The second difference was that, in contrast to that seen with extracellular recordings, in whole-cell recordings the firing rate did not increase after the pause. The difference could also be the consequence of reduced inhibition because the increase in the firing rate after the pause could be the consequence of rebound depolarization.
Discussion
To coordinate movement, the cerebellum needs to integrate vast amounts of sensory and cortical information (Ito, 1984). Cerebellar processing of this information is performed mainly by Purkinje cells. The dendrites of these cells (Hounsgaard and Yamamoto, 1979; Llinas and Sugimori, 1980b; Lev-Ram et al., 1992) integrate sensory and cortical information from >150,000 granule cell synaptic inputs (Napper and Harvey, 1988). These, along with inhibitory inputs, shape the firing of Purkinje cells and provide the context for the encoding of signals required for motor coordination (Ito, 1984). Thus, the granule cell input–Purkinje cell output function is central for information processing by the cerebellum.
We evaluated the potential use of the number of extra spikes and poststimulus maximum firing rate in encoding the strength of granule cell synaptic input. We find that in the absence of inhibition, both of these parameters linearly encode the strength of synaptic input over the physiological range of firing rates observed in vivo. This linearity was found regardless of the pattern or location of synaptic inputs. In the presence of feedforward inhibition, the maximum firing rate, but not the number of extra spikes, linearly encoded the strength of granule cell synaptic input. The finding that Purkinje cells linearly encode the strength of their synaptic input in their firing rate is consistent with recordings of the firing rate of Purkinje cells in vivo that show Purkinje cells linearly sum information (Thach, 1967; Eccles et al., 1972; Allen et al., 1974). We propose that Purkinje cells encode the strength of their granule cell synaptic inputs in their poststimulus maximum firing rate using a linear computational algorithm, although the mechanism by which DCN neurons decode this information remains to be delineated.
Purkinje cells provide DCN neurons with information regarding stimulus intensity
The firing of Purkinje cells is modulated with the execution of motor tasks and is thought to reflect the strength of sensory and cortical input. Until recently, however, whether the strength of this information is reflected in the firing rate of DCN neurons has been less clear. Rowland and Jaeger (2005) showed with recordings from DCN neurons in vivo that as a population, these neurons show increased response amplitudes as the intensity of the stimulus (air puff) is increased. They also showed that the intensity of the stimulus was encoded in the activity of cerebellar granule cells. Our experiments show that the maximum firing rate of Purkinje cells encodes the strength of granule cell synaptic input and suggests that Purkinje cells relay intensity information to DCN neurons.
Linear input–output functions and information processing
The computational algorithm of a neuron is critical for information processing by it in the circuit in which it resides. We propose that Purkinje cells have a linear granule cell input–Purkinje cell output function that endows them with several properties not obtainable with nonlinear or binary input–output functions. A linear input–output function has the advantage that it enables the target neuron to distinguish the strength of a synaptic input without complicated decoding. The specialized nature of the synapses between Purkinje cells and DCN neurons ensures that the strength of the cortical and sensory information is efficiently translated to a change in the conductance of DCN neurons (Telgkamp et al., 2004). Furthermore, a unique feature of a linear input–output function is that, independent of the initial firing rate of a Purkinje cell, a given change in the strength of sensory and cortical synaptic input is signaled by the same change in the firing rate of the Purkinje cell. This allows the DCN neuron to extract information about the change in the strength of sensory and cortical input to the Purkinje cell without the need for knowledge of its absolute firing rate. Moreover, the sum of several linear functions is also a linear function. Thus, although DCN neurons average information from several Purkinje cells, the integrity of the computational algorithm is maintained.
Comparison with other neurons
The present study attempted to correlate the relationship between the firing rate of Purkinje cells and the amount of charge injected by granule cell synaptic inputs. Unfortunately, there are few studies that allow for a direct comparison. The most comparable experiments were performed in CA1 pyramidal neurons where the numbers of spikes fired by the cell appear to be a linear function of the number of synaptic-like asynchronous inputs (Gasparini and Magee, 2006). Several studies have examined input–output functions by examining the relationship between firing rate of the cell with the amplitude of somatic current injections. Such studies show that, at least in a subpopulation, this relationship is linear in layer II/III visual cortical neurons (Ogawa et al., 1981), layer V neocortical neurons (Stafstrom et al., 1984), brainstem motoneurons (Viana et al., 1995), and layer III entorhinal pyramidal neurons (Dickson et al., 1997). Interpretation of these studies is made ambiguous by the assumption that the current that reaches the soma is a linear function of the number of activated synaptic inputs. This assumption requires validation in each case, because active dendritic conductances often contribute to dendritic integration and may cause the summation of inputs to be nonlinear (Cash and Yuste, 1999; Nettleton and Spain, 2000; Schiller et al., 2000; Oakley et al., 2001; Ariav et al., 2003; Losonczy and Magee, 2006). It is noteworthy, however, that the contribution of active conductances can be remarkably balanced, allowing for linear summation of inputs, such as in CA1 pyramidal neurons (Cash and Yuste, 1999). We believe that the latter scenario also applies to Purkinje cells given their linear input–output function and the fact that blockade of subthreshold voltage-gated Kv1-type potassium channels significantly affects the amplitude and time course of somatic depolarizations evoked by a range of synaptic-like inputs (Khavandgar et al., 2005). The contribution of these channels is likely to be balanced by active conductances such as P/Q-type voltage-gated calcium channels, which are present at a high density in the dendrites of Purkinje cells (Usowicz et al., 1992). Given that active conductances make a significant contribution to the integration of granule cell synaptic inputs, their modulation could, in principle, alter the input–output function. Such modulation could occur, for example, after climbing fiber activation, because the large amplitude and long duration of the complex spike could alter the state of active conductances.
Active dendrites: linear input–output functions
The complement of voltage-gated channels that the dendrites of a neuron express strongly influence its function (Johnston et al., 1996; Yuste and Tank, 1996). The most extreme contribution of these channels is to support the generation of a propagating dendritic sodium or calcium action potential. Therefore, the input–output function of a neuron in which a propagating dendritic action potential is generated is often discontinuous with synaptic inputs straddling threshold. Given the binary nature of an action potential; once a propagating dendritic action potential is initiated the output will no longer be a function of synaptic strength.
Sodium, calcium, and NMDA-mediated dendritic action potentials are found in the dendrites of many neurons and are suggested to contribute to synaptic integration (Benardo et al., 1982; Kim and Connors, 1993; Hausser et al., 1995; Spruston et al., 1995; Schiller et al., 1997; Stuart et al., 1997; Golding and Spruston, 1998; Martina et al., 2000). In many of these neurons, however, it remains to be determined whether dendritic spikes are generated by physiologically relevant strengths and patterns of synaptic input and, if so, how they affect the shape of the input–output function. In Purkinje cells, propagating dendritic calcium action potentials contribute to the integration of climbing fiber synaptic inputs. In fact, a propagating dendritic calcium spike is the hallmark of the response to climbing fiber synaptic input and is responsible for the highly reproducible “complex spike” in Purkinje cells (Eccles et al., 1966; Martinez et al., 1971). Despite the highly excitable nature of Purkinje cell dendrites, here we find no evidence for the generation of these global dendritic calcium spikes with granule cell synaptic inputs that drive the cell as high as ≈250 spikes/s. We cannot, however, rule out the possibility of localized dendritic calcium action potentials that can occur in Purkinje cells with strong activation of a beam of parallel fibers (Rancz and Hausser, 2006).
The ability of climbing fiber and not granule cell synaptic inputs to generate global dendritic calcium spikes would allow for separate functional roles for these inputs. The dendritic calcium action potential generated in response to climbing fiber synaptic input results in a large calcium influx (Miyakawa et al., 1992; Callaway et al., 1995) that plays an important role in the induction of long-term depression of the granule cell to Purkinje cell synapse (Ito, 1989; Sakurai, 1990). This plasticity is thought to underlie several forms of motor learning (Marr, 1969; Albus, 1971; Ito and Kano, 1982; Ito, 1989; Mauk et al., 1998). If similar global dendritic calcium spikes are not generated by granule cell synaptic input, this ensures that climbing fibers maintain the exclusive ability to act as the instructor that induces plasticity at this synapse.
Footnotes
This work was supported by the National Institutes of Health.
References
- Albus, 1971.Albus JS. A theory of cerebellar function. Math Biosci. 1971;10:25–61. [Google Scholar]
- Allen et al., 1974.Allen GI, Azzena GB, Ohno T. Somatotopically organized inputs from fore- and hindlimb areas of sensorimotor cortex to cerebellar Purkyne cells. Exp Brain Res. 1974;20:255–272. doi: 10.1007/BF00238316. [DOI] [PubMed] [Google Scholar]
- Ariav et al., 2003.Ariav G, Polsky A, Schiller J. Submillisecond precision of the input-output transformation function mediated by fast sodium dendritic spikes in basal dendrites of CA1 pyramidal neurons. J Neurosci. 2003;23:7750–7758. doi: 10.1523/JNEUROSCI.23-21-07750.2003. [DOI] [PMC free article] [PubMed] [Google Scholar]
- Benardo et al., 1982.Benardo LS, Masukawa LM, Prince DA. Electrophysiology of isolated hippocampal pyramidal dendrites. J Neurosci. 1982;2:1614–1622. doi: 10.1523/JNEUROSCI.02-11-01614.1982. [DOI] [PMC free article] [PubMed] [Google Scholar]
- Bower and Woolston, 1983.Bower JM, Woolston DC. Congruence of spatial organization of tactile projections to granule cell and Purkinje cell layers of cerebellar hemispheres of the albino rat: vertical organization of cerebellar cortex. J Neurophysiol. 1983;49:745–766. doi: 10.1152/jn.1983.49.3.745. [DOI] [PubMed] [Google Scholar]
- Brunel et al., 2004.Brunel N, Hakim V, Isope P, Nadal JP, Barbour B. Optimal information storage and the distribution of synaptic weights: perceptron versus Purkinje cell. Neuron. 2004;43:745–757. doi: 10.1016/j.neuron.2004.08.023. [DOI] [PubMed] [Google Scholar]
- Callaway et al., 1995.Callaway JC, Lasser-Ross N, Ross WN. IPSPs strongly inhibit climbing fiber-activated [Ca2+]i increases in the dendrites of cerebellar Purkinje neurons. J Neurosci. 1995;15:2777–2787. doi: 10.1523/JNEUROSCI.15-04-02777.1995. [DOI] [PMC free article] [PubMed] [Google Scholar]
- Canepari et al., 2001.Canepari M, Nelson L, Papageorgiou G, Corrie JE, Ogden D. Photochemical and pharmacological evaluation of 7-nitroindolinyl- and 4-methoxy-7-nitroindolinyl-amino acids as novel, fast caged neurotransmitters. J Neurosci Methods. 2001;112:29–42. doi: 10.1016/s0165-0270(01)00451-4. [DOI] [PubMed] [Google Scholar]
- Cash and Yuste, 1999.Cash S, Yuste R. Linear summation of excitatory inputs by CA1 pyramidal neurons. Neuron. 1999;22:383–394. doi: 10.1016/s0896-6273(00)81098-3. [DOI] [PubMed] [Google Scholar]
- Chadderton et al., 2004.Chadderton P, Margrie TW, Hausser M. Integration of quanta in cerebellar granule cells during sensory processing. Nature. 2004;428:856–860. doi: 10.1038/nature02442. [DOI] [PubMed] [Google Scholar]
- Davies et al., 1993.Davies CH, Pozza MF, Collingridge GL. CGP 55845A: a potent antagonist of GABAB receptors in the CA1 region of rat hippocampus. Neuropharmacology. 1993;32:1071–1073. doi: 10.1016/0028-3908(93)90073-c. [DOI] [PubMed] [Google Scholar]
- Dickson et al., 1997.Dickson CT, Mena AR, Alonso A. Electroresponsiveness of medial entorhinal cortex layer III neurons in vitro. Neuroscience. 1997;81:937–950. doi: 10.1016/s0306-4522(97)00263-7. [DOI] [PubMed] [Google Scholar]
- Eccles et al., 1966.Eccles JC, Llinas R, Sasaki K. The excitatory synaptic action of climbing fibres on the purinje cells of the cerebellum. J Physiol (Lond) 1966;182:268–296. doi: 10.1113/jphysiol.1966.sp007824. [DOI] [PMC free article] [PubMed] [Google Scholar]
- Eccles et al., 1972.Eccles JC, Sabah NH, Schmidt RF, Taborikova H. Integration by Purkyne cells of mossy and climbing fiber inputs from cutaneous mechanoreceptors. Exp Brain Res. 1972;15:498–520. doi: 10.1007/BF00236405. [DOI] [PubMed] [Google Scholar]
- Espinoza and Smith, 1990.Espinoza E, Smith AM. Purkinje cell simple spike activity during grasping and lifting objects of different textures and weights. J Neurophysiol. 1990;64:698–714. doi: 10.1152/jn.1990.64.3.698. [DOI] [PubMed] [Google Scholar]
- Gasparini and Magee, 2006.Gasparini S, Magee JC. State-dependent dendritic computation in hippocampal CA1 pyramidal neurons. J Neurosci. 2006;26:2088–2100. doi: 10.1523/JNEUROSCI.4428-05.2006. [DOI] [PMC free article] [PubMed] [Google Scholar]
- Golding and Spruston, 1998.Golding NL, Spruston N. Dendritic sodium spikes are variable triggers of axonal action potentials in hippocampal CA1 pyramidal neurons. Neuron. 1998;21:1189–1200. doi: 10.1016/s0896-6273(00)80635-2. [DOI] [PubMed] [Google Scholar]
- Hausser et al., 1995.Hausser M, Stuart G, Racca C, Sakmann B. Axonal initiation and active dendritic propagation of action potentials in substantia nigra neurons. Neuron. 1995;15:637–647. doi: 10.1016/0896-6273(95)90152-3. [DOI] [PubMed] [Google Scholar]
- Hirata and Highstein, 2001.Hirata Y, Highstein SM. Acute adaptation of the vestibuloocular reflex: signal processing by floccular and ventral parafloccular Purkinje cells. J Neurophysiol. 2001;85:2267–2288. doi: 10.1152/jn.2001.85.5.2267. [DOI] [PubMed] [Google Scholar]
- Hounsgaard and Yamamoto, 1979.Hounsgaard J, Yamamoto C. Dendritic spikes in Purkinje cells of the guinea pig cerebellum studied in vitro. Exp Brain Res. 1979;37:387–398. doi: 10.1007/BF00237721. [DOI] [PubMed] [Google Scholar]
- Ito, 1984.Ito M. The cerebellum and neural control. New York: Raven Press; 1984. [Google Scholar]
- Ito, 1989.Ito M. Long-term depression. Annu Rev Neurosci. 1989;12:85–102. doi: 10.1146/annurev.ne.12.030189.000505. [DOI] [PubMed] [Google Scholar]
- Ito and Kano, 1982.Ito M, Kano M. Long-lasting depression of parallel fiber-Purkinje cell transmission induced by conjunctive stimulation of parallel fibers and climbing fibers in the cerebellar cortex. Neurosci Lett. 1982;33:253–258. doi: 10.1016/0304-3940(82)90380-9. [DOI] [PubMed] [Google Scholar]
- Jaeger and Bower, 1994.Jaeger D, Bower JM. Prolonged responses in rat cerebellar Purkinje cells following activation of the granule cell layer: an intracellular in vitro and in vivo investigation. Exp Brain Res. 1994;100:200–214. doi: 10.1007/BF00227191. [DOI] [PubMed] [Google Scholar]
- Johnston et al., 1996.Johnston D, Magee JC, Colbert CM, Cristie BR. Active properties of neuronal dendrites. Annu Rev Neurosci. 1996;19:165–186. doi: 10.1146/annurev.ne.19.030196.001121. [DOI] [PubMed] [Google Scholar]
- Khavandgar et al., 2005.Khavandgar S, Walter JT, Sageser K, Khodakhah K. Kv1 channels selectively prevent dendritic hyperexcitability in Purkinje cells. J Physiol (Lond) 2005;569:545–557. doi: 10.1113/jphysiol.2005.098053. [DOI] [PMC free article] [PubMed] [Google Scholar]
- Kim and Connors, 1993.Kim HG, Connors BW. Apical dendrites of the neocortex: correlation between sodium- and calcium-dependent spiking and pyramidal cell morphology. J Neurosci. 1993;13:5301–5311. doi: 10.1523/JNEUROSCI.13-12-05301.1993. [DOI] [PMC free article] [PubMed] [Google Scholar]
- Lev-Ram et al., 1992.Lev-Ram V, Miyakawa H, Lasser-Ross N, Ross WN. Calcium transients in cerebellar Purkinje neurons evoked by intracellular stimulation. J Neurophysiol. 1992;68:1167–1177. doi: 10.1152/jn.1992.68.4.1167. [DOI] [PubMed] [Google Scholar]
- Lisberger and Fuchs, 1978.Lisberger SG, Fuchs AF. Role of primate flocculus during rapid behavioral modification of vestibuloocular reflex. I. Purkinje cell activity during visually guided horizontal smooth-pursuit eye movements and passive head rotation. J Neurophysiol. 1978;41:733–763. doi: 10.1152/jn.1978.41.3.733. [DOI] [PubMed] [Google Scholar]
- Llinas and Sugimori, 1980a.Llinas R, Sugimori M. Electrophysiological properties of in vitro Purkinje cell somata in mammalian cerebellar slices. J Physiol (Lond) 1980a;305:171–195. doi: 10.1113/jphysiol.1980.sp013357. [DOI] [PMC free article] [PubMed] [Google Scholar]
- Llinas and Sugimori, 1980b.Llinas R, Sugimori M. Electrophysiological properties of in vitro Purkinje cell dendrites in mammalian cerebellar slices. J Physiol (Lond) 1980b;305:197–213. doi: 10.1113/jphysiol.1980.sp013358. [DOI] [PMC free article] [PubMed] [Google Scholar]
- Losonczy and Magee, 2006.Losonczy A, Magee JC. Integrative properties of radial oblique dendrites in hippocampal CA1 pyramidal neurons. Neuron. 2006;50:291–307. doi: 10.1016/j.neuron.2006.03.016. [DOI] [PubMed] [Google Scholar]
- Marple-Horvat et al., 1998.Marple-Horvat DE, Criado JM, Armstrong DM. Neuronal activity in the lateral cerebellum of the cat related to visual stimuli at rest, visually guided step modification, and saccadic eye movements. J Physiol (Lond) 1998;506:489–514. doi: 10.1111/j.1469-7793.1998.489bw.x. [DOI] [PMC free article] [PubMed] [Google Scholar]
- Marr, 1969.Marr D. A theory of cerebellar cortex. J Physiol (Lond) 1969;202:437–470. doi: 10.1113/jphysiol.1969.sp008820. [DOI] [PMC free article] [PubMed] [Google Scholar]
- Martina et al., 2000.Martina M, Vida I, Jonas P. Distal initiation and active propagation of action potentials in interneuron dendrites. Science. 2000;287:295–300. doi: 10.1126/science.287.5451.295. [DOI] [PubMed] [Google Scholar]
- Martinez et al., 1971.Martinez FE, Crill WE, Kennedy TT. Electrogenesis of cerebellar Purkinje cell responses in cats. J Neurophysiol. 1971;34:348–356. doi: 10.1152/jn.1971.34.3.348. [DOI] [PubMed] [Google Scholar]
- Mauk et al., 1998.Mauk MD, Garcia KS, Medina JF, Steele PM. Does cerebellar LTD mediate motor learning? Toward a resolution without a smoking gun. Neuron. 1998;20:359–362. doi: 10.1016/s0896-6273(00)80978-2. [DOI] [PubMed] [Google Scholar]
- Miles et al., 1980.Miles FA, Fuller JH, Braitman DJ, Dow BM. Long-term adaptive changes in primate vestibuloocular reflex. III. Electrophysiological observations in flocculus of normal monkeys. J Neurophysiol. 1980;43:1437–1476. doi: 10.1152/jn.1980.43.5.1437. [DOI] [PubMed] [Google Scholar]
- Mittmann et al., 2005.Mittmann W, Koch U, Hausser M. Feed-forward inhibition shapes the spike output of cerebellar Purkinje cells. J Physiol (Lond) 2005;563:369–378. doi: 10.1113/jphysiol.2004.075028. [DOI] [PMC free article] [PubMed] [Google Scholar]
- Miyakawa et al., 1992.Miyakawa H, Lev-Ram V, Lasser-Ross N, Ross WN. Calcium transients evoked by climbing fiber and parallel fiber synaptic inputs in guinea pig cerebellar Purkinje neurons. J Neurophysiol. 1992;68:1178–1189. doi: 10.1152/jn.1992.68.4.1178. [DOI] [PubMed] [Google Scholar]
- Napper and Harvey, 1988.Napper RM, Harvey RJ. Number of parallel fiber synapses on an individual Purkinje cell in the cerebellum of the rat. J Comp Neurol. 1988;274:168–177. doi: 10.1002/cne.902740204. [DOI] [PubMed] [Google Scholar]
- Nettleton and Spain, 2000.Nettleton JS, Spain WJ. Linear to supralinear summation of AMPA-mediated EPSPs in neocortical pyramidal neurons. J Neurophysiol. 2000;83:3310–3322. doi: 10.1152/jn.2000.83.6.3310. [DOI] [PubMed] [Google Scholar]
- Oakley et al., 2001.Oakley JC, Schwindt PC, Crill WE. Dendritic calcium spikes in layer 5 pyramidal neurons amplify and limit transmission of ligand-gated dendritic current to soma. J Neurophysiol. 2001;86:514–527. doi: 10.1152/jn.2001.86.1.514. [DOI] [PubMed] [Google Scholar]
- Ogawa et al., 1981.Ogawa T, Ito S, Kato H. Membrane characteristics of visual cortical neurons in in vitro slices. Brain Res. 1981;226:315–319. doi: 10.1016/0006-8993(81)91105-7. [DOI] [PubMed] [Google Scholar]
- Palay and Chan-Palay, 1974.Palay SL, Chan-Palay V. Cerebellar cortex. Berlin: Springer; 1974. [Google Scholar]
- Ramon y Cajal, 1904.Ramon y Cajal S. Textura del Sistema Nervioso del Hombre y los Vertebrados. Madrid: Moya; 1904. [Google Scholar]
- Ramon y Cajal, 1911.Ramon y Cajal. Histologie du systeme nerveux de l'homme et des vertebres. Paris: Maloine; 1911. [Google Scholar]
- Rancz and Hausser, 2006.Rancz EA, Hausser M. Dendritic calcium spikes are tunable triggers of cannabinoid release and short-term synaptic plasticity in cerebellar Purkinje neurons. J Neurosci. 2006;26:5428–5437. doi: 10.1523/JNEUROSCI.5284-05.2006. [DOI] [PMC free article] [PubMed] [Google Scholar]
- Regan, 1991.Regan LJ. Voltage-dependent calcium currents in Purkinje cells from rat cerebellar vermis. J Neurosci. 1991;11:2259–2269. doi: 10.1523/JNEUROSCI.11-07-02259.1991. [DOI] [PMC free article] [PubMed] [Google Scholar]
- Rowland and Jaeger, 2005.Rowland NC, Jaeger D. Coding of tactile response properties in the rat deep cerebellar nuclei. J Neurophysiol. 2005;94:1236–1251. doi: 10.1152/jn.00285.2005. [DOI] [PubMed] [Google Scholar]
- Sakurai, 1990.Sakurai M. Calcium is an intracellular mediator of the climbing fiber in induction of cerebellar long-term depression. Proc Natl Acad Sci USA. 1990;87:3383–3385. doi: 10.1073/pnas.87.9.3383. [DOI] [PMC free article] [PubMed] [Google Scholar]
- Schiller et al., 1997.Schiller J, Schiller Y, Stuart G, Sakmann B. Calcium action potentials restricted to distal apical dendrites of rat neocortical pyramidal neurons. J Physiol (Lond) 1997;505:605–616. doi: 10.1111/j.1469-7793.1997.605ba.x. [DOI] [PMC free article] [PubMed] [Google Scholar]
- Schiller et al., 2000.Schiller J, Major G, Koester HJ, Schiller Y. NMDA spikes in basal dendrites of cortical pyramidal neurons. Nature. 2000;404:285–289. doi: 10.1038/35005094. [DOI] [PubMed] [Google Scholar]
- Spruston et al., 1995.Spruston N, Schiller Y, Stuart G, Sakmann B. Activity-dependent action potential invasion and calcium influx into hippocampal CA1 dendrites. Science. 1995;268:297–300. doi: 10.1126/science.7716524. [DOI] [PubMed] [Google Scholar]
- Stafstrom et al., 1984.Stafstrom CE, Schwindt PC, Crill WE. Repetitive firing in layer V neurons from cat neocortex in vitro. J Neurophysiol. 1984;52:264–277. doi: 10.1152/jn.1984.52.2.264. [DOI] [PubMed] [Google Scholar]
- Stone and Lisberger, 1990.Stone LS, Lisberger SG. Visual responses of Purkinje cells in the cerebellar flocculus during smooth-pursuit eye movements in monkeys. I. Simple spikes. J Neurophysiol. 1990;63:1241–1261. doi: 10.1152/jn.1990.63.5.1241. [DOI] [PubMed] [Google Scholar]
- Stuart et al., 1997.Stuart G, Schiller J, Sakmann B. Action potential initiation and propagation in rat neocortical pyramidal neurons. J Physiol (Lond) 1997;505:617–632. doi: 10.1111/j.1469-7793.1997.617ba.x. [DOI] [PMC free article] [PubMed] [Google Scholar]
- Telgkamp et al., 2004.Telgkamp P, Padgett DE, Ledoux VA, Woolley CS, Raman IM. Maintenance of high-frequency transmission at purkinje to cerebellar nuclear synapses by spillover from boutons with multiple release sites. Neuron. 2004;41:113–126. doi: 10.1016/s0896-6273(03)00802-x. [DOI] [PubMed] [Google Scholar]
- Thach Jr, 1967.Thach WT., Jr Somatosensory receptive fields of single units in cat cerebellar cortex. J Neurophysiol. 1967;30:675–696. doi: 10.1152/jn.1967.30.4.675. [DOI] [PubMed] [Google Scholar]
- Thach, 1968.Thach WT. Discharge of Purkinje and cerebellar nuclear neurons during rapidly alternating arm movements in the monkey. J Neurophysiol. 1968;31:785–797. doi: 10.1152/jn.1968.31.5.785. [DOI] [PubMed] [Google Scholar]
- Thach, 1970.Thach WT. Discharge of cerebellar neurons related to two maintained postures and two prompt movements. II. Purkinje cell output and input. J Neurophysiol. 1970;33:537–547. doi: 10.1152/jn.1970.33.4.537. [DOI] [PubMed] [Google Scholar]
- Udo et al., 1981.Udo M, Matsukawa K, Kamei H, Minoda K, Oda Y. Simple and complex spike activities of Purkinje cells during locomotion in the cerebellar vermal zones of decerebrate cats. Exp Brain Res. 1981;41:292–300. doi: 10.1007/BF00238886. [DOI] [PubMed] [Google Scholar]
- Usowicz et al., 1992.Usowicz MM, Sugimori M, Cherksey B, Llinas R. P-type calcium channels in the somata and dendrites of adult cerebellar Purkinje cells. Neuron. 1992;9:1185–1199. doi: 10.1016/0896-6273(92)90076-p. [DOI] [PubMed] [Google Scholar]
- Viana et al., 1995.Viana F, Bayliss DA, Berger AJ. Repetitive firing properties of developing rat brainstem motoneurones. J Physiol (Lond) 1995;486:745–761. doi: 10.1113/jphysiol.1995.sp020850. [DOI] [PMC free article] [PubMed] [Google Scholar]
- Walter et al., 2006.Walter JT, Alvina K, Womack MD, Chevez C, Khodakhah K. Decreases in the precision of Purkinje cell pacemaking cause cerebellar dysfunction and ataxia. Nat Neurosci. 2006;9:389–397. doi: 10.1038/nn1648. [DOI] [PubMed] [Google Scholar]
- Womack et al., 2004.Womack MD, Chevez C, Khodakhah K. Calcium-activated potassium channels are selectively coupled to P/Q-type calcium channels in cerebellar Purkinje neurons. J Neurosci. 2004;24:8818–8822. doi: 10.1523/JNEUROSCI.2915-04.2004. [DOI] [PMC free article] [PubMed] [Google Scholar]
- Yoon et al., 1993.Yoon KW, Covey DF, Rothman SM. Multiple mechanisms of picrotoxin block of GABA-induced currents in rat hippocampal neurons. J Physiol (Lond) 1993;464:423–439. doi: 10.1113/jphysiol.1993.sp019643. [DOI] [PMC free article] [PubMed] [Google Scholar]
- Yuste and Tank, 1996.Yuste R, Tank DW. Dendritic integration in mammalian neurons, a century after Cajal. Neuron. 1996;16:701–716. doi: 10.1016/s0896-6273(00)80091-4. [DOI] [PubMed] [Google Scholar]