

Abstract
The basal ganglia (BG) have long been implicated in both motor function and dysfunction. It has been proposed that the BG form a centralized action selection circuit, resolving conflict between multiple neural systems competing for access to the final common motor pathway. We present a new spiking neuron model of the BG circuitry to test this proposal, incorporating all major features and many physiologically plausible details. We include the following: effects of dopamine in the subthalamic nucleus (STN) and globus pallidus (GP), transmission delays between neurons, and specific distributions of synaptic inputs over dendrites. All main parameters were derived from experimental studies. We find that the BG circuitry supports motor program selection and switching, which deteriorates under dopamine-depleted and dopamine-excessive conditions in a manner consistent with some pathologies associated with those dopamine states. We also validated the model against data describing oscillatory properties of BG. We find that the same model displayed detailed features of both γ-band (30–80 Hz) and slow (∼1 Hz) oscillatory phenomena reported by Brown et al. (2002) and Magill et al. (2001), respectively. Only the parameters required to mimic experimental conditions (e.g., anesthetic) or manipulations (e.g., lesions) were changed. From the results, we derive the following novel predictions about the STN–GP feedback loop: (1) the loop is functionally decoupled by tonic dopamine under normal conditions and recoupled by dopamine depletion; (2) the loop does not show pacemaking activity under normal conditions in vivo (but does after combined dopamine depletion and cortical lesion); (3) the loop has a resonant frequency in the γ-band.
Keywords: neural network, action selection, dopamine, oscillations, subthalamic nucleus, globus pallidus
Introduction
Work from numerous fields is converging on the hypothesis that one function of the basal ganglia (BG) is the selection of motor programs (Chevalier and Deniau, 1990; Mink and Thach, 1993; Hikosaka et al., 2000). A more specific hypothesis is that the BG are a critical neural substrate in the vertebrate action selection system, resolving conflict between multiple neural command centers trying to access the final common motor pathway (Prescott et al., 1999; Redgrave et al., 1999). A range of computational modeling work, from our laboratory (Gurney et al., 2001b; Humphries and Gurney, 2002) and others (Beiser and Houk, 1998; Frank, 2005), has demonstrated results consistent with the selection hypotheses. Previous models have abstracted much biological detail by using either population-level representations or mean firing rate elements throughout. As such, no existing model makes contact with the substantial body of work detailing the firing properties of BG neurons (Bevan et al., 2002; Boraud et al., 2005). To address this, we recast the Gurney et al. (2001b) model with populations of more realistic “spiking neurons.”
This strategy allowed us to study the prevalent issue of the oscillations that characterize neural activity of the BG in both motor disorders and motor control (Boraud et al., 2005). Many oscillatory phenomena occur in the subthalamic nucleus (STN) and the globus pallidus (GP), whose neurons are reciprocally connected (Bevan et al., 2002). Prominent γ-band (30–80 Hz) oscillations have been found in local-field potential (LFP) recordings in the BG of both awake and anesthetized animals, including humans (Brown et al., 2001; Berke et al., 2004; Magill et al., 2004b). Their absence in the BG of Parkinson's disease patients (Brown et al., 2001) and increase in power during motor activity (Brown et al., 2002; Cassidy et al., 2002) suggests that γ-band oscillations are intimately related to normal motor behavior (MacKay, 1997). However, despite the anatomically identified feedback loop formed between STN and GP, the two nuclei seem decoupled in the healthy BG (Magill et al., 2000; Raz et al., 2000; Urbain et al., 2000; Baufreton et al., 2005). For example, slow (<1 Hz) cortical oscillatory activity is reflected in STN neuron output but not transmitted to GP neurons, except when dopamine has been depleted, yet, after removing both cortex and dopamine, some residual slow oscillatory activity remains in both nuclei (Magill et al., 2001). Such data seem at odds with hypotheses for the role of the STN–GP loop in motor program selection (Berns and Sejnowski, 1996; Bevan et al., 2002; Rubchinsky et al., 2003).
The purpose of the present study was to generate a new spiking neuron model of the principal intrinsic connections of the motor BG, test its capacity as an action selection mechanism, study its oscillatory properties, and assess them against relevant biological datasets. We therefore validated the model against experimental studies by Brown et al. (2002) and Magill et al. (2001) on γ-band and slow oscillatory phenomena, respectively. When possible, parameter values were derived from experimental studies. Furthermore, in all simulations, the majority of the parameter values were unchanged: only those required to emulate the experimental conditions were changed. We also sought to use the results of the model to propose underlying neural mechanisms for the oscillatory phenomena.
Parts of this work have been published previously in abstract form (Humphries et al., 2004; Gurney et al., 2005).
Materials and Methods
The model
We base our model on the biologically informed functional anatomy of the BG proposed by Gurney et al. (2001a), which is depicted in Figure 1. When possible, all anatomical and physiological data used to constrain the model have been derived from rat-based studies, and so we use rat-brain terminology throughout. The nuclei and connectivity we incorporate follow current views of BG organization (for example, see Bolam et al., 2000), which we itemize as follows.
Figure 1.

Functional anatomy of the BG. Excitatory glutamatergic cortical input drives cells in the two input nuclei of the BG, the striatum and the STN. The GABAergic striatal projection neurons can be subdivided into two populations on the basis of the dominant dopamine receptor type (D1 or D2 type) that modulates their firing (see Materials and Methods). The D1-dominant cells predominantly send inhibitory projections to the output nuclei, the SNr (shown here) and the EP nucleus (the model presented includes only the SNr, because the two nuclei are similar with respect to their intra-BG connections). These GABAergic cells in turn send tonic inhibitory output to their targets in the thalamus and brainstem. It is the removal of this tonic inhibition that is thought to signal the selection of an action; hence, the combination of striatal D1 cells and the output nuclei are termed the selection pathway. The inset box shows the proposed off-center, on-surround network formed by this pathway, with hypothetical activity of the channel populations. The D2-dominant cells of the striatum send inhibitory projections to the GABAergic cells of the GP; the GP cells in turn send inhibitory projections to the STN and SNr/EP and are a source of control signals for the basal ganglia (hence, this circuit is termed the control pathway). Glutamatergic cells of the STN send excitatory projections to the GP and the SNr/EP, contributing to both the tonic activity of the SNr/EP cells and the activity within the control pathway.
(1) The striatum is considered the principal input nucleus of the BG, receiving extensive input from most cortical regions (Gerfen and Wilson, 1996; Glynn and Ahmad, 2002) and thalamic nuclei (Smith et al., 2004). GABAergic projection neurons comprise ∼95% of the neuron population in striatum (Gerfen and Wilson, 1996).
(2) The STN forms the other primary input nucleus of the BG and also receives input from cortex and some thalamic nuclei. Only one neuron type is known to exist in STN, and all cells are glutamatergic and project outside of the nucleus (Temel et al., 2005).
(3) Both striatum and STN projection neurons send axons to GP and the output nuclei of the BG, the substantia nigra pars reticulata (SNr), and the entopeduncular (EP) nucleus (Bolam et al., 2000).
(4) The GP neurons are GABAergic and project to the STN (so that STN and GP form a closed loop) and to the output nuclei (Smith et al., 1998).
(5) The GABAergic cells of the output nuclei contact numerous thalamic nuclei and brainstem structures (Bolam et al., 2000).
(6) The partition of the striatum into two projection neuron populations based on their dominant dopamine receptor type (D1 or D2 type) (Bolam et al., 2000) is maintained in the current model. Significant evidence exists for the colocalization of these receptors in some or all of the projection neurons (Surmeier et al., 1996; Aizman et al., 2000). However, many converging lines of evidence from electrophysiology (Gonon, 1997; Kaneda et al., 2002; West and Grace, 2002), microdialysis (O'Connor, 1998), mRNA transcription (Gerfen et al., 1990; Murer et al., 2000), and lesion (Sano et al., 2003) studies suggest a functional split between D1- and D2-dominant projection neurons and, furthermore, that the D1-dominant neurons project to SNr/EP and the D2-dominant neurons project to GP.
(7) A central concept governing the organization of BG connectivity is the existence of parallel anatomical loops running throughout the BG nuclei (Alexander et al., 1986; Middleton and Strick, 2000). Furthermore, a distinction can be made between macroscopic and microscopic channels. Macroscopic channels are formed by closed send-and-return loops running in parallel, each originating from an identified cortical area, passing through the BG, and returning to the originating cortical area via thalamus (Alexander et al., 1986). [These loops are also open in the sense that projections from different cortical areas converge on the same locations in striatum (Romanelli et al., 2005) and that there may be a hierarchy of the loops created by interconnections within the BG (Joel and Weiner, 2000; Haber, 2003)]. Recent trans-neuronal tracing data are consistent with at least 10 such channels within the BG output nuclei (Middleton and Strick, 2000), although it is not clear to what extent they are sustained within the BG intrinsic circuitry. Some authors are content to divide the BG intrinsic circuitry into three parallel domains (Joel and Weiner, 2000), following a rough subdivision of the striatum into motor, associative, and limbic territories, based on the send-and-return loops of whole cortical regions (respectively, motor cortices and the division of prefrontal cortices into associative and limbic areas).
Microscopic channels are discrete parallel loops running within a macroscopic channel. For example, the somatotopic map found within the striatal motor territory is maintained throughout the BG intrinsic circuitry, such that there are separate channels for arm, leg, and face representations (Alexander and Crutcher, 1990; Romanelli et al., 2005). Similar topographic maps have been proposed for the other macroscopic channels (Alexander and Crutcher, 1990). Moreover, within these limb representations, there may be additional discrete channels corresponding to particular movements, demonstrated in striatum by microstimulation (Alexander and DeLong, 1985) and markers for metabolic activity during behavior (Brown and Sharp, 1995), and/or to detailed body map locations (Brown et al., 1998). We model here such microscopic channels, each channel representing a different putative action (Redgrave et al., 1999; Gurney et al., 2001a). Anatomically, the channels in striatum and STN are defined by the regional extent of the topographically fragmented input from distinct representations in cortex to these areas and the channels in GP and the output nuclei by their corresponding striatal afferents.
(8) We proposed that the amount of activation in each channel at the level of the striatum effectively represents the relative “salience” or urgency of the action currently represented at that striatal location (Redgrave et al., 1999). In the oculomotor loop, for example, the activity in striatum at a particular retinotopic coordinate directly encodes the relative probability of a saccade being made to that coordinate (Hikosaka et al., 2000).
(9) SNr and EP maintain a tonic inhibitory output over their target structures in thalamus and brainstem. Selection of an action is then encoded by suppression of the appropriate neural population (output “channel”) in SNr/EP, resulting in selective disinhibition of basal ganglia output targets (Chevalier et al., 1985; Chevalier and Deniau, 1990).
(10) Within the BG, there are many candidate mechanisms with the capacity for selection. At the internucleus level, we included in our model the circuit comprising the output nuclei (represented by the SNr), onto which focused inhibition from D1-dominant striatal projection neurons is superimposed on diffuse excitation from the STN. This basic scheme was that proposed by Mink and Thach (1993) and Nambu et al. (2002) and developed quantitatively by Gurney et al. (2001a,b). This circuit represents an off-center, on-surround feedforward network (its hypothetical operation is illustrated in Fig. 1). In principle, sufficient focused inhibition from striatum (from the channel with the most salient input) will inhibit the corresponding output channel, resulting in the disinhibition of the targets of that channel. At the same time, diffuse excitation from STN could increase the tonic inhibitory output from the other output channels, enhancing the contrast between selected and nonselected channels. We therefore refer to the circuit formed by the D1-dominant striatum, STN, and SNr as the “selection pathway.”
(11) However, to achieve the correct balance between excitation and inhibition in the selection pathway, excitation from STN needs to be regulated by inhibition from GP. Our simulation and analysis of a population-level BG model showed that the circuit comprising D2-dominant striatal projection neurons, STN, and GP provided the required amount of inhibition to enable signal selection and switching (Gurney et al., 2001b). We thus termed this circuit the “control pathway.” This alternative functional architecture (selection and control pathways) contrasts with the then prevailing qualitative model of basal ganglia anatomy that dissects the system into “direct” and “indirect” pathways (Albin et al., 1989).
(12) In the present study, we are primarily interested in the tonic function of dopamine, associated with pacemaker-like firing in substantia nigra pars compacta (SNc) (Grace, 2002). Thus, we do not include mechanisms for modeling phasic dopamine release by SNc (or the ventral tegmental area) (Schultz, 1998; Dommett et al., 2005), which appears necessary for learning in reinforcement-based contexts. However, because the control of tonic SNc firing by intrinsic basal ganglia connectivity is comparatively poorly understood, we omitted SNc input as a substantive part of the model and incorporate levels of tonic dopamine as a control variable. The effects of dopamine on synaptic transmission are modeled for striatum, STN, and GP. We specifically include effects in STN and GP because of the noted changes in coupling between these nuclei after experimental manipulations that alter tonic dopamine (Magill et al., 2001; Baufreton et al., 2005).
The selection/control BG architecture just described is consistent across the so-called “motor” and “association” macroscopic channels of the BG (Joel and Weiner, 2000) but not, on current evidence, with the “limbic” channel that receives input from prefrontal cortex and outputs from ventral pallidum, without an obvious selection/control pathway distinction. Nonetheless, parts of what may be considered limbic BG, including the nucleus accumbens, have a circuitry remarkably similar to that depicted in Figure 1 (Maurice et al., 1997). Thus, although we specifically restrict our attention here to the selection of motor-based actions, it is conceivable that the same circuitry could cover the spectrum of selection functions, from individual limb movements to cognitive processes (Houk and Wise, 1995; Middleton and Strick, 2000).
Model architecture
Each BG component of the functional anatomy in Figure 1 defines a neuron population in the model (five populations in all). For all simulations reported in this paper, we used N = 3 channels, each with n = 64 neurons per channel, making a total of 192 neurons per population. We denote these populations by the sets Ωs1 (D1-dominant striatum), Ωs2 (D2-dominant striatum), ΩT (STN), ΩG (GP), and ΩO (SNr). The notation i ∈ ΩO thus means a neuron i in the SNr population, and membership is similarly defined for the other populations.
The channels were assumed to form adjacent neural subpopulations within each of these larger populations. The comparatively small number of neurons in this model was chosen for computational tractability, but this prevented a veridical representation of neuronal population ratios. Therefore, to model the funneling of connections from the relatively large striatal neuron population to its smaller efferent nuclei (Oorschot, 1996), we used large striatal connection weights to emulate the effect of the massive striatal convergence on its target neurons.
Internucleus and intranucleus connectivity was defined stochastically. For most internucleus connections, the potential target neurons were sampled from within the same channel as the afferent neuron. For such connectivity, each neuron in an afferent structure contacted every neuron in the same channel of a target structure with probability ρc, given in Table 1. The exception was STN output, which sampled potential target neurons across all channels in GP and SNr, modeling the relatively diffuse nature of its axon collateralization (Parent and Hazrati, 1995). To ensure comparable mean numbers of efferents across all nuclei, the probability of each STN neuron making contact with one in its target structures was set to ρb = ρc/N.
Table 1.
General parameter values
| τampa = 2 ms |
| τgabaa = 3 ms |
| τnmda = 100 ms |
| Vampa = Vgabaa = 3 mV |
| Vnmda = 0.1 mV |
| δabs = 2 ms |
| η = 0.5 |
| Vlim = −20 mV |
| ρc = 0.25 |
In some experiments, we modeled SNr and GP local axon collaterals (Deniau et al., 1982; Kita and Kitai, 1991). These also sampled potential target neurons across all channels within the same structure, including the parent channel of the neuron in question. This is consistent with the dense local axon collateralization in close proximity to the parent neuron within these structures (Mailly et al., 2003; Sadek et al., 2005): because we modeled channels as adjacent subpopulations, we expected that the local collaterals would extend across all channels. Once again, the probability of making a connection with a target in this diffuse projection scheme was ρb. Each internucleus and intranucleus connection was assigned a transmission delay taken from published data (see Table 3).
Table 3.
Connection parameters
| Connection | Parameter | Source |
|---|---|---|
| Cortex–D1 | td = 10 ms | Gerfen and Wilson (1996) |
| Cortex–D2 | td = 10 ms | Gerfen and Wilson (1996) |
| Cortex–STN | td = 2.5 ms | Fujimoto and Kita (1993) |
| D1–SNr | td = 4 ms | Nakanishi et al. (1987) |
| |P(s)P(p)P(d)} = |0, 0, 1} | Somogyi et al. (1979); Williams and Faull (1985); von Krosigk et al. (1992) | |
| w = 4 | Oorschot (1996) | |
| D2–GP | td = 5 ms | Kita and Kitai (1991) |
| |P(s)P(p)P(d)} = |0.33, 0.33, 0.34} | Falls et al. (1983); Smith et al. (1998) | |
| w = 4 | Oorschot (1996) | |
| STN–SNr | td = 1.5 ms | Nakanishi et al. (1987) |
| STN–GP | td = 2 ms | Kita and Kitai (1991) |
| GP–STN | td = 4 ms | Fujimoto and Kita (1993) |
| |P(s)P(p)P(d)} = |0.3, 0.4, 0.3} | Parent and Hazrati (1995); Bevan et al. (1997) | |
| GP–GP | td = 1 ms | Estimate based on close proximity of cells |
| |P(s)P(p)P(d)} = |0.5, 0.5, 0} | Falls et al. (1983); Kita and Kitai (1994) | |
| GP–SNr | td = 3 ms | Nakanishi et al. (1991) |
| |P(s)P(p)P(d)} = |0.5, 0.5, 0} | Smith and Bolam (1989); von Krosigk et al. (1992) | |
| SNr–SNr | td = 1 ms | Estimate based on close proximity of cells |
| |P(s)P(p)P(d)} = |0.5, 0.5, 0} | No available data, so assumed to be distributed on target neurons as per GP local collaterals |
All weights were unity unless otherwise indicated.
Input to the model
Cortical input was emulated by generating spike trains with a given frequency f̄ spikes/s. The temporal distribution of cortical spikes has been shown to approximate that derived from a Poisson process in numerous experimental preparations and behavioral contexts (Dayan and Abbot, 2001). For simulations in which normal tonic firing of corticostriatal pyramidal neurons was required, interspike intervals (ISIs) were therefore generated from an exponential distribution with μ = 1/f̄ s, generating a spike train described by a Poisson process (within the temporal quantization determined by the simulation time step Δt).
For some experiment replications, we required simulations of cortical EEG slow-wave activity. The <1 Hz EEG wave corresponds to alternating periods of silence and an active phase of synchronized tonic firing of cortical pyramidal cells in both anesthetized and sleeping animals (Steriade et al., 1993; Amzica and Steriade, 1995; Steriade et al., 2001). During slow-wave sleep, these cells fire at an overall mean rate of ∼12 spikes/s (Steriade et al., 2001). This implies that the active phase had a mean rate of at least 24 spikes/s during slow-wave sleep. Given that urethane and ketamine anesthesia result in a greater amplitude <1 Hz cortical EEG oscillation than slow-wave sleep, we expect the corresponding active phase firing rate to be higher (Magill et al., 2001; Steriade et al., 2001). Moreover, action potentials fired during the active phase do not follow a Poisson process (Stern et al., 1997).
To emulate these data, cortical spike trains for all channels were constructed that alternated 0.5 s periods of silence with 0.5 s periods of regularly spaced spikes. For each spike train and for each firing period in that train, a spike frequency fs was selected from a Gaussian distribution with mean ± SD of 32 ± 6.7 spikes/s. Each spike was then “jittered” in time by 1/Δf, where Δf was drawn from a Gaussian distribution with mean ± SD of 0 ± 2.5fs (with any resulting coincident spikes removed). The resulting cortical input spike trains were not identical and yet non-Poisson (Stern et al., 1997).
Neuron models
We used leaky integrate-and-fire model neurons with additional mechanisms to capture, phenomenologically, key properties of each neuron species. The properties common to all of the neuron models are detailed here: additional components required for each neuron species are described in the Appendix. In general, the neuron membrane potential Vm is given by
 |
where R is the neuron input resistance, I(t) is a sum of various current sources (including synaptic sources), and τm is the membrane time constant.
A spike is generated when the membrane potential reaches some threshold. To model the repolarization of the neuron, Vm is immediately set to the resting potential Vr after a spike event. With no driving current in Equation 1, Vr = 0; this shift of the resting potential to a convenient value has no functional consequences for the model. We force an absolute refractory period by stopping the solution of Equation 1 for a period δabs after spike generation.
To model the postsynaptic current (PSC) contribution made to the membrane potential Vm by a single synaptic event, I(t) will contain a contribution Is(t), defined by a suitably weighted kernel function F(·):
Here, tf is the time of the presynaptic spike generation, and td is the transmission time delay.
The weighting in Equation 2 is conveniently divided into two factors w and Îs. The latter is the step change in synaptic current caused by a presynaptic spike and therefore could be deduced from the amplitude of the appropriate recorded PSC. However, most synaptic events are recorded as postsynaptic potentials (PSPs) in the whole-cell membrane potential. We therefore fix Îs so that a single postsynaptic spike event (with w = 1) produces a peak PSP, constrained by data from the literature (see Table 1). The term w is a dimensionless weighting factor that allows us to use each model synapse to represent multiple physical synapses.
The kernel function F(·) is a step followed by an exponential decay (Gerstner, 1999), which is a simple fit to recorded PSCs:
where H(x) is the Heaviside step function [H(x) = 0 for x < 0 and H(x) = 1 otherwise], and τs is the synaptic time constant (a measure of the characteristic duration of the PSC).
We model the three functionally predominant types of synaptic currents in basal ganglia: fast EPSCs and IPSCs attributable to AMPA and GABAA receptors and slow EPSCs attributable to NMDA receptors. [For simplicity, we consider only direct synaptic actions of glutamate and GABA and omit GABAB receptors in the present model: postsynaptic activation of these receptors induces a intracellular signaling cascade rather than a synaptic PSC (Bormann, 1988).] These give rise to synaptic currents Iampa(t), Igabaa(t), and Inmda(t), respectively, with associated peak PSPs of Vampa, Vgabaa, and Vnmda. For each of the synaptic types modeled, we have separate synaptic time constants (τampa, τgabaa, and τnmda). (This is a simplistic model of the NMDA receptor-evoked current, omitting both its short rise time, as is often done, and its voltage-dependent threshold for activation.) The total synaptic current is then found by summing over all afferents and all postsynaptic events up to the current time t. For a generic synaptic type, with time constant τs, this is given by
 |
where Λ is the set of afferents to the target neuron, Γj is the set of firing times tf for afferent neuron j, and tjd is the transmission delay between j and the target neuron.
Synaptic efficacy is modulated by dopamine within the striatum, STN, and GP (for details of individual models, see the Appendix). We parameterize tonic dopamine concentration at D1 and D2 receptors by λD1 and λD2, respectively (with 0 ≤ λD1, λD2 ≤ 1). By separately parameterizing contributions to D1 and D2 receptors, we were able to mimic the effects of receptor-specific agonists and antagonists if required. Under normal conditions, λD1 = λD2.
An important determinant of synaptic efficacy is the relative location of the synapses on the postsynaptic membrane. Inhibitory synapses on proximal dendrites or on the soma are postulated to provide a strong shunting or “vetoing” inhibition effect that gates input from more distal dendritic sources (Blomfield, 1974; Shepherd and Brayton, 1987; Segev, 1995; Ulrich, 2003). That is, the effect of activating postsynaptic receptors at proximal or somatic synapses is more divisive than subtractive, thereby attenuating distally originating PSPs. The pattern of synapse location within the basal ganglia suggests that this mechanism may be important within STN, GP, and SNr.
To model the shunting effect of proximal and somatic inhibition, we adopt a phenomenological description, or “pseudocompartmental” scheme, similar to that used in our previous modeling study on oscillations in GP and STN (Humphries and Gurney, 2001). When shunting inhibition is present, our model contains three pseudocompartments, corresponding to distal and proximal dendrites and the soma. Synaptic input from each GABAergic afferent j is randomly assigned to one of these compartments with probabilities P(s), P(p), and P(d) (for somatic, proximal, and distal compartments, respectively). These probabilities are based on estimates from the literature for the relative proportions of GABAergic contacts within each zone of the target neuron species. The result is that, for any neuron, each of its GABAergic afferents are assigned to either a somatic Σ, a proximal Π, or a distal Δ compartment set.
Excitatory inputs within basal ganglia are supplied by STN neurons whose axon terminals mainly contact the distal dendrites of their target neurons in SNr and GP (Bevan et al., 1994; Shink et al., 1996). Excitatory inputs from cortex to STN and striatal projection neurons also mainly contact their distal dendrites (Chang et al., 1983; Bevan et al., 1995; Gerfen and Wilson, 1996). Thus, all excitatory afferents are effectively assigned to Δ for simplicity.
The distal synaptic current IiD going into the proximal compartment on neuron i is computed additively, as follows:
where each of the terms on the right side is given by an expression of the form of Equation 4 and where notation of j ∈ Δi limits the scope of afferent set Λ in Equation 4 to just those afferent GABAergic synapses that fall in the distal compartment.
One potential problem with a current source-based scheme and additive inhibition is that massive inhibition can hyperpolarize the membrane to biologically unobtainable values. This will also prevent subsequent excitation from working realistically. We therefore limit Vm from below by a threshold Vlim, which mimics the effect of the reversal potential ECl for chloride ions on GABA-elicited PSPs. ECl is typically −70 mV, with measured resting potentials of −50 mV. Therefore, under the shift of resting potential by 50 mV to give Vr = 0, Vlim was set to −20 mV.
We define the effects of shunting inhibition on the distal input in two variables hiP and hiS, for the contributions of proximal and somatic inhibition to the ith neuron, respectively. These take values in the interval [0,1], where a value of 0 indicates a complete veto of all input from the compartments more distant from the soma (a full definition is given in the Appendix). Shunting inhibition simultaneously forces the membrane potential toward the reversal potential associated with GABAA receptors, ECl (which, under the shift of resting potential Vr to 0, is equivalent to Vlim in the model). To model this, we introduce a constant current IiCl, which drives the membrane potential to Vlim if fully activated and which is gated by a variable Qih, which is dependent on hiP and hiS. Again, Qih takes a value in the interval [0,1], where a value of 1 indicates that IiCl is fully activated (see the Appendix).
Every neuron species has some form of constant input current, Ispon, which models the effect that intrinsic membrane currents have on spontaneous activity. Furthermore, all neuron models contain a noise term, which subsumes noise produced by several sources, including graded vesicle release and failure (Manwani and Koch, 1999). Noise is added at every time step as a voltage deflection of Vm sampled from a Gaussian distribution with mean ± SD of 0 ± 0.3 mV. Finally, it is occasionally useful to incorporate currents I*(t) that model specific time-varying phenomena. Specifically, we incorporate a piecewise approximation [labeled I*(t) = ICa] to the current activation sequence that underlies rebound burst firing in STN neurons (Beurrier et al., 1999) (we define this in the Appendix). Incorporating all contributions defined above, the membrane equation becomes (dropping index i for clarity)
 |
In the special case in which the neuron class does not have proximal or somatic inhibition, we have no need for the pseudocompartmental scheme and write
 |
where Is is the synaptic input. The basic membrane Equation 6 is adapted for each neuron species according to specific models of dopaminergic modulation and additional properties of those species. The adaptations are described in detail in the Appendix.
Modeling strategy
Models-as-animals.
We briefly address here the design of the numerical simulations reported in Results. The statistical properties of experimental data are dependent on both the number ND of data points collected and the manner in which the data points are collected. Experimental studies routinely pool cell recordings taken from different animals, and, if we are to compare the model and the data in a principled way, we need to replicate this data-gathering process. Our models are structurally stochastic, and so we advocate a “models-as-animals” approach in which each instantiation of the model is considered to represent a single animal. Then, for each experimental condition, we construct the same number of models NA as there were animals and collect nD observations (i.e., cells) from each neural structure in that condition, so that NAnD is as close to ND as possible (this will not necessarily be identical because automated postprocessing relies on uniform sampling). This constitutes a single “virtual experiment.” We then repeat this many times to determine the spread of data that the model predicts for each measured experimental variable.
In this way, we aim to generate results whose statistical properties are comparable with their experimental counterparts, thereby enabling statistically valid claims about the “fit” between the model and the data. This approach should be contrasted to that more commonly used method in which a single instantiation of a model is simulated, the appropriate model parameters altered to mimic the experimental manipulations, and all the outputs of all the cells in the model analyzed (additional discussion of these issues has been given by Humphries and Gurney, 2006).
Determination of parameter values.
Our BG model was explicitly intended as an in vivo network. Every parameter specific to a neuron species (e.g., R, τm) had an experimentally determined value, taken from in vivo studies in which those were available. The values and their literature sources are given in Table 2. General neuron parameters took biologically plausible values based on those presented previously (Dayan and Abbot, 2001) and are given in Table 1.
Table 2.
Population-specific parameters
| Nucleus | Parameter | Source |
|---|---|---|
| Striatum–D1/D2 | 〈R〉 = 42 MΩ | Jiang and North (1991); Flores-Hernandez et al. (1997) |
| 〈τm〉 = 25 ms | Bennott and Wilson (2000) | |
| θ = 30 mV | ||
| Idown = −0.25 nA | ||
| STN | 〈R〉 = 18 MΩ | Kita et al. (1983b) |
| 〈τm〉 = 6 ms | Kita et al. (1983b); Paz et al. (2005) | |
| θ = 20 mV | Beurrier et al. (1999, 2000) | |
| |α1, α2} = |0.5, 0.25} | Shen and Johnson (2000); Cragg et al. (2004) | |
| 〈θCa〉 = −10 mV | Beurrier et al. (1999); Song et al. (2000) | |
| 〈JCa〉 = 90 nA | Fitted to data from Beurrier et al. (1999); Bevan and Wilson (1999) | |
| 〈t1〉 = 200 ms | Beurrier et al. (1999); Bevan and Wilson (1999) | |
| 〈t2〉 = 1000 ms | Beurrier et al. (1999); Bevan and Wilson (1999) | |
| GP | 〈R〉 = 88 MΩ | Kita and Kitai (1991) |
| 〈τm〉 = 14 ms | Kita and Kitai (1991) | |
| θ = 30 mV | Cooper and Stanford (2000) | |
| |β1, β2} = |0.5, 0.5} | No data, but dopamine concentration in GP assumed to be less than striatum, hence βi < 1, i = 1, 2 | |
| SNr | 〈R〉 = 112 MΩ | Nakanishi et al. (1987, 1997) |
| 〈τm〉 = 8 ms | Nakanishi et al. (1987, 1997) | |
| θ = 30 mV | Atherton and Bevan (2005) |
Angle brackets indicate a mean value for a Gaussian distribution across that population with an SD of 10% of that mean value.
Moreover, we included potentially crucial biological detail often omitted by modelers. Any model that intends to study oscillatory or correlation phenomena must incorporate interneuronal transmission delays, because these critically determine the timing of spikes. In our model, every connection had a transmission delay with experimentally determined values. The distribution of synapses from each connection to the somatic, proximal, and distal pseudocompartments of a neuron species was also taken from the experimental literature. The delay values and synapse distributions, along with their literature sources, are given in Table 3.
Furthermore, to avoid spurious correlations and oscillations between neurons, critical parameter values within a neuron population were assigned stochastically. The resistance R and membrane time constant values τm for each member of a neuron population were sampled from a Gaussian distribution, with a mean given by the appropriate values in Table 2 and SD that was 10% of that mean value (giving a conservative, biologically plausible, coefficient of variation of ∼0.1). This ensured a sufficient range of all these parameters values so that neurons within the same structure did not fire identically for a given input (the burst-firing current parameters for STN neurons were similarly distributed).
The only model parameters that could not be assigned directly from experimental data (relative weighting of shunting inhibition and overall network connection density) were set at the outset and then not changed for any of the simulations reported here. Tonic input currents for STN, GP, and SNr neurons were set to give the approximate tonic firing rates for those nuclei that matched experimentally measured rates. This provided a baseline version of the model (see Results). The only parameters changed thereafter were those required to emulate the conditions of the experimental study we were simulating and are fully described in Results.
Data analysis
The firing rates of individual neuron outputs were computed by a moving-window average, using an α-function window of 10 ms width computed every 1 ms (Nawrot et al., 1999; Dayan and Abbot, 2001). Autocorrelograms were computed with 10 ms bins, following standard methods (Abeles, 1982; Dayan and Abbot, 2001). Power spectra were computed directly from the spike trains using the multi-taper spectrum method, which is particularly suitable for analyzing discrete point time series such as spike trains (Jarvis and Mitra, 2001). The Matlab (MathWorks, Natick, MA) toolbox Chronux, which implements multi-taper methods, is available from http://chronux.org/. Cortical pseudo-EEG oscillations were analyzed using the Lomb–Scargle periodogram (Scargle, 1982). All analysis functions, other than the Chronux toolbox, were custom written in Matlab.
Implementation
All simulations were implemented using Matlab and custom MEX-file components in C for efficiency. They were run on a Compusys cluster of dual Opteron servers. The code is available on request or from our website www.abrg.group.shef.ac.uk. All Vm equations were solved exactly (with the weak assumption that ICa is constant over a small time interval) and simulated in discrete time to catch all afferent spike arrival and neuron firing events. The simulation time step was Δt = 0.1 ms throughout.
Results
Tonic firing can be fitted from in vivo recordings of alert rats
The first step in using the model was to “calibrate” it so that its quiescent state gave realistic tonic firing rates. However, given the complexity of the model, it is not clear a priori if it is possible to fit the tonic rates to target data. The ability to do so therefore constitutes a result from the model.
The hypothesis concerning the role of the BG in action selection in the behaving animal is central to our work. We therefore chose to adopt a resting state consistent with data from non-anesthetized animals. Thus, target firing rates were taken from recordings in awake, resting rats of cells in STN (Kreiss et al., 1997), GP (Urbain et al., 2000), and SNr (Windels and Kiyatkin, 2004).
The calibration process consisted of varying the Ispon currents in each of STN, GP, and SNr while applying background cortical input consisting of low-frequency, unpatterned (Poisson series) spikes with a mean firing rate of f̄ = 3 spikes/s (Bauswein et al., 1989). Such a low rate is insufficient to cause reliable firing in striatum, consistent with numerous striatal recordings (Mahon et al., 2001, 2003). During this process, each simulation was run for 10 s. Mean firing rates were computed over the last 9 s to avoid the confounding effects of initial transients in model neuron output.
To compare the simulation output with experimentally determined quantities, we “recorded” five model neurons in each of STN, GP, and SNr, from each of 11 instantiations of the model that represented 11 “virtual animals” (see Materials and Methods). [The original experimental papers reporting the mean firing rates (Kreiss et al., 1997; Urbain et al., 2000; Windels and Kiyatkin, 2004) do not state the number of animals used, and so we assumed five cells from each animal, based on typical experimental protocols.] Each batch of 11 model simulations constituted a “virtual experiment,” which was repeated 50 times to get a measure of the spread of results we could expect using the given (real and simulated) protocol. Dopamine levels were set to λD1 = λD2 = 0.3 to simulate normal tonic dopamine concentration. These values were used throughout, except in simulations of experimental conditions with altered dopamine (see the following sections).
Figure 2A shows the mean firing rates for the model that included collaterals within SNr and GP, together with the mean rates derived from in vivo recordings. To gain a quantitative measure of how well the model fits the data, we ran a two-tailed independent-groups t test between the experimental data and each virtual experiment (50 t tests in all). For each of STN, GP, and SNr, the percentage of virtual experiments yielding mean tonic firing rates that were statistically indistinguishable (at p = 0.05) from the experimental data were 84, 92, and 40%, respectively.
Figure 2.

Mean tonic firing rates from STN, GP, and SNr neurons in the awake resting state of the simulated and real basal ganglia. The box-and-whisker plots summarize the distribution of mean firing rates across the 50 virtual experiments. The mean firing rates from the biological experimental data (see Results) are shown by the open circles, with error bars (thick lines) showing the 95% confidence interval for each mean value. A, Model with collaterals in SNr and GP. B, Model with no collaterals in SNr and GP. Both forms of the model were able to reliably capture the respective mean firing rate properties of these nuclei in the awake rat.
Figure 2B shows the corresponding results for a model with no local axon collaterals within SNr and GP (part of the program of work detailed in a later section). The percentages of nonsignificant t tests in this case was 60, 100, and 86%. With or without collaterals, the mean tonic firing rates of the model nuclei are mostly indistinguishable from the experimental data.
For the full model, with GP and SNr collaterals, the resulting values for the Ispon currents were as follows: for STN, Ii∈ΩTspon = 11 × 10−10 A; for GP, Ii∈ΩGspon = 3.8 × 10⁻¹⁰ A; and for SNr, Ii∈ΩOspon = 3.9 × 10⁻¹⁰ A. These values were used for all of the following simulations, except when noted below. Without collaterals in the GP and SNr, the resulting values for the Ispon currents were as follows: for STN, Ii∈ΩTspon = 9 × 10⁻¹⁰ A; for GP, Ii∈ΩGspon = 3 × 10⁻¹⁰ A; and for SNr, Ii∈ΩOspon = 3.4 × 10⁻¹⁰ A. These values were used for one batch of simulations detailed in the section below on slow-wave oscillations.
To minimize initial transients for future simulations, a complete snapshot of the state of the model, including membrane potential values and synaptic current totals, was recorded at the end of one of the simulations described here and was used as the initial conditions for all additional simulations.
Input signals are appropriately selected and switched between
We first established whether the model retained the capacity to support the functional hypothesis of action selection. To assess the selection and switching performance quantitatively, we followed the procedures used in our previous work (Gurney et al., 2001b), so that a direct comparison could be made with the population-level model described there. Thus, all simulations in this section used the following stimulus protocol. An input to channel 1 with mean firing rate f̄(1) was initiated at t = 1 s, followed at t = 2.5 s by an input to channel 2 with rate f̄(2); the simulation terminated at t = 5 s. This sequence gives three time intervals: I1 = [0, 1), I2 = [1, 2.5), and I3 = [2.5, 5]. The magnitude of each input represents the salience of the requested motor program: hence, the sequence used here tests the ability of the BG to select an action (at t = 1) and then to switch to a more salient action (at t = 2.5) but only if it is appropriate to do so.
The model was run with combinations of f̄(1), f̄(2), drawn from the range [4, 40] spikes/s with step-size 4 spikes/s, giving 10 values of each firing rate and 100 experiments in all. The set of 100 experiments was repeated with different levels of simulated tonic dopamine: λD1 = λD2 = 0, λD1 = λD2 = 0.3, and λD1 = λD2 = 1, corresponding to “low,” “normal,” and “high” levels of dopamine, respectively. However, because there was no specific experimental data with which to compare the model, only a single model was run under each condition. Selection was deemed to have taken place if the mean firing rate of an SNr channel was less than some threshold φs = 5 spikes/s, which signaled sufficient disinhibition (Chevalier and Deniau, 1990).
Figure 3 shows SNr output from three example simulations, one at each dopamine level, from a model that received inputs f̄(1) = 20 spikes/s and f̄(2) = 40 spikes/s. The output shown is the mean instantaneous firing rate across all neurons in a particular SNr channel. The first example is from the normal dopamine condition (Fig. 3A). During I1, all three channels show tonic firing in the quiescent state. After the onset of a salient input to channel 1 of the BG during I2, the mean output of SNr channel 1 falls below φs, and the mean output of the other channels increases above the original tonic level. Subsequently, after the onset of a more salient input to channel 2 of the BG during I3, the mean output of SNr channel 2 falls below φs, whereas, at the same time, the mean output of SNr channel 1 returns to a level above φs. Thus, the mean SNr outputs correctly signaled the selection of the most salient action and then correctly switched to the selection of a more salient action once it had become available. The histograms on the right of Figure 3 show the distributions of individual SNr neuron mean firing rates within channels 1 and 2. The changes in the distribution shape reflect the selection and switching process, yet they also show that not all neurons in a channel responded in the same manner, and a wide range of outputs were maintained although the mean output of the channel was signaling the correct response. This result highlights the difficulty of pinpointing the channel (loop) membership of an individual neuron from its firing properties alone.
Figure 3.
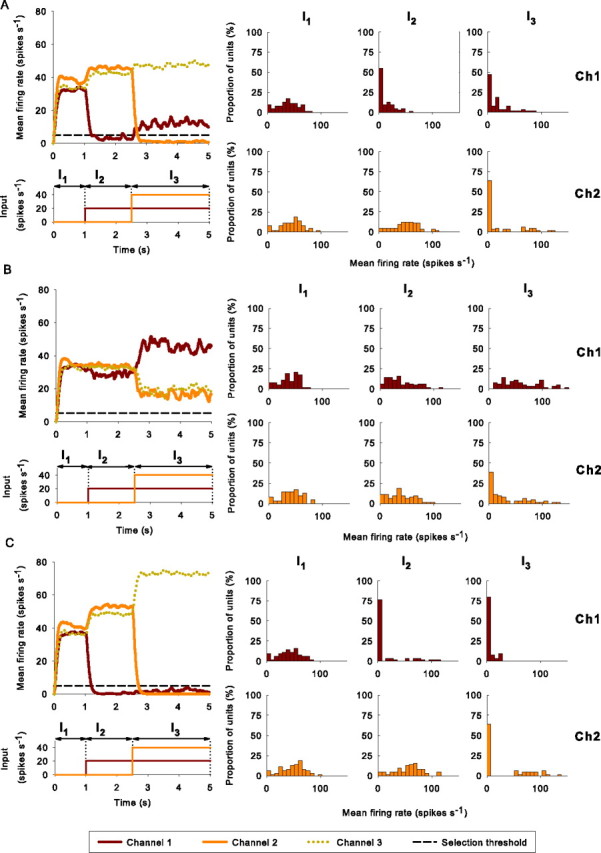
Examples of selection and switching under different levels of simulated dopamine. In each case, the large panel on the left shows the instantaneous mean firing rate for each SNr channel, obtained by averaging across every SNr neuron in the channel. Below this, the rectangular waveforms indicate mean firing rates of cortical inputs driving the corresponding channels in striatum and STN. The small panels on the right show histograms of individual mean firing rates of neurons in channel 1 (Ch1) and channel 2 (Ch2) during each time interval. These histograms thus show the affect on the whole channel population of each change in input. A, Normal levels of simulated tonic dopamine (λD1 = λD2 = 0.3). B, Low levels of simulated tonic dopamine (λD1 = λD2 = 0). C, High levels of simulated tonic dopamine (λD1 = λD2 = 0.8).
The second example, in Figure 3B, shows how low simulated dopamine typically results in no selection. Neither of the salient inputs to the BG is sufficient to cause SNr channel output to fall below φs. The distributions of the individual neuron firing rates change little in each time interval compared with the normal dopamine condition (in Fig. 3A), showing that the whole channel population did not have a clear response to the input. The third example, in Figure 3C, shows how high simulated dopamine can result in the simultaneous (here dual) selection of salient inputs. Both SNr channels 1 and 2 are selected in interval I3, because the output of SNr channel 1 did not rise above φs after the onset of salient input to channel 2 of the BG. This is reflected in the highly skewed distribution of individual mean firing rates for neurons in SNr channel 1 during I3. The outcome of all three example simulations closely matches the corresponding behavior of our previous population-level BG models (Gurney et al., 2001b) and corroborates the hypothetical selection mechanism discussed in Materials and Methods.
The outcome of each of the 100 experiments for each model was classified according to the mean SNr firing rate for channels 1 and 2 in intervals I2 and I3. Bearing in mind that selection of a channel is deemed to have occurred if the mean SNr firing rate of that channel is below the selection threshold φs, the following possibilities were recognized: (1) no selection: neither channel is ever selected in any interval (as in the example of Fig. 3B); (2) selection: a single channel is selected during the competition; that is, either channel 1 is selected in both intervals I2 and I3 and channel 2 is never selected, or channel 1 is never selected and channel 2 is selected in I3; (3) switching: channel 1 is selected in I2 and deselected in I3 with subsequent selection of channel 2 in I3 (as in the example of Fig. 3A); (4) dual selection: both channels are selected in I3 (as in the example of Fig. 3C); and (5) interference: all other cases.
A summary of the SNr output categorization across all tested input pairs for a single model under normal dopamine is shown in Figure 4A. The majority of input pairs resulted in successful resolution of the competition between the two channels, that is, single selection or switching. With smaller magnitude inputs, there was no selection (bottom left of grid). This behavior, corresponding to a filtering of low salience inputs, is primarily attributable to the existence of a down state of the striatal neurons, as modeled by the Idown current (see the Appendix). The cutoff of the selection filter is ∼16 Hz. These results closely match those of our previous population-level models (Gurney et al., 2001b, 2004b).
Figure 4.

Selection and switching capabilities of the basal ganglia model. Each simulation was assigned to a category based on its combination of mean SNr outputs on channel 1 and channel 2 in response to the inputs (see Results). A, Normal levels of tonic dopamine (DA) (λD1 = λD2 = 0.3). B, Low levels of simulated dopamine (λD1 = λD2 = 0.0). C, High levels of simulated dopamine (λD1 = λD2 = 0.8). D–F, Idealized templates for selection and switching under normal, low, and high dopamine levels, respectively (see Results). G, Box-and-whisker plots of the matches between a batch of 50 models and corresponding idealized selection templates, for each level of simulated dopamine.
We also tested the effects of both dopamine depletion and excess dopamine on the selection and switching of input signals. To simulate dopamine depletion, we set λD1 = λD2 = 0 and ran the same model used with normal dopamine levels. With low dopamine levels, no signal selection could occur, and no switching was observed (Fig. 4B). Again, these results replicate those of our population-level model (Gurney et al., 2001b). The implication of these results is that, after dopamine depletion, actions of low urgency are not selected by the basal ganglia.
To simulate excess dopamine, we set λD1 = λD2 = 0.8 and ran the same model again. Switching now rarely occurs: competition between salient inputs now most often results in dual-channel selection (Fig. 4C). This also replicates results from the population-level model (Gurney et al., 2001b).
To quantify how well the model performs in these experiments, we defined templates of the idealized outcomes for the selection competition under different dopaminergic conditions (Fig. 4D–F). These templates define different selection/switching regimens for a single-action selection mechanism that are under the control of dopamine. With normal tonic dopamine, the outcome for such an idealized selection mechanism is as follows: no selection if both inputs are less than the selection filter cutoff; selection of a single channel if its input is above the filter cutoff and the other channel has a filtered input; or, if both channel inputs are above the filter cutoff, switching to channel 2 after the onset of its input only if it has a higher salience than the input to channel 1. The result is the idealized template in Figure 4D. With all tonic dopamine depleted, the idealized outcome is no response to any salient input in the tested range (Fig. 4E). With high levels of tonic dopamine, the idealized outcome is either no selection if both inputs are less than the selection filter cutoff or dual selection otherwise (Fig. 4F): if both actions are salient, then no clear decision is made between them. [The rationale for these regimens and their construction has been discussed previously (Gurney et al., 2004b).]
The performance of a model over the set of 100 experiments with a particular level of dopamine may now be quantified by calculating its percentage match with the template (via the fraction of matching outcomes). This was done for 50 instantiated models (i.e., 50 sets of 100 experiments for each model), for each level of dopamine (low, normal, and high). There is a good match with each of the idealized templates for every tested model (Fig. 4G), showing that the model consistently performs appropriate selection and switching for the simulated level of tonic dopamine.
Cortical slow-wave activity and the STN–GP loop
We now validate the model by replicating detailed experimental data and derive novel predictions. A striking result from recent studies of the STN–GP loop is the demonstration of the role of dopamine in controlling the relative independence of the firing patterns of these nuclei (Magill et al., 2001) (see Fig. 7C,D). Under urethane anesthesia, most STN neurons show burst firing with an interburst frequency of ∼1 Hz. This low-frequency oscillation (LFO) is highly correlated with the cortical EEG slow wave, which also has a frequency of ∼1 Hz. GP neurons are not correlated with the cortical EEG and display no LFOs. Cortical ablation stops the LFOs in the STN but does not alter GP behavior. Thus, STN activity appears to be driven by cortex, but, contrary to intuition, the strong oscillation and changes in firing pattern are not transmitted to the GP, despite the direct excitatory pathway from STN to GP.
Figure 7.

Summary statistics of the response to cortical slow-wave oscillations in STN and GP across all four experimental conditions of Magill et al. (2001). Each of the experimental conditions is indicated by the numbers above the graph. Lesion results are indicated by diagonal patterned bars/boxes; ablation is indicated by “− ctx.” A, Mean firing rates; B, LFO percentages for the data and for single virtual experiments. Error bars are the SDs of the firing rate across the populations of neurons in each case. These are plotted so that distributions of the firing rates from both experimental study and virtual experiment can be compared. C, Mean firing rate; D, LFO percentage distributions for the entire batch of 50 virtual experiments compared with the experimental data. The corresponding values from the experimental data are indicated by the filled circles; for the mean firing rates, the 95% confidence interval of the mean are also shown by the thick lines (calculated from Magill et al., 2001).
After dopamine depletion (by 6-OHDA lesion of the SNc in otherwise intact animals), most GP neurons do show LFOs that are correlated with the cortical EEG slow wave. This suggests that some action of dopamine prevents cortical EEG slow-wave activity from being transmitted to the GP via the STN in the intact animal. (We particularly sought to investigate this phenomenon and, therefore, included in the model dopaminergic modulation of inputs to the STN and GP, as described in the Appendix.)
In addition, Magill et al. (2001) found that combining the ablation of cortex and the lesion of SNc left residual LFO activity in both STN and GP despite the absence of cortical input. This suggests the possible presence of a natural pacemaker circuit formed by STN and GP (Plenz and Kitai, 1999). The underlying mechanism for this pacemaker could take the form of that proposed by Humphries and Gurney (2001), which relies on GP-induced rebound bursting in STN; this proposal was therefore also investigated with the model.
Replication of these results also requires consideration of the role of anesthesia. The “baseline” state of the model described in the previous sections was constrained by data from awake, unrestrained rats. If the model is to explain the LFO phenomena, it must also match firing rates under urethane anesthesia. Recent work has shown that urethane acts to increase the efficacy of GABA synapses but decrease the efficacy of glutamate synapses (Hara and Harris, 2002). This was modeled by multiplying all inhibitory connection weights by 1.5 and all excitatory weights by 0.65, matching the effect magnitude reported previously (Hara and Harris, 2002). We also altered the spontaneous current in STN, Ii∈ΩTspon, to 5 × 10⁻¹⁰ A. These parameter values were determined by matching the mean firing rates of STN and GP cells in the control condition only (see below) to those reported previously (Magill et al., 2001). Alteration to Ii∈ΩTspon was necessary to achieve this match, because it was clear that urethane anesthesia alters the spontaneous activity of STN cells compared with awake animals [compare the experimental data from the awake rats (Fig. 2) with data from the anesthetized rats (see Fig. 7A, control condition)].
Four sets of simulations were run, emulating the design and manipulations of the four experimental conditions (Magill et al., 2001):
(1) The control condition included an intact cortex and basal ganglia: slow-wave input (see Materials and Methods) and λD1= λD2 = 0.3, representing normal tonic levels of dopamine. This condition had NA = 7 animals, sampling nD = 4 STN cells from each animal (giving a total of 28 STN cells), and nD = 3 GP cells from each animal (giving a total of 21 GP cells).
(2) The ablation condition included an ablated cortex and intact basal ganglia: corticostriatal weights set to 0 and dopamine parameters λD1= λD2 = 0.3. This condition had NA = 7 animals, sampling nD = 2 STN cells (giving a total of 14 STN cells), and nD = 4 GP cells (giving a total of 28 GP cells).
(3) The lesion condition included an intact cortex and SNc lesion: slow-wave input and with loss of tonic dopamine λD1= λD2 = 0. This condition had NA = 6 animals, sampling nD = 6 STN cells (giving a total of 36 STN cells), and nD = 5 GP cells (giving a total of 30 GP cells).
(4) The lesion-and-ablation condition included an ablated cortex and SNc lesion: corticostriatal weights set to 0 and λD1= λD2 = 0. This condition had NA = 6 animals, sampling nD = 3 STN cells (giving a total of 18 STN cells), and nD = 3 GP cells (giving a total of 18 GP cells).
All simulations were run for t = 10 s. Our analyses followed those performed by Magill et al. (2001) on their data. However, because we had no separate EEG per se, we created a pseudo-EEG for the cortical activity to enable computation of the spike-triggered averages. Because the cortical EEG corresponds to the synchronous activity of a large population of cortical neurons (Stern et al., 1997; Steriade et al., 2001), the pseudo-EEG for each simulation was constructed by finding the firing rate of each cortical spike train using a moving-window average (see Materials and Methods) and then averaging these firing rate reconstructions over all cortical inputs. Spike-triggered averages of the pseudo-EEG signal were then computed using a window of ±1 s from each spike.
The model replicates individual spike train properties from the experimental data
The two most striking, non-intuitive results of Magill et al. (2001) were the complete decoupling of STN and GP activity in the control condition and the presence of LFO activity in both nuclei in the combined lesion-and-ablation condition. In Figures 5 and 6, we show that the model can replicate the detailed firing properties of individual STN and GP neurons reported by Magill et al. (2001) in both of those conditions.
Figure 5.
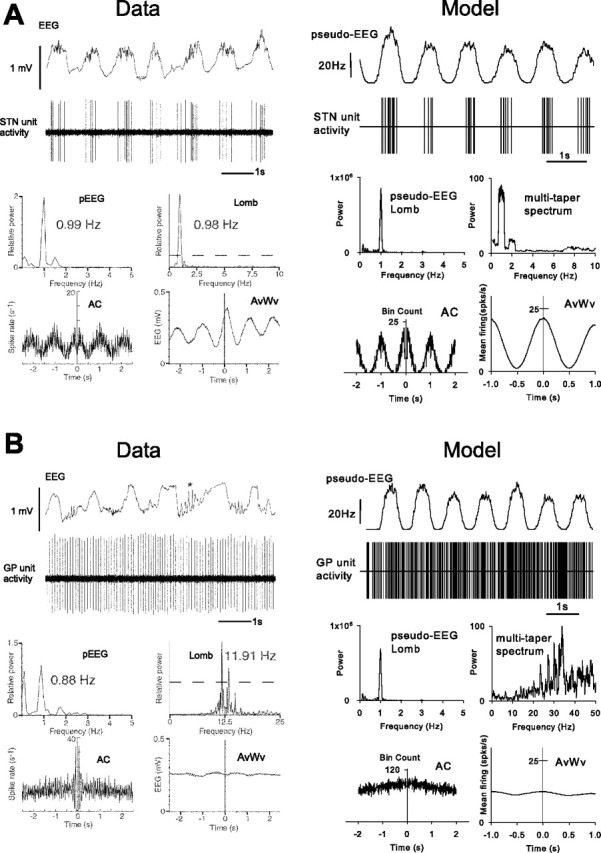
Neuronal activity in the basal ganglia of anesthetized control rats and equivalent simulations. A, STN neuronal activity closely follows cortical EEG slow wave; B, GP neuronal activity does not follow cortical EEG slow wave. Single-unit recordings and analyses from Magill et al. (2001) are shown on the left, together with their model-derived counterparts on the right: (data) cortical EEG, (model) a population-derived pseudo-EEG (for details, see Results); (data) single-unit activity from extracellular recording, (model) spike time series, plotted in a similar way as the in vivo data; (data) power spectrum of the EEG, (model) power in the pseudo-EEG measured using a Lomb–Scargle periodogram; (data) Lomb–Scargle periodogram of the single-unit recording, (model) multi-taper spectrum of spike time series; (data) autocorrelogram of unit activity, (model) autocorrelogram of spike time series (both 10 ms bins); (data) spike-triggered average waveform of the EEG, (model) spike-triggered average waveform of the pseudo-EEG.
Figure 6.
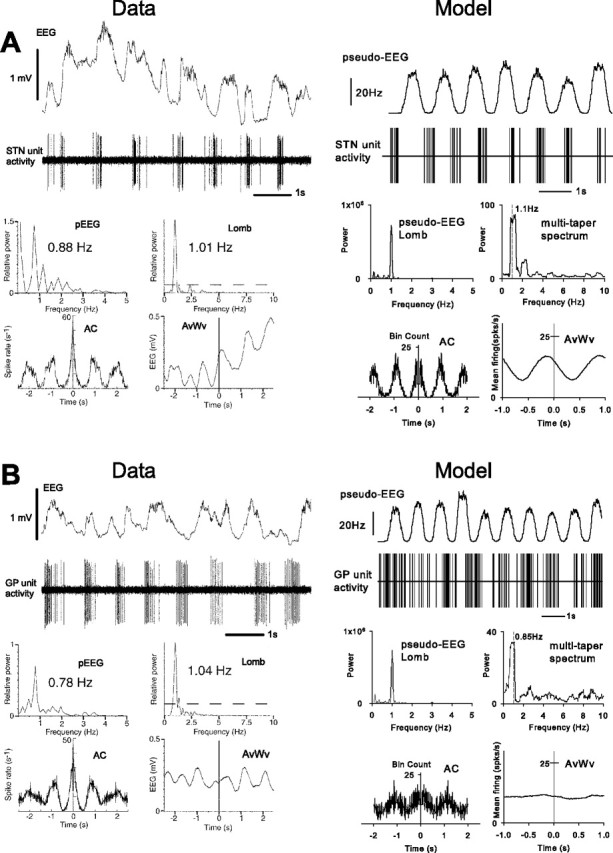
Single-unit recordings and analyses from Magill et al. (2001), together with their model counterparts for the lesion-and-ablation condition (no dopamine and cortical ablation). Each panel shows similar information to that in Figure 5, except that the cortical EEG in the experimental data are for the contralateral cortex, which remained intact. A, Low-frequency STN neuronal activity remains despite the absence of cortex and depletion of dopamine; B, GP neuronal activity shows corresponding low-frequency activity. Experimental data and model are in good agreement.
Figure 5 compares sample spike trains from the real and simulated STN and GP for the control condition. The experimental data show oscillatory bursting in STN at ∼1 Hz, which is approximately the frequency of the strong LFO in the cortical EEG. The spike-triggered average of the EEG shows a strong correlation between the STN and EEG consistent with the cortical drive of the STN bursting. For GP unit recording, the experimental data show no low-frequency bursting and weak coupling to the EEG. The same analyses applied to each of a single STN and GP neuron from a single model show essentially the same results.
Figure 6 shows sample spike trains from the real and simulated STN and GP for the lesion-and-ablation condition. The experimental data show oscillatory bursting maintained in STN but this time without correlation with the contralateral EEG, indicated by the spike-triggered average EEG waveform and by the difference in peak frequencies between cortex and STN unit activity. The model shows a similar patterning in the results; note the weaker and more asymmetrical spike-triggered average compared with that in the control condition. The experimental data in this example show GP exhibiting a strong LFO, in contrast with the control condition. GP also shows LFO activity in the model example. This patterning of behavior is infrequent in both data and model but is indicative of a native LFO pacemaker mechanism because, in both cases, cortical input cannot be responsible for the LFO activity.
Model results show similar overall behavior to the experimental data
The summary mean firing rate and LFO frequency percentages (across all four conditions and both nuclei) from the experimental (Magill et al., 2001) and simulated data are shown in Figure 7. A neuron (from the experiment or model) was considered to have LFO activity if it had a significant peak in its power spectrum <1.5 Hz (following Magill et al., 2001). In Figure 7, A and B show results for single virtual experiments, and C and D show the spread of model results over the batch of 50 such experiments.
We were particularly surprised by the consistently excellent match of the model output to every mean firing rate in all experimental conditions (Fig. 7A,C). As reported by Magill et al. (2001), the mean firing rate of GP neurons did not markedly change across any experimental condition, whereas the mean firing rate of STN neurons showed comparatively large changes across conditions.
The match between the simulated and experimental LFO data were also consistently good (Fig. 7B,D). The principal disparity was that a smaller proportion of model GP neurons had LFO activity after dopamine depletion (lesion condition) compared with the experimental data. However, there was still a significantly larger proportion of GP neurons showing LFOs in the lesion condition than in the control condition, consistent with the corresponding trend in the experimental data.
Together, it is remarkable that both the mean firing rate and LFO percentage changes across the experimental conditions were captured in the same model, given the complex sequence of coupling and decoupling between STN and GP activity described by Magill et al. (2001).
The quantitative match between simulation and experimental data was found by examining the correlation between values in a single virtual experiment and the corresponding experimental values. Thus, for experimental firing rate means and LFO percentages (separately), Spearman's rank correlation coefficients were found with respect to the corresponding eight values derived from a particular virtual experiment. (We used Spearman's rank because we could guarantee monotonicity in the relationship between data and virtual experiment, by reordering the data, but had no grounds to assume a linear relationship.) A result of r2 = 1 would indicate complete agreement between virtual experiment and experimental data on the direction of all changes in mean firing rate (or LFO percentage) across all conditions and both nuclei. The distribution of r2 for the full model across the entire batch of 50 such experiments is shown by the first box-and-whisker plot in each of Figure 8, A and B. Using the full model, the mean firing rates from the virtual experiment were significantly correlated (p < 0.05) with those from the experimental data in 88% (44 of 50) of cases, and the LFO percentages were significantly correlated in 84% (42 of 50) of cases.
Figure 8.

Overall correlation between virtual experiment and animal data from Magill et al. (2001) across variations of the model. A, The distribution of Spearman's rank correlation coefficients comparing model and experiment for mean firing rates over the batch of 50 virtual experiments (calculated as described in Results). The dashed line indicates the minimum r2 value necessary to achieve significant correlation at p = 0.05. B, Distribution of Spearman's rank correlation coefficients between model and experiment for LFO counts (box-and-whisker plot similar to those in A). C, Percentage of significant correlations over the batch of 50 virtual experiments for each tested variant of the model. The error bars are the SDs of the expected percentage (see Results). A single asterisk denotes a p < 0.05 significant difference between the expected value for the model variant and that of the full model with the one-tailed criterion; a double asterisk denotes a significant difference at p < 0.01.
We turn now to exploring how variants of the full model fit the same data to determine the relative contributions of the internal mechanisms of the BG and to assess the accuracy of the anesthesia model. To get a quantitative estimate of the comparative fit of each model variant to the data, we considered each virtual experiment with that variant as a Bernoulli trial: a trial was a success if it showed significant correlation (p < 0.05) with both mean firing rate data and the LFO data and was a failure otherwise. The percentage of successes is shown in Figure 8C. The fraction of significant correlations was then interpreted as a probability, p, in a binomial distribution for sampling a “significantly correlated virtual experiment.” The binomial distribution was approximated by a normal one, and SD was computed according to σ = [50 p(1 − p)]1/2. This enabled one-tailed p values to be calculated for pairwise comparisons between significant correlations of the full model and each of the other model variants. Thus, we considered the model variant to be a worse fit to the data than the full model if the resulting p value was < 0.05.
Fit with experimental data is decreased with no GP/SNr collaterals
The existence of local axon collaterals within SNr and GP has been repeatedly demonstrated, but some researchers have concluded that they have little observable impact on the activity within those nuclei (Bar-Gad et al., 2003; Morris et al., 2003; Stanford, 2003). We thus ran a batch of 50 virtual experiments without GP and SNr collaterals (setting their weights to 0) to see their influence on model behavior. This required resetting of tonic firing rates, which was successfully achieved (see above); however, note that the reduced value of Ii∈ΩTspon = 5 × 10⁻¹⁰ was used, as part of the model of the effects of urethane.
Although there is an increase in the median value of the correlation coefficient with the experimental data for mean firing rates (Fig. 8), there is a decrease in the median correlation with LFO counts and an overall significant (p < 0.05) decrement in the total number of significant fits with the data.
Fit with experimental data is decreased with no dopaminergic modulation in STN and GP
A batch of 50 virtual experiments was run without dopamine in each of GP and STN and without dopamine in both of these nuclei. All three of these manipulations resulted in lower median values for the correlation coefficients with the experimental data for both mean firing rates and LFO counts (Fig. 8). Removal of dopamine from both nuclei or STN alone resulted in a significant (p < 0.01) overall decrement in the total number of significant fits with the data. Only the removal of dopamine from GP alone did not result in a significant decrease in fits to the experimental data.
Fit with experimental data is decreased with no model of urethane
A batch of 50 virtual experiments was run without the urethane mechanism (setting all weight multipliers to 1, and Ii∈ΩTspon = 11 × 10−10 A, as in the awake animal state of the model). This resulted in a decrease in the median correlation with the experimental data for both mean firing rates and LFO counts (Fig. 8). There was also a significant decrease (p < 0.01) in the total number of significant fits with the experimental data.
Residual LFO activity depends on STN Ca2+ channels
Experimentally, combined ablation of cortex and 6-OHDA lesion of SNc did not abolish all LFO activity in STN and GP (Magill et al., 2001), a result that we replicated (Fig. 7). We hypothesized that this residual LFO activity was generated by the Ca2+-based current cascade within STN neurons (see the Appendix) supposedly responsible for the pacemaker activity observed by Plenz and Kitai (1999) in their in vitro study of GP–STN oscillations. To test this, we removed ICa from the STN model and ran 50 virtual experiments for the lesion-and-ablation condition. We found no LFO activity in STN or GP in any such experiment. We take this as support for the hypothesis that the pacemaker activity reported by Plenz and Kitai (1999) is responsible for the residual LFO activity reported by Magill et al. (2001).
STN and GP neurons show γ-band oscillations
Oscillatory phenomena are not restricted to the anesthetized or dysfunctional basal ganglia. Of particular interest to a putative role in action selection is the recent report of significant upper γ-band (40–80 Hz) oscillations in LFP recordings from the STN of healthy, resting, awake rats (Brown et al., 2002). Furthermore, after the systemic application of the D2/D3 agonist quinpirole, which causes an increase in locomotor activity (Beninger et al., 1991), the power in the upper γ-band significantly increased (Brown et al., 2002).
LFP recordings are thought to indicate ongoing synaptic activity (Boraud et al., 2005) and thus are also correlated with the dominant spiking frequencies that elicit such activity. We searched for upper γ-band activity in our model STN to demonstrate that activity in this frequency band is present in a simulated normal basal ganglia. In addition, we mimicked D2 agonist application by increasing the simulated level of dopamine at D2 receptors.
Because the most pertinent experimental recordings were made from awake rats, input to the model comprised tonic cortical firing at 15 spikes/s, reflecting the mean cortical activity typical of awake animals (Steriade et al., 2001). Each virtual experiment replicating the control condition (preinjection) comprised simulations of NA = 12 models, sampling nD = 11 neurons from each, yielding a total of 132 neurons. In this condition, each model had normal simulated tonic dopamine λD1 = λD2 = 0.3. Each virtual experiment replicating the D2 agonist injection condition comprised simulations of NA = 5 models, sampling nD = 11 neurons from each, yielding a total of 55 neurons. In this condition, each model had λD2 = 1 to mimic the D2 agonist. The number of models again matched the number of animals used by Brown et al. (2002) in each condition: moreover, the first five models of the control condition were the same as the five models in the D2 agonist condition because the same animals were used for both. All simulations were run for 10 s, and 50 virtual experiments were conducted in each condition.
We were surprised to find significant upper γ-band activity in STN spike trains for the simulated control condition, without altering any BG model parameter (Fig. 9A shows an example from a single STN neuron of the model). This result was consistent across all virtual experiments (Fig. 9B), and the STN γ-band activity had a mean peak frequency of ∼55 Hz, matching the reported experimental mean peak frequency of ∼53 Hz for the control condition (Brown et al., 2002). The increase of D2 dopamine levels resulted in an increase in STN upper γ-band power in every virtual experiment (Fig. 9B) and was always within the 95% confidence interval for the mean increase (of 86%) observed previously (Brown et al., 2002) (Fig. 9D). Thus, the model consistently replicated the reported characteristics of upper γ-band activity in STN for both the normal and D2 agonist conditions.
Figure 9.

Simulated rat basal ganglia shows γ-band activity. A, The power spectrum of a single STN neuron output from a virtual experiment with normal dopamine (λD2 = 0.3) and after simulated D2 agonist injection (λD2 = 1), shown by the red and blue traces, respectively. B, The mean power spectrum of all STN neurons in every virtual experiment shows both a prominent γ-band peak in the control condition and the increase in power after simulated D2 agonist injection. C, The mean power spectrum of all GP neurons in every virtual experiment also shows a prominent γ-band peak in the control condition but no clear increase in power after simulated D2 agonist injection. D, Box-and-whisker plot showing the distribution of percentage increase in γ-band power in STN and GP after simulated D2 agonist injection across every virtual experiment. Also shown are experimental results from rat STN (Brown et al., 2002), with the mean percentage increase shown as an open circle and the 95% confidence interval by thick lines. E, Histogram of percentage change in ISIs between the control and the simulated D2 agonist application conditions for the same model STN neuron as in A. Individual ISI histograms were generated with 100 bins in the interval [0.005, 0.6] seconds. F, Mean change in ISI distribution between the control and simulated D2 agonist conditions over all sampled STN cells in every virtual experiment. Bars are ±2 SE.
The increased power in the γ-band could arise from a number of sources, such as an increase in the power of harmonic or modulated frequencies within the STN, or directly from the firing rates of the units themselves. To investigate this further, we computed ISI histograms (bins of 0.06 s width) for each model STN neuron from the five matched BG models in both the control and simulated D2 agonist conditions and then calculated the percentage change in each ISI bin between the conditions.
The ISIs associated with γ-band frequencies (40–80 Hz corresponds to an ISI range of 0.025–0.0125 s) occurred more often after simulated D2 agonist injection (Fig. 9F). This result was consistent across all virtual experiments. We conclude that the increased power of γ-band activity in STN neurons in the model is attributable to an increased occurrence of neurons firing at these rates.
We also looked at the potential occurrence of γ-band activity in GP from the same simulation data. Model GP neurons showed a consistent γ-band peak in both control and simulated D2 agonist injection conditions (Fig. 9C). However, there was not a reliable increase in power in the γ-band after simulated D2 agonist injection (Fig. 9D).
NMDA receptor activity masks γ-band oscillations
We sought other contributing mechanisms to the γ-band oscillations. In particular, we hypothesized that the long time course of NMDA receptor-invoked EPSPs in GP neurons might reduce synchrony between the STN and GP and, therefore, that the γ-band oscillations would have more power if NMDA receptors in GP were blocked. To investigate this, we ran an additional set of 50 virtual experiments, with the same parameter values as the control condition above (normal dopamine, simulation period t = 10 s), but with Inmda = 0 for GP neurons throughout. In this way, we mimicked a localized NMDA-specific antagonist injection into GP.
The results show that NMDA receptor activity in GP masks some γ-band oscillations in both STN and GP. Compared with the control condition, both STN and GP showed a marked increase in activity within a restricted region of the γ-band after NMDA receptor blockade in model GP (Fig. 10). Such a narrowing of the power spectrum peak implies an increased regularity in the underlying signal, indicating that the NMDA activity was reducing synchrony between STN and GP.
Figure 10.
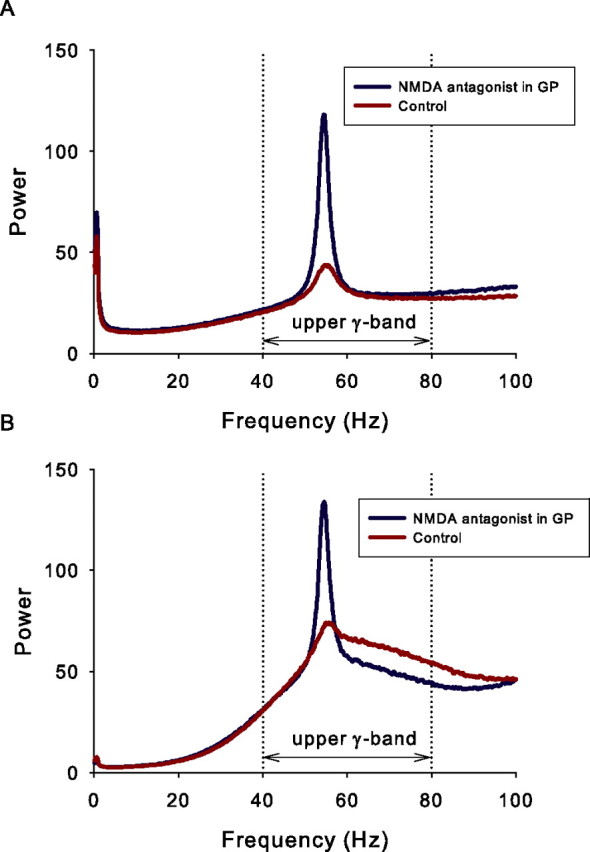
NMDA receptors mask γ-band activity. After blockade of NMDA receptors in model GP, a marked increase in power within a restricted region of the γ-band is seen in both STN and GP power spectra. A, The mean power spectrum of STN neuron output from all virtual experiments in the control condition and after NMDA receptor blockade in GP, shown by the red and blue traces, respectively. B, The corresponding mean power spectrum of all GP neurons in every virtual experiment in the control condition and after NMDA receptor blockade in GP.
Discussion
The results of this study demonstrate that a physiologically plausible model of BG circuitry can support the selection and switching of signals representing actions. The subsequent replication of multiple experimental datasets provides strong support for our BG model and for the functional anatomy on which it is based. Replication of a single dataset with any model is a good first step for validation but is open to the criticism that the parameters of the model were tuned to fit just that data. Hence, we fitted three datasets (tonic rates, LFO activity, and γ-band oscillations) to demonstrate the general validity of the underlying model. The model was able to reliably fit the mean tonic firing rates of the BG nuclei, providing a consistent foundation on which all other work was based. We emphasize that, to fit the other datasets, only the parameters related to the experimental condition were changed: all other parameters were set to the same, biologically derived, values throughout.
Putative action selection functions of the BG
The primary functional result from this work is that the new BG model provides additional evidence for the action selection hypothesis. We demonstrated that the mean output of SNr channels reflected the selection of and switching between signals representing the urgency of actions. This was consistent across all tested instantiations of the model and is therefore robust to some variation in connectivity and neuron parameter values.
The distribution of individual SNr neuron firing rates demonstrated the care required in determining channel membership. Neurons that are nominally in an anatomically defined channel (as ours were) may not necessarily all respond in the same manner because of the different balance of inputs to individual neurons from afferent structures. However, despite this, the selection of an action is consistent with both a decrease in firing rates of a subset of SNr neurons and an increase in the firing rates of another subset of SNr neurons. These changes in firing rates reflect those seen in recordings from the SNr of freely moving rats during task performance (Gulley et al., 1999, 2002).
Altering the level of simulated tonic dopamine caused deterioration in selection and switching properties. After dopamine depletion, simulated SNr output was insufficiently reduced to signal selection, implying a difficulty in initiating movement. A series of studies have shown an increased difficulty of movement initiation after a unilateral 6-OHDA lesion in rat (Spirduso et al., 1985; Olsson et al., 1995; Kirik et al., 1998; Phillips and Brown, 1999), consistent with the akinesia typical of Parkinson's disease.
Increasing simulated dopamine resulted in SNr output remaining inhibited even after the introduction of a competing salient action, implying an inability to switch to a new action. This is consistent with the behavioral stereotypies expressed by rats after systemic or intrastriatal injections of the dopamine stimulant amphetamine (Wang and Rebec, 1993; Waszczak et al., 2001; Gulley et al., 2004) or intrastriatal injections of nonselective dopamine agonists (Waszczak et al., 2002). Thus, the effects of dopamine depletion and dopamine excess in the model are both consistent with the known behavioral impact of these manipulations.
The present model does not address the problem of dynamically ordering selected actions into behavioral sequences. Simulation (Berns and Sejnowski, 1996; Beiser and Houk, 1998) and embodied (Girard et al., 2003; Prescott et al., 2006) studies suggest that the closed loops formed by the corticobasal ganglionic circuit, whereby the BG output feeds back, via thalamus, to the cortical areas from which the striatal input originated, are necessary to implement behavioral sequencing. Effectively, the thalamocortical loop acts as a form of working memory, allowing the selected action(s) to correctly persist until a new action is required (Beiser and Houk, 1998; Humphries and Gurney, 2002). In addition, behavioral sequencing may also depend on the well known plasticity of the corticostriatal synapses (Mahon et al., 2004), so that correct matches between current context and appropriate actions are learned (Graybiel, 1995; Houk and Wise, 1995). Extending the present model to incorporate thalamocortical feedback and corticostriatal plasticity at the same level of detail is a considerable challenge for the future.
Predictions of the model
The replicated experimental data were chosen for their potential to provide insights into properties of the BG circuitry. Oscillatory activity in the BG is often associated with motor dysfunction alone (Hutchison et al., 2004; Boraud et al., 2005), yet both LFO and γ-band activity have been reported in healthy, intact animals (Magill et al., 2001, 2004b; Brown et al., 2002; Berke et al., 2004).
We have shown that the model can replicate the changes in both LFO occurrence and mean firing rate for both STN and GP across all four experimental conditions reported by Magill et al. (2001). The detailed results, and the comparisons between the full model and its variants (Fig. 8), provide support for three proposals. First, contrary to reports by Bar-Gad et al. (2003) and Stanford (2003), the local axon collaterals in GP and SNr may have an observable effect on cell activity in those nuclei. Their presence in the model resulted in a significantly better fit to the experimental data, even if the model was recalibrated in their absence. Second, the STN–GP loop is not a pacemaker circuit under normal conditions in vivo but shows <1 Hz pacemaking activity after both dopamine depletion and cortical ablation, similar to the activity observed in vitro (Plenz and Kitai, 1999). The pacemaking in the model was dependent on a rebound depolarization-invoked sequence of Ca2+ channel activations, which had previously accounted for the results of Plenz and Kitai (1999) (Humphries and Gurney, 2001). Third, changes in tonic dopamine levels alter the functional coupling between STN and GP. Model STN neurons tracked the cortical activity, but GP neurons did not; only after dopamine depletion did both sets track cortical activity. Our slow-wave replication results thus support our hypothesis that dopamine acts to decouple the STN–GP loop, and we propose that it achieves this by gating STN and GP inputs to each other.
We have shown that simulated STN neurons have γ-band activity under model conditions corresponding to a healthy freely-moving rat and that this activity increases in power after simulated D2 agonist injection, replicating the results of Brown et al. (2002). We have also shown that γ-band activity is present in simulated GP, consistent with recent LFP recordings (Magill et al., 2004b). Together, these results provide evidence for the hypothesis that healthy BG supports γ-band oscillations.
Our demonstration that both STN and GP produce spiking activity in the γ frequency band provides support for the hypothesis that the γ-band LFP activity could be directly attributable to synaptic activity in this frequency range (Boraud et al., 2005). This is consistent with studies that have combined LFP and single-unit recording in STN and GP (Magill et al., 2004a,b).
Our γ-band results make three quantitative predictions. First, the increase in STN γ-band activity after systemic D2 agonist injection results in a general increase of power, which does not have a clear peak frequency. Second, GP γ-band activity will not show an increase of equivalent magnitude after systemic D2 agonist injection. Finally, activation of NMDA receptors masks γ-band activity within the STN–GP loop: injecting an NMDA antagonist into GP should therefore increase γ-band activity in both STN and GP. This last observation, together with the appearance of γ-band activity under modeled normal conditions without corresponding activity in the cortical input, supports the hypothesis that the γ-band activity is a result of resonance within the STN–GP loop.
Neuronal activity in the γ-band is associated with normal motor function (MacKay, 1997; Brown et al., 2001, 2002; Cassidy et al., 2002). Its presence in our model provides considerable evidence that the model captures many functional properties of the healthy BG. However, the precise functional role of the γ-band oscillations remains an open question. Of the existing proposals (Brown et al., 2001; Cassidy et al., 2002), our results support the hypothesis that γ-band activity acts as pacemaker for sensorimotor integration, providing temporal windows for the processing of sensory information (MacKay, 1997). Because the STN–GP loop can influence all other structures in the BG, it may provide either enhanced (from STN) or disinhibited (from GP) processing windows. Our results are also consistent with there being no particular functional role for γ-band activity, because it may be an epiphenomenon of the coupling between STN and GP (see above).
Relationship to other BG models
The current model is based on previous work (Gurney et al., 2001a,b, 2004b) in which we proposed a new functional anatomy for the basal ganglia and implemented it in a population-level computational model. By implementing the functional anatomy at a greater level of detail here, we are following our proposed framework for validating functional hypotheses by successful implementations of models at multiple levels of description (Gurney et al., 2004a): more detailed models are appropriate for assessing dynamics within microcircuits (e.g., the STN–GP loop) (Terman et al., 2002), and more abstract models for exploring the properties of wider brain systems (e.g., treating complete BG–cortex–cerebellar modules in an agent-based framework) (Houk, 2005).
Both previous and more recent BG models have looked at selection by some components of the BG circuitry (for review, see Beiser et al., 1997; Gillies and Arbuthnott, 2000). Beiser and Houk's (1998) systems-level model of the selection pathway within a complete BG–cortex loop showed how sequences of behavior can be constructed from the selection of individual motor programs.
More recent systems-level models incorporating the cortical drive of STN (Humphries and Gurney, 2002; Leblois et al., 2006) follow Beiser and Houk (1998) in postulating a central role for cortical feedback in controlling selection by BG output. The models of Berns and Sejnowski (1996, 1998) propose a central role for the STN–GP loop in sequencing actions. Recent work (Rubchinsky et al., 2003) using biophysical neuron models follows Berns and Sejnowski (1998) in postulating that the STN–GP loop are critical for selection. However, action selection dependent on strong interactions in the STN–GP loop (Berns and Sejnowski, 1998; Rubchinsky et al., 2003) is not supported by experimental data reviewed here or by the results of the present model.
The work of Frank, O'Reilly, and colleagues is notable for drawing together the selection hypotheses with the actions of reinforcement learning in the BG (Frank, 2005). Their model, intended to investigate cognitive processes, divides the striatal population into Go and No-Go neuron populations, which, respectively, map onto the D1 (selection) and D2 (control) populations considered here (they postulate differential learning in the two pathways). Using this model, they successfully predicted that off-medication Parkinson's patients are better at learning negative outcomes (No-Go) than controls, whereas on-medication Parkinson's patients are better at learning positive outcomes (Go) than controls (Frank et al., 2004). However, the Frank (2005) BG model uses the same neuron model throughout, without specialization for each neuron class. Thus, it would be of considerable interest to incorporate reinforcement learning into our more detailed model and attempt to replicate their findings.
The Frank (2005) model uses lateral inhibition in both internal and external GP; similarly, the models of Berns and Sejnowski (1996, 1998) rely on lateral inhibition within the internal GP to support selection. Our results provide evidence for lateral inhibition within these structures, thus supporting the assumptions made by these models. However, unlike previous models (Contreras-Vidal and Stelmach, 1995; Beiser and Houk, 1998; Frank, 2005), the present model does not require lateral inhibition within striatum to perform selection; instead, the process arises through the interaction of the selection and control pathways (for additional details, see Gurney et al., 2001a,b). We believe this is a strength of the model, because the extent of the inhibitory influence of projection neurons on each other, via local axon collaterals, is currently unclear (Tepper et al., 2004; Venance et al., 2004).
Numerous models have focused on the dynamics of the isolated STN–GP loop. Low-frequency oscillations observed in organotypic cultures of this circuit (Plenz and Kitai, 1999) have been captured by these models (Humphries and Gurney, 2001; Gillies et al., 2002; Terman et al., 2002) and are consistent with the residual oscillations seen in the in vivo recordings of Magill et al. (2001). The combined results of the current and previous modeling studies thus provide considerable support for the proposal that the isolated STN–GP loop forms a low-frequency pacemaker circuit (Plenz and Kitai, 1999; Bevan et al., 2002).
Conclusions
The current model uses comparatively simple model neurons and necessarily omits certain known features of the BG. Nonetheless, despite its comparative simplicity, we were surprised by the extent of the good quantitative matches between simulated and biological data observed across the multiple datasets we tested. The model yielded several predictions and hypothetical mechanisms relating to the oscillatory phenomena. The same model demonstrated selection and switching between signals representing the salience of actions. We have thereby shown that our action selection hypothesis (Redgrave et al., 1999) and the results of our population-level BG models (Gurney et al., 2001b) are supported by a biologically plausible, spiking neuron model of the BG.
Appendix
We used current-based, rather than conductance-based, models for two reasons. First, the exact solutions are available for the former, allowing rapid and accurate simulation of large-scale networks. Second, the use of conductance-based models would have required that we source potentially unavailable conductance, reversal potential, and time course data for the ion channels we were to use. In contrast, the construction of phenomenologically derived, current-based models is comparatively straightforward and is an approach we used successfully in a previous modeling study (Humphries and Gurney, 2001) of oscillations in organotypic cultures of STN and GP (Plenz and Kitai, 1999). Below we detail the additional currents and mechanisms used to capture the properties of shunting inhibition and the properties of each neuron species.
Shunting inhibition
The current IiD in the distal compartment of neuron i is given by Equation 5. The current IiP going into the soma from the proximal compartment of neuron i is given by
 |
where hiP is a “gating variable” depending on the GABAergic synaptic current and which reflects the shunting inhibition mediated by the proximal compartment.
The requirements of hiP are that it goes to 0 as Ij∈Πigabaa increases (but is bounded below by 0) and that it depends on the absolute, as well as relative, magnitude of Ij∈Πigabaa, that is, the gating effect must be referenced to gating effects in the model as a whole. Defining hiP by
 |
satisfies all of these requirements in a simple form, where JP is a globally applicable “reference current,” representing a measure of the typical maximum inhibitory current possible in the model. Within each compartment c of each neuron i, we find the maximum possible inhibitory current Ki(c)max as follows:
 |
where Ci is the set of GABAergic afferents to compartment c of that neuron, and wij and Îijs are weights and initial PSCs, respectively (see Eq. 2). We defined JP as
where η is a scaling parameter, which allows fine control over the reference current. Values of η < 1 induce a global increase in the effectiveness of inhibition, whereas η > 1 induces a decrease.
We proceed in exactly the same way with the soma. The somatic current of neuron i attributable to synaptic influences is defined by
 |
where his is defined in an analogous way to hiP, for all j ∈ Σi. Substituting Equation 8 in Equation 12 gives
 |
which is a general form for IiS in which shunting inhibition plays a role.
Although the gating variables hiP and hiS capture the general shunting nature of proximal and somatic inhibition, they do not capture the fact that the membrane potential is simultaneously forced toward the reversal potential associated with GABAA receptors, ECl (which, under the shift of resting potential to 0, is equivalent to Vlim in the model). To model this, we introduce a constant current IiCl for each neuron i, where
 |
Then, at equilibrium, with full shunting effect (hiS = hiP = 0) and no noise current (IiN = 0), Vim = Vlim as required. However, the contribution of IiCl must be modulated by the values of hiS and hiP and so we multiply IiCl by a factor Qih, where
 |
Models of neuron species
We detail the adaptations to the basic neuron model (see Materials and Methods) required to capture the major properties of each modeled neuron species.
Striatum
As a first step, we only modeled projection neurons of the striatum, which dominate the neuron count in the rat (∼95% of all striatal neurons). Cortical input stimulates both AMPA and NMDA receptors on the postsynaptic membrane of these neurons (Sandstrom and Rebec, 2003), and the efficacy of this input is modulated by tonic levels of dopamine. As noted in the description of the basal ganglia architecture, striatal projection neurons are divided into two populations on the basis of their dominant dopamine receptor type, either D1 or D2 [notwithstanding evidence for some colocalization of these receptors (Surmeier et al., 1996; Aizman et al., 2000)]. The effect of dopamine activating these receptors is known to be highly complex for both types (for review, see Cepeda and Levine, 1998; Nicola et al., 2000). However, we follow the weight of in vivo literature, which shows that the general effect of D1/D2 activation is an elevation/reduction of striatal neuron firing, respectively (Gonon, 1997; O'Connor, 1998; Berretta et al., 1999; Murer et al., 2000; West and Grace, 2002; Sano et al., 2003). The modulation of cortical excitation by dopamine was therefore modeled by simply multiplying the excitatory, cortically driven, currents, by dopamine-dependent factors (1 + λD1) and (1 − λD2) for D1 and D2 receptors, respectively (with 0 ≤ λD1, λD2 ≤ 1). By separately parameterizing contributions to D1 and D2 receptors, we were able to mimic the effects of receptor-specific agonists and antagonists if required. Under normal conditions, λD1 = λD2.
Because we do not model intrinsic striatal connectivity here, there is no inhibition on the projection neurons. We therefore use Equation 7 with synaptic currents:
 |
for a neuron i in either the D1-dominant (ΩS1) or D2-dominant (ΩS2) striatal populations, and where Iampa and Inmda are derived from cortical input.
A well known phenomenon of striatal projection neurons is that their resting membrane potential is hyperpolarized far below spike threshold (Nisenbaum and Wilson, 1995; Wilson and Kawaguchi, 1996). This is sometimes referred to as the “down state.” Its functional implication is that significant coordinated excitatory input is required to force the model striatal neurons to fire (Wilson and Kawaguchi, 1996; Mahon et al., 2001). To model this, we supplied a constant hyperpolarizing input current Idown, analogous to the inward rectifying potassium current thought to maintain the down state (Nisenbaum and Wilson, 1995; Nicola et al., 2004), to hold the striatal neuron membrane potential in a hyperpolarized state. Substituting Equation 16 and Ispon = Idown in Equation 7 gives the membrane equations for the model striatum (with I* = 0).
A plateau-like depolarized “up state” has also been observed in striatal projection neurons in vivo (Wilson and Kawaguchi, 1996), which alternates with the down state. One plausible explanation for this behavior is that, after sufficient depolarization, a L-type Ca2+ current produces a plateau potential (Hernandez-Lopez et al., 1997); some models suggest that this makes projection neurons bistable, flipping between the two states with no stable intermediate points (Gruber et al., 2003). However, the up state and down state transitions are absent in vitro (Jiang and North, 1991) and are dependent in vivo on slow-wave cortical input induced by anesthetic preparations (Mahon et al., 2001; Kasanetz et al., 2002; Mahon et al., 2003); in periods of cortical desynchronization, similar to waking states, no clear up or down states are observed (Mahon et al., 2001). Hence, although the L-type Ca2+ undoubtedly plays a role in regulating projection neuron activity (Nicola et al., 2004), we do not model the projection neurons as bistable elements here.
STN
There is a single known neuron type in STN, which we model here. Input from cortex forms synapses that contain both AMPA and NMDA receptors (Gotz et al., 1997). Local axon collaterals in rat STN have been reported (Kita et al., 1983a), but no evidence for a functional effect has been found (Wilson et al., 2004) and hence we omit them here. GABAergic input predominantly originates from GP and occurs on both proximal dendrites and the soma; we therefore use Equation 6 for the STN membrane potential. Both glutamatergic and GABAergic presynaptic terminals have dopamine D2 receptors, which attenuate the corresponding elicited PSP when activated (Shen and Johnson, 2000).
To model the dopaminergic modulation, we used a similar scheme to that used in striatum. Thus, for neuron i in the STN population ΩT, the synaptic current in the distal compartment is
 |
where α1 and α2 express the effectiveness of the dopaminergic modulation at the glutamatergic and GABAergic terminals, relative to that in striatum. The proximal gating variable for STN cells is obtained by replacing Ij∈Πigabaa in Equation 9 with Ij∈Πigabaa(1 − α2λD2). The somatic gating variable is obtained in a similar way.
We also include a constant depolarizing current, Ii∈ΩTspon, which helps set the tonic rate in STN. Although, in general, such model currents will represent the mass action of multiple currents in the neuron, in the case of STN, it is most closely related to the Na+ currents, which generates the spontaneous single-spike firing of STN neurons (Bevan and Wilson, 1999; Beurrier et al., 2000; Do and Bean, 2003; Surmeier et al., 2005).
STN neurons exhibit rebound burst firing in vitro (Overton and Greenfield, 1995; Beurrier et al., 1999; Otsuka et al., 2001), and, because one of our aims is to explain the slow oscillatory activity in STN reported by Magill et al. (2001), it is pertinent to include mechanisms that may underpin STN burst firing. This bursting has been attributed to a complex sequence of current activations and deactivations (Beurrier et al., 1999; Otsuka et al., 2001). However, in keeping with the phenomenological approach adopted here, our model of the sequence of currents is based on a simple piecewise linear approximation ICa(t) of the net current across the membrane. This approach was used successfully in our previous model of oscillatory phenomena in organotypic culture (Humphries and Gurney, 2001).
Our model for rebound bursting works as follows: ICa is activated by the membrane potential depolarizing from below a threshold θCa. This initiates a step pulse in ICa of duration t1 and height JCa, which models the rapid depolarization to the start of the plateau phase caused by a combination of Ca2+ currents (Beurrier et al., 1999; Otsuka et al., 2001). This is followed by a slowly declining ramp (of duration t2) that captures the slow decrease of net current into the membrane via the combined action of the depolarizing L-type Ca2+ and a Ca2+-activated, hyperpolarizing K+ current (Beurrier et al., 1999; Hallworth et al., 2003). The pseudo-current ICa(t) initiated at some time tb may be expressed formally by
 |
This current then constitutes the contribution I* in Equation 6.
Periods t1 and t2 have values commensurate with the fact that STN bursts can last several hundred milliseconds (Plenz and Kitai, 1999; Bevan et al., 2002). θCa was set to −10 mV according to the values given by Beurrier et al. (1999) and Song et al. (2000). The level of JCa determines the intraburst firing frequency: the larger JCa, the faster the neuron will fire during the burst. An initial value of JCa = 9 × 10⁻¹⁰ A was determined empirically by simulation of a single STN unit: a simulated hyperpolarizing current was injected into the unit, and the value of JCa was altered until the unit fired at between 80 and 100 Hz during the initial period of the burst, as reported by Bevan et al. (2002) and Plenz and Kitai (1999). Time period (t1, t2), threshold θCa, and current step JCa values were sampled from Gaussian distributions for each neuron: means are given in Table 2, and SDs were taken as 10% of the mean.
GP
The exact neural composition of the GP is unresolved. Two neuron types have been identified on the basis of morphology (Kita and Kitai, 1994). In vivo and in vitro electrophysiological studies have identified three neuron types on the basis of firing pattern and responses to current injection (Kita and Kitai, 1991; Nambu and Llinas, 1994; Cooper and Stanford, 2000). Because we are primarily concerned with functional characteristics, we model here the major electrophysiological neuron type in GP (Kita and Kitai, 1991; Cooper and Stanford, 2000), which is spontaneously active. GP neurons have AMPA and NMDA synapses from glutamatergic sources (presumably STN) (Kita et al., 2004). GABAergic striatal input forms the majority of synapses. Local axon collaterals also contribute (presumably inhibitory) synapses (Kita and Kitai, 1991; Sadek et al., 2005), but there is some debate about their efficacy (Bar-Gad et al., 2003; Stanford, 2003), and so we address their potential contribution in our simulations (see Results). The local collaterals synapse predominantly on the soma and proximal dendrites (Falls et al., 1983; Kita and Kitai, 1994), so we use the membrane equation given by Equation 6.
Like the STN, the GP contains presynaptic dopamine D2 receptors. Activation of these receptors inhibits GABA release within the GP (Floran et al., 1997; Querejeta et al., 2001). Consistent with this result, D2 receptor activation in GP reduces the magnitude of striatopallidal IPSCs. However, IPSCs elicited by local axon collaterals are not affected in this way (Cooper and Stanford, 2001), indicating that D2 receptors are only found on striatopallidal terminals. The striatopallidal terminals are distributed across the soma and all dendritic regions (Falls et al., 1983; Smith et al., 1998).
Dopamine application has also been observed to reduce the effects of glutamate on pallidal neuron firing (Johnson and Napier, 1997). Because the STN is the only known source of glutamatergic input to the GP, it follows that an increase in dopamine results in a reduction of STN influence on GP neurons. In the absence of contrary data, we assume that this effect is also attributable to the activation of D2 receptors, given their predominance in GP (Hoover and Marshall, 2004). STN terminals on GP neurons are mainly on distal dendrites (Shink et al., 1996; Hanson et al., 2004).
Together, this evidence therefore suggests a form for the model of the distal compartment similar to Equation 17. We use separate dopaminergic modulation parameters β1 and β2 to allow possible differences between STN and striatal input. For neuron i in the GP population ΩG, synaptic input to the distal compartment is
 |
Tonic rates in GP cells are predominantly maintained by Na+ currents (Surmeier et al., 2005), which we model using a constant depolarizing current Ii∈ΩGspon. Other currents are not modeled, hence I* = 0.
SNr
The SNr predominantly comprises GABAergic projection neurons. Excitatory, glutamatergic input is received from STN cells (Nakanishi et al., 1987; Smith et al., 1998), forming synapses with both AMPA and NMDA receptors (Gotz et al., 1997). Inhibitory GABAergic input is received from the striatal D1-dominant cell population (Smith et al., 1998), GP cells (Smith and Bolam, 1989), and local axon collaterals (Deniau et al., 1982; Rick and Lacey, 1994). The GP inputs synapse predominantly on the soma and proximal dendrites, so we use the membrane equation given by Equation 6. Spontaneous activity of SNr cells is driven by internal pacemaker currents (Rick and Lacey, 1994; Atherton and Bevan, 2005), which we model using a constant depolarizing current equation, for each neuron i in the SNr population ΩO. There are no other known major current sources that effect SNr firing, so we set I* = 0.
Footnotes
This work was supported by United Kingdom Engineering and Physical Sciences Research Council Grants EP/C516303/1 and GR/R95722/01, a Wellcome Trust Value in People Award (M.D.H.), and European Union Framework 6 Grant IST-027819-IP. We thank Paul Overton, Peter Redgrave, and Ric Wood for their comments on previous drafts of this manuscript.
References
- Abeles, 1982.Abeles M. Quantification, smoothing, and confidence limits for single-units' histograms. J Neurosci Methods. 1982;5:317–325. doi: 10.1016/0165-0270(82)90002-4. [DOI] [PubMed] [Google Scholar]
- Aizman et al., 2000.Aizman O, Brismar H, Uhlen P, Zettergren E, Levey AI, Forssberg H, Greengard P, Aperia A. Anatomical and physiological evidence for D1 and D2 dopamine receptor colocalization in neostriatal neurons. Nat Neurosci. 2000;3:226–230. doi: 10.1038/72929. [DOI] [PubMed] [Google Scholar]
- Albin et al., 1989.Albin RL, Young AB, Penney JB. The functional anatomy of basal ganglia disorders. Trends Neurosci. 1989;12:366–375. doi: 10.1016/0166-2236(89)90074-x. [DOI] [PubMed] [Google Scholar]
- Alexander and Crutcher, 1990.Alexander GE, Crutcher MD. Functional architecture of basal ganglia circuits: neural substrates of parallel processing. Trends Neurosci. 1990;13:266–272. doi: 10.1016/0166-2236(90)90107-l. [DOI] [PubMed] [Google Scholar]
- Alexander and DeLong, 1985.Alexander GE, DeLong MR. Microstimulation of the primate neostriatum. I. Physiological properties of striatal microexcitable zones. J Neurophysiol. 1985;53:1401–1416. doi: 10.1152/jn.1985.53.6.1401. [DOI] [PubMed] [Google Scholar]
- Alexander et al., 1986.Alexander GE, DeLong MR, Strick PL. Parallel organization of functionally segregated circuits linking basal ganglia and cortex. Annu Rev Neurosci. 1986;9:357–381. doi: 10.1146/annurev.ne.09.030186.002041. [DOI] [PubMed] [Google Scholar]
- Amzica and Steriade, 1995.Amzica F, Steriade M. Short- and long-range neuronal synchronization of the slow (<1 Hz) cortical oscillation. J Neurophysiol. 1995;73:20–38. doi: 10.1152/jn.1995.73.1.20. [DOI] [PubMed] [Google Scholar]
- Atherton and Bevan, 2005.Atherton JF, Bevan MD. Ionic mechanisms underlying autonomous action potential generation in the somata and dendrites of GABAergic substantia nigra pars reticulata neurons in vitro. J Neurosci. 2005;25:8272–8281. doi: 10.1523/JNEUROSCI.1475-05.2005. [DOI] [PMC free article] [PubMed] [Google Scholar]
- Bar-Gad et al., 2003.Bar-Gad I, Heimer G, Ritov Y, Bergman H. Functional correlations between neighboring neurons in the primate globus pallidus are weak or nonexistent. J Neurosci. 2003;23:4012–4016. doi: 10.1523/JNEUROSCI.23-10-04012.2003. [DOI] [PMC free article] [PubMed] [Google Scholar]
- Baufreton et al., 2005.Baufreton J, Zhu ZT, Garret M, Bioulac B, Johnson SW, Taupignon AI. Dopamine receptors set the pattern of activity generated in subthalamic neurons. FASEB J. 2005;19:1771–1777. doi: 10.1096/fj.04-3401hyp. [DOI] [PubMed] [Google Scholar]
- Bauswein et al., 1989.Bauswein E, Fromm C, Preuss A. Corticostriatal cells in comparison with pyramidal tract neurons: contrasting properties in the behaving monkey. Brain Res. 1989;493:198–203. doi: 10.1016/0006-8993(89)91018-4. [DOI] [PubMed] [Google Scholar]
- Beiser and Houk, 1998.Beiser DG, Houk JC. Model of cortical-basal ganglionic processing: encoding the serial order of sensory events. J Neurophysiol. 1998;79:3168–3188. doi: 10.1152/jn.1998.79.6.3168. [DOI] [PubMed] [Google Scholar]
- Beiser et al., 1997.Beiser DG, Hua SE, Houk JC. Network models of the basal ganglia. Curr Opin Neurobiol. 1997;7:185–190. doi: 10.1016/s0959-4388(97)80006-2. [DOI] [PubMed] [Google Scholar]
- Beninger et al., 1991.Beninger RJ, Mazurski EJ, Hoffman DC. Receptor subtype-specific dopaminergic agents and unconditioned behavior. Pol J Pharmacol Pharm. 1991;43:507–528. [PubMed] [Google Scholar]
- Bennett and Wilson, 2000.Bennett BD, Wilson CJ. Synaptology and physiology of neostriatal neurones. In: Miller R, Wickens J, editors. Brain dynamics and the striatal complex. London: Harwood Academic; 2000. [Google Scholar]
- Berke et al., 2004.Berke JD, Okatan M, Skurski J, Eichenbaum HB. Oscillatory entrainment of striatal neurons in freely moving rats. Neuron. 2004;43:883–896. doi: 10.1016/j.neuron.2004.08.035. [DOI] [PubMed] [Google Scholar]
- Berns and Sejnowski, 1996.Berns GS, Sejnowski TJ. How the basal ganglia make decisions. In: Damasio A, Damasio H, Christen Y, editors. The neurobiology of decision making. Berlin: Springer; 1996. [Google Scholar]
- Berns and Sejnowski, 1998.Berns GS, Sejnowski TJ. A computational model of how the basal ganglia produce sequences. J Cogn Neurosci. 1998;10:108–121. doi: 10.1162/089892998563815. [DOI] [PubMed] [Google Scholar]
- Berretta et al., 1999.Berretta S, Sachs Z, Graybiel AM. Cortically driven Fos induction in the striatum is amplified by local dopamine D2-class receptor blockade. Eur J Neurosci. 1999;11:4309–4319. doi: 10.1046/j.1460-9568.1999.00866.x. [DOI] [PubMed] [Google Scholar]
- Beurrier et al., 1999.Beurrier C, Congar P, Bioulac M, Hammond C. Subthalamic nucleus neurons switch from single spike-activity to burst-firing mode. J Neurosci. 1999;19:599–609. doi: 10.1523/JNEUROSCI.19-02-00599.1999. [DOI] [PMC free article] [PubMed] [Google Scholar]
- Beurrier et al., 2000.Beurrier C, Bioulac B, Hammond C. Slowly inactivating sodium current (Inap) underlies single-spike activity in rat subthalamic neurons. J Neurophysiol. 2000;83:1951–1957. doi: 10.1152/jn.2000.83.4.1951. [DOI] [PubMed] [Google Scholar]
- Bevan and Wilson, 1999.Bevan MD, Wilson CJ. Mechanisms underlying spontaneous oscillation and rhythmic firing in rat subthalamic neurons. J Neurosci. 1999;19:7617–7628. doi: 10.1523/JNEUROSCI.19-17-07617.1999. [DOI] [PMC free article] [PubMed] [Google Scholar]
- Bevan et al., 1994.Bevan MD, Bolam JP, Crossman AR. Convergent synaptic input from the neostriatum and the subthalamus onto identified nigrothalamic neurons in the rat. Eur J Neurosci. 1994;6:320–334. doi: 10.1111/j.1460-9568.1994.tb00275.x. [DOI] [PubMed] [Google Scholar]
- Bevan et al., 1995.Bevan MD, Francis CM, Bolam JP. The glutamate-enriched cortical and thalamic input to neurons in the subthalamic nucleus of the rat: convergence with GABA-positive terminals. J Comp Neurol. 1995;361:491–511. doi: 10.1002/cne.903610312. [DOI] [PubMed] [Google Scholar]
- Bevan et al., 1997.Bevan MD, Clarke NP, Bolam JP. Synaptic integration of functionally diverse pallidal information in the entopeduncular nucleus and subthalamic nucleus in the rat. J Neurosci. 1997;17:308–324. doi: 10.1523/JNEUROSCI.17-01-00308.1997. [DOI] [PMC free article] [PubMed] [Google Scholar]
- Bevan et al., 2002.Bevan MD, Magill PJ, Hallworth NE, Bolam JP, Wilson CJ. Regulation of the timing and pattern of action potential generation in rat subthalamic neurons in vitro by GABA-A IPSPs. J Neurophysiol. 2002;87:1348–1362. doi: 10.1152/jn.00582.2001. [DOI] [PubMed] [Google Scholar]
- Blomfield, 1974.Blomfield S. Arithmetical operations performed by nerve cells. Brain Res. 1974;69:115–124. doi: 10.1016/0006-8993(74)90375-8. [DOI] [PubMed] [Google Scholar]
- Bolam et al., 2000.Bolam JP, Hanley JJ, Booth PA, Bevan MD. Synaptic organisation of the basal ganglia. J Anat. 2000;196:527–542. doi: 10.1046/j.1469-7580.2000.19640527.x. [DOI] [PMC free article] [PubMed] [Google Scholar]
- Boraud et al., 2005.Boraud T, Brown P, Goldberg JA, Graybiel AM, Magill PJ. Oscillations in the basal ganglia: the good, the bad, and the unexpected. In: Bolam JP, Ingham CA, Magill PJ, editors. The basal ganglia VIII. New York: Springer; 2005. pp. 3–24. [Google Scholar]
- Bormann, 1988.Bormann J. Electrophysiology of GABAA and GABAB receptor subtypes. Trends Neurosci. 1988;11:112–116. doi: 10.1016/0166-2236(88)90156-7. [DOI] [PubMed] [Google Scholar]
- Brown and Sharp, 1995.Brown LL, Sharp FR. Metabolic mapping of rat striatum: somatotopic organization of sensorimotor activity. Brain Res. 1995;686:207–222. doi: 10.1016/0006-8993(95)00457-2. [DOI] [PubMed] [Google Scholar]
- Brown et al., 1998.Brown LL, Smith DM, Goldbloom LM. Organizing priniciples of cortical integration in the rat neostriatum: corticostriate map of the body surface is an ordered lattice of curved laminae and radial points. J Comp Neurol. 1998;392:468–488. [PubMed] [Google Scholar]
- Brown et al., 2001.Brown P, Oliviero A, Mazzone P, Insola A, Tonali P, Di Lazzaro V. Dopamine dependency of oscillations between subthalamic nucleus and pallidum in Parkinson's disease. J Neurosci. 2001;21:1033–1038. doi: 10.1523/JNEUROSCI.21-03-01033.2001. [DOI] [PMC free article] [PubMed] [Google Scholar]
- Brown et al., 2002.Brown P, Kupsch A, Magill PJ, Sharott A, Harnack D, Meissner W. Oscillatory local field potentials recorded from the subthalamic nucleus of the alert rat. Exp Neurol. 2002;177:581–585. doi: 10.1006/exnr.2002.7984. [DOI] [PubMed] [Google Scholar]
- Cassidy et al., 2002.Cassidy M, Mazzone P, Oliviero A, Insola A, Tonali P, Di Lazzaro V, Brown P. Movement-related changes in synchronization in the human basal ganglia. Brain. 2002;125:1235–1246. doi: 10.1093/brain/awf135. [DOI] [PubMed] [Google Scholar]
- Cepeda and Levine, 1998.Cepeda C, Levine MS. Dopamine and N-methyl-d-aspartate receptor interactions in the neostriatum. Dev Neurosci. 1998;20:1–18. doi: 10.1159/000017294. [DOI] [PubMed] [Google Scholar]
- Chang et al., 1983.Chang HT, Kita H, Kitai ST. The fine structure of the rat subthalamic nucleus: an electron microscopic study. J Comp Neurol. 1983;221:113–123. doi: 10.1002/cne.902210110. [DOI] [PubMed] [Google Scholar]
- Chevalier and Deniau, 1990.Chevalier G, Deniau JM. Disinhibition as a basic process in the expression of striatal function. Trends Neurosci. 1990;13:277–280. doi: 10.1016/0166-2236(90)90109-n. [DOI] [PubMed] [Google Scholar]
- Chevalier et al., 1985.Chevalier G, Vacher S, Deniau J, Desban M. Disinhibition as a basic process in the expression of striatal function. I. The striato-nigral influence on tecto-spinal/tecto-diencephalic neurons. Brain Res. 1985;334:215–226. doi: 10.1016/0006-8993(85)90213-6. [DOI] [PubMed] [Google Scholar]
- Contreras-Vidal and Stelmach, 1995.Contreras-Vidal JL, Stelmach GE. A neural model of basal ganglia-thalamocortical relations in normal and parkinsonian movement. Biol Cybern. 1995;73:467–476. doi: 10.1007/BF00201481. [DOI] [PubMed] [Google Scholar]
- Cooper and Stanford, 2000.Cooper AJ, Stanford IM. Electrophysiological and morphological characteristics of three subtypes of rat globus pallidus neurone in vitro. J Physiol (Lond) 2000;527:291–304. doi: 10.1111/j.1469-7793.2000.t01-1-00291.x. [DOI] [PMC free article] [PubMed] [Google Scholar]
- Cooper and Stanford, 2001.Cooper AJ, Stanford IM. Dopamine D2 receptor mediated presynaptic inhibition of striatopallidal GABA(A) IPSCs in vitro. Neuropharmacology. 2001;41:62–71. doi: 10.1016/s0028-3908(01)00038-7. [DOI] [PubMed] [Google Scholar]
- Cragg et al., 2004.Cragg SJ, Baufreton J, Xue Y, Bolam JP, Bevan MD. Synaptic release of dopamine in the subthalamic nucleus. Eur J Neurosci. 2004;20:1788–1802. doi: 10.1111/j.1460-9568.2004.03629.x. [DOI] [PubMed] [Google Scholar]
- Dayan and Abbot, 2001.Dayan P, Abbot LF. Theoretical neuroscience. Cambridge, MA: MIT; 2001. [Google Scholar]
- Deniau et al., 1982.Deniau JM, Kitai ST, Donoghue JP, Grofova I. Neuronal interactions in the substantia nigra pars reticulata through axon collaterals of the projection neurons. An electro-physiological and morphological study. Exp Brain Res. 1982;47:105–113. doi: 10.1007/BF00235891. [DOI] [PubMed] [Google Scholar]
- Do and Bean, 2003.Do MT, Bean BP. Subthreshold sodium currents and pacemaking of subthalamic neurons: modulation by slow inactivation. Neuron. 2003;39:109–120. doi: 10.1016/s0896-6273(03)00360-x. [DOI] [PubMed] [Google Scholar]
- Dommett et al., 2005.Dommett E, Coizet V, Blaha CD, Martindale J, Lefebvre V, Walton N, Mayhew JE, Overton PG, Redgrave P. How visual stimuli activate dopaminergic neurons at short latency. Science. 2005;307:1476–1479. doi: 10.1126/science.1107026. [DOI] [PubMed] [Google Scholar]
- Falls et al., 1983.Falls WM, Park MR, Kitai ST. An intracellular HRP study of the rat globus pallidus. II. Fine structural characteristics and synaptic connections of medially located large gp neurons. J Comp Neurol. 1983;221:229–245. doi: 10.1002/cne.902210210. [DOI] [PubMed] [Google Scholar]
- Floran et al., 1997.Floran B, Floran L, Sierra A, Aceves J. D2 receptor-mediated inhibition of GABA release by endogenous dopamine in the rat globus pallidus. Neurosci Lett. 1997;237:1–4. doi: 10.1016/s0304-3940(97)00784-2. [DOI] [PubMed] [Google Scholar]
- Flores-Hernandez et al., 1997.Flores-Hernandez J, Galarraga E, Bargas J. Dopamine selects glutamatergic inputs to neostriatal neurons. Synapse. 1997;25:185–195. doi: 10.1002/(SICI)1098-2396(199702)25:2<185::AID-SYN9>3.0.CO;2-8. [DOI] [PubMed] [Google Scholar]
- Frank, 2005.Frank MJ. Dynamic dopamine modulation in the basal ganglia: a neurocomputational account of cognitive deficits in medicated and nonmedicated parkinsonism. J Cogn Neurosci. 2005;17:51–72. doi: 10.1162/0898929052880093. [DOI] [PubMed] [Google Scholar]
- Frank et al., 2004.Frank MJ, Seeberger LC, O'Reilly RC. By carrot or by stick: cognitive reinforcement learning in parkinsonism. Science. 2004;306:1940–1943. doi: 10.1126/science.1102941. [DOI] [PubMed] [Google Scholar]
- Fujimoto and Kita, 1993.Fujimoto K, Kita H. Response characteristics of subthalamic neurons to the stimulation of the sensorimotor cortex in the rat. Brain Res. 1993;609:185–192. doi: 10.1016/0006-8993(93)90872-k. [DOI] [PubMed] [Google Scholar]
- Gerfen and Wilson, 1996.Gerfen C, Wilson C. The basal ganglia. In: Swanson L, Bjorklund A, Hokfelt T, editors. Handbook of chemical neuroanatomy, Vol 12, Integrated systems of the CNS, Pt III. Amsterdam: Elsevier; 1996. pp. 371–468. [Google Scholar]
- Gerfen et al., 1990.Gerfen C, Engber T, Mahan L, Susel Z, Chase T, Monsma F, Sibley D. D1 and D2 dopamine receptor-regulated gene expression of striatonigral and striatopallidal neurons. Science. 1990;250:1429–1432. doi: 10.1126/science.2147780. [DOI] [PubMed] [Google Scholar]
- Gerstner, 1999.Gerstner W. Maass W, Bishop CM. Pulsed neural networks. Cambridge, MA: MIT; 1999. Spiking neurons; pp. 3–53. [Google Scholar]
- Gillies and Arbuthnott, 2000.Gillies A, Arbuthnott G. Computational models of the basal ganglia. Mov Disord. 2000;15:762–770. doi: 10.1002/1531-8257(200009)15:5<762::aid-mds1002>3.0.co;2-2. [DOI] [PubMed] [Google Scholar]
- Gillies et al., 2002.Gillies A, Willshaw D, Li ZP. Subthalamic-pallidal interactions are critical in determining normal and abnormal functioning of the basal ganglia. Proc R Soc Lond B Biol Sci. 2002;269:545–551. doi: 10.1098/rspb.2001.1817. [DOI] [PMC free article] [PubMed] [Google Scholar]
- Girard et al., 2003.Girard B, Cuzin V, Guillot A, Gurney KN, Prescott TJ. A basal ganglia inspired model of action selection evaluated in a robotic survival task. J Integr Neurosci. 2003;2:179–200. doi: 10.1142/s0219635203000299. [DOI] [PubMed] [Google Scholar]
- Glynn and Ahmad, 2002.Glynn G, Ahmad SO. Three-dimensional electrophysiological topography of the rat corticostriatal system. J Comp Physiol A Neuroethol Sens Neural Behav Physiol. 2002;188:695–703. doi: 10.1007/s00359-002-0341-7. [DOI] [PubMed] [Google Scholar]
- Gonon, 1997.Gonon F. Prolonged and extrasynaptic excitatory action of dopamine mediated by D1 receptors in the rat striatum in vivo. J Neurosci. 1997;17:5972–5978. doi: 10.1523/JNEUROSCI.17-15-05972.1997. [DOI] [PMC free article] [PubMed] [Google Scholar]
- Gotz et al., 1997.Gotz T, Kraushaar U, Geiger J, Lubke J, Berger T, Jonas P. Functional properties of AMPA and NMDA receptors expressed in identified types of basal ganglia neurons. J Neurosci. 1997;17:204–215. doi: 10.1523/JNEUROSCI.17-01-00204.1997. [DOI] [PMC free article] [PubMed] [Google Scholar]
- Grace, 2002.Grace AA. Dopamine. In: Davis KL, Charney D, Coyle JT, Nemeroff C, editors. Neuropsychopharmacology: the fifth generation of progress. Philadelphia: Lippincott Williams and Wilkins; 2002. pp. 119–132. [Google Scholar]
- Graybiel, 1995.Graybiel AM. Building action repertoires: memory and learning functions of the basal ganglia. Curr Opin Neurobiol. 1995;5:733–741. doi: 10.1016/0959-4388(95)80100-6. [DOI] [PubMed] [Google Scholar]
- Gruber et al., 2003.Gruber AJ, Solla SA, Surmeier DJ, Houk JC. Modulation of striatal single units by expected reward: a spiny neuron model displaying dopamine-induced bistability. J Neurophysiol. 2003;90:1095–1114. doi: 10.1152/jn.00618.2002. [DOI] [PubMed] [Google Scholar]
- Gulley et al., 1999.Gulley JM, Kuwajima M, Mayhill E, Rebec GV. Behavior-related changes in the activity of substantia nigra pars reticulata neurons in freely moving rats. Brain Res. 1999;845:68–76. doi: 10.1016/s0006-8993(99)01932-0. [DOI] [PubMed] [Google Scholar]
- Gulley et al., 2002.Gulley JM, Kosobud AE, Rebec GV. Behavior-related modulation of substantia nigra pars reticulata neurons in rats performing a conditioned reinforcement task. Neuroscience. 2002;111:337–349. doi: 10.1016/s0306-4522(02)00018-0. [DOI] [PubMed] [Google Scholar]
- Gulley et al., 2004.Gulley JM, Reed JL, Kuwajima M, Rebec GV. Amphetamine-induced behavioral activation is associated with variable changes in basal ganglia output neurons recorded from awake, behaving rats. Brain Res. 2004;1012:108–118. doi: 10.1016/j.brainres.2004.03.044. [DOI] [PubMed] [Google Scholar]
- Gurney et al., 2001a.Gurney K, Prescott TJ, Redgrave P. A computational model of action selection in the basal ganglia. I. A new functional anatomy. Biol Cybern. 2001a;85:401–410. doi: 10.1007/PL00007984. [DOI] [PubMed] [Google Scholar]
- Gurney et al., 2001b.Gurney K, Prescott TJ, Redgrave P. A computational model of action selection in the basal ganglia. II. Analysis and simulation of behaviour. Biol Cybern. 2001b;85:411–423. doi: 10.1007/PL00007985. [DOI] [PubMed] [Google Scholar]
- Gurney et al., 2004a.Gurney K, Prescott TJ, Wickens JR, Redgrave P. Computational models of the basal ganglia: from robots to membranes. Trends Neurosci. 2004a;27:453–459. doi: 10.1016/j.tins.2004.06.003. [DOI] [PubMed] [Google Scholar]
- Gurney et al., 2004b.Gurney K, Humphries M, Wood R, Prescott TJ, Redgrave P. Testing computational hypotheses of brain systems function using high level models: a case study with the basal ganglia. Network. 2004b;15:263–290. [PubMed] [Google Scholar]
- Gurney et al., 2005.Gurney KN, Humphries MD, Stewart RD. A spiking neuron model of basal ganglia for action selection can account for dopamine-modulated oscillatory phenomena. Soc Neurosci Abstr. 2005;31:517–9. [Google Scholar]
- Haber, 2003.Haber SN. The primate basal ganglia: parallel and integrative networks. J Chem Neuroanat. 2003;26:317–330. doi: 10.1016/j.jchemneu.2003.10.003. [DOI] [PubMed] [Google Scholar]
- Hallworth et al., 2003.Hallworth NE, Wilson CJ, Bevan MD. Apamin-sensitive small conductance calcium-activated potassium channels, through their selective coupling to voltage-gated calcium channels, are critical determinants of the precision, pace, and pattern of action potential generation in rat subthalamic nucleus neurons in vitro. J Neurosci. 2003;23:7525–7542. doi: 10.1523/JNEUROSCI.23-20-07525.2003. [DOI] [PMC free article] [PubMed] [Google Scholar]
- Hanson et al., 2004.Hanson JE, Smith Y, Jaeger D. Sodium channels and dendritic spike initiation at excitatory synapses in globus pallidus neurons. J Neurosci. 2004;24:329–340. doi: 10.1523/JNEUROSCI.3937-03.2004. [DOI] [PMC free article] [PubMed] [Google Scholar]
- Hara and Harris, 2002.Hara K, Harris RA. The anesthetic mechanism of urethane: the effects on neurotransmitter-gated ion channels. Anesth Analg. 2002;94:313–318. doi: 10.1097/00000539-200202000-00015. [DOI] [PubMed] [Google Scholar]
- Hernandez-Lopez et al., 1997.Hernandez-Lopez S, Bargas J, Surmeier DJ, Reyes A, Galarraga E. D1 receptor activation enhances evoked discharge in neostriatal medium spiny neurons by modulating an L-type Ca2+ conductance. J Neurosci. 1997;17:3334–3342. doi: 10.1523/JNEUROSCI.17-09-03334.1997. [DOI] [PMC free article] [PubMed] [Google Scholar]
- Hikosaka et al., 2000.Hikosaka O, Takikawa Y, Kawagoe R. Role of the basal ganglia in the control of purposive saccadic eye movements. Physiol Rev. 2000;80:953–978. doi: 10.1152/physrev.2000.80.3.953. [DOI] [PubMed] [Google Scholar]
- Hoover and Marshall, 2004.Hoover BR, Marshall JF. Molecular, chemical, and anatomical characterization of globus pallidus dopamine D2 receptor mRNA-containing neurons. Synapse. 2004;52:100–113. doi: 10.1002/syn.20007. [DOI] [PubMed] [Google Scholar]
- Houk, 2005.Houk JC. Agents of the mind. Biol Cybern. 2005;92:427–437. doi: 10.1007/s00422-005-0569-8. [DOI] [PubMed] [Google Scholar]
- Houk and Wise, 1995.Houk JC, Wise SP. Distributed modular architectures linking basal ganglia, cerebellum, and cerebral cortex: their role in planning and controlling action. Cereb Cortex. 1995;5:95–110. doi: 10.1093/cercor/5.2.95. [DOI] [PubMed] [Google Scholar]
- Humphries and Gurney, 2001.Humphries MD, Gurney K. A pulsed neural network model of bursting in the basal ganglia. Neural Netw. 2001;14:845–863. doi: 10.1016/s0893-6080(01)00060-0. [DOI] [PubMed] [Google Scholar]
- Humphries and Gurney, 2002.Humphries MD, Gurney K. The role of intra-thalamic and thalamocortical circuits in action selection. Network. 2002;13:131–156. [PubMed] [Google Scholar]
- Humphries and Gurney, 2006.Humphries MD, Gurney K. A means to an end: validating models by fitting experimental data. Neurocomputing. 2006 in press. [Google Scholar]
- Humphries et al., 2004.Humphries MD, Gurney K, Stewart R, Prescott TJ, Redgrave P. A spiking neuron model of basal ganglia demonstrating plausible selection and switching. Presented at the Eighth Meeting of the International Banglia Society, Crieff, UK, September. 2004.
- Hutchison et al., 2004.Hutchison WD, Dostrovsky JO, Walters JR, Courtemanche R, Boraud T, Goldberg J, Brown P. Neuronal oscillations in the basal ganglia and movement disorders: evidence from whole animal and human recordings. J Neurosci. 2004;24:9240–9243. doi: 10.1523/JNEUROSCI.3366-04.2004. [DOI] [PMC free article] [PubMed] [Google Scholar]
- Jarvis and Mitra, 2001.Jarvis MR, Mitra PP. Sampling properties of the spectrum and coherency of sequences of action potentials. Neural Comput. 2001;13:717–749. doi: 10.1162/089976601300014312. [DOI] [PubMed] [Google Scholar]
- Jiang and North, 1991.Jiang ZG, North RA. Membrane properties and synaptic responses of rat striatal neurones in vitro. J Physiol (Lond) 1991;443:533–553. doi: 10.1113/jphysiol.1991.sp018850. [DOI] [PMC free article] [PubMed] [Google Scholar]
- Joel and Weiner, 2000.Joel D, Weiner I. The connections of the dopaminergic system with the striatum in rats and primates: an analysis with respect to the functional and compartmental organization of the striatum. Neuroscience. 2000;96:451–474. doi: 10.1016/s0306-4522(99)00575-8. [DOI] [PubMed] [Google Scholar]
- Johnson and Napier, 1997.Johnson PI, Napier TC. GABA- and glutamate-evoked responses in the rat ventral pallidum are modulated by dopamine. Eur J Neurosci. 1997;9:1397–1406. doi: 10.1111/j.1460-9568.1997.tb01494.x. [DOI] [PubMed] [Google Scholar]
- Kaneda et al., 2002.Kaneda K, Nambu A, Tokuno H, Takada M. Differential processing patterns of motor information via striatopallidal and striatonigral projections. J Neurophysiol. 2002;88:1420–1432. doi: 10.1152/jn.2002.88.3.1420. [DOI] [PubMed] [Google Scholar]
- Kasanetz et al., 2002.Kasanetz F, Riquelme LA, Murer MG. Disruption of the two-state membrane potential of striatal neurones during cortical desynchronisation in anaesthetised rats. J Physiol (Lond) 2002;543:577–589. doi: 10.1113/jphysiol.2002.0024786. [DOI] [PMC free article] [PubMed] [Google Scholar]
- Kirik et al., 1998.Kirik D, Rosenblad C, Bjorklund A. Characterization of behavioral and neurodegenerative changes following partial lesions of the nigrostriatal dopamine system induced by intrastriatal 6-hydroxydopamine in the rat. Exp Neurol. 1998;152:259–277. doi: 10.1006/exnr.1998.6848. [DOI] [PubMed] [Google Scholar]
- Kita and Kitai, 1991.Kita H, Kitai ST. Intracellular study of rat globus pallidus neurons: membrane properties and responses to neostriatal, subthalamic and nigral stimulation. Brain Res. 1991;564:296–305. doi: 10.1016/0006-8993(91)91466-e. [DOI] [PubMed] [Google Scholar]
- Kita and Kitai, 1994.Kita H, Kitai ST. The morphology of globus pallidus projection neurons in the rat: an intracellular staining study. Brain Res. 1994;636:308–319. doi: 10.1016/0006-8993(94)91030-8. [DOI] [PubMed] [Google Scholar]
- Kita et al., 1983a.Kita H, Chang HT, Kitai ST. The morphology of intracellularly labeled rat subthalamic neurons: a light microscopic analysis. J Comp Neurol. 1983a;215:245–257. doi: 10.1002/cne.902150302. [DOI] [PubMed] [Google Scholar]
- Kita et al., 1983b.Kita H, Chang HT, Kitai ST. Pallidal inputs to subthalamus: intracellular analysis. Brain Res. 1983b;264:255–265. doi: 10.1016/0006-8993(83)90823-5. [DOI] [PubMed] [Google Scholar]
- Kita et al., 2004.Kita H, Nambu A, Kaneda K, Tachibana Y, Takada M. Role of ionotropic glutamatergic and GABAergic inputs on the firing activity of neurons in the external pallidum in awake monkeys. J Neurophysiol. 2004;92:3069–3084. doi: 10.1152/jn.00346.2004. [DOI] [PubMed] [Google Scholar]
- Kreiss et al., 1997.Kreiss DS, Mastropietro CW, Rawji SS, Walters JR. The response of subthalamic nucleus neurons to dopamine receptor stimulation in a rodent model of Parkinson's disease. J Neurosci. 1997;17:6807–6819. doi: 10.1523/JNEUROSCI.17-17-06807.1997. [DOI] [PMC free article] [PubMed] [Google Scholar]
- Leblois et al., 2006.Leblois A, Boraud T, Meissner W, Bergman H, Hansel D. Competition between feedback loops underlies normal and pathological dynamics in the basal ganglia. J Neurosci. 2006;26:3567–3583. doi: 10.1523/JNEUROSCI.5050-05.2006. [DOI] [PMC free article] [PubMed] [Google Scholar]
- MacKay, 1997.MacKay WA. Synchonized neuronal oscillations and their role in motor processes. Trends Cogn Sci. 1997;1:176–183. doi: 10.1016/S1364-6613(97)01059-0. [DOI] [PubMed] [Google Scholar]
- Magill et al., 2000.Magill PJ, Bolam JP, Bevan MD. Relationship of activity in the subthalamic nucleus–globus pallidus network to cortical electroencephalogram. J Neurosci. 2000;20:820–833. doi: 10.1523/JNEUROSCI.20-02-00820.2000. [DOI] [PMC free article] [PubMed] [Google Scholar]
- Magill et al., 2001.Magill PJ, Bolam JP, Bevan MD. Dopamine regulates the impact of the cerebral cortex on the subthalamic nucleus-globus pallidus network. Neuroscience. 2001;106:313–330. doi: 10.1016/s0306-4522(01)00281-0. [DOI] [PubMed] [Google Scholar]
- Magill et al., 2004a.Magill PJ, Sharott A, Bevan MD, Brown P, Bolam JP. Synchronous unit activity and local field potentials evoked in the subthalamic nucleus by cortical stimulation. J Neurophysiol. 2004a;92:700–714. doi: 10.1152/jn.00134.2004. [DOI] [PubMed] [Google Scholar]
- Magill et al., 2004b.Magill PJ, Sharott A, Bolam JP, Brown P. Brain state-dependency of coherent oscillatory activity in the cerebral cortex and basal ganglia of the rat. J Neurophysiol. 2004b;92:2122–2136. doi: 10.1152/jn.00333.2004. [DOI] [PubMed] [Google Scholar]
- Mahon et al., 2001.Mahon S, Deniau JM, Charpier S. Relationship between EEG potentials and intracellular activity of striatal and cortico-striatal neurons: an in vivo study under different anesthetics. Cereb Cortex. 2001;11:360–373. doi: 10.1093/cercor/11.4.360. [DOI] [PubMed] [Google Scholar]
- Mahon et al., 2003.Mahon S, Deniau JM, Charpier S. Various synaptic activities and firing patterns in cortico-striatal and striatal neurons in vivo. J Physiol (Paris) 2003;97:557–566. doi: 10.1016/j.jphysparis.2004.01.013. [DOI] [PubMed] [Google Scholar]
- Mahon et al., 2004.Mahon S, Deniau JM, Charpier S. Corticostriatal plasticity: life after the depression. Trends Neurosci. 2004;27:460–467. doi: 10.1016/j.tins.2004.06.010. [DOI] [PubMed] [Google Scholar]
- Mailly et al., 2003.Mailly P, Charpier S, Menetrey A, Deniau JM. Three-dimensional organization of the recurrent axon collateral network of the substantia nigra pars reticulata neurons in the rat. J Neurosci. 2003;23:5247–5257. doi: 10.1523/JNEUROSCI.23-12-05247.2003. [DOI] [PMC free article] [PubMed] [Google Scholar]
- Manwani and Koch, 1999.Manwani A, Koch C. Detecting and estimating signals in noisy cable structures. I. Neuronal noise sources. Neural Comput. 1999;11:1797–1829. doi: 10.1162/089976699300015972. [DOI] [PubMed] [Google Scholar]
- Maurice et al., 1997.Maurice N, Deniau JM, Menetrey A, Glowinski J, Thierry AM. Position of the ventral pallidum in the rat prefrontal cortex-basal ganglia circuit. Neuroscience. 1997;80:523–534. doi: 10.1016/s0306-4522(97)00002-x. [DOI] [PubMed] [Google Scholar]
- Middleton and Strick, 2000.Middleton FA, Strick PL. Basal ganglia and cerebellar loops: motor and cognitive circuits. Brain Res Brain Res Rev. 2000;31:236–250. doi: 10.1016/s0165-0173(99)00040-5. [DOI] [PubMed] [Google Scholar]
- Mink and Thach, 1993.Mink JW, Thach WT. Basal ganglia intrinsic circuits and their role in behavior. Curr Opin Neurobiol. 1993;3:950–957. doi: 10.1016/0959-4388(93)90167-w. [DOI] [PubMed] [Google Scholar]
- Morris et al., 2003.Morris G, Nevet A, Bergman H. Anatomical funneling, sparse connectivity and redundancy reduction in the neural networks of the basal ganglia. J Physiol (Paris) 2003;97:581–589. doi: 10.1016/j.jphysparis.2004.01.015. [DOI] [PubMed] [Google Scholar]
- Murer et al., 2000.Murer MG, Dziewczapolski G, Salin P, Vila M, Tseng KY, Ruberg M, Rubinstein M, Kelly MA, Grandy DK, Low MJ, Hirsch E, Raisman-Vozari R, Gershanik O. The indirect basal ganglia pathway in dopamine D2 receptor-deficient mice. Neuroscience. 2000;99:643–650. doi: 10.1016/s0306-4522(00)00223-2. [DOI] [PubMed] [Google Scholar]
- Nakanishi et al., 1987.Nakanishi H, Kita H, Kitai ST. Intracellular study of rat substantia nigra pars reticulata neurons in an in vitro slice preparation: electrical membrane properties and response characteristics to subthalamic stimulation. Brain Res. 1987;437:45–55. doi: 10.1016/0006-8993(87)91525-3. [DOI] [PubMed] [Google Scholar]
- Nakanishi et al., 1991.Nakanishi H, Kita H, Kitai ST. Intracellular study of rat entopeduncular nucleus neurons in an in vitro slice preparation: response to subthalamic stimulation. Brain Res. 1991;549:285–291. doi: 10.1016/0006-8993(91)90469-c. [DOI] [PubMed] [Google Scholar]
- Nakanishi et al., 1997.Nakanishi H, Tamura A, Kawai K, Yamamoto K. Electrophysiological studies of rat substantia nigra neurons in an in vitro slice preparation after middle cerebral artery occlusion. Neuroscience. 1997;77:1021–1028. doi: 10.1016/s0306-4522(96)00555-6. [DOI] [PubMed] [Google Scholar]
- Nambu and Llinas, 1994.Nambu A, Llinas R. Electrophysiology of globus pallidus neurons in vitro. J Neurophysiol. 1994;72:1127–1139. doi: 10.1152/jn.1994.72.3.1127. [DOI] [PubMed] [Google Scholar]
- Nambu et al., 2002.Nambu A, Tokuno H, Takada M. Functional significance of the cortico-subthalamopallidal “hyperdirect” pathway. Neurosci Res. 2002;43:111–117. doi: 10.1016/s0168-0102(02)00027-5. [DOI] [PubMed] [Google Scholar]
- Nawrot et al., 1999.Nawrot M, Aertsen A, Rotter S. Single-trial estimation of neuronal firing rates: from single-neuron spike trains to population activity. J Neurosci Methods. 1999;94:81–92. doi: 10.1016/s0165-0270(99)00127-2. [DOI] [PubMed] [Google Scholar]
- Nicola et al., 2000.Nicola SM, Surmeier J, Malenka RC. Dopaminergic modulation of neuronal excitability in the striatum and nucleus accumbens. Annu Rev Neurosci. 2000;23:185–215. doi: 10.1146/annurev.neuro.23.1.185. [DOI] [PubMed] [Google Scholar]
- Nicola et al., 2004.Nicola SM, Woodward Hopf F, Hjelmstad GO. Contrast enhancement: a physiological effect of striatal dopamine? Cell Tissue Res. 2004;318:93–106. doi: 10.1007/s00441-004-0929-z. [DOI] [PubMed] [Google Scholar]
- Nisenbaum and Wilson, 1995.Nisenbaum ES, Wilson CJ. Potassium currents responsible for inward and outward rectification in rat neostriatal spiny projection neurons. J Neurosci. 1995;15:4449–4463. doi: 10.1523/JNEUROSCI.15-06-04449.1995. [DOI] [PMC free article] [PubMed] [Google Scholar]
- O'Connor, 1998.O'Connor WT. Functional neuroanatomy of the basal ganglia as studied by dual-probe microdialysis. Nucl Med Biol. 1998;25:743–746. doi: 10.1016/s0969-8051(98)00066-3. [DOI] [PubMed] [Google Scholar]
- Olsson et al., 1995.Olsson M, Nikkhah G, Bentlage C, Bjorklund A. Forelimb akinesia in the rat Parkinson model: differential effects of dopamine agonists and nigral transplants as assessed by a new stepping test. J Neurosci. 1995;15:3863–3875. doi: 10.1523/JNEUROSCI.15-05-03863.1995. [DOI] [PMC free article] [PubMed] [Google Scholar]
- Oorschot, 1996.Oorschot DE. Total number of neurons in the neostriatal, pallidal, subthalamic, and substantia nigral nuclei of the rat basal ganglia: a stereological study using the cavalieri and optical disector methods. J Comp Neurol. 1996;366:580–599. doi: 10.1002/(SICI)1096-9861(19960318)366:4<580::AID-CNE3>3.0.CO;2-0. [DOI] [PubMed] [Google Scholar]
- Otsuka et al., 2001.Otsuka T, Murakami F, Song WJ. Excitatory postsynaptic potentials trigger a plateau potential in rat subthalamic neurons at hyperpolarized states. J Neurophysiol. 2001;86:1816–1825. doi: 10.1152/jn.2001.86.4.1816. [DOI] [PubMed] [Google Scholar]
- Overton and Greenfield, 1995.Overton PG, Greenfield SA. Determinants of neuronal firing pattern in the guinea-pig subthalamic nucleus: an in vivo and in vitro comparison. J Neural Transm Park Dis Dement Sect. 1995;10:41–54. doi: 10.1007/BF02256628. [DOI] [PubMed] [Google Scholar]
- Parent and Hazrati, 1995.Parent A, Hazrati LN. Functional anatomy of the basal ganglia. II. The place of subthalamic nucleus and external pallidum in basal ganglia circuitry. Brain Res Brain Res Rev. 1995;20:128–154. doi: 10.1016/0165-0173(94)00008-d. [DOI] [PubMed] [Google Scholar]
- Paz et al., 2005.Paz JT, Deniau JM, Charpier S. Rhythmic bursting in the cortico-subthalamopallidal network during spontaneous genetically determined spike and wave discharges. J Neurosci. 2005;25:2092–2101. doi: 10.1523/JNEUROSCI.4689-04.2005. [DOI] [PMC free article] [PubMed] [Google Scholar]
- Phillips and Brown, 1999.Phillips JM, Brown VJ. Reaction time performance following unilateral striatal dopamine depletion and lesions of the subthalamic nucleus in the rat. Eur J Neurosci. 1999;11:1003–1010. [PubMed] [Google Scholar]
- Plenz and Kitai, 1999.Plenz D, Kitai ST. A basal ganglia pacemaker formed by the subthalamic nucleus and external globus pallidus. Nature. 1999;400:677–682. doi: 10.1038/23281. [DOI] [PubMed] [Google Scholar]
- Prescott et al., 1999.Prescott TJ, Redgrave P, Gurney K. Layered control architectures in robots and vertebrates. Adapt Behav. 1999;7:99–127. [Google Scholar]
- Prescott et al., 2006.Prescott TJ, Montes Gonzalez FM, Gurney K, Humphries MD, Redgrave P. A robot model of the basal ganglia: behavior and intrinsic processing. Neural Netw. 2006;19:31–61. doi: 10.1016/j.neunet.2005.06.049. [DOI] [PubMed] [Google Scholar]
- Querejeta et al., 2001.Querejeta E, Delgado A, Valdiosera R, Erlij D, Aceves J. Intrapallidal D2 dopamine receptors control globus pallidus neuron activity in the rat. Neurosci Lett. 2001;300:79–82. doi: 10.1016/s0304-3940(01)01550-6. [DOI] [PubMed] [Google Scholar]
- Raz et al., 2000.Raz A, Vaadia E, Bergman H. Firing patterns and correlations of spontaneous discharge of pallidal neurons in the normal and the tremulous 1-methyl-4-phenyl-1,2,3,6-tetrahydropyridine vervet model of parkinsonism. J Neurosci. 2000;20:8559–8571. doi: 10.1523/JNEUROSCI.20-22-08559.2000. [DOI] [PMC free article] [PubMed] [Google Scholar]
- Redgrave et al., 1999.Redgrave P, Prescott TJ, Gurney K. The basal ganglia: A vertebrate solution to the selection problem? Neuroscience. 1999;89:1009–1023. doi: 10.1016/s0306-4522(98)00319-4. [DOI] [PubMed] [Google Scholar]
- Rick and Lacey, 1994.Rick CE, Lacey MG. Rat substantia nigra pars reticulata neurones are tonically inhibited via GABAA, but not GABAB, receptors in vitro. Brain Res. 1994;659:133–137. doi: 10.1016/0006-8993(94)90872-9. [DOI] [PubMed] [Google Scholar]
- Romanelli et al., 2005.Romanelli P, Esposito V, Schaal DW, Heit G. Somatotopy in the basal ganglia: experimental and clinical evidence for segregated sensorimotor channels. Brain Res Brain Res Rev. 2005;48:112–128. doi: 10.1016/j.brainresrev.2004.09.008. [DOI] [PubMed] [Google Scholar]
- Rubchinsky et al., 2003.Rubchinsky LL, Kopell N, Sigvardt KA. Modeling facilitation and inhibition of competing motor programs in basal ganglia subthalamic nucleus-pallidal circuits. Proc Natl Acad Sci USA. 2003;100:14427–14432. doi: 10.1073/pnas.2036283100. [DOI] [PMC free article] [PubMed] [Google Scholar]
- Sadek et al., 2005.Sadek A-R, Magill PJ, Bolam JP. Local connectivity between neurons of the rat globus pallidus. In: Bolam JP, Ingham CA, Magill PJ, editors. The basal ganglia VIII. New York: Springer; 2005. pp. 611–619. [Google Scholar]
- Sandstrom and Rebec, 2003.Sandstrom MI, Rebec GV. Characterization of striatal activity in conscious rats: contribution of NMDA and AMPA/kainate receptors to both spontaneous and glutamate-driven firing. Synapse. 2003;47:91–100. doi: 10.1002/syn.10142. [DOI] [PubMed] [Google Scholar]
- Sano et al., 2003.Sano H, Yasoshima Y, Matsushita N, Kaneko T, Kohno K, Pastan I, Kobayashi K. Conditional ablation of striatal neuronal types containing dopamine D2 receptor disturbs coordination of basal ganglia function. J Neurosci. 2003;23:9078–9088. doi: 10.1523/JNEUROSCI.23-27-09078.2003. [DOI] [PMC free article] [PubMed] [Google Scholar]
- Scargle, 1982.Scargle JD. Studies in astonomical time series analysis. II. Statistical aspects of spectral analysis of unevenly spaced data. Astrophys J. 1982;263:835–853. [Google Scholar]
- Schultz, 1998.Schultz W. Predictive reward signal of dopamine neurons. J Neurophysiol. 1998;80:1–27. doi: 10.1152/jn.1998.80.1.1. [DOI] [PubMed] [Google Scholar]
- Segev, 1995.Segev I. Dendritic processing. In: Arbib MA, editor. The handbook of brain theory and neural networks. Cambridge, MA: MIT; 1995. pp. 282–289. [Google Scholar]
- Shen and Johnson, 2000.Shen KZ, Johnson SW. Presynaptic dopamine D2 and muscarine M3 receptors inhibit excitatory and inhibitory transmission to rat subthalamic neurones in vitro. J Physiol (Lond) 2000;525:331–341. doi: 10.1111/j.1469-7793.2000.00331.x. [DOI] [PMC free article] [PubMed] [Google Scholar]
- Shepherd and Brayton, 1987.Shepherd GM, Brayton RK. Logic operations are properties of computer-simulated interaction between excitable dendritic spines. Neuroscience. 1987;21:151–165. doi: 10.1016/0306-4522(87)90329-0. [DOI] [PubMed] [Google Scholar]
- Shink et al., 1996.Shink E, Bevan MD, Bolam JP, Smith Y. The subthalamic nucleus and the external pallidum: two tightly interconnected structures that control the output of the basal ganglia in the monkey. Neuroscience. 1996;73:335–357. doi: 10.1016/0306-4522(96)00022-x. [DOI] [PubMed] [Google Scholar]
- Smith and Bolam, 1989.Smith Y, Bolam JP. Neurons of the substantia nigra reticulata receive a dense GABA- containing input from the globus pallidus in the rat. Brain Res. 1989;493:160–167. doi: 10.1016/0006-8993(89)91011-1. [DOI] [PubMed] [Google Scholar]
- Smith et al., 1998.Smith Y, Bevan MD, Shink E, Bolam JP. Microcircuitry of the direct and indirect pathways of the basal ganglia. Neuroscience. 1998;86:353–387. doi: 10.1016/s0306-4522(98)00004-9. [DOI] [PubMed] [Google Scholar]
- Smith et al., 2004.Smith Y, Raju DV, Pare JF, Sidibe M. The thalamostriatal system: a highly specific network of the basal ganglia circuitry. Trends Neurosci. 2004;27:520–527. doi: 10.1016/j.tins.2004.07.004. [DOI] [PubMed] [Google Scholar]
- Somogyi et al., 1979.Somogyi P, Hodgson AJ, Smith AD. An approach to tracing neuron networks in the cerebral cortex and basal ganglia. Combination of Golgi staining, retrograde transport of horseradish peroxidase and anterograde degeneration of synaptic boutons in the same material. Neuroscience. 1979;4:1805–1852. doi: 10.1016/0306-4522(79)90059-9. [DOI] [PubMed] [Google Scholar]
- Song et al., 2000.Song WJ, Baba Y, Otsuka T, Murakami F. Characterization of Ca2+ channels in rat subthalamic nucleus neurons. J Neurophysiol. 2000;84:2630–2637. doi: 10.1152/jn.2000.84.5.2630. [DOI] [PubMed] [Google Scholar]
- Spirduso et al., 1985.Spirduso WW, Gilliam PE, Schallert T, Upchurch M, Vaughn DM, Wilcox RE. Reactive capacity: a sensitive behavioral marker of movement initiation and nigrostriatal dopamine function. Brain Res. 1985;335:45–54. doi: 10.1016/0006-8993(85)90274-4. [DOI] [PubMed] [Google Scholar]
- Stanford, 2003.Stanford IM. Independent neuronal oscillators of the rat globus pallidus. J Neurophysiol. 2003;89:1713–1717. doi: 10.1152/jn.00864.2002. [DOI] [PubMed] [Google Scholar]
- Steriade et al., 1993.Steriade M, Nunez A, Amzica F. A novel slow (<1 Hz) oscillation of neocortical neurons in vivo: depolarizing and hyperpolarizing components. J Neurosci. 1993;13:3252–3265. doi: 10.1523/JNEUROSCI.13-08-03252.1993. [DOI] [PMC free article] [PubMed] [Google Scholar]
- Steriade et al., 2001.Steriade M, Timofeev I, Grenier F. Natural waking and sleep states: a view from inside neocortical neurons. J Neurophysiol. 2001;85:1969–1985. doi: 10.1152/jn.2001.85.5.1969. [DOI] [PubMed] [Google Scholar]
- Stern et al., 1997.Stern EA, Kincaid AE, Wilson CJ. Spontaneous subthreshold membrane potential fluctuations and action potential variability of rat corticostriatal and striatal neurons in vivo. J Neurophysiol. 1997;77:1697–1715. doi: 10.1152/jn.1997.77.4.1697. [DOI] [PubMed] [Google Scholar]
- Surmeier et al., 1996.Surmeier DJ, Song WJ, Yan Z. Coordinated expression of dopamine receptors in neostriatal medium spiny neurons. J Neurosci. 1996;16:6579–6591. doi: 10.1523/JNEUROSCI.16-20-06579.1996. [DOI] [PMC free article] [PubMed] [Google Scholar]
- Surmeier et al., 2005.Surmeier DJ, Mercer JN, Chan CS. Autonomous pacemakers in the basal ganglia: who needs excitatory synapses anyway? Curr Opin Neurobiol. 2005;15:312–318. doi: 10.1016/j.conb.2005.05.007. [DOI] [PubMed] [Google Scholar]
- Temel et al., 2005.Temel Y, Blokland A, Steinbusch HW, Visser-Vandewalle V. The functional role of the subthalamic nucleus in cognitive and limbic circuits. Prog Neurobiol. 2005;76:393–413. doi: 10.1016/j.pneurobio.2005.09.005. [DOI] [PubMed] [Google Scholar]
- Tepper et al., 2004.Tepper JM, Koos T, Wilson CJ. GABAergic microcircuits in the neostriatum. Trends Neurosci. 2004;27:662–669. doi: 10.1016/j.tins.2004.08.007. [DOI] [PubMed] [Google Scholar]
- Terman et al., 2002.Terman D, Rubin JE, Yew AC, Wilson CJ. Activity patterns in a model for the subthalamopallidal network of the basal ganglia. J Neurosci. 2002;22:2963–2976. doi: 10.1523/JNEUROSCI.22-07-02963.2002. [DOI] [PMC free article] [PubMed] [Google Scholar]
- Ulrich, 2003.Ulrich D. Differential arithmetic of shunting inhibition for voltage and spike rate in neo-cortical pyramidal cells. Eur J Neurosci. 2003;18:2159–2165. doi: 10.1046/j.1460-9568.2003.02942.x. [DOI] [PubMed] [Google Scholar]
- Urbain et al., 2000.Urbain N, Gervasoni D, Souliere F, Lobo L, Rentero N, Windels F, Astier B, Savasta M, Fort P, Renaud B, Luppi PH, Chouvet G. Unrelated course of subthalamic nucleus and globus pallidus neuronal activities across vigilance states in the rat. Eur J Neurosci. 2000;12:3361–3374. doi: 10.1046/j.1460-9568.2000.00199.x. [DOI] [PubMed] [Google Scholar]
- Venance et al., 2004.Venance L, Glowinski J, Giaume C. Electrical and chemical transmission between striatal GABAergic output neurones in rat brain slices. J Physiol (Lond) 2004;559:215–230. doi: 10.1113/jphysiol.2004.065672. [DOI] [PMC free article] [PubMed] [Google Scholar]
- von Krosigk et al., 1992.von Krosigk M, Smith Y, Bolam JP, Smith AD. Synaptic organization of GABAergic inputs from the striatum and the globus pallidus onto neurons in the substantia nigra and retrorubral field which project to the medullary reticular formation. Neuroscience. 1992;50:531–549. doi: 10.1016/0306-4522(92)90445-8. [DOI] [PubMed] [Google Scholar]
- Wang and Rebec, 1993.Wang Z, Rebec GV. Neuronal and behavioral correlates of intrastriatal infusions of amphetamine in freely moving rats. Brain Res. 1993;627:79–88. doi: 10.1016/0006-8993(93)90751-8. [DOI] [PubMed] [Google Scholar]
- Waszczak et al., 2001.Waszczak BL, Martin L, Boucher N, Zahr N, Sikes RW, Stellar JR. Electrophysiological and behavioral output of the rat basal ganglia after intrastriatal infusion of d-amphetamine: lack of support for the basal ganglia model. Brain Res. 2001;920:170–182. doi: 10.1016/s0006-8993(01)03059-1. [DOI] [PubMed] [Google Scholar]
- Waszczak et al., 2002.Waszczak BL, Martin LP, Finlay HE, Zahr N, Stellar JR. Effects of individual and concurrent stimulation of striatal D1 and D2 dopamine receptors on electrophysiological and behavioral output from rat basal ganglia. J Pharmacol Exp Ther. 2002;300:850–861. doi: 10.1124/jpet.300.3.850. [DOI] [PubMed] [Google Scholar]
- West and Grace, 2002.West AR, Grace AA. Opposite influences of endogenous dopamine D1 and D2 receptor activation on activity states and electrophysiological properties of striatal neurons: studies combining in vivo intracellular recordings and reverse microdialysis. J Neurosci. 2002;22:294–304. doi: 10.1523/JNEUROSCI.22-01-00294.2002. [DOI] [PMC free article] [PubMed] [Google Scholar]
- Williams and Faull, 1985.Williams MN, Faull RL. The striatonigral projection and nigrotectal neurons in the rat. A correlated light and electron microscopic study demonstrating a monosynaptic striatal input to identified nigrotectal neurons using a combined degeneration and horseradish peroxidase. Neuroscience. 1985;14:991–1010. doi: 10.1016/0306-4522(85)90271-4. [DOI] [PubMed] [Google Scholar]
- Wilson and Kawaguchi, 1996.Wilson CJ, Kawaguchi Y. The origins of two-state spontaneous membrane potential fluctuations of neostriatal spiny neurons. J Neurosci. 1996;16:2397–2410. doi: 10.1523/JNEUROSCI.16-07-02397.1996. [DOI] [PMC free article] [PubMed] [Google Scholar]
- Wilson et al., 2004.Wilson CL, Puntis M, Lacey MG. Overwhelmingly asynchronous firing of rat subthalamic nucleus neurones in brain slices provides little evidence for intrinsic interconnectivity. Neuroscience. 2004;123:187–200. doi: 10.1016/j.neuroscience.2003.09.008. [DOI] [PubMed] [Google Scholar]
- Windels and Kiyatkin, 2004.Windels F, Kiyatkin EA. GABA, not glutamate, controls the activity of substantia nigra reticulata neurons in awake, unrestrained rats. J Neurosci. 2004;24:6751–6754. doi: 10.1523/JNEUROSCI.1528-04.2004. [DOI] [PMC free article] [PubMed] [Google Scholar]