Abstract
Depletion of oxygen levels is a well-accepted model for induction of non-replicating, persistent states in mycobacteria. Increasing the stress levels in mycobacterium bacilli facilitates their entry into a non-cultivable, dormant state. In this study, it was shown that diphenyleneiodonium, an inhibitor of NADH oxidase, induced a viable, but non-culturable state in mycobacteria, having similar features to dormant bacilli, like loss of acid-fastness, upregulation of stress-regulated genes and decreased superoxide levels as compared to actively growing bacilli. Comprehensive, untargeted metabolic profiling also confirmed a decrease in biogenesis of amino acids, NAD, unsaturated fatty acids and nucleotides. Additionally, an increase in the level of lactate, fumarate, succinate and pentose phosphate pathways along with increased mycothiol and sulfate metabolites, similar to dormant bacilli, was observed in the granuloma. These non-cultivable bacilli were resuscitated by supplementation of fetal bovine serum, regaining their culturability in liquid as well as on agar medium. This study focused on the effect of diphenyleneiodonium treatment in causing mycobacteria to rapidly transition from an active state into a viable, but non-cultivable state, and comparing their characteristics with dormant phenotypes.
1. Introduction
Mycobacterium tuberculosis (Mtb) is a pathogen that develops latent phenotypes inside the host and causes tuberculosis (TB). A literature survey revealed that induction of a dormant or non-replicating persistent state in mycobacteria might be due to various kinds of stress such as oxygen limitation, nutrient starvation and multiple stresses [1–3]. The dormant form of Mtb cells can persist for many years inside the host, causing latent phase TB, before their transition into actively dividing bacilli and development of active TB symptoms, which is a major challenge for clinical treatment [4]. Two dormancy phenomena have been described in non-sporulating bacteria: the viable but non-culturable (VBNC) state, and bacterial persistence [5]. Additionally, the Cornell model, a long post-stationary phase, and potassium deficiency model have been reported in the VBNC state of Mtb [4, 6–7]. Furthermore, it has also been observed that persistent populations of Mtb in sputum can grow in liquid but not on solid culture media [8]. Persistent organisms are in a state of dormancy, defined as ‘a reversible state of low metabolic activity, in which cells can persist for extended periods without division’ [9]. In addition, treatment with antibiotics in Mtb-infected mice showed that the number of culturable cells extracted from organs had ‘zero’ colony-forming units (CFU) [10]. Therefore, the formation of a VBNC state after a few days of drug treatment has raised attention in mycobacterial pathogenesis [10]. However, understanding of persistent mycobacteria is still insufficient, mainly due to the presumably very low numbers of such organisms and the lack of clear indication of their precise localization in the living tissue of the host [11]. Thus, there is a need to understand the knowledge gap between the transition of Mtb from the dormant to the VBNC state and its subsequent resuscitation on media.
Decreased oxygen levels in dormancy have been well established with greater acceptance of in vitro models, as their characteristics resemble the latent bacilli present in host tissues, i.e., granulomas [12–13]. Ascorbic acid (10 mM), an antioxidant also reported to induce dormancy and VBNC phenotypes in Mtb [14–15], indicates the role of reactive oxygen species (ROS) scavenging during the development of a dormant form. Superoxide, a reactive oxygen species generated during electron transfer reactions in NADH oxidase, can be inhibited by diphenyleneiodonium (DPI) [16]. Yeware et al. (2017) have described how DPI inhibits superoxide production as well as growth of M. smegmatis; this inhibition is reversed by the addition of an external source of superoxide [16]. In contrast, nitric oxide (NO) and hydrogen peroxide have been shown to be either bacteriostatic or infective growth inhibitors at moderate concentrations [17]. These results all suggest that changes in free radical levels could be responsible for the transition of Mtb from a dormant state into a VBNC state.
Dormancy is defined by loss of acid-fastness, upregulation of stress response genes, decrease in size and developing drug resistance [1, 3, 15, 18]. The transition from an active state into a VBNC state shares similar features, along with the observation of non-cultivability in liquid or solid medium and live-dead analysis [19]. In this study, it was found that DPI, an inhibitor of NADH oxidase, decreased superoxide levels and induced a VBNC state in Mtb. DPI-treated bacilli were also found to have similar characteristics to the dormant state reported earlier [18]. Supplementation of fetal bovine serum (FBS) was found to induce resuscitation of the bacilli in liquid medium, as well as on agar medium, even after ten days of DPI treatment. The untargeted metabolic data also suggested that accumulated organic acids and NADH were diverted to the production of lactate by a fermentative mode. Therefore, this study revealed that DPI treatment caused the rapid transition of Mtb from an active state into a VBNC state, which showed similarities with dormant phenotypes.
2. Material and methods
2.1 Cultures and growth conditions
All chemicals were purchased from Sigma-Aldrich, USA and Dubos medium was purchased from DIFCO, USA. M. tuberculosis H37Ra (ATCC 25177) was obtained from the Microbial Type Culture Collection (MTCC; Chandigarh, India) and sub-cultured in Dubos broth containing 5% glycerol and 10% ADC (albumin dextrose catalase supplement). M. tuberculosis H37Ra RFP strain was generated by transforming pCHERRY3 plasmid (Addgene USA) as described previously [20]. The stock was maintained at -70°C and sub-cultured once in a liquid medium before inoculation in experimental culture medium at 37°C with shaking at 150 rpm on an orbital shaker (Thermo Electron Model No.131 481; Thermo Electron Corp., Marietta, OH).
2.2. Effect of DPI on growth
Various concentrations of DPI were mixed with 1.5 mL of 0.35 OD600 nm cultures of H37Ra RFP bacilli in the 24-well microplate. The plates were further incubated statically at 37°C and fluorescence was measured by taking 200 μL of culture into the black well plate at 587/610 nm excitation/emission (ex/em), periodically. To determine the effect on CFU at different time points, DPI-treated cultures were 10-fold serially diluted and plated on a Middlebrook 7H11 agar plate. CFU was measured according to the standard protocol after incubation at 37°C in the CO2 incubator.
2.3. Detection of viability
A Live/dead BacLight Bacterial Viability Kit (Invitrogen) was used to determine the viability of mycobacteria according to the manufacturer’s instructions. Briefly, at different time points, 200 μL of DPI-treated (4 μg/mL) H37 Ra cultures were taken in a matrix 96-well plate and a mixture of SYTO 9 (0.91 mM) and propidium iodide (PI) (14.5 mM) were added [SYTO 9:PI = 1:16; ratio was standardized for Mtb, following the manufacturer's instructions]. After 15 min of incubation, fluorescence was measured in the dark at 470 nm excitation and 530 and 630 nm emission. The live/dead cell percentage was calculated from the standard plot of percentage live versus dead at the ratio of 530/630 nm. For imaging, a mixture of dyes were added to the treated culture and incubated for 15 min. After incubation, cells were washed with PBS and resuspended in fresh medium. The smear was prepared with 10 μL of cell suspension on a grease-free slide and fluorescence imaging was performed by EVOS microscope (Life Technology, Germany).
2.4. Acid-fast characterization
Approximately 20 μL of DPI-treated (4 μg/mL) Mtb H37 Ra culture at different time points was evenly spread as a thin smear on a glass slide, quickly heat-fixed by flame and cooled to room temperature before staining. Fluorescent, acid-fast staining dye Auramine-O was used in combination with neutral, lipid staining dye Nile Red (9-diethylamino-5H-benzo[a]phenoxazin-5-one) as previously described [3].
2.5. ROS and superoxide measurements
ROS measurement in Mtb cells was performed using fluorescent dye dichlorodihydrofluorescein diacetate (DCFH-DA), following a previously reported method [21]. Briefly, 200 μL of DPI-treated (4 μg/mL) Mtb H37 Ra culture was transferred to a 96-black well plate (matrix) to which DCFH-DA (20 μM) was added and incubated at 37°C for 30 min in the dark. Fluorescence was then measured at 485/535 nm ex/em using an M5e multimode plate reader (Molecular Devices, USA).
To determine comparative levels of superoxide production under different dormancy conditions, the dihydroethidium (DHE)-HPLC method was used [16]. Briefly, DHE (50 μM) was added to 17.5 mL of the following cultures: untreated aerobically growing culture (~0.35 OD600 nm), DPI treated culture (4 μg/mL, 24 h), Vitamin C treated culture (10 mM, 24 h) and Wayne hypoxic dormant culture (16 days) in 20 mm × 125 mm tubes and incubated for 90 minutes in the dark. To maintain hypoxia in the Wayne tube, DHE was added by syringe through the rubber septa. After incubation, 2 mL of culture from each set of conditions was used for the extraction and estimation of 2-hydroxyethidum (2-EOH) according to the previously reported method [16].
2.6. Effect on respiration
The effect on NADH dehydrogenase/ electron transport chain (ETC) complex I was investigated using the XTT (2,3-bis-(2-methoxy-4-nitro-5-sulfophenyl)-2H-tetrazolium-5-carboxanilide) reduction assay as described previously [22]. The activity of Complex IV was determined using the INT (2-(4-iodophenyl)-3-(4-nitrophenyl)-5-phenyl-2H-tetrazolium) dye reduction test as described previously [23]. Briefly, at various time points, 200 μL of DPI-treated culture was mixed with INT (400 μM) in a 96-well plate. The concentration of INT was determined by a separate dose-response curve obtained with actively growing culture as the control. Absorbance was measured at 495 nm after 4 h.
2.7. DNA isolation, RNA extraction, cDNA synthesis and qPCR
The DPI-treated Mtb cultures were centrifuged at 10,000 rpm for 10 min and the pellet resuspended in TE buffer (pH 7.5) containing lysozyme (0.01 mg/ml) Tris EDTA buffer (pH 7.2). The CTAB DNA extraction method was used for further DNA isolation [24]. Total RNA from DPI-treated (4 μg/mL) Mtb culture was isolated using the spheroplast-based method [25]. Briefly, a spheroplast solution consisting of 0.002% lysozyme, 0.006% D cycloserine, 1.4% glycine, 0.2% EDTA and 0.1% lithium chloride (wt/vol) in distilled water was aseptically added to the DPI-treated Mtb cultures on day 1, 5 and 9. After the spheroplast treatment, cells were harvested by centrifugation and then used for total RNA isolation by the TRIzol extraction method, as previously reported [25]. Next, 1 μg of total RNA was converted into cDNA using a first-strand cDNA synthesis kit (Sigma Aldrich) at 25°C for 10 min followed by incubation at 45°C for 50 min. The differential gene expression was analyzed by the SYBR green-based method of quantitative PCR (qPCR). In brief, a 1 μL aliquot of 1:10 diluted cDNA was mixed with 5 μL of SYBR green (Eurogenetics) and suitable primer/s (S1 Table). The volume was made up to 10 μL with water and a qPCR reaction was run for 40 cycles (PikoReal96, Thermo Scientific), according to the manufacturer’s instructions. The critical threshold values (Ct) of each test were used to analyse the differential gene expression along with SigA as the housekeeping gene.
2.8. Resuscitation
The Mtb H37Ra RFP culture at ~0.35 OD600nm was treated with DPI (4 μg/mL) for 24–36 h, centrifuged at 2000 g for 10 min at 4°C and then resuspended in fresh Dubos albumin broth. The resuspended culture was further diluted to 1:10 and 1.5 mL aliquots distributed in a 24-well plate. FBS (Sigma Aldrich, USA/ PAN Biotech, UK) was then added to each test well of the 24-well plate on day 1, 5 and 10 of DPI treatment, and further statically incubated 37°C in the CO2 incubator. At various time points, 200 μL of culture was transferred to a black well plate and fluorescence was measured at 587/610 nm ex/em as an indication of growth. A Middlebrook 7H11-agar plate with suitable dilutions was used for CFU determination of the remaining sample.
2.9. Metabolite extraction and metabolomics profiling
M. tuberculosis cells were harvested, and metabolites extracted as previously described [26]. Briefly, 10 mL of culture at ~0.35 OD600nm was quenched rapidly in 10 mL of 100% methanol at -20°C and centrifuged at 10000 rpm for 10 min. Cell pellets were resuspended in 2 mL of acetonitrile:methanol:water (4:4:2), transferred to 2 mL screw-cap tubes containing silica beads, and then agitated three times in a FastPrep-24 (MP Biomedicals) for 45 s at 4500 rpm, with 5 mins on ice between agitations. Samples were spun briefly, and the supernatant of the extract was filtered through a 0.22 μm syringe filter (Pall Life science Ltd) then frozen at -70°C before analysis.
Metabolomics analysis was performed using an Agilent 6540 UHD QTOF-MS with UPLC system (Agilent Technologies, Santa Clara, CA, USA). The flow rate was 0.5 mL/min with mobile phase A (100% acetonitrile) and mobile phase B (100% water). Both A and B contained 0.1% formic acid. The runtime was 30 min for the positive ion mode and 30 min for the negative ion mode. The raw data files were collected with .mzdata.xml format and further processed for analysis using the XCMS online program (https://xcmsonline.scripps.edu). During the data processing for all time points, the significance level was p < 0.05, fold change (FC) > 1.5 and intensity > 1000. Cloud plots of system biology results were extracted in an excel sheet, along with the list of predicted metabolites with their fold changes compared to untreated samples, from which the pairwise job was submitted. Duplicate samples of two independent experiments were run for each time point.
3. Results
3.1. Diphenyleneiodonium converts actively growing mycobacteria into viable but non-culturable state cells
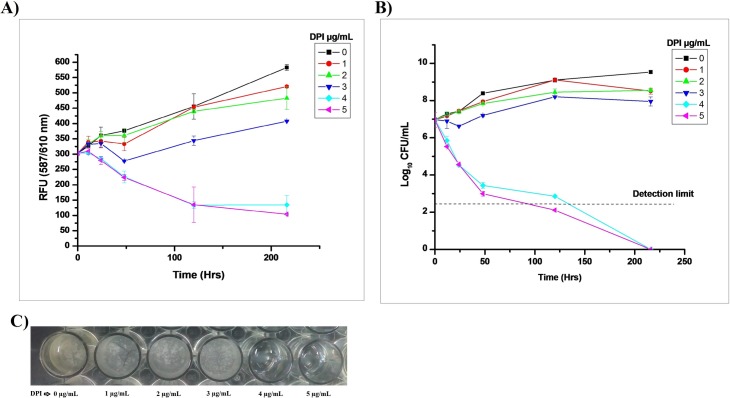
During the dose-response Mtb study, > 4 μg/mL DPI concentration showed a decrease in fluorescence with time (Fig 1A). CFUs on the agar medium were also found to decrease by 3.53 ± 0.16 log10 CFU/mL within 48 h of treatment by >4 μg/mL DPI (Fig 1B and 1C). When the DPI-treated culture was washed twice after 24 h, diluted 1:10 in fresh Dubos medium with 10% OADC supplement, and incubated with continuous shaking at 37°C, no growth was evident compared to untreated bacilli (S1 Fig). DPI-treated bacilli were subjected to SYTO 9 and propidium iodide (PI) staining, which showed 100% viability up to 5 days then slightly decreasing by ~15% within 9–15 days of treatment (Figs 2 and S2). The stability of DPI was also estimated by HPLC, revealing that ~1.5 μg/mL of DPI was depleted by Mtb after 3 h of treatment, whereas > 3.5 μg/mL of DPI was always present in the supernatant for up to 9 days when using 5 μg/mL of DPI for treatment (S3 Fig).
Fig 1. Effect of DPI on the growth of M. tuberculosis.
Fig 2. Live/dead analysis of DPI-treated M. tuberculosis.
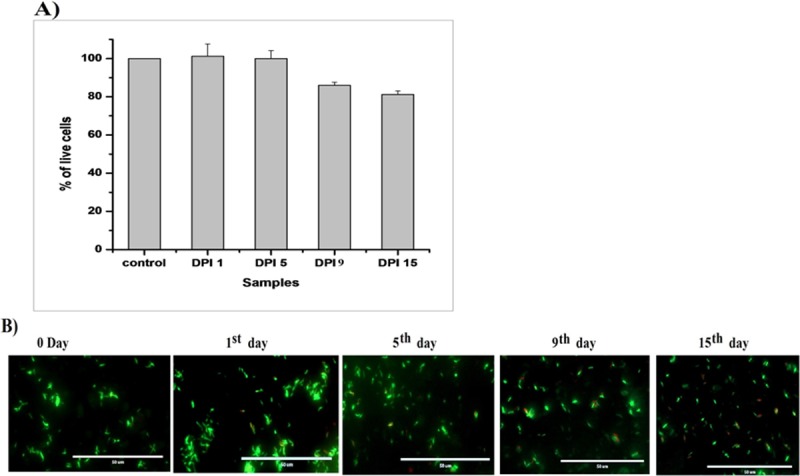
The viability of DPI-treated (4 μg/mL) Mtb cells was determined using the Live/dead BacLight Bacterial Viability Kit (Invitrogen) according to the manufacturer’s instructions. A) Percentage viability analysis carried out using a standard curve; (B) merged images of the SYTO 9 and PI staining captured by EVOS microscope as mentioned in the “Materials and Methods section.” The data shown is representative of three independent experiments (scale bar 50 μm).
Various concentrations of DPI (1–5 μg/mL) were added to ~0.35 OD600 nm of growing Mtb H37 Ra RFP strain. A 200 μL aliquot of treated culture was transferred to a black well plate and fluorescence was measured periodically at 587/610 nm ex/em. The CFUs were determined from the remaining sample with suitable dilutions on a Middlebrook agar 7H11 plate and incubated at 37°C for one month. The data is shown as the mean of triplicate results with ±SD and reproducibility determined at least two times. A) Fluorescence reading at ex/em 587/610 nm; B) CFU count; and C) Mtb growth monitored at different concentrations of DPI.
3.2. DPI treatment influences dormant continuum in M. tuberculosis
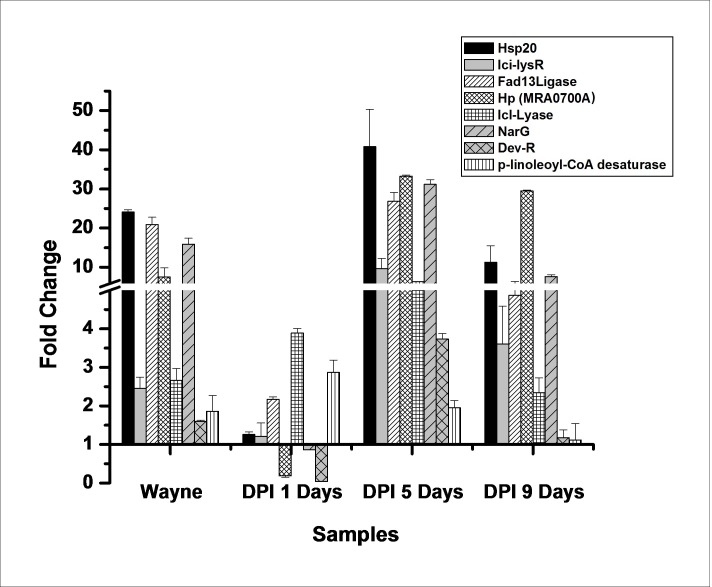
Dormancy is well characterized, with loss of acid-fastness and upregulation of stress-regulated genes [3, 18, 27]. A similar phenotype was observed for Mtb bacilli, with loss of acid-fastness after 24 h of DPI treatment upon staining with Auramine O and Nile Red (Fig 3). Additionally, upregulation of the genes Hsp20, Ici-lysR, Fad13Ligase, Hypothetical protein (MRA0700A), Icl-Lyase, NarG and Dev-R at 40.78, 9.65, 26.86, 33.26, 6.32, 31.13 and 3.73-fold, respectively, was observed on day 5 of DPI treatment compared to untreated bacilli (Fig 4) [2–3, 28], and Dev-R, Icl-Lyase and putative linoleoyl-CoA desaturase (MRA3270), related to fatty acid metabolism, were found to be significantly upregulated (> 2 fold) after 24 h of DPI treatment. Interestingly, although down regulation of MRA3270 was shown in the reported dormancy model [2], this was not observed in the Wayne model or in DPI-treated bacilli (Fig 4).
Fig 3. Acid-fast staining of DPI-treated M. tuberculosis.
Acid-fast staining of DPI-treated (4 μg/mL) culture using Auramine O-Nile Red at respective time points by preparing a smear on a glass slide. The images were captured by EVOS microscope with an oil immersion (100X) objective lens and processed further using Microsoft Paint software (scale bar 10 μm).
Fig 4. Differential gene expression analysis of DPI-treated M. tuberculosis.
The total RNA was extracted and converted into cDNA from the DPI-treated Mtb cultures from 1 day- (D1), 5 day- (D5), 9 day- (D9) and 16 day-old Wayne hypoxia models (W). Quantitative estimation was performed using the SYBR green-based qPCR kit and fold change was calculated for each gene by normalizing with SigA as a reference. The data is represented as the mean of three identical experiments ±SD (p < 0.05).
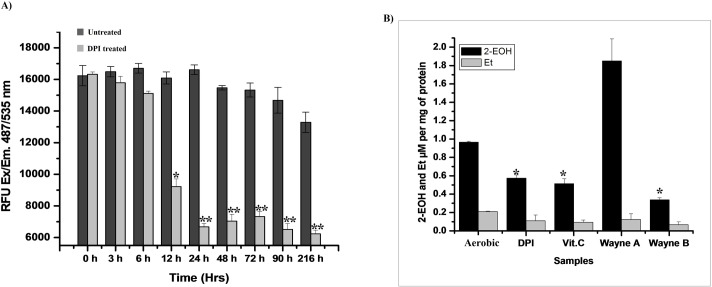
Fluorescent dye DCFH-DA was used to determine the total ROS level. A 56% decrease in the relative fluorescence unit (RFU) compared with untreated Mtb bacilli were observed within 24 h of DPI (4 μg/mL DPI) treatment (Fig 5A). Furthermore, 2-hydroxyethidum (2-EOH), a specific product formed during the reaction of superoxide with DHE, was found with values of 0.924 ± 0.16, 0.479 ± 0.06, 0.391 ± 0.09 and 0.49 ± 0.07 μM per mg of protein in actively growing, DPI-treated (24 h), 10 mM Vitamin C-treated (24 h) and 16 day-old Wayne hypoxic cultures, respectively (Fig 5B). Interestingly, the level of 2-EOH was found to be 1.23 ± 0.14 μM per mg of protein when DHE was incubated under aerated conditions in 16 day-old Wayne hypoxic Mtb cultures. This indicated that a rapid burst of superoxide occurs in hypoxic Mtb when it is oxygenated (Fig 5B).
Fig 5. ROS and superoxide decrease in the dormant form of mycobacteria.
A) ROS estimation: A 200 μL aliquot of DPI-treated (4 μg/mL) culture was periodically transferred to a 96-black well plate (matrix), to which 20 μM of DCFH-DA was added and incubated at 37 oC for 30 min in the dark. Fluorescence was measured at 485/535 nm ex/em. B) Superoxide estimation: 50 μM of DHE was added to 17.5 mL of DPI-treated, 10 mM of Vit.C-treated (24 h), and 16 day-old Wayne hypoxia culture (Wayne A: exposed to air; Wayne B: hypoxic conditions) and incubated for 90 min. Levels of 2-EOH and ethidium (Et) were determined. The data is shown as the mean of the three identical results ±SD (*p < 0.05, **p < 0.005).
3.3. Effect on respiration and DNA fragmentation
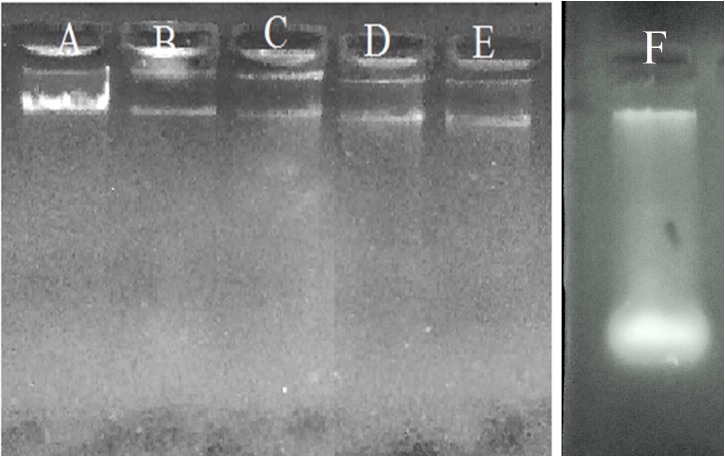
The ETC is the major process associated with respiration of any live cell. Cellular activity was determined using tetrazolium dyes in culture suspension. The absorbance of XTT {2,3-Bis-(2-Methoxy-4-Nitro-5-Sulfophenyl)-2H-Tetrazolium-5-Carboxanilide)} or INT {2-(4-iodophenyl)-3-(4-nitrophenyl)-5-phenyl-2H-tetrazolium} dye’s reduction was found to be decreased (< 0.2 OD) when they were incubated with DPI-treated bacilli compared to untreated Mtb bacilli (0.81 ± 0.02 and 0.52 ± 0.01 at 470 nm and 490 nm, respectively) (S4A and S4B Fig). Intact DNA was observed in each lane of the agarose gel electrophoresis, representing samples isolated from the 1st, 5th, 10th, and 15th day of DPI-treated Mtb bacilli (Fig 6), which indicated that DPI treatment did not cause DNA fragmentation; it retained its stability.
Fig 6. DNA extraction from the DPI-treated M. tuberculosis.
DNA was extracted from actively growing and DPI-treated (4 μg/mL) Mtb samples and run on 1% agarose gel. A) Actively growing culture; B-E: 1st, 5th, 9th and 15th day DPI-treated cultures, respectively; F: UV-treated Mtb culture).
3.4. Resuscitation of non-cultivable Mycobacterium tuberculosis using fetal bovine serum
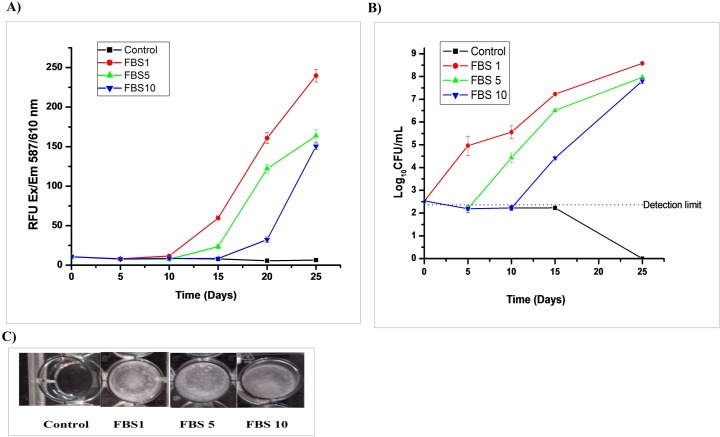
VBNC cells may be resuscitated back to culturable cells under suitable stimuli [19]. However, as DPI treatment decreased the superoxide levels in Mtb, no reverse effect was seen after the addition of an external source of superoxide, i.e., pyrogallol and menadione (S5 Fig). Despite this result, supplementation of the DPI-treated Mtb with FBS resulted in significantly increased growth (> 5 log10 CFU/mL) in the VBNC state culture within 10 days (Fig 7).
Fig 7. Resuscitation of DPI-treated bacilli by fetal bovine serum.
The mycobacterial culture was treated with 4 μg/mL of DPI (OD600 nm = 0.35) for 24–36 h, washed and resuspended in fresh Dubos albumin broth. The culture was further diluted 1:10 in the Dubos medium and distributed in 24-well plates as 1.5 mL aliquots. FBS (20–30 μL) was added to the 24-well plates on days 1, 5 and 10 of incubation of washed DPI treated bacilli. A) The fluorescence, and B) number of CFUs were determined after every 5th day of FBS supplementation. C) Images of Mtb growth in wells on days 1, 5 and 10 of FBS supplementation to washed DPI treated bacilli were captured at the endpoint incubation (control: without FBS). The results are shown as the mean of triplicate results ±SD. The reproducibility of the experiment was determined two times.
3.5. Metabolic profile of DPI-treated M. tuberculosis
Untargeted metabolite analysis was done on DPI-treated (4 μg/mL) mycobacteria at various time points using XCMS online software suite including the pairwise, meta and multi-group data analysis functions [29–31]. Untreated culture from the same batch was used as the control.
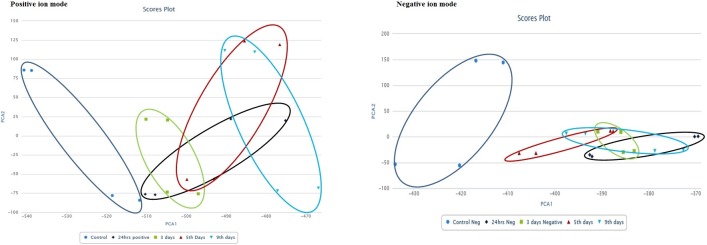
The unit variance between the control and treated group was determined by providing all the data points with intensity to multi-group inputs, and score principal component analysis (PCA) plots were generated (Fig 8). Fig 8A represents the ~1000 feature coverage for control versus a treated group of positive ion modes where 0.927 and 0.932 unit variance (R2 value) was observed for PC 1 and PC 2, respectively. Multi-group XCMS analysis of negative ion mode metabolite PC 1 and PC 2 unit variance was observed to be 0.917 and 0.934, respectively (Fig 8B). Therefore, the PCA scores revealed that metabolomes of the DPI-treated and untreated samples differed from each other at all time points (Fig 8).
Fig 8. Interactive principal component analysis score plot.
A) Positive ion mode; B) negative ion mode. Multi-group mode was selected to obtain the PCA for all samples in XCMS online suits (https://xcmsonline.scripps.edu). Data is representative of duplicate samples of two biologically-independent experiments.
Additionally, changes in levels of commonly dysregulated metabolites were determined using Meta-XCMS [30]. 108 and 159 common features were observed in positive and negative ion modes, respectively, and at all time points had p < 0.05, FC >1.5 and intensity >1000 (S6 Fig).
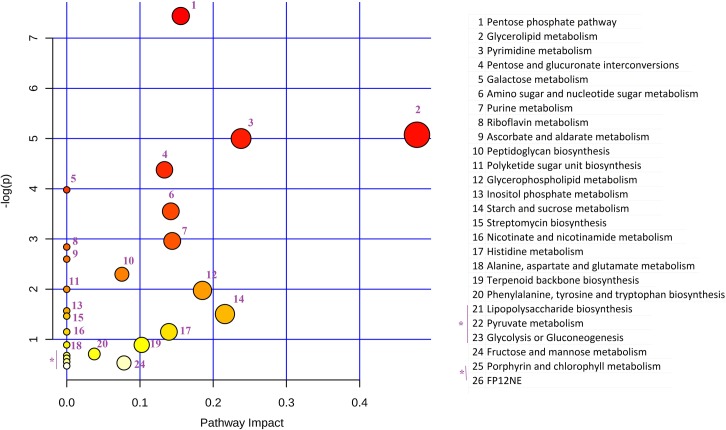
To investigate which metabolites were most responsible for the observed differences between control (untreated) and treated groups, pairwise comparison of control samples and treated samples for each time point was performed using the XCMS online tool [29]. The altered metabolite levels were obtained in the form of a cloud plot for both positive and negative ion modes with p < 0.05 and FC > 1.5 (S7A and S7B Fig). Furthermore, system biology results were used to prepare a predicted metabolite heat map, and pathway impact analysis was performed using MetaboAnalyst software (Fig 9). Overall, ~103 dysregulated compounds were predicted during the transition at all four time points of DPI treatment (S8 Fig).
Fig 9. Altered pathway impact analysis.
Metabolites predicted by the XCMS pairwise job for each time point were compiled in a single file, and common metabolites were sorted and processed using MetaboAnalyst for pathway impact analysis using the prokaryotic system. (http://www.metaboanalyst.ca/faces/upload/PathUploadView.xhtml). Color variation from yellow to red indicates the increased levels of significance of metabolites in the data, and size of bubbles indicates their impact.
Metabolites involved in nucleotide metabolism like adenine, dTMP and CMP were decreased > 2 fold during treatment, while pentose sugars D-ribose-1-phosphate, D-ribulose 5-phosphate and D-xylulose 5-phosphate were observed to increase during treatment along with the key metabolites of purine metabolism, hypoxanthine and RNA component UTP (S8A Fig). Of the organic and other amino acid metabolites, L-argininosuccinate, 2-aminoprop-2-enoate (L-alanine), 2-iminobutanoate and (2Z)-2-aminobut-2-enoate significantly decreased (FC > 2) at all time points, while fumarate and succinate accumulated on day 9 of DPI treatment, showing strong disruption of the alanine, aspartate, glutamate and tricarboxylic acid cycle (TCA) pathways [32] (Fig 9). Furthermore, components of the TCA cycle like citrate and isocitrate (cis-vaccenate) were decreased along with malate, indicating the continued utilization of these products via glyoxylate shunt along with further accumulation of succinate or acetolactate/lactate via pyruvate metabolism (S8B and S8C Fig).
On day 3 of DPI treatment, it was observed that meso-diaminopimelate and L,L-diaminopimelate were significantly increased. This indicated increasing rigidity of the cell wall during treatment, as reported for dormancy phenotypes [19]. However, UDP-N-acetyl-α-D-glucosamine and UDP-α-D-glucose/galactose were found to decrease during treatment, which could be due to building blocks not being synthesized during maintenance of a non-culturable state. Additionally, as described above regarding nucleotide metabolism, pentose sugars D-ribose-1-phosphate, D-ribulose 5-phosphate, D-xylulose 5-phosphate and D-sedoheptulose 7-phosphate increased on day 1 of treatment, highlighting the importance of pentose phosphate pathway (PPP) activation after treatment [33] (S8D Fig). Palmitoleate and L-1-glycero-3-phosphocholine, which are lipid precursors, were found to decrease at three time points during DPI treatment (S8E Fig). Furthermore, sulfur-containing metabolites, reported to influence bacterial pathogenesis [34], were also altered during DPI stress. Mycothiol (MSH), the primary thiol-containing small molecule of mycobacteria, increased on day 1 of treatment and decreased on day 3 (S8E Fig), and sulfate, myo-inositol and glutathioselenol increased at the early time points. Conversely, mycothoine, dethiobiotin and L-cystathionine were observed to decrease at more than two time points after DPI treatment. Nicotinate and NAD decreased on day 1 of treatment, indicating NADH oxidase inhibition by DPI (S8G Fig).
In summary, the metabolite profiles subjected to the pathway impact analysis showed that alanine, aspartate and glutamate metabolic pathways were highly altered and ultimately affected nitrogen metabolism under DPI-treated conditions (Fig 9). On the other hand, in energy-related pathways (i.e., TCA and pentose phosphate), metabolites showed increased levels or accumulation during DPI treatment. Furthermore, several macromolecular building blocks (e.g., amino acids, fatty acids, purine, etc.) and cytoskeletal molecules like peptidoglycan and lipids were found to be altered during DPI treatment (Fig 9).
4. Discussion
The influence of oxygen on the growth of Mycobacterium spp. has been detailed in the literature [1, 14]. Earlier studies have shown that the level of superoxide production is proportional to the availability of oxygen in the environment [28, 35]. Superoxide has reported a contradictory effect on Mtb, ranging from lethal effects to a role in cell signaling or growth [36, 16]. DPI has been shown to inhibit superoxide production and bacterial growth, which was reversed by the addition of an external source of superoxide in M. smegmatis [16].
In this study, it was observed that DPI also inhibited the growth of Mtb and caused it to rapidly enter into a VBNC state (Fig 1). Our primary observation showed a gradual decrease in red fluorescence (Fig 1A), this could be due to either a reduced rate of protein synthesis upon DPI treatment or a transition effect to dormant bacilli. Additionally, CFU count was found to be beyond the detection limit within 48 h of treatment but viability was retained (> 83%) until day 9 of DPI treatment (Fig 2B). A small number of CFU counts were found at initial time points (i.e. 24 h and 48 h) in the DPI-treated cultures, where these subpopulations were unable to grow in Dubos broth (Figs 1B and S1). The subpopulation observed on the agar plate could have been at an intermediate stage and entered in to a VBNC state in the liquid microenvironment. Other possible reasons could be the different composition, texture, and higher oxygen level of the solid media compared to the liquid media. The slight decrease in viability may have been due to altered cell membrane permeability (bearing dormancy characteristics), decreased cell size, the effect on the ratio of STYO 9: PI, or simply that some bacilli could have died during the treatment.
Mycobacterial cells are well known for their ability to assume a VBNC state under in vivo or in vitro conditions and are mostly characterized by dormant features [4]. In the study, it was found that, after DPI treatment, Mtb transitioned to a VBNC state through dormancy (Figs 3 and 4). The Auramine O staining changed after 24 h of DPI treatment, and upregulation of the FAD13 ligase enzyme was observed in 24 h DPI-treated cDNA samples (Fig 4). Upregulation of HspX, DosR and Icl genes has also been reported in various dormancy models [3, 27], which confirms the transition of these bacilli to a dormant-like state; however, DosR was not observed to be significantly upregulated in this study. This finding indicates the likelihood that bacilli transition occurs in normoxia (oxygenated) conditions, as reported in the Vitamin C dormancy model [14].
The capacity for superoxide production in either form of dormant bacilli was also found to be decreased compared to the actively growing bacilli (Fig 5). This observation supported the proposal that superoxide levels are probably responsible for the development of dormancy features in Mtb. XTT and INT were used to determine the functional activity of the ETC. Interestingly, the rate of reduction of these dyes was also found to be decreased in DPI-treated Mtb, indicating the shutdown of ETC or ATP generation energetics under such conditions (S4 Fig). Furthermore, DNA and RNA extraction of DPI-treated cells was found to remain intact even after day 15 of DPI treatment, indicating the viability of these cells (Fig 6). In contrast to M. smegmatis cells, the addition of menadione or pyrogallol failed to resuscitate this DPI-treated Mtb culture [16], probably due to inherent differences between these two species. Regardless, this DPI-treated culture was successfully resuscitated by supplementation of FBS in the culture (Fig 7). Further studies are being carried out to identify which active ingredient(s) present in FBS are responsible for resuscitation of a VBNC state in Mtb.
In metabolomics analysis, metabolites are considered the products of gene expression and functional regulation at the protein level [37] and can be used to give mechanistic insight into the metabolic shifts that occur during the transition of mycobacteria from an active state to a VBNC state. Lactate (R, S, and S-acetolactate) is an end product of anaerobic glycolysis [38]. In this study, increased lactate levels were observed in the VBNC state of mycobacteria and was earlier found to be induced by Mtb in lung granuloma [38] (S8C Fig). However, it is also expected that accumulation of lactate could cause cytosolic NADH to build up as a result of the inhibition of glycolysis at the level of glyceraldehyde-3-P-dehydrogenase [38], and NADH oxidase inhibition by DPI [16]. Additionally, the observed increased levels of succinate could be a sign of the diversion of isocitrate towards succinate via glyoxylate shunt as earlier reported in hypoxia-adapted Mtb [39]. Fumarate levels were also found to increase in DPI-treated Mtb, resembling the activation of reverse TCA cycles upon oxygen limitation, and maintaining standard cellular energetics in the dormant state of mycobacteria via fumarate reductase [40].
The increase in pentose sugars like D-ribose-1-phosphate and xylulose-5-phosphate indicated the shutdown of the nucleotide synthetic pathway (S8A and S8D Fig). The component D-sedoheptulose 7-phosphate, also part of the pentose phosphate pathway (HMP shunt), increased during DPI treatment, which indicated the diversion of the glycolytic pathway for adaptation of the VBNC state. The increase in meso-diaminopimelate could be due to the formation of more cross-linkages in peptidoglycan to enhance the rigidity of the cell wall during the VBNC state [19]. Homocysteine (2-iminobutanoate), a key intermediate in the synthesis of metabolites such as methionine, cysteine, SAM, SAH and adenosine [41], was found to decrease during the VBNC state. Furthermore, components of amino acid synthesis, including alanine (2-aminoprop-2-enoate) and intermediates L-argininosuccinate and L-glutamate were decreased, resulting in changes to their activities in the metabolic pathway (Fig 9). (S)-4-Hydroxy-2-oxohexanoate and (S)-2-aceto-2-hydroxybutanoate, components of valine, leucine and isoleucine biosynthesis, were also decreased in dormant bacilli. Lipid components such as L-1-glycero-3-phosphocholine, phosphocholine and palmitoleate were also decreased, affecting the synthesis of unsaturated fatty acids. Furthermore, increased levels of sulfate, MSH, and myo-inositol were found in the initial days of DPI treatment; these are supposed to protect against oxidative stress [42]. However, the decreased concentration of NAD and nicotinate because of DPI inhibition was inconsistent with the NADH/NAD ratio found in dormant states reported earlier [43]. Overall, metabolic profiling showed decreased biogenesis of amino acids, purine and pyrimidine nucleotides, and unsaturated fatty acids due to weaker metabolism during DPI treatment and mycobacterial transition into a VBNC state.
In summary, DPI treatment resulted in decreased CFU counts, red fluorescence, loss of acid-fastness and upregulation of dormancy-related genes. Decreased levels of superoxide production were also found, similar to that observed in hypoxia and Vitamin C dormancy models. However, DPI-treated bacilli retained intact DNA, RNA and > 83% live bacilli, even after 10–15 days of treatment, confirming their viability. Metabolic profiling analysis clearly indicated that the prevalence of lactate, fumarate, succinate, MSH, myo-inositol and pentose sugars increased, while biogenesis of amino acids, nucleotides and unsaturated fatty acids decreased, again in line with the dormancy features observed within granuloma during Mtb infection of human lungs [32,38]. Therefore, this report suggests that DPI induce rapid dormancy followed by a VBNC state in Mtb cells. Thus, a DPI-induced, non-culturable state could be used as a “VBNC model” for mycobacteria.
Supporting information
Growth of DPI treated culture in Dubos broth: The continuously growing mycobacterial culture of an OD600 ~0.35 treated with the 4 μg/mL of DPI for 24–36 hrs. Treated and untreated culture washed twice, resuspended as 1:10 dilution in the fresh Dubos albumin broth supplement and incubated for at 37 oC with stirring. After the 9–10 days of incubation image were captured and processed using Microsoft paint software.
(JPG)
Standardization of Live/dead assay A) Standard plot of % live cell (percentage of live and dead cell obtained by Isopropanol treatment) versus 630/530nm ratio. B) Fluorescence reading of with treated and untreated culture at Ex. 470 and Em. 500-700nm. Assay standardization was done according to manufacture instruction (Invitrogen, Life technology).
(JPG)
(JPG)
An aliquot of 200 μL of DPI treated bacilli periodically transferred to 96 well plates and incubated with XTT (A) and INT (B) tetrazolium salt. After 20 min incubation with XTT, 60 μM of menadione were added and plate further incubated for 40 mins. The absorbance was measured at 470 nm for XTT reduction assay or 495 nm for the INT reduction assay. Data shown as the mean of three identical results with ±SD.
(JPG)
The mycobacterial culture was treated with 4 μg/mL of DPI (OD 600nm = 0.35) for 24–36 h, washed and resuspended in fresh Dubos albumin broth. The various concentration of the Pyrogallol or Menadione were added and incubated for at 37 oC. At various time point growth was measured in the form of fluorescence a Ex/Em. 587/610 nm. Data shown as the mean of triplicate results with ±SD.
(JPG)
Venn diagram for common feature analysis in A) Positive and B) Negative ion mode analysis.
(TIF)
Cloud plots of altered metabolites for each time points by A) Positive and B) Negative ion mode.
(TIF)
(PDF)
(DOC)
Acknowledgments
The authors are thankful to the Center for Applications of Mass Spectrometry (CAMS) NCL Innovation Park, Pune, India for using UPLC system. AY, SG and SA are thankful to DST-INSPIRE, CSIR, and UGC for their research fellowships, respectively.
Data Availability
All relevant data are within the manuscript and its Supporting Information files.
Funding Statement
Council of Scientific and Industrial Research (CSIR) India through grant aid projects BSC0103 and CSC0406 supported this work. The funders had no role in study design, data collection and analysis, decision to publish, or preparation of the manuscript.
References
- 1.Wayne LG and Hayes LG. An in vitro model for sequential study of shift down of Mycobacterium tuberculosis through two stages of nonreplicating persistence. Infect Immun. 1996, 64:2062–2069. [DOI] [PMC free article] [PubMed] [Google Scholar]
- 2.Betts JC, Lukey PT, Robbs LC, McAdam RA, Duncan K. Evaluation of a nutrient starvation model of Mycobacterium tuberculosis persistence by gene and protein expression profiling. Mol Microbiol, 2002, 43:717–731 10.1046/j.1365-2958.2002.02779.x [DOI] [PubMed] [Google Scholar]
- 3.Deb C, Lee C-M, Dubey VS, Daniel J, Abomoelak B, Sirakova TD, et al. A Novel In Vitro Multiple-Stress Dormancy Model for Mycobacterium tuberculosis Generates a Lipid-Loaded, Drug-Tolerant, Dormant Pathogen. PLoS ONE 4(6): e6077; 2009. 10.1371/journal.pone.000607 [DOI] [PMC free article] [PubMed] [Google Scholar]
- 4.Shleeva MO, Bagramyan K, Telkov MV, Mukamolova GV, Young M, Kell DB,et al. Formation and resuscitation of “nonculturable” cells of Rhodococcus rhodochrous and Mycobacterium tuberculosis in prolonged stationary phase. Microbiology, 2002. 148:1581–91 10.1099/00221287-148-5-1581 [DOI] [PubMed] [Google Scholar]
- 5.Ayrapetyan M, Williams TC, Oliver JD. Bridging the gap between viable but non-culturable and antibiotic persistent bacteria.Trends Microbiol 2015;23(1):7–13. 10.1016/j.tim.2014.09.004 [DOI] [PubMed] [Google Scholar]
- 6.Shleeva M, Mukamolova GV, Young M, Williams HD, Kaprelyants AS. Formation of ‘non-culturable’ cells of Mycobacterium smegmatis in stationary phase in response to growth under suboptimal conditions and their Rpf-mediated resuscitation. Microbiology 2004150; 1687–1697. 10.1099/mic.0.26893-0 [DOI] [PubMed] [Google Scholar]
- 7.Salina EG, Waddell SJ,Hoffmann N, Rosenkrands I, Butcher PD, Kapre lyants AS. Potassium availability triggers Mycobacterium tuberculosis transition to, and resuscitation from, non-culturable (dormant) states. Open Biol. 20144:140106 10.1098/rsob.140106 [DOI] [PMC free article] [PubMed] [Google Scholar]
- 8.Dhillon J, Lowrie DB, Mitchison DA. Mycobacterium tuberculosis from chronic murine infections that grows in liquid but not on solid medium. BMC Infect Dis. 2004; 17;4:51 10.1186/1471-2334-4-51 [DOI] [PMC free article] [PubMed] [Google Scholar]
- 9.Kaprelyants AS, Gottschal JC, Kell DB. Dormancy in non-sporulating bacteria. FEMS Microbiol Rev. 1993; 10(3–4):271–85. 10.1111/j.1574-6968.1993.tb05871.x [DOI] [PubMed] [Google Scholar]
- 10.Wayne LG, Dormancy of Mycobacterium tuberculosis and latency of disease. Eur J Clin Microbiol Infect Dis. 1994;13(11):908–14. [DOI] [PubMed] [Google Scholar]
- 11.Neyrolles O, Hernández-Pando R, Pietri-Rouxel F, Fornès P, Tailleux L, Barrios Payán JA, et al. Is adipose tissue a place for Mycobacterium tuberculosis persistence? PLoS One. 2006, 20;1:e43 10.1371/journal.pone.0000043 [DOI] [PMC free article] [PubMed] [Google Scholar]
- 12.Khan A, and Sarkar D. Simple whole cell based high throughput screening protocol using Mycobacterium bovis BCG for inhibitors against dormant and active tubercle bacilli. J Microbiol Meth 2008;73:62–8. [DOI] [PubMed] [Google Scholar]
- 13.Lakshminarayana SB, Huat TB, Ho PC, Manjunatha UH, Dartois V, Dick T. Comprehensive physicochemical, pharmacokinetic and activity profiling of anti-TB agents. J Antimicrob Chemother 2015;70:857–67 10.1093/jac/dku457 [DOI] [PMC free article] [PubMed] [Google Scholar]
- 14.Taneja NK, Dhingra S, Mittal A, Naresh M, Tyagi JS. Mycobacterium tuberculosis transcriptional adaptation, growth arrest and dormancy phenotype development is triggered by vitamin C. PLoS One. 2010. 27;5(5):e10860 10.1371/journal.pone.0010860 [DOI] [PMC free article] [PubMed] [Google Scholar]
- 15.Sikri K, Duggal P, Kumar C, Batra SD, Vashist A, Bhaskar A, et al. Multifaceted remodeling by vitamin C boosts sensitivity of Mycobacterium tuberculosis subpopulations to combination treatment by anti-tubercular drugs. Redox Biol. 2018;15:452–466 10.1016/j.redox.2017.12.020 [DOI] [PMC free article] [PubMed] [Google Scholar]
- 16.Yeware AM, Shurpali KD, Athalye MC, Sarkar D. Superoxide Generation and Its Involvement in the Growth of Mycobacterium smegmatis. Front Microbiol. 2017. 30;8:105 10.3389/fmicb.2017.00105 [DOI] [PMC free article] [PubMed] [Google Scholar]
- 17.Voskuil MI, Bartek IL, Visconti K, Schoolnik GK. The response of Mycobacterium tuberculosis to reactive oxygen and nitrogen species. Front Microbiol. 201113;2:105 10.3389/fmicb.2011.00105 [DOI] [PMC free article] [PubMed] [Google Scholar]
- 18.Sikri K and Tyagi JS. The evolution of Mycobacterium tuberculosis dormancy models. Current science, 2013, 105:5 [Google Scholar]
- 19.Li L, Mendis N, Trigui H, Oliver JD, Faucher SP. The importance of the viable but non-culturable state in human bacterial pathogens. Front Microbiol. 2014. 2;5:258 10.3389/fmicb.2014.00258 [DOI] [PMC free article] [PubMed] [Google Scholar]
- 20.Yeware A and Sarkar D. Novel red fluorescence protein based microplate assay for drug screening against dormant Mycobacterium tuberculosis by using paraffin Tuberculosis (Edinb). 2018;110:15–19. 10.1016/j.tube.2018.02.0082018 [DOI] [PubMed] [Google Scholar]
- 21.Brennan RJ and Schiestl RH. Aniline and its metabolites generate free radicals in yeast. Mutagenesis, 1997, 12:215–220, 10.1093/mutage/12.4.215 [DOI] [PubMed] [Google Scholar]
- 22.Singh U, Akthar S, Mishra A, Sarkar D. A novel screening method based on menadione mediated rapid reduction of tetrazolium salt for testing of anti-mycobacterial agents. J Microbiol Methods, 2011, 84:202–207. 10.1016/j.mimet.2010.11.013 [DOI] [PubMed] [Google Scholar]
- 23.Rahman I, Shahamat M, Kirchman PA, Russek-Cohen E and Colwell RR. Methionine uptake and cytopathogenicity of viable but nonculturable Shigella dysenteriae type1. 1994. Appl.Environ.Microbiol. 60, 3573–3578. [DOI] [PMC free article] [PubMed] [Google Scholar]
- 24.Belisle JT, Mahaffey SB, Hill PJ. Isolation of Mycobacterium Species Genomic DNA. Methods Mol. Bio., 2009, 465, 1–12 [DOI] [PubMed] [Google Scholar]
- 25.Akhtar S, Sarkar S, Mishra A, and Sarakar S. A method to extract intact and pure RNA from mycobacteria. Analytical Biochemistry, 2011, 417, 286–288. 10.1016/j.ab.2011.06.028 [DOI] [PubMed] [Google Scholar]
- 26.Berney M, Berney-Meyer L, Wong KW, Chen B, Chen M, Kim J, et al. Essential roles of methionine and S-adenosylmethionine in the autarkic lifestyle of Mycobacterium tuberculosis. Proc Natl Acad Sci. 2015. 11;112(32):10008–13. 10.1073/pnas.1513033112 [DOI] [PMC free article] [PubMed] [Google Scholar]
- 27.Kapoor N, Pawar S, Sirakova TD, Deb C, Warren WL, Kolattukudy PE. Human Granuloma In vitro Model, for TB Dormancy and Resuscitation. PLoS ONE, 2013; 8(1): e53657 10.1371/journal.pone.0053657 [DOI] [PMC free article] [PubMed] [Google Scholar]
- 28.Shi L, Sohaskey CD, North RJ and Gennaro ML. Transcriptional characterization of the antioxidant response of Mycobacterium tuberculosis in vivo and during adaptation to hypoxia invitro. Tuberculosis(Edinb.) 2008;.88,1–6. 10.1016/j.tube.2007.08.007 [DOI] [PMC free article] [PubMed] [Google Scholar]
- 29.Gowda H, Ivanisevic J, Johnson CH, Kurczy ME, Benton HP, Rinehart D et al. , Interactive XCMS Online: simplifying advanced metabolomic data processing and subsequent statistical analyses. Anal Chem. 2014. 15;86(14):6931–9. 10.1021/ac500734c [DOI] [PMC free article] [PubMed] [Google Scholar]
- 30.Patti GJ, Tautenhahn R, Johannsen D, Kalisiak E, Ravussin E, Brüning JC, et al. Meta-analysis of global metabolomic data identifies metabolites associated with life-span extension. Metabolomics. 2014. 1;10(4):737–743. 10.1007/s11306-013-0608-8 [DOI] [PMC free article] [PubMed] [Google Scholar]
- 31.Benton HP, Ivanisevic J, Mahieu NG, Kurczy ME, Johnson CH, Franco L et al. , Autonomous metabolomics for rapid metabolite identification in global profiling. Anal Chem. 2015. January 20;87(2):884–91. 10.1021/ac5025649 [DOI] [PMC free article] [PubMed] [Google Scholar]
- 32.Drapal M, Wheeler PR, Fraser PD. Metabolite analysis of Mycobacterium species under aerobic and hypoxic conditions reveals common metabolic traits. Microbiology. 2016;162(8):1456–67. 10.1099/mic.0.000325 [DOI] [PubMed] [Google Scholar]
- 33.Eoh H, Wang Z, Layre E, Rath P, Morris R, Branch Moody D, et al. Metabolic anticipation in Mycobacterium tuberculosis. Nat Microbiol. 2017, 22;2:17084 10.1038/nmicrobiol.2017.84 [DOI] [PMC free article] [PubMed] [Google Scholar]
- 34.Hatzios SK and Bertozzi CR. The regulation of sulfur metabolism in Mycobacterium tuberculosis. PLoS Pathog. 2011;7(7):e1002036 10.1371/journal.ppat.1002036 [DOI] [PMC free article] [PubMed] [Google Scholar]
- 35.Bloomfield G and Pears C. Superoxide signalling required for multicellular development of Dictyostelium. J. CellSci. 2003;116, 3387–3397. 10.1242/jcs.00649 [DOI] [PubMed] [Google Scholar]
- 36.Vilchèze C, Hartman T, Weinrick B, Jacobs WR Jr. Mycobacterium tuberculosis is extraordinarily sensitive to killing by a vitamin C-induced fenton reaction. Nat Commun. 2013;4:1881 10.1038/ncomms2898 [DOI] [PMC free article] [PubMed] [Google Scholar]
- 37.Boshoff HI and Lun DS. Systems biology approaches to understanding mycobacterial survival mechanisms. Drug Discov Today Dis Mech. 2010; Spring;7(1):e75–e82. 10.1016/j.ddmec.2010.09.008 [DOI] [PMC free article] [PubMed] [Google Scholar]
- 38.Somashekar BS, Amin AG, Rithner CD, Troudt J, Basaraba R, Izzo A, et al. Metabolic profiling of lung granuloma in Mycobacterium tuberculosis infected guinea pigs: ex vivo 1H magic angle spinning NMR studies. J Proteome Res. 2011;2;10(9):4186–95. 10.1021/pr2003352 [DOI] [PubMed] [Google Scholar]
- 39.Eoh H and Rhee KY. Multifunctional essentiality of succinate metabolism in adaptation to hypoxia in Mycobacterium tuberculosis. Proc Natl Acad Sci. 2013;16;110(16):6554–9. 10.1073/pnas.1219375110 [DOI] [PMC free article] [PubMed] [Google Scholar]
- 40.Watanabe S, Zimmermann M, Goodwin MB, Sauer U, Barry CE 3rd, Boshoff HI. Fumarate reductase activity maintains an energized membrane in anaerobic Mycobacterium tuberculosis. PLoS Pathog. 2011;7(10):e1002287 10.1371/journal.ppat.1002287 [DOI] [PMC free article] [PubMed] [Google Scholar]
- 41.Singhal A, Arora G, Sajid A, Maji A, Bhat A, Virmani R, et al. Regulation of homocysteine metabolism by Mycobacterium tuberculosis S-adenosylhomocysteine hydrolase. Sci Rep. 2013;3:2264 10.1038/srep02264 [DOI] [PMC free article] [PubMed] [Google Scholar]
- 42.Newton GL, Buchmeier N, Fahey RC. Biosynthesis and functions of mycothiol, the unique protective thiol of Actinobacteria. Microbiol Mol Biol Rev. 2008;72(3):471–94. 10.1128/MMBR.00008-08 [DOI] [PMC free article] [PubMed] [Google Scholar]
- 43.Boshoff HI, Xu X, Tahlan K, Dowd CS, Pethe K, Camacho LR, et al. Biosynthesis and recycling of nicotinamide cofactors in Mycobacterium tuberculosis. An essential role for NAD in nonreplicating bacilli. J Biol Chem. 2008;11;283(28):19329–41. 10.1074/jbc.M800694200 [DOI] [PMC free article] [PubMed] [Google Scholar]
Associated Data
This section collects any data citations, data availability statements, or supplementary materials included in this article.
Supplementary Materials
Growth of DPI treated culture in Dubos broth: The continuously growing mycobacterial culture of an OD600 ~0.35 treated with the 4 μg/mL of DPI for 24–36 hrs. Treated and untreated culture washed twice, resuspended as 1:10 dilution in the fresh Dubos albumin broth supplement and incubated for at 37 oC with stirring. After the 9–10 days of incubation image were captured and processed using Microsoft paint software.
(JPG)
Standardization of Live/dead assay A) Standard plot of % live cell (percentage of live and dead cell obtained by Isopropanol treatment) versus 630/530nm ratio. B) Fluorescence reading of with treated and untreated culture at Ex. 470 and Em. 500-700nm. Assay standardization was done according to manufacture instruction (Invitrogen, Life technology).
(JPG)
(JPG)
An aliquot of 200 μL of DPI treated bacilli periodically transferred to 96 well plates and incubated with XTT (A) and INT (B) tetrazolium salt. After 20 min incubation with XTT, 60 μM of menadione were added and plate further incubated for 40 mins. The absorbance was measured at 470 nm for XTT reduction assay or 495 nm for the INT reduction assay. Data shown as the mean of three identical results with ±SD.
(JPG)
The mycobacterial culture was treated with 4 μg/mL of DPI (OD 600nm = 0.35) for 24–36 h, washed and resuspended in fresh Dubos albumin broth. The various concentration of the Pyrogallol or Menadione were added and incubated for at 37 oC. At various time point growth was measured in the form of fluorescence a Ex/Em. 587/610 nm. Data shown as the mean of triplicate results with ±SD.
(JPG)
Venn diagram for common feature analysis in A) Positive and B) Negative ion mode analysis.
(TIF)
Cloud plots of altered metabolites for each time points by A) Positive and B) Negative ion mode.
(TIF)
(PDF)
(DOC)
Data Availability Statement
All relevant data are within the manuscript and its Supporting Information files.


