

Abstract
Ca2+ channel β subunits regulate cell-surface expression and gating of voltage-dependent Ca2+ channel α1 subunits. Based on primary sequence comparisons, β subunits are predicted to be modular structures composed of five domains (A–E) that are related to the large family of membrane-associated guanylate kinase proteins. The crystal structure of the β subunit core B–D domains has been reported recently; however, little is known about the structures of the A and E domains. The N-terminal A domain differs among the four subtypes of Ca2+ channel β subunits (β1–β4) primarily as the result of two duplications of an ancestral gene containing multiple alternatively spliced exons. At least nine A domain sequences can be generated by alternative splicing. In this report, we focus on one A domain sequence, the highly conserved β4a A domain. We solved its three-dimensional structure and show that it is expressed in punctate structures throughout the molecular layer of the cerebellar cortex. We also demonstrate that it does not participate directly in Cav2.1 Ca2+channel gating but serves as a binding site in protein–protein interactions with synaptotagmin I and the LC2 domain of microtubule-associated protein 1A. With respect to β4 subunits, the interactions are specific for the β4a splice variant, because they do not occur with the β4b A domain. These results have strong bearing on our current understanding of the structure of alternatively spliced Ca2+ channel β subunits and the cell-specific roles they play in the CNS.
Keywords: Ca2+ channel, β4a subunit, alternative splicing, protein structure, molecular layer of cerebellum, synaptotagmin
Introduction
Alternative splicing of neuronal genes has evolved as a mechanism for fine tuning many cell functions, including axonal migration and neurotransmitter release (Lipscombe, 2005). Alternative splicing of voltage-gated Ca2+ channel α1 and β subunits has been shown to alter gating, current density, pharmacology (Bourinet et al., 1999; Helton et al., 2002; Bell et al., 2004), and responsiveness to signaling proteins, such as syntaxin (Kaneko et al., 2002) and Ca2+-calmodulin (Chaudhuri et al., 2004). The structural consequences of these splicing events are poorly understood.
Ca2+ channel β subunits (subtypes 1–4) are members of the membrane-associated guanylate kinase family of proteins and are composed of five modules, A–E (Hanlon et al., 1999). Hypervariable A, C, and E domains are connected by Src homology 3 (SH3) (B) and guanylate kinase (GK) (D) folds. The crystal structure of core domains, B–D, has been reported recently (Chen et al., 2004; Opatowsky et al., 2004; Van Petegem et al., 2004). Little is known, however, about the structures of the A and E domains. The main objective of this study was to determine the structure, distribution, and function of the β4a subunit A domain (β4a-A).
We showed previously that alternative splicing of the β4 subunit A domain created two functionally distinct proteins, β4a and β4b (Helton and Horne, 2002) and, in a recent report (Vendel et al., 2006), revealed the solution structure of the β4a-A. In the present study, we show that the structure of the β4a-A fits correctly with the crystal structure of the core B–D domains and that the structure has been highly conserved throughout vertebrate evolution. Our electrophysiological experiments demonstrate that removal of the A domain does not impact expression or voltage-dependent gating of Cav2.1 Ca2+ channels. This is in contrast to our previous results with the β4b splice variant, with which we showed that mutating key residues in the β4b-A had significant effects on activation and inactivation of Cav2.1 (Helton et al., 2002). The immunocytochemistry studies in our present report show that β4a is widely expressed in punctate structures throughout the molecular layer of the cerebellar cortex. In contrast, β4b is expressed in Purkinje cell bodies and Bergmann glia, and β3, which is similar in sequence to β4a, is found in basket cell structures surrounding Purkinje cells. Yeast two-hybrid screening identified synaptotagmin I (Syt I) and microtubule-associated protein 1A (MAP1A) as potential binding partners for the β4a-A; Syt I, but not MAP1A, also interacted with β3-A. The β4b-A did not interact with either protein. Pull-down experiments confirm the β4a-A–Syt I interaction and show that the interaction is reversed in the presence of Ca2+. We propose that the β4a-A is not directly involved in the gating of Cav2.1 Ca2+ channels but has a cell-specific intermediary role in regulating Ca2+ channel function through protein–protein interactions.
Materials and Methods
Protein expression and purification.
Detailed methods for β4a A domain expression and purification have been described previously (Vendel et al., 2006). Briefly, the human β4a-A (residues 1–58 of the full-length sequence) was cloned into a 6His-expression vector (pET-15b; Novagen, Madison, WI) and expressed in Escherichia coli strain BL21-CodonPlus(DE3)-RIL (Stratagene, La Jolla, CA). 6His–β4a-A was purified by Ni2+ affinity chromatography, thrombin cleaved to remove the 6His-tag, and further purified by anion exchange chromatography (Mono Q; Amersham Biosciences, Piscataway, NJ). Identical procedures were used to purify human β3-A (residues 1–59 of the full-length sequence). The human β4b-A (residues 1–92 of the full-length sequence) was cloned into a glutathione S-transferase (GST) expression vector (pGEX6P1; Amersham Biosciences) and expressed in E. coli strain BL21-Rossetta-pLysS (Novagen). GST-β4b-A was purified by glutathione affinity chromatography, preScission protease cleaved (Amersham Biosciences) to remove the GST tag, and further purified by cation exchange column chromatography (Mono S; Amersham Biosciences). To purify synaptotagmin I, nucleotides coding for the C2A and C2B domains (residues 140–420), were amplified from a human full-length cDNA (MHS1010–9205762; Open Biosystems, Huntsville, AL) and cloned into the pET-15b bacterial expression plasmid (Novagen). The N-terminal His-tagged fusion protein (6His–C2AC2B) was expressed in E. coli strain Codon+ BL21 (DE3) pLysS (Stratagene). Cells were grown at 37°C to an OD600 of 0.7 and induced with 0.5 mm isopropyl-β-d-thiogalactopyranoside for 3 h. Cells were harvested by centrifugation and lysed by sonication in 50 mm sodium phosphate, 300 mm NaCl, and 10 mm imidazole, pH 8 (Ni2+-load buffer). The 6His–C2AC2B protein was removed from the soluble fraction by Ni2+-NTA resin affinity chromatography (Novagen) and washed extensively with Ni2+-load buffer to remove contaminants. Bound protein was eluted with 50 mm sodium phosphate, 300 mm NaCl, and 1 m imidazole, pH 8 (elute buffer). The 6His–C2AC2B protein was dialyzed against 50 mm sodium phosphate and 5 mm EDTA, pH 6.5, overnight at 4°C. Additional purification of 6His–C2AC2B was accomplished by fast protein liquid chromatography using a CM52 cation exchange column (Amersham Biosciences). Identity of all purified proteins was confirmed by electrospray mass spectrometry. Preliminary assessment of proper protein folding was determined by circular dichroism (CD) spectroscopy.
CD and nuclear magnetic resonance spectroscopy.
For β4a-A CD, 30 μm protein samples were prepared in 20 mm NaPO4 and 50 mm NaCl and adjusted to pH 5, 6, or 7. CD spectra were acquired at 5°C with an Aviv 202 spectrometer (Aviv Biomedical, Lakewood, NJ). For 6His–C2AC2B CD, 10 μm protein samples were prepared in 50 mm NaPO4, 300 mm NaCl, 10 mm imidazole, 1 mm DTT, and 2 mm EGTA, pH 7.0, at 25°C. CD spectra were acquired at 25°C. For nuclear magnetic resonance (NMR), the β4a-A samples were prepared in 50 mm sodium phosphate, 150 mm NaCl, 10% D2O, and 100 μm sodium azide, pH 5.5. NMR spectra were acquired with a Varian (Palo Alto, CA) Unity Inova spectrometer operating at 500.1 MHz for 1H NMR. Data were processed with NMRPipe (Delaglio et al., 1995) and analyzed with NMRView (Johnson and Blevins, 1994). Structural calculations were performed using Crystallography and NMR Systems (Brunger et al., 1998). Detailed methods for sequence specific backbone and side-chain assignments, nuclear Overhauser effect constraints, and structure determination have been described previously (Vendel et al., 2006).
Construction of BCDE cDNA.
Full-length β4a cDNA (Helton and Horne, 2002) was used as template to amplify a BCDE PCR fragment using the Expand High Fidelity PCR System (Roche Products, Indianapolis, IN) and the following primers: forward, 5′-CGGGATCCCGCCACCATGGTAGCATTTGCCGTG; reverse, 5-TATCTCGAGCTATCA-AAGCCTATGTCG. The PCR product was digested with BamHI and XhoI and cloned into pBluescript II SK+ (Stratagene) in two steps. The BamHI/XhoI digest of the PCR product yielded two cDNA fragments, a 219 bp BamHI/BamHI fragment and a 1087 bp BamHI/XhoI fragment. The larger fragment was cloned into BamHI/XhoI-digested pBluescript II SK+ to create construct 1. The smaller fragment was cloned into BamHI-digested construct 1 to create the final BCDE construct.
Electrophysiology.
cRNAs were synthesized using the mMessage mMachine capped RNA transcription system (Ambion, Austin, TX). To characterize the effects of removing the β4a-A, full-length α1 and α2δ-1 cRNAs were injected into Xenopus laevis oocytes at equimolar ratios along with different amounts of β4a or BCDE. The β4a and BCDE cRNAs were coinjected at 1:1, 1:4, and 1:12 molar ratios relative to α1A (5.6 ng of α1A, 2.4 ng of α2δ-1, and 1.8, 7.4, or 22 ng of β4a or BCDE in 46 nl). Ca2+ channel currents were recorded at 24°C 1–6 d later by standard two-electrode voltage clamp (OC-725B amplifier; Warner Instruments, Hamden, CT). Currents were recorded in 5 mm Ba(OH)2, 5 mm HEPES, 85 mm tetraethylammonium-OH, and 2 mm KOH, pH adjusted to 7.4 with methanesulfonic acid. Data were collected and analyzed using pClamp8 software (Molecular Devices, Palo Alto, CA). The leak and capacitive currents were subtracted on-line using a standard P/4 protocol. Statistical analysis was performed with a Student’s two-sample equal-variance t test with a two-tailed distribution. Data are presented as mean ± SEM.
Affinity-purified polyclonal antibody production.
The following amino acid sequences were submitted for peptide synthesis (Macromolecular Resources, Fort Collins, CO): β4a-A, CGGYDNLYLHGIEDSE; β4b-A, CGGYAKNGTADGPHSPT. The identity of each peptide was confirmed by matrix-assisted laser desorption/ionization reflector time-of-flight mass spectrometry. Peptides were conjugated to keyhole limpet hemacyanin before rabbit immunization. Final bleeds were performed ∼90 d after initial injection. Antibodies (1450, anti-β4a-A; 1448, anti-β4b-A) were affinity purified using purified recombinant β4a-A or β4b-A protein coupled to Affi-Gel 15 Gel (Bio-Rad, Hercules, CA) for the 1450 antibody or Affi-Gel 10 Gel (Bio-Rad) for the 1448 antibody, respectively.
Western blot analysis.
Proteins were separated by SDS-PAGE and transferred at 30 V to Immun-Blot polyvinylidene difluoride membranes (Bio-Rad) overnight at 4°C. Membranes were blocked with TBS/Tween 20/5% milk (Blotto) and incubated with rabbit polyclonal primary antibody overnight at 4°C [anti-β4aA-1, 1:000–1:10,000 depending on experiment; anti-β4bA, 1:1000; anti-β3 (Chemicon, Temecula, CA), 1:1000; or anti-6His (Abcam, Cambridge, MA), 1:1000]. Membranes were washed three times with Blotto before a 2 h incubation with alkaline phosphatase-conjugated goat anti-rabbit IgG (1:2000) at 26°C. Membranes were washed four times with Blotto and two times with 150 mm NaCl and 50 mm Tris, pH 7.5, before development with bromochloroindolyl phosphate/nitro blue tetrazolium (Novagen) at 26°C.
Immunocytochemistry.
Adult (>2 months) C57BL/6 mice anesthetized with xylazine (4 mg/kg) and ketamine (21 mg/kg) were transcardially perfused with 10 ml (5 ml/min) of heparanized saline (0.9%), followed by 25 ml of 4% paraformaldehyde in 0.1 m phosphate buffer (PB), pH 7.5. For synaptotagmin detection, 1% acrolein was included in the perfusion buffer. For light microscopy, brains were removed and postfixed overnight in the same fixative at 4°C. Brains were washed repeatedly in 0.1 m PB, pH 7.5. Cerebellums were isolated, embedded in 5% agarose, sectioned at 50 μm with a vibratome [Leica (Nussloch, Germany) VT1000S; E. Licht, Denver, CO], and collected into PBS, pH 7.5. Sections were subjected to the following antigen retrieval procedures before antibody treatments (Jiao et al., 1999): 30 min soak in 0.1 m glycine in PBS, followed by three washes in PBS at 4°C; 15 min soak in 0.5% sodium borohydride in PBS, followed by four washes in PBS at 4°C; 60 min soak in 0.05 sodium citrate, pH 8.6, at 26°C; and 30 min soak in 0.05 sodium citrate, pH 8.6 at 80°C, followed by 30 min slow cool to 24°C and three washes in PBS. Cerebellar sections were blocked with PBS containing 5% normal goat serum (NGS), 0.5% Triton X-100 (TX), and 1% hydrogen peroxide at 4°C. Sections were incubated for 36 h at 4°C with the following dilutions of primary affinity-purified polyclonal antibodies: rabbit anti-β4a, 1:1000; rabbit anti-β4b, 1:500; rabbit anti-β3, 1:500; rabbit anti-calbindin, 1:500 (Sigma, St. Louis, MO); or mouse anti-synaptotagmin (Chemicon MAB5202), 1:1000. After incubation with primary antibody, sections were washed four times with PBS and then incubated with biotin-conjugated donkey anti-rabbit or donkey anti-mouse (1:2500; Jackson ImmunoResearch, West Grove, PA) in 1% NGS and 0.5% TX for 2 h at 24°C. Immunoreactions were detected using a Vectastain Elite kit (Vector Laboratories, Burlingame, CA). For preabsorption experiments, 5 μg of anti-β4a, anti-β4b, or anti-β3 antibodies were incubated for 2 h at 26°C with 5 μg of purified recombinant β4a-A, β4b-A, or β3 control antigen (Chemicon), respectively, before making the above dilutions. For fluorescence microscopy, brains were stored at 4°C overnight in 4% paraformaldehyde in 0.1 m phosphate buffer, pH 7.5, containing 30% sucrose and sectioned at 40 μm on a sliding microtome equipped with a freezing stage (Physitemp Instruments, Clifton, NJ). Sections were collected in PB and processed as described above, with the exception that sections were not subjected to antigen retrieval and the secondary antibody used was Alexa Fluor 488 conjugated (1:2000; Invitrogen, Carlsbad, CA). Fluorescence immunolabeling was analyzed by laser scanning confocal microscopy (LSM Meta 510; Zeiss, Thornwood, NY).
Yeast two-hybrid screening.
Yeast strain AH109 (Clontech, Palo Alto, CA) was used in yeast two-hybrid experiments. The bait vector was created by cloning the β4a-A into the Gal4 DNA-binding domain vector pGBKT7 (Clontech) to yield pGBKT7-β4a-A. A human cerebellum cDNA library was generated from poly(A+) mRNA (Clontech) using the BD Matchmaker Library Construction and Screening kit (Clontech). AH109 cells were transformed with pGBKT7-β4a-A, the cerebellum library, and the Gal4 activation domain (AD) vector pGADT7-rec (Clontech). Target vectors (pGADT7-rec with incorporated cDNAs) were thus generated by in vivo homologous recombination. Yeast two-hybrid screens were accomplished by plating cells onto agar made in minimal media lacking tryptophan, leucine, adenine, and histidine (QDO plates). Bait and target vectors were rescued from surviving colonies with the Yeastmaker plasmid isolation kit (Clontech) according to the instructions of the manufacturer. Interacting targets were isolated from bait vector by transformation into E. coli XL1-Blue cells and plating onto agar containing 50 μg/ml ampicillin. The identity of target cDNAs was determined by fluorescence-based DNA sequencing. Interactions were confirmed by another transformation of AH109 cells with pGBKT7-β4a-A and individual target vectors. Cells were grown in selection media, and a 10-fold serial dilution series was created. As a final step, 10 μl of each dilution was spotted onto agar plates that were supplemented with 30 mm 3-aminotriazole (3′-AT) (Sigma) but lacking in tryptophan, leucine, adenine, and histidine (3′-AT-QDO plates).
Ni2+-NTA bead pull-down experiments.
Purified, lyophilized 6His–C2AC2B (∼1 mg) was resuspended in 50 mm sodium phosphate, 300 mm NaCl, and 10 mm imidazole, pH 7.5 (pull-down buffer) and incubated with 150 μl of Ni2+-NTA beads for 30 min at 4°C. The 6His–C2AC2B beads were washed once in 500 μl of pull-down buffer and then incubated with either 50 nmol of purified β4a-A or β4b-A in 500 μl of pull-down buffer for 2 h at 4°C. For Ca2+-dependence experiments, 10 mm CaCl2 was included in the pull-down buffer at this stage. The beads were washed with pull-down buffer (three times, 500 μl) to remove any unbound protein. 6His–C2AC2B and associated proteins were eluted with 50 mm sodium phosphate, 300 mm NaCl, and 1 m imidazole, pH 8 (elute buffer). Load, wash, and elute fractions were analyzed by 4–15% gradient PAGE and Coomassie blue staining. Elute fractions were evaluated by Western blot analysis.
Results
Structure of the β4a A domain
Alignment of human β4a-A amino acids, 1–58, with a zebrafish homolog demonstrates that the β4a-A has been conserved throughout vertebrate evolution (Fig. 1A). Alignment with the human β3-A shows that the exons coding for the A domains of β4a and β3 have evolved from a common ancestor. With the exception of two homologous substitutions, human and zebrafish β4a are identical up to amino acid 36. In contrast, the human β3-A contains nonhomologous substitutions in the very N-terminal region predicted to be an α helix and an insertion between two predicted β strands. Compared with human β4a and β3, the zebrafish homolog contains a four amino acid insertion in a predicted loop structure. All three β subunit A domains share a highly conserved C-terminal α helix. This analysis suggests that the sequences of β4a-A and β3-A have been selected to perform similar functions; however, the histidine to proline substitution at the eighth residue of β3 likely disrupts the formation of the first helix. This could represent a mechanism for fine-tuning the function of Ca2+ channel β subunit A domains.
Figure 1.

Structure of the human β4a A domain. A, Alignment of human and zebrafish β4a and human β3 N-terminal A domains. Identical residues and conservative substitutions are shaded blue and red, respectively. β4a-A predicted secondary structure shown as tubes (α helix) and arrows (β strand) (Protein Sequence Analysis server, http://bmerc-www.bu.edu/psa) (White et al., 1994). Numbers refer to β4a-A residues. B, Circular dichroism spectra of the purified β4a-A at pH 5 (⋄), 6 (□), and 7 (○). C, Solution structure of the β4a-A determined to a root mean square deviation of 0.73 Å. The structure contains two α helices (α1, α2) and two β strands (β1, β2) connected by three loops (L1–L3). The structure has been deposited in the Protein Data Bank (code 2D46). D, Combined β4a-A solution structure and β2a B–D crystal structure (Van Petegem et al., 2004). The figure is labeled as follows: A, A domain; SH3, Src homology 3, B domain; Linker, sequence connecting SH3 and GK domains, C domain; GK, guanylate kinase, D domain; AID, Ca2+ channel α1 subunit interaction domain; C-terminal Domain, beginning of the C-terminal domain (structure unknown). The software program “O” (version 8.0.11) was used to perform the merger of the two structures (Jones et al., 1991). PyMOL molecular graphics software version 0.96 was used to generate structure figures.
To verify predicted secondary structure and to determine the tertiary structure of the β4a-A, we set out to solve its structure using methods in NMR spectroscopy. As a first step, we performed CD spectroscopy to determine whether the purified protein had an organized fold. Figure 1B shows three overlapping CD spectra acquired at pH 5, 6, and 7, with prominent signal at 222 and 208 nm. The minima at 222 and 208 nm are indicative of α helical structure; the plateau from 212 to 218 nm suggests that the protein may possess β-strand structure. The fact that the minima at 208 nm are shifted toward 200 nm indicates that they also contain some random coil elements. These results gave us the first indication that the β4a-A folds independently of the rest of the β4 subunit and that it contains a mixture of secondary structures. The purpose of performing the CD spectra at different pH values was to demonstrate that the structure is pH stable and thus amenable to NMR studies at lower pH (improves signal by reducing amide-solvent proton exchange). The NMR solution structure obtained at pH 5.5 is shown in Figure 1C. The experimental details involved in solving the solution structure have been published previously (Vendel et al., 2006). The figure shows that the β4a-A consists of a short N-terminal α helix (α1) orthogonal to a longer C-terminal α helix (α2), three loops (L1, L2, and L3), and a pair of short, anti-parallel β strands (β1 and β2). The α2 helix of the A domain is conserved in all β subunits and is the most N-terminal helix present in crystal structures of truncated β2a and β3 subunits (Chen et al., 2004; Opatowsky et al., 2004; Van Petegem et al., 2004). Merging the NMR-derived structure of the β4a-A with the x-ray crystal structure of the core domains of β2a [Protein Data Bank code 1T0J (Van Petegem et al., 2004)] reveals that the A domain is oriented away from and at an angle to the SH3 fold and SH3-GK linker (Fig. 1D). The crystal structures show that residues of the α2 helix make contacts with the distal surfaces of the RT loop, the hydrophobic core, and the distal loop of the SH3 domain. Amino acids E44, A47, Q50, L51, A54, and K55, conserved in all β subunits, are the principal residues involved in packing against the SH3 domain. These interactions are likely important for stabilization and proper orientation of the A domain away from the core SH3 and GK domains. The positioning of the A domain away from the α1 subunit interaction domain (AID) suggests that it is not directly involved in gating.
The β4a A domain is not essential for Ca2+ channel gating
To determine whether or not the β4a-A was necessary for channel gating, we created a truncated cRNA construct (BCDE) lacking exons 1 and 2 that code for the A domain and studied its properties when coinjected with α1 (Cav2.1) and α2δ-1 cRNAs in Xenopus oocytes. Because others have shown that β subunits have concentration-dependent effects on gating (Canti et al., 2001; Yasuda et al., 2004), we compared the properties of full-length β4a and BCDE at three different cRNA concentrations (1.8, 7.4, and 22.0 ng/oocyte; labeled 1X, 4X, and 12X in Fig. 2A, inset) while maintaining α1 and α2δ-1 amounts constant. We also characterized the effects of α1 and α2δ-1 alone on each gating parameter examined. Figure 2A displays current size plotted against time after cRNA injection. It shows that increasing injected amounts of either β4a or BCDE has a marked effect on the time after injection that currents can be measured. To reach 0.5 μA requires 5–6 d in the absence of a β4 construct and 3–4 or 1–2 d at low and high levels of β4a or BCDE, respectively. Representative normalized current traces resulting from varying the amounts of β4a and BCDE injected per oocyte are shown in Figure 2B. The rate of open-state inactivation for low concentrations of β4a or BCDE is similar to that seen in the absence of β4 cRNA. However, as the concentration of the β4 cRNA is increased, the rate of inactivation progressively slows; the degree of slowing is similar for both β4a and BCDE. Similar changes are observed when examining the voltage dependence of activation (Fig. 2C) and closed-state inactivation (Fig. 2D). At the lowest concentration of β4a, activation occurs over a voltage range identical to that of α1 and α2δ-1 alone; however, with increasing concentrations of β4a, the I–V curves shift progressively to more hyperpolarized potentials (Fig. 2C, top). The V1/2 values for activation are as follows: α1/α2δ-1, −4.70 ± 0.05 mV (n = 10); 1.8 ng of β4a, −4.25 ± 0.03 mV (n = 12); 7.4 ng of β4a, −9.05 ± 0.06 mV (n = 10); 22.0 ng of β4a, −13.25 ± 0.04 mV (n = 10). Similar activation results were obtained with increasing concentrations of BCDE (Fig. 2C, bottom). The V1/2 values for activation are as follows: 1.8 ng of BCDE, −4.69 ± 0.04 mV (n = 10); 7.4 ng of BCDE, −11.48 ± 0.10 mV (n = 8); 22.0 ng of BCDE, −11.28 ± 0.06 mV (n = 12). The V1/2 values at the lowest and highest concentrations of β4a and BCDE are not statistically different. At the lowest concentration of β4a, closed-state inactivation occurs over a voltage range identical to that of α1 and α2δ-1 alone; however, increasing β4a concentrations shifts the inactivation curves in a stepwise manner to more hyperpolarized potentials (Fig. 2D, top). The V1/2 values for inactivation are as follows: α1/α2δ-1, −21.07 ± 0.09 mV (n = 7); 1.8 ng of β4a, −21.80 ± 0.03 mV (n = 10); 7.4 ng of β4a, −31.72 ± 0.05 mV (n = 7); 22.0 ng of β4a, −30.55 ± 0.05 mV (n = 9). Like β4a, increasing concentrations of BCDE resulted in a progressive shift to more hyperpolarized potentials (Fig. 2D, bottom). The V1/2 values for inactivation are as follows: 1.8 ng of BCDE, −27.80 ± 0.05 mV (n = 10); 7.4 ng of BCDE, −37.19 ± 0.04 mV (n = 8); 22.0 ng of BCDE, −35.43 ± 0.05 mV (n = 11). In this case, the V1/2 of inactivation of BCDE is shifted 5–6 mV to the left relative to the V1/2 of β4a, but the difference is not statistically significant (p = 0.124). These results indicate that the β4a-A is not required for Cav2.1 complex assembly and plasma membrane insertion and that it does not play a role in concentration- or voltage-dependent effects on gating.
Figure 2.

Electrophysiological comparison of full-length β4a and BCDE. A, Cav2.1 current size as a function of time after injection of no β (X), β4a (filled symbols), or BCDE (open symbols) cRNA. Inset, RNA gel showing α1, α2/δ mixtures with increasing amounts of β4 constructs (β4 to α1 ratios: squares, 1:1 β4 molar ratio relative to α1; diamonds, 4:1 ratio; circles, 12:1 ratio). B, Representative Cav2.1 current traces in the absence (dashed line on top of gray trace) and presence of β4a (black traces) or BCDE (gray traces). Effects of increasing injected amounts (in nanograms) of β4 constructs on rate of inactivation are indicated by arrows. C, Effects of increasing injected amounts (in nanograms) of β4a (top) and BCDE (bottom) on Cav2.1 activation. D, Effects of increasing amounts (in nanograms) of β4a (top) and BCDE (bottom) on Cav2.1 closed-state inactivation. Symbols represent mean values, and lines serve to connect data points.
Cell-specific expression of β subunits in the cerebellar cortex
As a step toward determining the function of the β4a-A, we next compared the cellular distribution of the β4a subunit, the N-terminal β4 splice variant, β4b, and the β3 subunit in mouse cerebellar cortex. We generated polyclonal antisera directed toward N-terminal peptide sequences of β4a and β4b (Fig. 3A, highlighted sequences) and affinity purified the splice variant-specific antibodies using purified recombinant β4a-A and β4b-A protein. Because the sequence of β3 is similar to β4a in the region used to generate the β4a antibody (Fig. 3A), it was important to examine the distribution of β3 to be sure that the β4a antibody did not cross-react. Western blots performed with affinity-purified antibodies reveal that all three antibodies label single 52–55 kDa protein bands in purified cerebellar membrane preparations (Fig. 3B). Supplemental Figure 1 (available at www.jneurosci.org as supplemental material) shows by Western blot analysis that the β4a and β4b antibodies label their respective purified recombinant A domains and do not cross-react. Moreover, the β4a-A antibody does not cross-react with recombinant β3-A protein. The β3 antibody used in these studies is directed toward a β3 subunit-specific C-terminal sequence and does not cross-react with either β4a-A or β4b-A. In Figure 3C, calbindin-labeled Purkinje cells in sections of cerebellar cortex serve to define the orientation of the molecular layer, Purkinje cell layer, and granule cell layer in subsequent panels. Figure 3, D and E, reveals that the affinity-purified β4a antibody selectively labels punctate elements in the molecular layer. Discrete puncta are seen in a ∼1-μm-thick confocal image using a fluorescent-tagged secondary antibody (Fig. 3D). The same punctate labeling can also be seen when DAB-nickel reaction product is viewed in 50-μm-thick sections (Fig. 3E). With this method, lines of dark puncta are seen forming the outlines of Purkinje cell dendrites. Some punctate labeling is also seen in the granule cell layer. Overall, this pattern of immunoreactivity suggests that the β4a subunit is expressed primarily at synapses in the molecular layer. The distribution pattern of the β4b subunit is strikingly different from that of β4a. Immunoreactive β4b is detected in Purkinje cell bodies and throughout the fibers of Bergmann glia traversing the molecular layer (Fig. 3F). The granule cell layer appears to be devoid of β4b labeling. Although β3 and β4 subunits have clearly evolved from a common ancestor, the distribution pattern of β3 in cerebellum differs completely from that of β4a and β4b. Labeling is seen primarily in the Purkinje cell and granule cell layers (Fig. 3G), with the most striking labeling seen in the large basket cell synapses that surround individual Purkinje cells (Fig. 3G, inset). Compared with β4a and β4b, there is significantly more punctate β3 labeling in the granule cell layer. Supplemental Figure 2 (available at www.jneurosci.org as supplemental material) shows that preincubation of β4a, β4b, and β3 antibodies with corresponding recombinant A domain protein in the case of β4a and β4b and peptide immunogen in the case of β3 blocks the immunoreactivity seen with each of the antibodies.
Figure 3.
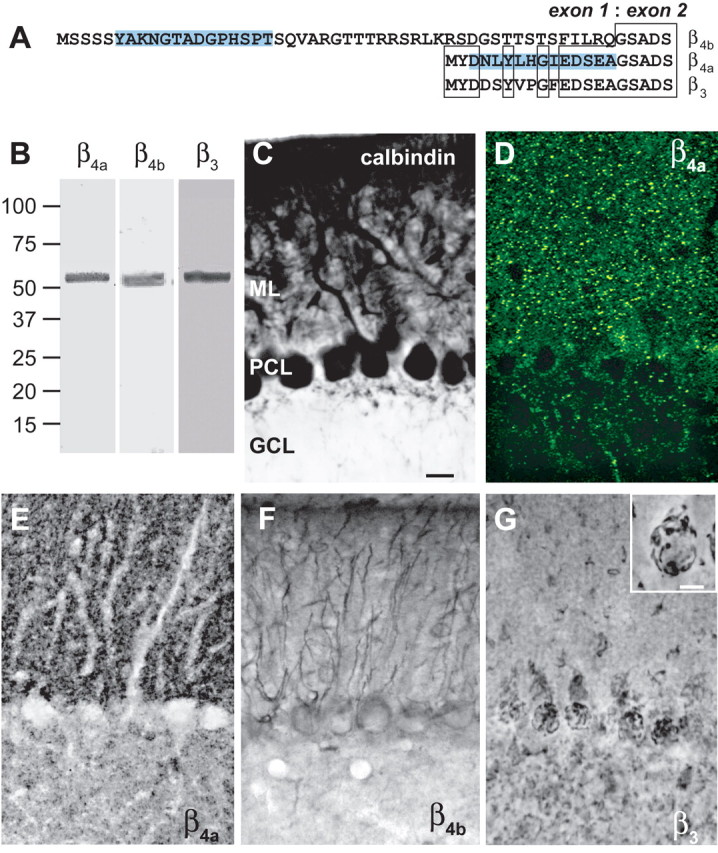
Distribution of β subunit subtypes in mouse cerebellum. A, Splice variant-specific antibodies were created against unique β4a and β4b sequences (highlighted). B, Western blot showing that β4a-, β4b-, and β3-specific antibodies recognize 52–55 kDa proteins in sucrose step gradient-purified mouse cerebellar membranes. Numbers to the left indicate molecular mass in kilodaltons. C, Purkinje cells labeled with anti-calbindin antibody (scale bar, 20 μm) serve to distinguish the molecular (ML), Purkinje cell (PCL), and granule cell (GCL) layers (for orientation in D–G). D, E, Punctate labeling of the β4a subunit in the molecular layer of the cerebellum: D, confocal microscopy, 1-μm-thick image; E, light microscopy, 50-μm-thick section. F, The β4b subunit is expressed in Purkinje cell bodies and Bergman glia. G, The β3 subunit is expressed in basket cell structures surrounding Purkinje cell bodies and in granule cell layer puncta. Inset, Higher-power image (scale bar, 10 μm) of basket cell labeling (supplemental Fig. 2, available at www.jneurosci.org as supplemental material).
The β4a A domain is involved in protein–protein interactions
Results thus far suggest that the β4a-A is highly conserved and is likely expressed at synapses but does not participate directly in Ca2+ channel gating. Given its structure and positioning relative to other β subunit domains, it is reasonable to assume that it might serve as an interaction site for intracellular proteins. To test this hypothesis, we used the yeast two-hybrid system to screen for possible protein–protein interactions involving the β4a-A (residues 1–58, shown in Fig. 1A). We used the human β4a-A as bait to screen for potential β4a-A binding partners in a human cerebellum cDNA library. Three separate screens yielded 32 potential protein–protein interactions, but only five of these survived on media plates supplemented with 30 mm 3′-AT (used to reduce leaky expression of the His3 gene) but lacking leucine, tryptophan, histidine, and adenine (3′-AT-QDO plates). Control experiments in which the pGBKT7 vector alone was paired with each of the five target constructs did not result in growth on plates lacking leucine, tryptophan, histidine, and adenine (QDO) or 3′-AT-QDO plates (data not shown). This indicates that the target proteins were not interacting with the expressed pGBKT7-binding domain. Four proteins were identified from the five target constructs: synaptotagmin I (two copies), MAP1A, the magphinin β product of the trophinin gene, and an unidentified bacterial artificial chromosome clone sequence. For the purposes of the present manuscript, we further characterized the interactions of synaptotagmin I and MAP1A with the A domains of β4a, β4b, and β3 subunits. Figure 4A shows that the target amino acid sequence for synaptotagmin I includes all of C2A and half of C2B (residues 95–337); the target sequence for MAP1A includes the entire LC2 domain of MAP1A (residues 2508–2775). Figure 4B summarizes the results of independent testing of nine bait–target pairs. Column 1 shows that all nine pairs survived on plates lacking leucine and tryptophan (DDO plates), indicating that both bait and target vectors were present in the yeast colonies in each case. To further test for false-positive protein–protein interactions, the β4a-A, β4b-A, and β3-A were paired with the pGADT7 vector to test for interactions of bait protein with the expressed Gal4 activation domain (Fig. 4B, top three rows). Figure 4B, column 2, shows no yeast growth under these conditions, demonstrating that the bait proteins do not interact with the Gal4 activation domain. When paired with the Gal4AD–Syt I fusion protein, growth on 3′-AT-QDO did occur in the presence of β4a-A and β3-A but not β4b-A (Fig. 4B, column 2, middle three rows); when paired with the Gal4AD–MAP1A fusion protein, growth on 3′-AT-QDO occurred only in the presence of β4a-A (Fig. 4B, column 2, bottom three rows). These results indicate that, in yeast two-hybrid assays, both β4a-A and β3-A interact with the synaptic vesicle protein synaptotagmin I but that interaction with MAP1A is specific for β4a-A.
Figure 4.

β4a-A protein–protein interactions. A, Yeast two-hybrid screening of a human cerebellar cDNA library identified Syt I and MAP1A as proteins that interact with the β4a-A. The green highlighted areas correspond to the protein regions encoded by the cDNAs isolated in the primary yeast two-hybrid screens. The Syt I cDNA codes for amino acids 95–337 of the full-length Syt I protein; the MAP1A cDNA codes for amino acids 2508–2775, corresponding to the complete LC2 domain of MAP1A. B, Characterization of β4a-A, β4b-A, and β3-A interactions with Syt I and MAP1A. Bait–target pairs were tested under two conditions: column 1, plates lacking leucine and tryptophan (DDO plates); column 2, plates lacking leucine, tryptophan, adenine, and histidine and supplemented with 30 mm 3′-AT. Growth of yeast colonies as shown in column 2 are indicative of interactions of β4a-A and β3-A with Syt I (rows 4 and 6, respectively) and interaction of β4a-A with MAP1A (row 7).
To confirm the β4a-A–Syt I interaction (the MAP1A interaction will be characterized in a subsequent manuscript), we designed a 6His–Syt I fusion construct that lacked the N-terminal transmembrane domain and encoded the soluble C2A and C2B domains (6His–C2AC2B, residues 140–420 of the full-length protein) for use in pull-down assays (Fig. 5). In addition, we verified that synaptotagmin is expressed in the cerebellar cortex. Figure 5A shows that a monoclonal antibody to synaptotagmin, like the anti-β4a-A antibody, selectively labels punctate elements in the molecular layer of the cerebellar cortex. In contrast to β4a-A labeling, the Syt DAB-nickel reaction product does not create noticeable outlines of Purkinje cell dendrites. This could be attributable in part to the thickness of the section (compare with β4a-A labeling in supplemental Fig. 2, available at www.jneurosci.org as supplemental material) but may also be a result of the more diffuse distribution of synaptic vesicles throughout the tissue compared with β4a-A (which may be localized to active zones). Another possibility is that the monoclonal antibody labels multiple synaptotagmin subtypes (the antibody used has not been epitope mapped), whereas the β4a-A interaction is specific for synaptotagmin I. Additional immunohistochemistry experiments with synaptotagmin I-specific antibodies are required to properly address this issue. The CD spectrum in Figure 5B shows that purified recombinant 6His–C2AC2B has an ellipticity minima near 216 nm, which is characteristic of a protein that is primarily β sheet. This result is in agreement with the x-ray crystal structure of synaptotagmin C2 domains (Sutton et al., 1995). With assurance that the recombinant protein construct was folded into a native-like structure, we then proceeded to characterize the β4a-A–6His–C2AC2B interaction in pull-down assays.
Figure 5.
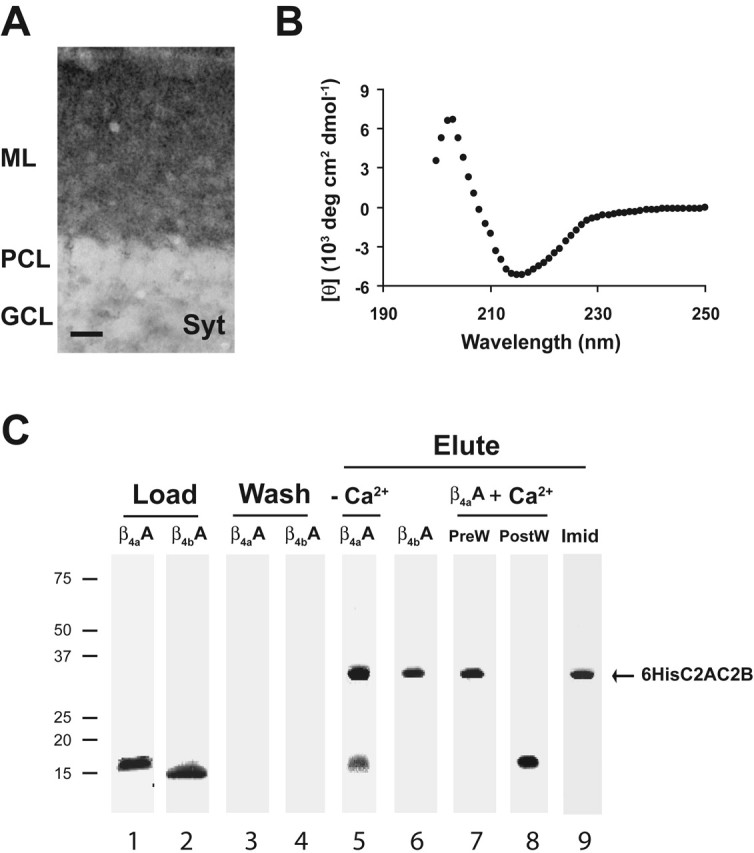
Synaptotagmin I labeling of cerebellar cortex and β4a-A interaction with 6His–C2AC2B in pull-down assays. A, Immunolabeling of mouse cerebellar cortex with anti-synaptotagmin antibody (scale bar, 20 μm). ML, Molecular layer; PCL, Purkinje cell layer; GCL, granule cell layer. B, CD spectrum of recombinant purified 6His–C2AC2B indicative of proper folding into a β-sheet structure. C, Pull-down assays analyzed by SDS-PAGE, using Coomassie blue-stained 5–15% polyacrylamide gels. Equal amounts (50 nmol each) of β4a-A and β4b-A (lanes 1, 2) were incubated with 6His–C2AC2B–Ni2+-NTA beads and washed until neither β4a-A or β4b-A appeared in the flow through (lanes 3, 4). Bound 6His–C2AC2B and any associated protein were eluted with 1 m imidazole. Lanes 5 and 6 show that β4a-A, but not β4b-A, associates with 6His–C2AC2B in the absence of added Ca2+. The interaction of β4a-A with 6His–C2AC2B does not occur when 10 mm Ca2+ is added before the wash step (PreW, lane 7). Addition of 10 mm Ca2+ to the assay after the wash step but before the imidazole elution competes off β4a-A (PostW, lane 8). Subsequent addition of 1 m imidazole elutes off 6His–C2AC2B (Imid, lane 9).
Preliminary experiments showed that, under the conditions of the assay, neither β4a-A nor β4b-A bound to Ni2+-NTA beads alone (data not shown). Figure 5C, lanes 1 and 2 (Load), show that approximately equal amounts of β4a-A and β4b-A protein were incubated with 6His–C2AC2B immobilized on Ni2+-NTA beads in the first step of the assay. [Note that the β4a-A has a very acidic pI (4.3) and runs anomalously high on SDS-PAGE gels.] Lanes 3 and 4 (Wash) demonstrate that, after extensive washing, there is no protein remaining in the flow through in the case of either β4a-A or β4b-A. Therefore, in the next step, application of 1 m imidazole (Elute) to the Ni2+-NTA beads would compete off 6His–C2AC2B and any associated proteins. Lanes 5 and 6 reveal that β4a-A, but not β4b-A, elutes off the beads with 6His–C2AC2B under these conditions. This is indicative of a specific interaction between β4a-A and synaptotagmin, in agreement with our yeast two-hybrid results. As a first step toward characterizing the Ca2+ dependence of the interaction, we added Ca2+ to the assay either before (PreW) or after (PostW) the wash step. Lane 7 (PreW) shows that incubation of the β4a-A and 6His–C2AC2B beads with Ca2+ before the wash step results in only 6His–C2AC2B being present in the imidazole eluate. If Ca2+ is added to the assay after the wash step (PostW) but before imidazole elution, the β4a-A appears in the flow through, indicating that it has been competed off of 6His–C2AC2B (lane 8). With subsequent elution with imidazole (Imid), the 6His–C2AC2B appears in the eluate (lane 9). These results show for the first time that the N terminus of the β4a subunit contains a protein binding domain that interacts with the synaptic vesicle protein synaptotagmin I.
To obtain preliminary data regarding the molecular details of the protein interaction site, we examined the three-dimensional surface distribution of charged amino acids. Figure 6A–C examines the relative surface potential of the β4a-A in three orientations. In Figure 6A, the A domain is oriented similarly to that shown in Figure 1D, such that the C-terminal portion of the α2 helix is directed toward the right. The positively charged surface (blue) to the right of the illustration is formed by the arginines and lysines in the α2 helix. The charged and hydrophobic surfaces to the left of the illustration are formed primarily by loop 3 residues. Amino acids E34 and R36 are shown for reference (Fig. 1A). In the middle view (Fig. 6B), the A domain has been rotated 180° in the horizontal plane relative to A. The very N terminus of the domain is seen in the center of the illustration, with the positive charge being the result of a histidine residue remaining after thrombin cleavage of the pET-15b–6His fusion protein. In Figure 6C, the A domain has been rotated clockwise 90° in the horizontal plane relative to B. Based on the predicted position of the A domain relative to the remainder of the β subunit, it is easy to speculate that this would be the surface most readily available to serve as a site for protein interactions. Interestingly, there is a single positively charged residue, R36, that protrudes from the surface and is flanked by two strongly hydrophobic residues, L32 and I39. There also appears to be an outer “ring” of negative charge surrounding the R36 that is provided by amino acids E34, E37, and E42. Of interest is the fact is that this surface is generated primarily by the amino acids that form loop 3. The similarities between β4a and β3 in this region may help to explain the interaction observed in the yeast two-hybrid experiment (Figs. 1A, 4B, column 2, row 6).
Figure 6.

Relative surface potential modeling of the β4a A domain. Three surface views of the β4a-A with blue, red, and white surfaces corresponding to positive, negative, and neutral charge, respectively. PyMOL molecular graphics software, version 0.97, was used to generate the figures. A, Side view with the C terminus positioned to the right, oriented approximately as shown in Figure 1D. Examples of negatively and positively charged residues, E34 and R36, respectively, are identified for orientation. B, The β4a-A is rotated 180° in the horizontal plane relative to A. The N terminus is projecting outward, perpendicular to the plane of the page. Note that the N terminus contains glycine, serine, and histidine residues remaining from the pET-15b thrombin cleavage site. Two negatively charged residues, E34 and E37, are identified for orientation. C, The β4a-A is rotated 90° clockwise in the horizontal plane relative to B. This view could represent the protein interaction surface as seen from inside the cell. A single residue, R24, from loop 2, and another, R36, from loop 3, contribute positively charged surfaces. Three residues from loop 3, E34, E37 and E42, contribute negatively charged surfaces. Potential hydrophobic surfaces are formed by four loop 3 nonpolar residues, V30, L32, A38, and I39.
Discussion
The evolution of alternative splicing mechanisms that target Ca2+ channel β subunit genes has served to amplify the structural diversity of these important proteins well beyond the basic pattern provided by four distinct gene classes (β1–β4). As evidence for this, a recently reported systematic reverse transcription-PCR screen detected 18 different alternatively spliced Cavβ isoforms in human cardiac ventricle alone (Foell et al., 2004). Characterizing the individual structural and functional properties that result from these splicing events represents an important challenge for the field. Our studies focus on the consequences of alternative splicing of β subunit N-terminal exons that code for the region referred to as the A domain (Hanlon et al., 1999). Figure 7illustrates that at least nine A domain variants arise from alternative splicing of exons that are found in this region (Helton and Horne, 2002; Takahashi et al., 2003; Foell et al., 2004), all of which are located upstream of the sequence that codes for the core SH3 (B) domain. To date, seven exons have been clearly identified in this region and, with subsequent tissue-specific investigations, more are likely to emerge (exons in Fig. 7 are labeled 1–7 in order of their 5′ to 3′ appearance in the β2 gene). The first exons of the β1 and β2 genes code for protein sequences sharing 28% identity, indicating that they have evolved from a common ancestor. The first exon of β4 does not appear to be related to exon 1 of either β1 or β2 but is arbitrarily labeled exon 1′ because of its similarity in length and gene location. Exon 2, coding for only 12 amino acids, is thus far unique to the β2 gene, as are exons 5 and 6. Exon 3 appears in β1, β2, and β4 splice variants. It codes for β1 and β2 protein sequences that are ∼77% identical; β1 and β4 exon 3 protein sequences are 35% identical. The fourth exons of β3 and β4 code for protein sequences (the first 15 residues in Fig. 1A) that are 70% identical, indicating that they too have evolved from a common ancestor. As with the β4 gene, exon 4 of β2 is a short sequence located between exons 3 and 5 but is labeled exon 4′ because of lack of sequence similarity. Exon 7 is the most highly conserved N-terminal exon across all four β subunit genes (75–88% protein sequence identity) and appears in all splice variants. Based on the structure of the β4a-A that we report herein, this suggests that β strands 1 and 2 and the α helix (α2 in β4a) encoded by this exon are critical to the function of all A domain splice variants.
Figure 7.

Alternative splicing of Ca2+ channel β subunit A domains. Splicing patterns of exons identified to date that code for the A domains of β subunits 1–4 (for review, see Takahashi et al., 2003; Foell et al., 2004). The diagram indicates that multiple A domain splicing variants have been identified for β subunits: β1, one variant; β2, five variants; β3, one variant; and β4, two variants. Exons are numbered relative to the positions of the seven exons on the β2 gene (for additional explanation of the relatedness of each exon, see Discussion). The first three amino acids (exons 1, 2, 4, 5, 6, and 7) or last two amino acids (exon 3) of individual exons are specified. The coding sequences for the SH3 (B) domain begin downstream of exon 7.
The main focus of this investigation has been a single A domain splice variant, β4a-A. It was first discovered while screening a human spinal cord cDNA library (Helton and Horne, 2002) and subsequently shown to be expressed throughout the CNS (Helton et al., 2002). Evolutionary conservation of the β4a-A suggests that the splicing event that generates this variant has an important functional outcome in neurons. We have shown previously that its electrophysiological effects on Cav2.1 channels differ from those imparted by the alternatively spliced variant β4b (Helton et al., 2002). When injected into oocytes at equimolar cRNA concentrations relative to α1 and α2 subunits, Cav2.1 complexes activate and undergo closed-state inactivation at depolarized potentials relative to complexes expressed with equimolar concentrations of β4b. Our present results extend these findings to show that the effects of β4a are concentration dependent. Increasing the concentration of β4a shifts the voltage dependence of activation and closed-state inactivation to more hyperpolarized potentials and slows the rate of open-state inactivation. This is somewhat in agreement with what has been reported for Cav2.2–β3 complexes (Canti et al., 2001; Yasuda et al., 2004). Interestingly however, at a holding potential of −80 mV, raising the concentration of β4a increases rather than decreases current size as was reported for β3 (Yasuda et al., 2004), and raising the concentration of β4a slows open-state inactivation of Cav2.1, whereas raising the concentration of β3 is without effect on open-state inactivation of Cav2.2 (Canti et al., 2001). These results emphasize the fact that β subunit effects on gating are α1 subunit-subtype specific (Helton et al., 2002). Of importance to this study is the fact that, for Cav2.1 complexes, in contrast to our previous findings with β4b (Helton et al., 2002), the role of the β4a subunit in enhancing channel expression and modifying gating does not require the presence of a β4a-A.
Our immunocytochemistry results indicate that cell-specific mechanisms that regulate gene transcription and protein translation contribute in a major way to the functional diversity of Ca2+ channel β subunits. The data suggest that, in cerebellum, β3-A and β4a-A have specialized roles at synapses and that β4b is important to the function of Purkinje cells and Bergmann glia. The punctate distribution of β4a in the molecular layer of the cerebellum is very similar to that reported for the Cav2.1 α1 subunit splice variant BI (Sakurai et al., 1996). Interestingly, the BI antibody (NBI-2) used by Sakurai et al. also appears to have labeled Bergmann glia. In this same report, an antibody (CNA3) generated toward the Cav2.1 α1 subunit splice variant, rbA, primarily labeled Purkinje cell bodies. This is similar to the pattern of Purkinje cell labeling exhibited by the anti-β4b antibody that we describe in this report. Together, these data further support the idea that specific α1 and β subunit pairs are expressed in different cell types to perform specialized functions. Additional experiments will be required to determine unambiguously that the β4a subunit is associated with Cav2.1 α1 subunits in molecular layer synapses.
Our yeast two-hybrid and 6His–C2AC2B pull-down results indicate that one role that the β4a-A, and perhaps β3-A, plays at synapses involves a Ca2+-dependent interaction with synaptotagmin. In pull-down assays, the β4a-A binds to 6His–C2AC2B in the absence of added Ca2+, whereas addition of Ca2+ prevents the interaction. This raises the possibility that β4a-A is involved in synaptic vesicle recruitment and/or docking before voltage-dependent opening of active zone Ca2+ channels. Precisely how this effects neurotransmitter release remains to be determined. Synaptotagmin has also been shown to interact directly with a “synprint” site in the II–III loop Ca2+ channel α1A subunits (Kim and Catterall, 1997) and, in previous reports, has been shown to have functional effects on channel gating when coexpressed with other β subunit subtypes lacking the β4a-A (Zhong et al., 1999; Cohen et al., 2003). Thus, the β4a-A is not the only means by which synaptotagmin can associate with Ca2+ channel complexes. Of note, however, is the fact that not all α1 subunits contain a synprint site (Zamponi, 2003). This is true for invertebrate and vertebrate Ca2+ channels. This raises the possibility that the β4a-A substitutes for the synprint site in some Ca2+ channel complexes, but additional experiments will be required to determine whether this is the case.
The solution structure of the human β4a-A reveals that it has a globular fold composed of two α helices and two anti-parallel β strands. The first α helix contains five amino acids (DNLYL). The LYL sequence packs against Y21 of the first β strand to form the hydrophobic core of the domain. The DN motif packs against the Q46 and Q50 residues of the second α helix. The first α helix therefore is essential for coordinating the overall structure of the domain. Amino acid substitutions in this region of β3 suggest that the β3-A lacks this essential α helix and therefore likely has a different structure. The two antiparallel β strands form a β sheet that, when packed against the first α helix, determines the orientation of loops 1–3. The second α helix is highly conserved among all β subunit subtypes. Merging the structure of the β4a-A with the β2a core structure indicates that, as described for the β2a core crystal structure (Van Petegem et al., 2004), several residues of this helix are important for interactions with the SH3 domain. This constraint orients the A domain away from the core of the β subunit, placing loop 3 residues >60 Å away from the AID. This fits with our findings that the A domain is not directly involved in Ca2+ channel gating and makes a strong case for loop 3 being the primary site for protein–protein interactions.
Determining the solution structure of the β4a A domain opens a new line of research that is relevant to splice variants of all four Ca2+ channel β subunit subtypes. Although it is clear that the core domains anchor β subunits to Ca2+ channel α1 subunits, the data reported here suggest that the polypeptide regions outside the core may be involved in nongating functions that are neuronal cell type specific. Our future experiments will be directed toward examining some of these specialized functions in more detail.
Footnotes
This work was supported by National Institutes of Health Grants NS42600, HD33441, MH62296, and NS24444. We thank Drs. N. Lorenzon and K. Beam for helpful discussions and assistance with confocal microscopy. We also thank Elodie Chaplain, Jessica Hellyer, and Kate Pothoven for untiring technical assistance.
References
- Bell TJ, Thaler C, Castiglioni AJ, Helton TD, Lipscombe D (2004). Cell-specific alternative splicing increases calcium channel current density in the pain pathway. Neuron 41:127–138. [DOI] [PubMed] [Google Scholar]
- Bourinet E, Soong TW, Sutton K, Slaymaker S, Mathews E, Monteil A, Zamponi GW, Nargeot J, Snutch TP (1999). Splicing of α1A subunit gene generates phenotypic variants of P- and Q-type calcium channels. Nat Neurosci 2:407–415. [DOI] [PubMed] [Google Scholar]
- Brunger AT, Adams PD, Clore GM, DeLano WL, Gros P, Grosse-Kunstleve RW, Jiang JS, Kuszewski J, Nilges M, Pannu NS (1998). Crystallography and NMR system: a new software suite for macromolecular structure determination. Acta Crystallogr D Biol Crystallogr 54:905–921. [DOI] [PubMed] [Google Scholar]
- Canti C, Davies A, Berrow NS, Butcher AJ, Page KM, Dolphin AC (2001). Evidence for two concentration-dependent processes for β-subunit effects on α1B calcium channels. Biophysical J 81:1439–1451. [DOI] [PMC free article] [PubMed] [Google Scholar]
- Chaudhuri D, Chang SY, DeMaria CD, Alvania RS, Soong TW, Yue DT (2004). Alternative splicing as a molecular switch for Ca2+/calmodulin-dependent facilitation of P/Q-type Ca2+ channels. J Neurosci 24:6334–6342. [DOI] [PMC free article] [PubMed] [Google Scholar]
- Chen YH, Li MH, Zhang Y, He LL, Yamada Y, Fitzmaurice A, Shen Y, Zhang H, Tong L, Yang J (2004). Structural basis of the alpha1-beta subunit interaction of voltage-gated Ca2+ channels. Nature 429:675–680. [DOI] [PubMed] [Google Scholar]
- Cohen R, Elferink LA, Atlas D (2003). The C2A domain of synaptotagmin alters the kinetics of voltag-gated Ca2+ channels Cav1.2 (Lc-type) and Cav2.3 (R-type). J Biol Chem 278:9258–9266. [DOI] [PubMed] [Google Scholar]
- Delaglio F, Grzesiek S, Vuister GW, Zhu G, Pfeifer J, Bax A (1995). NMRPipe: a multidimensional spectral processing system based on UNIX pipes. J Biomol NMR 6:277–293. [DOI] [PubMed] [Google Scholar]
- Foell JD, Balijepalli RC, Delisle B, Yunker AMR, Robia S, Walker J, McEnery MW, January CT, Kamp TJ (2004). Molecular heterogeneity of calcium channel β-subunits in canine and human heart: evidence for differential subcellular localization. Physiol Genomics 17:183–200. [DOI] [PubMed] [Google Scholar]
- Hanlon MR, Berrow NS, Dolphin AC, Wallace BA (1999). Modelling of a voltage-dependent Ca2+ channel β subunit as a basis for understanding its functional properties. FEBS Lett 445:366–370. [DOI] [PubMed] [Google Scholar]
- Helton TD, Horne WA (2002). Alternative splicing of the β4 subunit has α1 subunit subtype-specific effects on Ca2+ channel gating. J Neurosci 22:1573–1582. [DOI] [PMC free article] [PubMed] [Google Scholar]
- Helton TD, Kojetin DJ, Cavanagh J, Horne WA (2002). Alternative splicing of a β4 subunit proline-rich motif regulates voltage-dependent gating and toxin block of Cav2.1 Ca2+ channels. J Neurosci 22:9331–9339. [DOI] [PMC free article] [PubMed] [Google Scholar]
- Jiao Y, Sun Z, Lee T, Fusco FR, Kimble TD, Meade CA, Cuthbertson S, Reiner A (1999). A simple and sensitive antigen retrieval method for free-floating and slide-mounted tissue sections. J Neurosci Methods 93:149–162. [DOI] [PubMed] [Google Scholar]
- Johnson BA, Blevins RA (1994). NMRView: a computer program for the visualization and analysis of NMR data. J Biomol NMR 4:603–614. [DOI] [PubMed] [Google Scholar]
- Jones TA, Zou JY, Cowan SW, Kjeldgaard M (1991). Improved methods for building protein models in electron density maps and the location of errors in these models. Acta Crystallogr A 47:110–119. [DOI] [PubMed] [Google Scholar]
- Kaneko S, Cooper CB, Nishioka N, Yamasaki H, Suzuki A, Jarvis SE, Akaike A, Satoh M, Zamponi GW (2002). Identification and characterization of novel human Cav2.2 (α1B) calcium channel variants lacking the synaptic protein interaction site. J Neurosci 22:82–92. [DOI] [PMC free article] [PubMed] [Google Scholar]
- Kim DK, Catterall WA (1997). Ca2+-dependent and -independent interactions of the isoforms of the α1A subunit of brain Ca2+ channels with presynaptic SNARE proteins. Proc Natl Acad Sci USA 94:14782–14786. [DOI] [PMC free article] [PubMed] [Google Scholar]
- Lipscombe D (2005). Neuronal proteins custom designed by alternative splicing. Curr Opin Neurobiol 15:358–363. [DOI] [PubMed] [Google Scholar]
- Opatowsky Y, Chen CC, Campbell KP, Hirsch JA (2004). Structural analysis of the voltage-dependent calcium channel β subunit functional core and its complex with the α1 interaction domain. Neuron 42:387–399. [DOI] [PubMed] [Google Scholar]
- Sakurai T, Westenbroek RE, Rettig J, Hell J, Catterall WA (1996). Biochemical properties and subcellular distribution of the BI and rbA isoforms of α1A subunits of brain calcium channels. J Cell Biol 134:511–528. [DOI] [PMC free article] [PubMed] [Google Scholar]
- Sutton RB, Davletov BA, Berghuis AM, Sudhof TC, Sprang SR (1995). Structure of the first C2 domain of synaptotagmin I: a novel Ca2+/phospholipid-binding fold. Cell 80:929–938. [DOI] [PubMed] [Google Scholar]
- Takahashi SX, Mittman S, Colecraft HM (2003). Distinctive modulatory effects of five human auxiliary β2 subunit splice variants on L-type calcium channel gating. Biophysical J 84:3007–3021. [DOI] [PMC free article] [PubMed] [Google Scholar]
- Van Petegem F, Clark KA, Chatelain FC, Minor DL Jr (2004). Structure of a complex between a voltage-gated calcium channel β-subunit and an α-subunit domain. Nature 429:671–675. [DOI] [PMC free article] [PubMed] [Google Scholar]
- Vendel AC, Rithner CD, Lyons BA, Horne WA (2006). Solution structure of the N-terminal A domain of the human voltage-gated Ca2+ channel β4 subunit. Protein Sci 15:378–383. [DOI] [PMC free article] [PubMed] [Google Scholar]
- White JV, Stultz CM, Smith TF (1994). Protein classification by stochastic modeling and optimal filtering of amino-acid sequences. Math Biosci 119:35–75. [DOI] [PubMed] [Google Scholar]
- Yasuda T, Lewis RJ, Adams DJ (2004). Overexpressed Ca(v) β3 inhibits N-type (Cav2.2) calcium channel currents through a hyperpolarizing shift of ultra-slow and closed-state inactivation. J Gen Physiol 123:401–416. [DOI] [PMC free article] [PubMed] [Google Scholar]
- Zamponi GW (2003). Regulation of presynaptic Ca2+ channels by synaptic proteins. J Pharmacol Sci 92:79–83. [DOI] [PubMed] [Google Scholar]
- Zhong H, Yokoyama CT, Scheuer T, Catterall WA (1999). Reciprocal regulation of P/Q-type Ca2+ channels by SNAP-25, syntaxin and synaptotagmin. Nature 2:939–941. [DOI] [PubMed] [Google Scholar]