

Abstract
State-dependent EEG in the hippocampus (HPC) has traditionally been divided into two activity patterns: theta, a large-amplitude, regular oscillation with a bandwidth of 3–12 Hz, and large-amplitude irregular activity (LIA), a less regular signal with broadband characteristics. Both of these activity patterns have been linked to the memory functions subserved by the HPC. Here we describe, using extracellular field recording techniques in naturally sleeping and urethane-anesthetized rats, a novel state present during deactivated stages of sleep and anesthesia that is characterized by a prominent large-amplitude and slow frequency (≤1 Hz) rhythm. We have called this activity the hippocampal slow oscillation (SO) because of its similarity and correspondence with the previously described neocortical SO. Almost all hippocampal units recorded exhibited differential spiking behavior during the SO as compared with other states. Although the hippocampal SO occurred in situations similar to the neocortical SO, it demonstrated some independence in its initiation, coordination, and coherence. The SO was abolished by sensory stimulation or cholinergic agonism and was enhanced by increasing anesthetic depth or muscarinic receptor antagonism. Laminar profile analyses of the SO showed a phase shift and prominent current sink-source alternations in stratum lacunosum-moleculare of CA1. This, along with correlated slow oscillatory field and multiunit activity in superficial entorhinal cortex suggests that the hippocampal SO may be coordinated with slow neocortical activity through input arriving via the temporo-ammonic pathway. This novel state may present a favorable milieu for synchronization-dependent synaptic plasticity within and between hippocampal and neocortical ensembles.
Keywords: synchrony, state, sleep, memory, urethane, non-REM
Introduction
The role of the hippocampus (HPC) and associated parahippocampal regions in certain memory processes is well documented (Scoville and Milner, 1957; Cohen and Squire, 1980; Zola-Morgan et al., 1986; Squire and Zola-Morgan, 1991; Squire, 1992; Corkin et al., 1997; Stefanacci et al., 2000). Bilateral damage to this area elicits a profound anterograde and a temporally graded retrograde amnesia, suggesting that its operation is temporarily necessary for the permanent formation of new long-term memories. The final repository of memory traces is believed to be located in modality-specific regions of the neocortex (nCTX) and the transfer of mnemonic information to these sites is known as consolidation (McGaugh, 2000). Consolidation is likely to involve synaptic plasticity promoted by activity-dependent interactions of hippocampal and neocortical neuronal ensembles mediated through their interconnections via parahippocampal structures (Squire and Alvarez, 1995; Eichenbaum, 2000; Lavenex and Amaral, 2000; Witter et al., 2000; Frankland and Bontempi, 2005) (cf. Nadel and Moscovitch, 1997).
Sleep may play an important role in both hippocampal-dependent and -independent memory consolidation (Marr, 1970, 1971; Pavlides and Winson, 1989; Karni et al., 1994; Smith and MacNeill, 1994; Wilson and McNaugghton, 1994; Plihal and Born, 1997; Maquet et al., 2000; Walker et al., 2002; Peigneux et al., 2003; Huber et al., 2004; Ribeiro et al., 2004). (For recent reviews, see Buzsáki, 1998; Hasselmo, 1999; Peigneux et al., 2001; Tononi and Cirelli, 2001; Ribeiro and Nicolelis, 2004; Walker and Stickgold, 2004; Rauchs et al., 2005; for an opposing view, see Vertes and Eastman, 2000). State-dependent rhythmic neuronal population synchrony during different sleep stages is a candidate mechanism by which the activity of hippocampal and neocortical ensembles could be coordinated and may also be a way to promote synchronization-dependent synaptic plasticity (Buzsáki, 1989, 1996; Siapas and Wilson, 1998; King et al., 1999; Steriade, 1999; Sirota et al., 2003; Dan and Poo, 2004; Siapas et al., 2005). Therefore, the coordination of brain rhythms across the HPC and the nCTX could be a platform for the transfer of mnemonic codes, leading to the permanent formation of the engram.
In the rodent HPC, state-dependent activity during sleep has been traditionally divided into two mutually exclusive categories based on their spectral characteristics and occurrence in specific sleep states. The activated state consists of prominent 3–12 Hz rhythmical activity known as theta or rhythmic slow activity (Vanderwolf et al., 1978; Buzsáki et al., 1983; Bland, 1986; Buzsáki, 2002). Theta is coexpressed with a faster gamma rhythm (25–80 Hz) and appears during rapid eye movement (REM) sleep and under some general anesthetics. During REM sleep, hippocampal theta is correlated with an activated (low-voltage fast) EEG in the nCTX and is similarly dependent on ascending cholinergic inputs (Robinson et al., 1977; Usui and Iwahara, 1977; Vanderwolf et al., 1977; Stewart and Vanderwolf, 1987).
The deactivated state of hippocampal population activity is believed to consist of a nonrhythmical, broadband signal that is known as large-amplitude irregular activity (LIA). Intermittent, large-amplitude (>2 mV) transients (30–120 ms) called hippocampal “sharp waves” or “spikes” (Jouvet et al., 1959a; Buzsáki, 1986; Suzuki and Smith, 1987) are characteristic of this state. Sharp waves are correlated with population bursts of hippocampal neurons and localized fast-frequency field oscillations (ripple, 125–250 Hz) (O’Keefe and Nadel, 1978; Buzsáki et al., 1983; Buzsáki, 1986; Suzuki and Smith, 1988a; Ylinen et al., 1995). LIA occurs during non-REM, is typically present under most general anesthetics, and is usually correlated with the presence of deactivated (large-amplitude slow) neocortical activity patterns. Conversely to theta, LIA appears to be induced by treatments that block ascending cholinergic influences on the HPC.
Here we describe a novel and previously overlooked deactivated pattern of spontaneous hippocampal activity in the naturally sleeping and urethane-anesthetized rat, which bears a remarkable similarity to the previously described slow rhythm in the nCTX (Steriade et al., 1993b; Amzica and Steriade, 1997). Based on its spectral (frequency) characteristics, its cellular correlates, and its dynamic coordination with the neocortical slow rhythm, we propose that it constitutes a novel and previously unreported state of hippocampal neural activity that we have called the hippocampal slow oscillation (SO). We also suggest that the dynamic coordination of the SO across hippocampal- and neo-cortices could constitute a vehicle for the consolidation of hippocampal-dependent memory processes.
Preliminary descriptions of these results have been published previously in abstract form (Grams et al., 2003; Wolansky et al., 2004; Dickson et al., 2005).
Materials and Methods
Data were obtained from 139 (chronic, n = 12; acute, n = 127) male Sprague Dawley rats weighing 184.8–502.5 g (average ± SEM, 270.4 ± 5.1 g). All methods conformed to the guidelines established by the Canadian Council on Animal Care and the Society for Neuroscience and were approved by the Biosciences Animal Policy and Welfare Committee of the University of Alberta.
Chronic (behaving) preparation
Anesthesia and surgery.
Animals were initially induced with gaseous isoflurane [4 maximum alveolar concentration (MAC)] in an enclosed anesthetic chamber. After loss of righting reflexes, they were administered an intraperitoneal injection of a ketamine/xylazine cocktail (90 and 10 mg/kg, respectively). Supplements of the ketamine/xylazine cocktail (10% of original dose) were administered as necessary to maintain the animal’s level of anesthesia. Rats were given a subcutaneous injection of atropine methyl nitrate (0.05 mg/kg) to prevent respiratory complications. After anesthesia, body temperature was maintained at 37°C using a servo-driven system connected to a heating pad and rectal probe [TR-100; Fine Science Tools (FST), Vancouver, British Columbia, Canada].
Using antiseptic stereotaxic techniques, animals were implanted with unilateral neocortical [from bregma: anteroposterior (AP), +0.3; mediolateral (ML), +1.0; dorsoventral (DV), −0.2 or −1.5 mm] and bilateral hippocampal (from bregma: AP, −3.3; ML, ±2.0; DV, −2.8 to −3.3 mm) electrodes. An additional uninsulated electrode implanted vertically in the frontal nCTX (verified to be electrically neutral by comparison to ground) served as an indifferent electrode. All intracerebral electrodes were manufactured by Plastics One (Roanoke, VA). Bipolar EMG electrodes were constructed from Teflon insulated stainless steel (bare diameter of 125 μm; A-M Systems, Carlsborg, WA) and were implanted in the neck musculature as described previously (Whelan, 2003). A wire soldered to a skull screw placed over the cerebellum served as ground. All wires and connector assemblies were fixed to the skull using jeweler’s screws and dental acrylic. After implantation, the scalp was cleaned and sutured, and the animal was placed in a clean cage.
Animals were allowed to recover for a minimum of 1 week before any recording. During this time, they were handled on a daily basis and habituated to the recording apparatus for at least 2 h each day during the light cycle. During the habituation procedure, all leads were connected to suspended wires, and animals were allowed to freely behave in the recording chamber, which was contained in a Faraday cage and housed in a quiet room. Adequate habituation ensured that animals slept during recording sessions.
Multisite field and occasionally field and multiunit recordings were made simultaneously during ongoing (spontaneous) behavior for a variable time period (1–8 h) daily. Continuous observation or video monitoring ensured that samples for analysis were taken during periods when the animal was sleeping. To be qualified as sleep, the animal had to be in a resting posture, with the head and body down and the eyes closed. During sleep, REM and non-REM episodes could be differentiated by the presence or absence of activated patterns of EEG in the nCTX [low-voltage fast activity (LVFA)] and HPC (theta), respectively. Additional confirmation was obtained with electromyographic (EMG) recordings; a decrease in EMG tone was concomitant with non-REM to REM alternations. Additional details of electrical recording procedures are described below. After adequate samples of natural sleep, rats were prepared for acute anesthetized recordings as described in the subsequent section. Recordings were taken using the same connector pins used for naturally sleeping recordings.
Acute (anesthetized) preparation
Anesthesia and surgery.
Animals were initially induced with gaseous isoflurane (4 MAC) in an enclosed anesthetic chamber. After loss of righting reflexes, they were maintained on isoflurane (2.0–2.5 MAC) via a nose cone and implanted with a jugular catheter. Isoflurane was discontinued, and general anesthesia was achieved using slow intravenous administration of urethane (0.8 g/ml; final dosage, 1.3 ± 0.01 g/kg) via the jugular vein. Body temperature was maintained at 37°C using a servo-driven system connected to a heating pad and rectal probe (FST) for the remainder of the surgical and recording procedures. Level of anesthesia was assessed throughout the experiment by monitoring reflex withdrawal to a hindpaw pinch. If any visible withdrawal occurred, the animal was administered a supplemental dose (0.01 ml) of urethane.
Stereotaxic placement of fixed recording and indifferent electrodes was conducted for frontal neocortical, hippocampal, and entorhinal sites as described previously for the chronic preparation. Recording electrodes were constructed from Teflon-coated stainless steel wire (bare diameter, 125 μm; A-M Systems). These electrodes were aimed at the frontal (AP, +0.3; ML, ±1.0 mm), and posterior (AP, −4.5; ML, ±1.5 mm) neocortices, either in superficial [DV, −0.1 to −0.25 mm; frontal cortex (fCTX sup)] or deep (DV, −1.0 to −1.5 mm; fCTX deep) layers; the hippocampal fissure of the dorsal HPC (AP, −3.3; ML, ±2.0; DV, −2.8 to −3.3 mm; HPC fissure); and the superficial entorhinal cortex (sup EC) (AP, −8.5; ML, ± 4.5, DV: −5.5 to −8.0 mm). An indifferent electrode, consisting of either an electrically connected pair of thick Teflon-insulated wires (200 μm; A-M Systems) staggered by 1.5 mm or a single wire of the same type scraped bare to a distance of at least 1.5 mm, was implanted in the frontal hemisphere (verified to be electrically neutral by comparison to ground). The stereotaxic apparatus was connected to ground. After implantation, all static electrodes were fixed to the skull using jeweler’s screws and dental acrylic.
Recording procedures
Field recordings.
All field potential recordings were amplified at a gain of 1000 and filtered between 0.1 and 500 Hz using a differential AC amplifier (model 1700; A-M Systems). All single electrode signals were referenced to the implanted indifferent electrode. In some cases, signals were recorded using alternate configurations of the reference (including ground), and comparisons of the different configurations did not reveal any gross differences in the signals (see supplemental Fig. 1, available at www.jneurosci.org as supplemental material). After recording sessions, small lesions were made at the tips of active electrodes by passing 0.1–1 mA of DC for 5 s using an isolated constant current pulse generator (model 2100; A-M Systems) allowing us to specify their location during histological procedures (see below).
Multiunit recordings.
Multiunit recordings were made using the same electrodes as described for field recordings above. Signals were amplified at a gain of 10,000 and bandpass filtered between 0.5 and 5 kHz. Off-line digital filtering (see below) allowed us to extract both the local field potentials and simultaneous multiunit activity from these traces. As with field electrodes, small electrolytic lesions were made at the electrode tips to localize their intracerebral position.
Single-unit recordings.
Single-unit activity was recorded using fine glass micropipettes filled with 0.5 m sodium chloride or sodium acetate mixed with 2% pontamine sky blue (resistance ranging from 5 to 30 MΩ). Micropipettes were mounted on a single-axis fine hydraulic micromanipulator (FHC, Bowdoinham, ME) that was positioned over the brain with a coarse three-axis manipulator (FST). Signals were initially amplified using a DC amplifier (Neurodata IR-283; Cygnus Technology, Delaware Water Gap, PA) at a gain of 10, split, and further amplified using two channels of an AC amplifier (model 2100; A-M Systems). One of these channels was amplified at a gain of 1000 and bandpass filtered between 0.5 and 10 kHz for unit activity, and the other was amplified at a gain of 100 and bandpass filtered between 0.1 and 500 Hz for local field activity. Comparison of the local field signal of the glass micropipette to the contralateral fixed hippocampal electrode (amplitude, frequency composition, and phase) aided in determining the vertical position of the glass micropipette tip. At the end of the recording session, pontamine sky blue was iontophoresed by 250–300 ms pulses of 1 mA positive current applied at a frequency of 1 Hz for 5–10 min to the position of the electrode tip.
Linear multiprobe recordings.
Multichannel field recordings were made using 16-contact silicon multiprobes arranged in a vertical linear array with a contact separation of 100 μm (Center for Neural Communication Technology, University of Michigan, Ann Arbor, MI). Signals from the probe were amplified at a final gain of 1000 and wide-band filtered between 0.7 and 1000 kHz via a 16-channel headstage (unity gain) and amplifier system (Plexon, Dallas, TX). All signals from the multiprobe were referenced to stereotaxic ground. Simultaneous extracellular voltage profiles were taken at spatial intervals of 0.5 mm from the surface of the brain to a final depth of 4.5 mm using the coordinates contralateral to the dorsal HPC reference electrode described above (AP, −3.3; ML, ±2.0 mm). The signal from the first (deepest) channel on the probe was audio amplified and sent to a speaker. The well established electrophysiological profile of theta field activity (Bland and Bland, 1986), robust increases in multiunit activity, and the distribution of evoked potentials via afferent stimulation (see below) aided in the determination of the vertical position of the probe.
To make the multiprobe track visible for histological purposes, the probe was moved slightly in two horizontal planes at its most ventral position. The position of the probe track in every experiment was verified by comparing the histology to a laminar profile of the ongoing field potentials.
Evoked potentials.
Bipolar stimulating electrodes were constructed from a twisted pair of thick Teflon-insulated wires (200 μm; A-M Systems), with tips vertically staggered by 0.5–1.0 mm. Electrodes were aimed at the contralateral ventral hippocampal commissure (AP, −0.9; ML, ±0.5; DV, −3.9 to −4.2 mm), the ipsilateral perforant path (AP, −7.3; ML, ±5.0; DV, −2.4 to −2.7 mm), and/or contralateral CA3 (AP, −3.8; ML, ±3.75; DV, −2.6 to −2.9 mm). Profiles were generated by passing a biphasic pulse of 50–200 μA of DC for 0.2–0.5 ms using an isolated constant current pulse generator (model 2100; A-M Systems).
EMG recordings.
Potentials from bipolar EMG electrodes were referenced to each other, amplified at a gain of 10,000, and bandpass filtered between 10 and 500 Hz.
Respiration.
In some anesthetized animals, a thermocouple wire (30 gauge Type K; Thermo Electric, Brampton, Ontario, Canada) was placed just inside the nasal passage and its signal amplified at a gain of 10,000 and filtered between 0.1 and 500 Hz. This method yielded a continuous representation of the respiratory cycle attributable to the temperature difference between inspired and expired air (Chaput and Holley, 1980).
Data storage.
Field and EMG activity was sampled at 1 kHz, multiunit activity at 10 kHz, and single-unit activity at 20 kHz. All signals were digitized with a Digidata 1322A analog-to-digital board connected to a Pentium personal computer running the AxoScope acquisition program (Molecular Devices, Union City, CA). Most experiments were digitized on-line, but some multichannel field experiments were initially recorded on tape using a four-channel digital audio tape recorder (CDAT4; Cygnus Technology) at a sampling frequency of 2.5 kHz before being digitized.
Perfusion and histology
At the end of anesthetized recording sessions, rats were perfused transcardially, initially with physiological saline and then with 4% paraformaldehyde in saline. Brains were extracted and stored overnight in 30% sucrose in 4% paraformaldehyde. The tissue was frozen with compressed CO2 and sliced at 48 μm with a rotary microtome (1320 Microtome; Leica, Vienna, Austria). Slices were then mounted on gel-coated slides, allowed to dry for a minimum of 24 h, subsequently stained using cresyl violet or thionin, and coverslipped. Microscopic inspection of stained slices was used to verify recording loci. Digital photomicrographs (Canon Powershot S45; Canon, Tokyo, Japan) were taken on a Leica DM LB2 microscope, imported using Canon Remote Capture 2.7 software and processed with Corel PhotoPaint (Corel, Ottawa, Ontario, Canada).
Data processing and analysis
Raw signals were first examined visually using AxoScope (Molecular Devices) and segments for additional analysis were chosen. Subsequent analyses were conducted using Matlab version 5.1 or 5.3 (MathWorks, Natick, MA) and visualized using Origin (Microcal Software, Northampton, MA). These analyses included the following: digital filtering, single- and dual-channel spectral analyses, and auto- and cross-correlations for field signals, spike-triggered averaging, autocorrelation, and phase-cycle preference for unit and multiunit signals. Single- and dual-channel spectral analyses were performed to confirm the EEG state of visually selected data segments before additional analysis (see Fig. 3A). Our digital filtering technique was confirmed to elicit zero phase distortion by both spectral and cross-correlation analyses (see supplemental Fig. 2, available at www.jneurosci.org as supplemental material).
Figure 3.
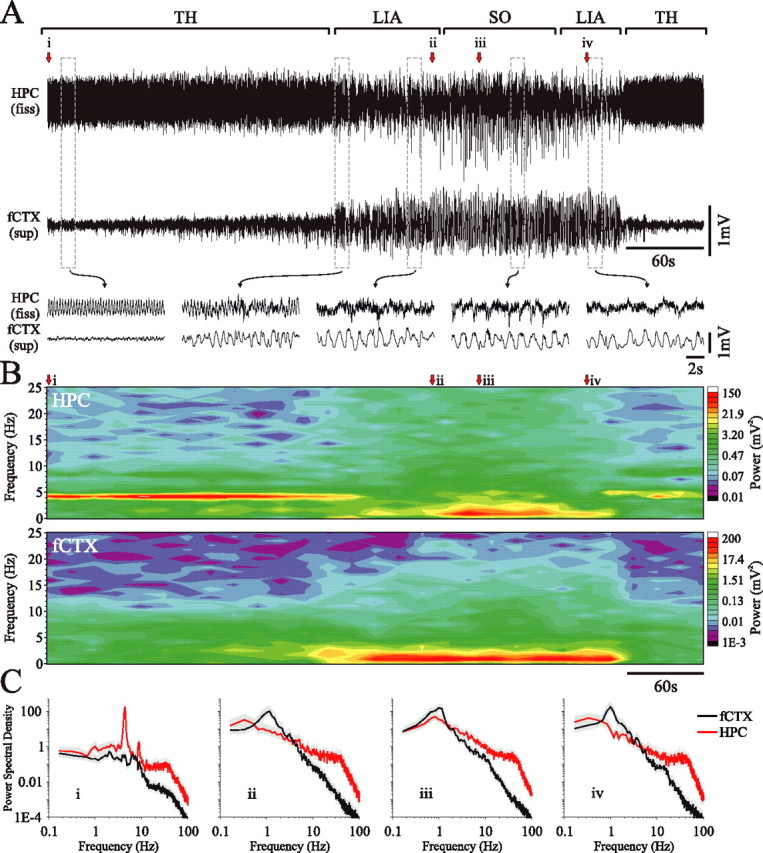
Differential evolution of hippocampal and neocortical slow oscillatory states during urethane anesthesia. A, Simultaneous field recordings from the HPC and superficial frontal cortex during a spontaneous field state change. Bracketed segments (top) and expansions (bottom) of the traces highlight the features of the transitive evolution of the hippocampal SO compared with the neocortical SO. The beginning (and end) of the episode was characterized by activated patterns in both hippocampal (theta) and neocortical (LVFA) traces. The transition to slower and larger amplitude rhythms (culminating in the SO) appeared first in the nCTX, whereas the SO in the HPC appeared later, after an initial transition through LIA. This point is more clearly shown in the continuous spectrogram (B). C, Power spectra for fixed 60 s episodes beginning at points i, ii, iii, and iv as indicated in A and B (gray shaded area represents 95% confidence interval). TH, Theta; fiss, fissure.
Field recordings.
Autopower, cross-power, cross-phase, and coherence spectra were computed and plotted for field signals and signal pair combinations. Spectra were computed from data segments whose length depended on the type and stationarity of the signal. For segments of activated patterns with higher frequency components such as theta, segments were at least 30 s. For deactivated patterns with lower frequency components such as LIA and slow oscillations, segments were at least 60 s. Using Welch’s periodogram method, spectra were estimated from a series of 6-s-long, sequential Hanning windowed samples from these data segments with 2 s overlap. Spectral values were averaged across a peak frequency bandwidth (peak frequency, ±1/6 Hz) and compared across EEG states. Spectral profiles for theta and slow oscillatory activity recorded with the linear multiprobe were also constructed in this way by comparing each trace from the probe against a fixed (hippocampal or cortical) reference and extracting peak frequency values. Because of the differences in the frequency responsiveness of the two amplification systems used, we corrected for potential phase distortion of simultaneously recorded signals between them by performing a spectral phase analysis of pure sine input ranging from 0.1 to 30 Hz and mathematically accounting for any frequency-dependent discrepancies in all subsequent analyses (see supplemental Fig. 3, available at www.jneurosci.org as supplemental material).
Spectrograms were computed from even longer data segments (several minutes) in which spontaneous state alternations took place. A sliding windowing procedure was adopted that allowed discrete spectra to be calculated for specific time points across the entire data segment. Windows were 24 s in duration and were moved across the data segment in increments of 6 s. Spectral analysis of these individual windows was identical to the methods described above, although estimates of coherence were based on smaller (2 s) Hanning windowed segments.
The range of time lags for auto- and cross-correlations of field activity depended on the peak power frequency as computed by autospectral analysis. Frequencies ≤1 Hz used a minimum window size of 2.5 s, whereas those ≥3 Hz used a minimum window size of 1 s. Sliding cross-correlations of larger data segments were conducted using a sliding windowing procedure similar to that for spectrograms. Windows were 5 s in duration and were moved across the original data segment in increments of 1–2.5 s.
Single-unit activity.
Spike rates, interspike intervals, and autocorrelation histograms (10–100 ms bin size) were computed to analyze spike train dynamics. The relationship between EEG and unit activity was assessed by spike-triggered averaging of simultaneously recorded field potentials. The preferred phase of unit spiking to rhythmic field activity was assessed separately by filtering the contralateral reference hippocampal field in a specific bandwidth (0.5–1.5 Hz for the SO and 3–6 Hz for theta) and then computing the time points of negative to positive zero crossings. Unit activity was binned (bin size, 18°) according to the phase of the field cycle from 0 to 360° (i.e., one zero crossing to the next).
Current source density analysis.
Current source density (CSD) analysis was conducted on spontaneous or averaged field profiles recorded using the linear multiprobe following the assumptions of Freeman (1975), Rodriguez and Haberly (1989), and Ketchum and Haberly (1993). Spontaneous multiprobe traces were lowpass filtered at 10 Hz before CSD computation. Comparison of filtered and unfiltered CSD profiles revealed no gross differences aside from fast frequency sink-source alternations. Briefly, CSD was computed by estimating the second spatial derivative of voltage traces derived from the multiprobe. This estimate was calculated using a three-point difference (differentiation grid size of 300 μm) on the voltage values across spatially adjacent traces: CSD = [f(pi − 1) − 2f(pi) + f(pi + 1)]/d2, where f(pi) is the field signal from probe channel i (i = 2, 3, …, 14), and d is the distance between adjacent channels (0.1 mm).
Multiunit, gamma, dentate spike, and ripple activity.
Multiunit activity was extracted from wide-band recorded signals by digital filtering of the original signal (0.5 to 5 kHz). Gamma (25–80 Hz), dentate spiking (70–140 Hz), and ripple (140–220 Hz) activity were extracted using a similar procedure. To analyze the relationship of these forms of activity to the SO, they were rectified and subjected to a similar set of analyses as specified previously for single unit activity.
Statistics.
All comparisons across conditions for the same datasets were made using two-tailed pairwise t tests (p < 0.01). Because most tests were specified a priori, this was also the case for datasets with more than two conditions. For remaining situations, data were analyzed using ANOVA. A Scheffé correction was made for subsequent post hoc pairwise tests.
The significance of the time series analyses conducted were assessed through comparisons with the 95% confidence limits of either the estimation procedure or a randomized distribution computed on the same datasets. Randomized coherence distributions were computed by shuffling the time windows of one signal versus another from the same data set used for the original coherence estimation. In all cases, the distribution of these randomized coherence values (random n ≥ 144) varied between 0 and 0.025 across all frequencies. Randomized cross-correlation distributions were also computed using this same time-window shuffling procedure from the same dataset used for the original cross-correlation computation. Because the distribution of randomized values (random n = 100) varied systematically across different lag values, the 95% confidence limits were extracted from the randomized distribution as a function of lag and compared with the actual cross-correlation function. For strongly correlated signals, the maximal value of this randomized distribution was a small fraction (2.5–10%) of the first (near zero lag) peak. Autocorrelation function significance was assessed by comparison with a distribution of 100 different autocorrelograms computed on lowpass (3 Hz)-filtered noise. The spectrum of this filtered noise represents a random phase approximation of a typical EEG spectrum. The significance of spike-triggered averages (STAs) was computed by comparison with the distribution of STAs computed using a series (n = 100) of randomized (shuffled) spike trains derived from the original data. The shuffling of spike trains was conducted through random assignments based on the actual interspike intervals computed for the original spike train. The resulting distribution of STAs had a variance that was proportional to the amplitude of the original field signal but that was lower than the original fluctuations for signals with a strong correspondence.
The significance of autocorrelation histograms derived from point processes (unit activity) was assessed by computing the average bin value and their fluctuations within a randomized distribution (random n = 100). Confidence limits were computed as the average value ± 2 SEM. Any units with autocorrelation histograms demonstrating systematic and periodic fluctuations beyond this window were classified as rhythmic. This technique has been noted to eliminate problems using either spectral or Gabor fitting analyses (Samonds and Bonds, 2005). The frequency of any periodicity was assessed by Fourier transformation of the autocorrelogram. Phase histograms were statistically evaluated using the Rayleigh statistic for circular data (Zar, 1999).
Drugs and chemicals.
Atropine methyl nitrate, atropine sulfate, eserine, lidocaine, oxotremorine, scopolamine, thionin, and urethane were all purchased from Sigma (St. Louis, MO). Pontamine sky blue was purchased from Avocado Research Chemicals (Heysham, Lancaster, UK). Isoflurane and ketamine were purchased from Bimeda MTC Animal Health (Cambridge, Ontario, Canada). Cresyl violet was purchased from Acros Organics (Morris Plains, NJ), paraformaldehyde from Fisher Scientific (Toronto, Ontario, Canada), and xylazine from Bayer (Toronto, Ontario, Canada).
Results
The hippocampal slow oscillation: a novel state in normal sleep and under anesthesia
In preliminary recordings of hippocampal EEG under naturally sleeping and urethane-anesthetized conditions, we noted a large-amplitude, highly rhythmic slow activity that was spontaneously and periodically apparent in both conditions (Fig. 1). This wave pattern appeared visually and spectrally different from other previously described forms of hippocampal state-dependent EEG observed during sleep or anesthesia (such as theta or LIA) and had distinct behavioral correlates. Under freely behaving conditions, this slow rhythmical activity only emerged during prominent slow-wave sleep (SWS) episodes within non-REM sleep. Under urethane, the spontaneous appearance of this activity (and its regularity/rhythmicity) appeared to be dependent on the level of anesthesia; increasing anesthetic dosage moderately increased the proportion of time spontaneously spent in the slow oscillatory state (correspondingly decreasing the amount of time spontaneously spent in theta). Conversely, experiments conducted under lower levels of anesthesia or in which the level of anesthesia became gradually lighter (partial metabolism over a time period >1 h) showed the opposite relationship. In addition, the slow rhythmic wave pattern was abolished by robust sensory stimulation in both sleeping (auditory stimulation) and anesthetized (hindpaw or tail pinch) conditions. Based on these observations and the fact that the slow, rhythmic activity in the HPC appeared to be related to a similar form of activity in the nCTX, we elected to name this novel hippocampal state the hippocampal SO, in keeping with nomenclature established previously for slow neocortical activity (Steriade et al., 1993b; Amzica and Steriade, 1997).
Figure 1.
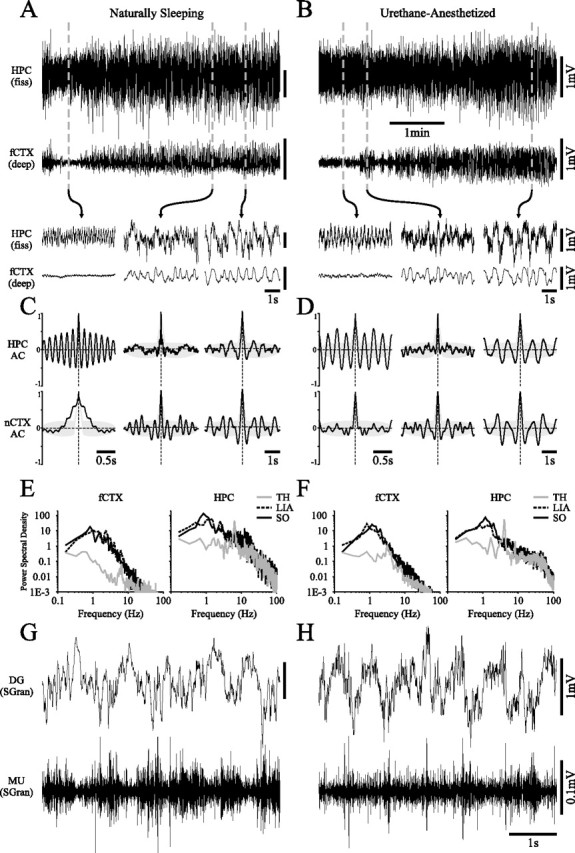
Slow oscillatory field activity in the hippocampus is a feature of the deactivated state of both natural sleep and urethane anesthesia. Long-duration recordings of hippocampal (top) and neocortical (bottom) field activity during natural sleep (A) and urethane anesthesia (B) in the same animal. Both demonstrate spontaneous shifts from activated to deactivated EEG states of which the fine temporal features are highlighted in the expansions below. Note that across this state shift, hippocampal field activity was gradually transformed from theta to a large-amplitude slow oscillation that was similar to slow activity in the nCTX. This transformation occurred through a state characterized by irregular hippocampal activity. Corresponding autocorrelation functions (significant values are those outside gray shaded area) and power spectra for each recording site across the three states are shown for natural sleep (C, E) and for anesthesia (D, F). A strong power peak and slow rhythmical activity was observed in the cortical signal during the entire deactivated state across the two conditions. This was only the case in the HPC at later stages of the deactivated state. Dentate gyrus (DG) stratum granulosum (SGran) field and multiunit (MU) activity recorded in another animal during the SO suggested phase locking of unit activity to the local field oscillations in both sleeping (G) and anesthetized (H) conditions. fiss, Fissure; AC, autocorrelation; TH, theta.
The spontaneous evolution of the hippocampal SO was remarkably similar in both naturally sleeping and anesthetized recordings conducted in the same animals (n = 12), as shown in Figure 1, A and B. As described by previous researchers (Rimbaud et al., 1955; Jouvet et al., 1959b; Winson, 1972; Robinson et al., 1977; Vanderwolf et al., 1977), hippocampal EEG alternated between activated and deactivated patterns in concert with activated (LVFA) and deactivated (slow wave) patterns in the nCTX during sleep, expressed during REM and non-REM, respectively (Fig. 1A). Specifically in the HPC, spontaneous alternation between REM and non-REM involved a gradual EEG state transition from theta, to LIA, and finally to the SO. The alternation from non-REM back to REM was characterized by a relatively abrupt change from the SO to theta, which could involve a brief transition through LIA. Remarkably, the same electrographic elements could be observed during spontaneous state changes under urethane anesthesia, and their evolution followed a highly similar pattern (Fig. 1B).
Classically, LIA has been regarded as the deactivated state in the HPC (Vanderwolf, 1969; Leung et al., 1982; Buzsáki et al., 1983; Leung, 1985; Buzsáki, 1986, 1996) and is characterized by a nonrhythmic, broadband signal with large-amplitude transients (see raw trace expansions, autocorrelation functions, and spectra in Fig. 1A–F). Although the SO also appeared during deactivated stages, it could be differentiated from LIA as a clearly rhythmic, ∼1 Hz signal of very high amplitude (power at ∼1 Hz during sleep/LIA, 14.62 ± 1.89 vs sleep/SO, 44.96 ± 8.41 and urethane/LIA, 11.69 ± 5.09 vs urethane/SO, 42.11 ± 13.66 mV2 were significantly different in the HPC; t test, p < 0.05) (Fig. 1E,F). Based on both their electrographic signatures and their differential expression during the evolution of EEG states, LIA and the SO appeared to represent clearly distinct states, apparent even when the concurrent neocortical field had a strong ∼1 Hz component (power at ∼1 Hz during sleep/LIA, 9.32 ± 0.41 vs sleep/SO, 10.4 ± 0.78 and urethane/LIA, 24.65 ± 9.80 vs urethane/SO, 27.54 ± 10.5 mV2 were not significantly different in the nCTX; t test, p > 0.05) (Fig. 1E,F).
One difference between the expressions of the hippocampal SO during sleep versus urethane anesthesia had to do with its longevity and stability. During sleep, the SO was only apparent during deep SWS episodes and was frequently interrupted by short arousals, during which the SO was replaced by irregular (LIA-like) activity or, if a movement occurred, an activated (theta) pattern. An SO episode under urethane was highly stereotyped, lasting a predictable amount of time, and could be (briefly) interrupted by segments of LIA, but was very rarely interrupted by EEG activation (i.e., theta).
Simultaneous field and multiunit recordings from verified hippocampal sites (those shown are from the dentate gyrus in stratum granulosum) suggested that hippocampal neuronal populations tended to generate action potentials in a phase-related manner to the ongoing SO in both natural sleep and urethane anesthesia (Fig. 1G,H). To determine whether this state-modulated ongoing cellular dynamics in the HPC and to conclusively demonstrate that the SO is a truly distinct state from LIA, we performed simultaneous single-unit and field recordings in the HPC of urethane-anesthetized animals. To be analyzed, adequate continuous and stationary samples of spontaneous theta (≥30 s) and the SO (≥60 s) states were required. In most cases, an additional 60 s of LIA was also obtained. Under these conditional limitations, we obtained and analyzed data from 38 single neurons from 20 animals in a variety of hippocampal subfields.
The stratum oriens unit shown in Figure 2 demonstrated a significant (t test, p < 0.01) change in its mean firing rate (Fig. 2G) and its pattern of discharge (Fig. 2B,C) across spontaneous state changes from theta to LIA and the SO (Fig. 2A). Notably, this unit demonstrated a rhythmic spike pattern that was phase-related to ongoing field oscillations in the contralateral hippocampus during both theta and the SO (Fig. 2C, left and right-most panels), but the preferred phase of spiking to the field reversed polarity across the two states (theta, 82°, Rayleigh, z = 211, n = 926, p < 0.01; SO, 288°, Rayleigh, z = 150, n = 2004, p < 0.01) (Fig. 2B,D,E, left and right-most panels). Spectral and autocorrelational analyses of the field signals for each state verified that the field states were truly different (Fig. 2F, gray shaded area represents 95% confidence interval).
Figure 2.
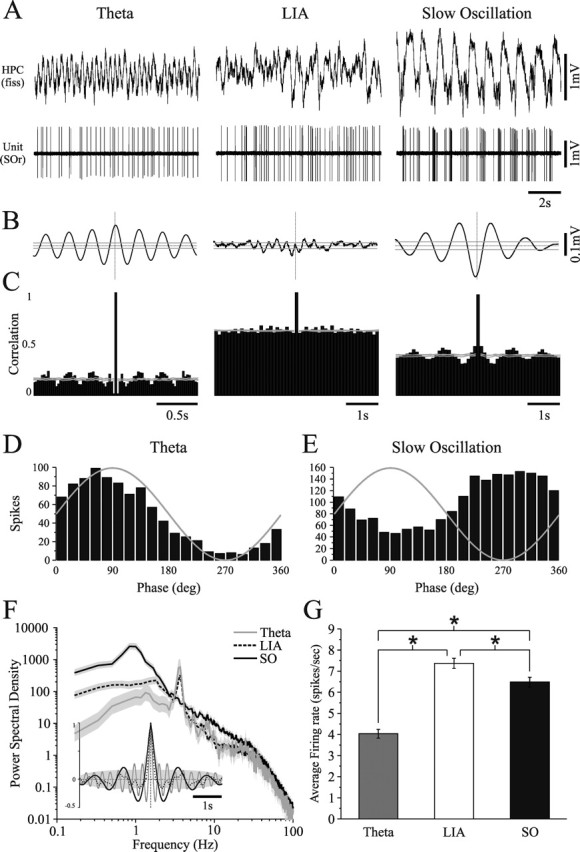
Three distinct states of hippocampal field and unit activity during urethane anesthesia. A, Hippocampal field (top) and stratum oriens (SOr) single-unit (bottom) activity at three separate instances during a single recording episode. Representative traces are plotted for theta, LIA, and the SO. Each state was characterized by distinct patterns of field waveforms, spike trains, and field-unit correlations. B, Spike-triggered averages of field activity and spike train autocorrelation histograms (C) for the three respective hippocampal states shown in A. Gray lines in B and C represent 95% confidence intervals. Phase histograms for this unit during theta (D) and the SO (E) demonstrate significant state-dependent phase-related preferences, which changed across states. Both phase histograms were significantly nonuniform. F, Power spectra and autocorrelation functions of hippocampal field activity demonstrate the differences in frequency components and rhythmicity across all three states (gray shaded area represents 95% confidence interval). The SO was characterized by a dramatic increase in rhythmic power and a shift of peak frequency values to a lower range (∼1 Hz and below). G, Average firing rates of the same cell for a 60 s episode in each state showing significant differences between all three states. fiss, Fissure.
Of all units recorded (n = 38; stratum oriens/pyramidale, n = 14; stratum radiatum, n = 5; stratum lacunosum moleculare, n = 8; stratum moleculare/granulosum, n = 10; stratum granulosum/hilus, n = 1), 34 of 38 (89%) showed a significant change in spike train dynamics during the SO. Twenty-five of 38 (66%) generated rhythmic and phase-related action potentials during the hippocampal SO, 23 of 38 (61%) showed a significant (t test, p < 0.05) change in their firing rate during LIA as compared with the SO, and 16 of 38 (42%) showed both. Of the remaining 13 of 38 (34%) neurons that were not rhythmic during the SO, only 10 were recorded with adequate samples of LIA for a full comparison. Significant changes in spike rates were observed in 7 of 10 of these neurons when comparing across LIA and the SO (t test, p < 0.01). Therefore, the vast majority of hippocampal neurons sampled showed definitive yet diverse changes in spike train dynamics during the SO.
Most of the neurons that generated rhythmic action potentials during the SO also did so during theta (21 of 25, 84%). Interestingly, 15 of 21 (71%) of the neurons that were rhythmic during both the SO and theta (including that shown in Fig. 2) demonstrated a change in the polarity of their preferred phase to the field oscillation when comparing across the two states regardless of their anatomical location (stratum oriens/pyramidale, n = 6 of 8, 75%; stratum radiatum, n = 3 of 4, 75%; stratum lacunosum moleculare, n = 2 of 3, 67%; stratum moleculare/granulosum, n = 3 of 5, 60%; stratum granulosum/hilus, n = 1 of 1, 100%). In general, most theta-related cells (Bland and Colom, 1993) appeared to be modulated by both hippocampal theta and the SO (32 of 35, 91%), however, neither firing rates nor spike train dynamics during theta predicted spiking behavior during the SO.
Coordination of the hippocampal and neocortical slow rhythms
Because of the highly stereotyped manner in which the SO repetitively emerged under urethane anesthesia, we examined the temporal correspondence of the SO across the two structures in finer detail using this preparation; an example is shown in Figure 3. By examining temporally expanded traces taken in succession across the extended-duration field recordings from the HPC and nCTX, and by computing a spectrogram for the entire episode, the evolution of the SO and the unique pattern of its coordination across the two cortical regions could be observed more explicitly. In 52 urethane-anesthetized animals, we observed a total of 343 spontaneous evolutions of the hippocampal SO comprising the basic pattern described above (theta-LIA-SO-LIA-theta). In an additional 13 animals, the anesthetic level was at a depth that prevented spontaneous alternations into the activated state. In most of these cases (n = 8), evidence of fluctuations between LIA and the SO could be observed.
As shown in the raw traces (Fig. 3A), spectrograms (Fig. 3B), and spectra (Fig. 3C), the SO typically appeared first in the nCTX and was correlated with the appearance of LIA in the HPC. When the SO eventually appeared in the HPC, it was only transiently coordinated with the SO in the nCTX (Fig. 3A, raw trace expansions). Slow rhythms in the nCTX typically outlasted the SO in the HPC, but only for a brief amount of time.
Not surprisingly, the spectral coherence of the SO across cortical and hippocampal sites for the above experiments only tended to be moderate (∼0.5) and variable within and across any given episode. To verify that this level of coherence was a genuine feature of the hippocampal–neocortical interaction, we performed additional experiments in which we recorded from two distant neocortical sites simultaneously with the hippocampal site (n = 7) or from two homotypic hippocampal sites simultaneously with a single neocortical site (n = 6) in the urethane-anesthetized animal (Fig. 4). In these experiments, the coherence of the SO computed between intracortical (0.9 ± 0.01) and interhippocampal (0.9 ± 0.02) sites was consistently high but only intermediate for cortical to HPC sites (Fig. 4A, 0.5 ± 0.06; B, 0.6 ± 0.06; t test, p < 0.01; bottom panels).
Figure 4.

Cortical-cortical, hippocampal-hippocampal, and cortical-hippocampal coherence of the slow oscillation during urethane anesthesia. Representative field recordings from the HPC and two distant cortical sites [fCTX and posterior occipital cortex (pCTX)] are shown in A, and recordings from the fCTX and two isotypic points in the right HPC (RHPC) and left HPC (LHPC) are shown in B. Although cortical EEG traces in A and hippocampal EEG traces in B look almost identical, there is more variation between cortical and hippocampal field activity. The bottom panel shows coherence measurements between the above sites for seven different experiments in A and six other experiments in B (filled squares represent measures for data shown in top panel). Averages and SEM are offset to the right of each pairwise plot. These demonstrate that although cortical-cortical and hippocampal-hippocampal coherence of the SO is relatively invariable and extremely high, cortical-hippocampal coherence tends to be more variable and significantly lower. NS, Not significant; LfCTX, left fCTX; fiss, fissure.
To investigate the hippocampal–neocortical dynamics of SO coordination over time, we performed sliding cross-correlation analyses of hippocampal and neocortical activity across single SO evolutions in the urethane-anesthetized animal. Individual cross-correlations at successive (Fig. 5C) and specific times (Fig. 5D) during the evolution of the SO showed that both the first (∼0 s lag) and second (∼1 s lag) peak correlation values tended to increase significantly over time, although there was a systematic and periodic fluctuation in both correlation and coherence values (Fig. 5E). The periodicity of the cross-correlation fluctuations overlapped extensively and consistently across all SO evolutions (minimum of three used) within the same animal, as well as across all experiments (n = 7; 17.2 ± 0.6 s; ∼0.05 Hz) (Fig. 5F).
Figure 5.

Dynamic coordination of the hippocampal and neocortical slow oscillations during urethane anesthesia. A, Simultaneous long-term field recordings and expansions from indicated positions (B) from the HPC and deep fCTX during a spontaneous field state change. As shown previously (Fig. 3), there is a lack of correlation between cortical and hippocampal SO early in the evolution of this activity. C, Time-aligned sliding cross-correlogram of hippocampal and cortical signals shown in A. As suggested by the raw traces in B, there is a gradual increase of the rhythmic correlation of slow oscillatory activity through the episode as denoted by the development of positive peaks at lag intervals of ∼1 s (hot colors) centered around ∼0 s (95% confidence interval represented by gray box on color scale; all colors other than green represent significant changes). The average cross-correlation function computed across the entire episode is shown in white at the right of the panel. D, Individual cross-correlation functions computed at time points ii and iii in A and B are superimposed with the averaged (Avg) cross-correlation function from C. As suggested by the traces, the cross-correlation of the signals increases substantially when comparing time point ii to time point iii. This increase waxes and wanes, as observed by periodic increases and decreases of the peak values in C (95% confidence interval represented by gray shaded area). E, Dynamics of the first (black; lag, −25 ms) and second (red; lag, 1000 ms) positive peak (Pos Peak) values of the cross-correlation (X-Corr) function and coherence values at 1 Hz (green) across the entire episode [time aligned to the raw data (A) and cross-correlogram (C)]. Although the values of the cross-correlation peak tend to increase across time (shown by a related increase in coherence), there is also a systematic and seemingly periodic fluctuation in these values every 10–20 s (95% confidence interval represented by gray shaded area). F, The period of these fluctuations was plotted and averaged for the first (black circles) and second (red squares) positive correlation peaks for multiple SO episodes in the same rat (1, 2, and 3; unfilled squares represent measures for data shown) and across all experiments (All Exps). The period within and across experiments showed a high degree of overlap across all animals. fiss, Fissure.
Previous studies have suggested that there may be a functional relationship between respiration and the slow oscillatory EEG activity in medial temporal cortices under urethane or ketamine–xylazine anesthesia (Fontanini et al., 2003; Manns et al., 2003; Fontanini and Bower, 2005). We assessed whether any such relationship existed in our own experiments (n = 5) by performing spectral analysis between the respiratory cycle and both hippocampal and neocortical EEG signals (see supplemental Fig. 4, available at www.jneurosci.org as supplemental material). We found that the SO EEG signal (regardless of site) had a completely different peak frequency from the respiratory rhythm (HPC, 1.33 ± 0.08; nCTX, 1.33 ± 0.08; respiration, 2.17 ± 0.15 Hz; t test, p < 0.01), and was also noncoherent with it (HPC vs respiration, 0.19 ± 0.03; nCTX vs respiration, 0.14 ± 0.02). SO power and hippocampal–neocortical coherence (0.57 ± 0.03) were consistent with our previous findings (Fig. 4).
Cholinergic modulation of the slow oscillation
In naturally sleeping conditions, the ascending cholinergic system has been shown to play a role in the activation of forebrain regions: activated patterns of the EEG are correlated with elevated levels of acetylcholine as compared with deactivated patterns (Jasper and Tessier, 1971; Kametani and Kawamura, 1990; Day et al., 1991; Williams et al., 1994). As well, exogenous activation of cholinergic receptors induces the activated state in the nCTX and HPC, and muscarinic antagonists induce the deactivated state (Bland, 1986; Vanderwolf, 1988; Steriade et al., 1993a). To confirm that the SO in the HPC of urethane-anesthetized rats followed a similar dependence, we performed systemic manipulations of cholinergic neurotransmission. Consistent with previous findings, both the hippocampal and the neocortical SO were abolished by systemic administration of eserine (n = 5) or oxotremorine (n = 5) (Fig. 6B) and were enhanced by atropine (n = 6) (Fig. 6C). The frequency composition of spontaneous activity and pharmacologically induced hippocampal theta (F(2,17) = 4.1; p > 0.01) and SO (t test, p > 0.01), in addition to the peak frequency power of spontaneous activity as compared with pharmacologically induced theta (F(2,11) = 1.6; p > 0.01) and SO (t test, p > 0.01) were highly similar (Fig. 6D–F). The ability of muscarinic antagonism to promote the SO at both hippocampal and neocortical sites was consistent for experiments in which atropine was administered alone or after cholinergic agonism in the same animal (n = 4). In all cases, spontaneous state changes were completely abolished after either muscarinic agonism or antagonism.
Figure 6.

The slow oscillation is abolished by muscarinic agonism and enhanced by muscarinic antagonism during urethane anesthesia. A, Simultaneously recorded field signals from the HPC and nCTX showing a spontaneous state change. B, After intraperitoneal administration of 4 mg/kg oxotremorine, a continuously activated (theta and LVFA) state was elicited. C, Conversely, subsequent intraperitoneal administration of 50 mg/kg atropine sulfate (AtSO4) elicited a continuous deactivated (SO) state. D, Spectra of spontaneous and pharmacologically induced states appeared highly similar in terms of peak frequencies (E) as well as peak power values (F) and statistical comparison verified that there was no significant difference. fiss, Fissure; TH, theta; Oxo, oxotremorine; Spon, spontaneous; Eser, eserine.
Laminar profile analysis of the hippocampal SO
It is clear that although the slow oscillatory activity in the HPC and nCTX are somewhat independent, they are also coupled. One possible coupling mechanism could be through corticohippocampal synaptic interactions mediated via the EC (Collins et al., 1999; Lavenex and Amaral, 2000; Witter et al., 2000). We performed laminar profile and CSD analyses of field activity using the linear multiprobe through both the nCTX and dorsal HPC of urethane-anesthetized rats. We recorded samples of both spontaneous SO and theta field activity at sequential 0.5 mm depth intervals, to a final depth of 4.5 mm ventral to the pial surface (n = 12). At every position, we computed the spectral profile (autospectral power, cross-phase, and coherence) for each channel of the probe across the two states (14 channels across 1.4 mm in each recording). Power values were averaged across a 0.3 Hz bandwidth centered on the peak power frequency (peak frequency, ±1/6 Hz; 0.7–1.3 Hz for the SO: 1.1 ± 0.01 Hz and 3.2–4.7 Hz for theta: 3.9 ± 0.03 Hz) and were normalized to power values at the stationary HPC electrode. Phase and coherence values between probe sites, the stationary neocortical electrode (for the SO), and the stationary hippocampal electrode (for theta) were averaged across the same frequency ranges. All values were arranged by relative depth and plotted and verified against the topography of the histological probe track as shown in Figure 7, A and B.
Figure 7.

Spectral profile of the slow oscillation and theta during urethane anesthesia. Sequential laminar profiles of field activity were recorded in 0.5 mm increments through the dorsal to ventral axis of the brain, to a final depth of 4.5 mm using a multichannel probe; each line represents one laminar recording spanning 1.4 mm with the multiprobe. A histological photomicrograph of the multiprobe track is shown in A. Spectral analysis was performed on these signals in addition to simultaneously recorded field activity from fixed sites in the HPC and nCTX. B, Average spectral values, including autopower, phase, and coherence are plotted as a function of depth and aligned to the histology in A. Phase and coherence were computed with respect to the fixed neocortical signal during the SO and the fixed hippocampal signal during theta. The SO (red lines) null zone occurred in the nCTX at a depth of 0.9 mm (approximately layer V). It also showed a significant phase shift (∼20°) aligned with a maximal value within the HPC. This depth coincided with the position of the theta (black lines) maximum [approximately at the level of the hippocampal fissure (fiss)]. Coherence for both the SO and theta remained high throughout the profile except at positions that corresponded to phase reversals. The coherence of the SO within the HPC, however, was more variable, especially at locations near the power maximum. Raw field samples of theta (C) and the SO (D) from the numbered probe contacts are shown. Fast components of the SO, in addition to theta, reverse phase at a depth of 2.6 mm (trace 5). E, An average voltage profile clearly demonstrates the SO phase shift within the HPC. The corresponding average CSD shows a large sink at ∼3.0 mm and smaller sinks at ∼2.7 mm. The CSD scale is −13.0 to 13.0 mV/mm2.
The profile for theta rhythm (Fig. 7B, black lines) was consistent with that of previous reports (for review, see Bland, 1986). No dipole was observed in the nCTX, although one was observed in the HPC. A null zone was located just below stratum pyramidale (SPyr) in the inner portion of stratum radiatum (SRad), at a depth of 2.6 mm in the experiment shown (2.6 ± 0.02 mm). This depth corresponded to the location of the phase reversal and to a significant drop in the coherence of the theta signal in all animals. In addition, theta was maximal at a depth of 3.0 mm (3.1 ± 0.03 mm), which was established to be at the level of stratum lacunosum-moleculare (SLM) and the hippocampal fissure based on previous descriptions (Winson, 1974; Bland and Whishaw, 1976; Buzsáki et al., 1986) (for review, see Bland, 1986) and histological verification.
The profile for SO (Fig. 7B, red lines) is shown superimposed on the theta profile. Across all experiments, there was an obvious SO field dipole in the nCTX. This is consistent with previous research on the neocortical SO (Amzica and Steriade, 1998). The neocortical SO phase reversal and a significant drop in the coherence of the signal as compared with the static cortical site occurred at a depth that corresponded to layer IV or V (0.9 mm; 0.86 ± 0.01 mm) (Fig. 7B). Although no null zone was observed in the HPC for the SO, a power maximum and a phase shift of ∼20 degrees (22.3 ± 1.1°) existed at a depth of 2.9–3.0 mm (3.1 ± 0.02 mm). This phase shift reflects an average time difference of 56 ± 3 ms for hippocampal versus neocortical activity at 1 Hz. In all 12 experiments and as depicted in Figure 7B, the power value at this level was even larger (459.7 ± 21.8%) than those recorded at the maximal neocortical site. The location of the SO power maximum and phase shift reliably corresponded to the position of the maximal power value of theta (SLM/fissure). Finally, with the exception of the reversal point in the nCTX, the coherence throughout the SO profile was high (near 1.0), although values throughout the HPC tended to be lower and more variable (0.6–0.9).
Expanded raw traces of laminar profile recordings at the levels indicated (blue box/numbers) in Figure 7B demonstrate the above-mentioned features for both theta (Fig. 7C) and the SO (Fig. 7D). The null (reversal) point for theta is clearly seen in trace 5 (inner SRad), whereas the maximum is present at trace 9 (SLM/fissure). Although the rhythmicity of the SO is less clear, the maximal amplitude is observed at same level (trace 9, SLM/fissure) as that for theta. Interestingly, fast transient events could also be observed to reverse at or near this level. By averaging 32 1.5 s long segments of phase-matched, filtered (10 Hz lowpass) SO activity, we constructed an average voltage profile through the HPC that clearly demonstrates the SO phase shift within the HPC (Fig. 7E). CSD analysis on this averaged voltage profile revealed a large sink at the point of SO maximum (trace 9, SLM/fissure) and smaller sinks straddling trace 6 (SRad).
To verify the laminar location of recording sites along the multiprobe, averaged evoked potentials to single electrical shocks of known hippocampal afferent pathways (contralateral CA3, n = 4; ventral hippocampal commissure, n = 3; perforant path, n = 4), along with samples of spontaneous field activity during theta and the SO, were mapped along each sequential positioning of the multiprobe and later compared with the histological track. CSD profiles for averaged evoked potentials and for continuous EEG recordings of spontaneous rhythms are shown in Figure 8 aligned to a diagrammatical representation of the histology.
Figure 8.

Current source density analysis of theta and slow oscillatory activity during urethane anesthesia. CSD profiles of averaged evoked potentials in response to contralateral CA3 and ipsilateral perforant path (PP) stimulation (A) and 10 Hz lowpass-filtered, unaveraged, spontaneous theta (C) and SO field activity (D). For all profiles, the simultaneously recorded field potentials from contralateral fixed hippocampal sites are displayed (unfiltered potentials are shown in gray and lowpass-filtered traces are shown in black). CSD profiles were computed from field potentials recorded through the dorsal to ventral axis of the brain using a multichannel probe. A, The CSD profile of unfiltered, averaged evoked potentials was used to estimate the anatomical location of recording sites and is aligned to a hand-drawn representation of the cellular layers throughout the multiprobe track (B). The most prominent sink after CA3 stimulation was observed in SRad, corresponding to excitatory input from commissural fibers of the contralateral CA3 and the most prominent sink after perforant path stimulation was observed in the molecular layer of the dentate gyrus. C, During theta, prominent rhythmic alternations of sinks and sources are observed at the level of SLM of hippocampal CA1 and paired with alternating sources and sinks at the levels of SRad. D, During the SO, prominent and consistent sink-source alternations are also observed at the level of SLM and are often matched with weaker current flow in SRad. CSD scales are −125.0 to 125.0 mV/mm2 for contralateral CA3 stimulation and −370.0 to 370.0 mV/mm2 for PP stimulation in A, and −18.0 to 18.0 mV/mm2 for spontaneous activity in C and D. Alv, Alveus; SOr, stratum oriens; fiss, hippocampal fissure; SGran, stratum granulosum; SMol, stratum moleculare.
As described previously (Buzsáki et al., 1986; Brankack et al., 1993; Bragin et al., 1995b), the CSD profiles of evoked potentials showed characteristic patterns of sinks and sources, which were used to delineate the various laminas within the HPC. Commissural (data not shown) and contralateral CA3 stimulation produced the most massive sink in SRad of CA1 (Fig. 8A, left panel). Perforant path stimulation evoked an early and large sink well below SRad of CA1 that spanned the molecular layer of the dentate gyrus (Fig. 8A, right panel).
CSD profiles for continuous samples of spontaneous theta (Fig. 8C) were highly similar to those described previously using averaged phase-locked potentials (Buzsáki et al., 1986; Brankack et al., 1993; Bragin et al., 1995b). The largest amplitude sink-source alternations occurred at a depth that corresponded to SLM. CSD profiles for continuous samples of spontaneous SO (Fig. 8D) also showed prominent sink-source alternations at ∼1 Hz at the same level (SLM). The amplitude of sink-source fluctuations at the level of the SLM was confirmed to be the largest using spectral analysis.
Because SLM is the level of termination of the temporo-ammonic pathway, this suggests that entorhinal input may play an important role in the phasing, coordination, and possibly generation of the SO within the HPC. In support of this idea, we have made preliminary recordings of superficial EC field and multiunit activity (n = 3) in urethane-anesthetized rats, which indicate that SO activity is also a prominent feature of the electrographic activity of the EC (Fig. 9). Multiunit activity tended to occur rhythmically at ∼1 Hz (Fig. 9A, bottom panel) and slightly before the negative phase (Rayleigh, z = 41, n = 3053, p < 0.01) of the hippocampal field potential (Fig. 9B,C).
Figure 9.
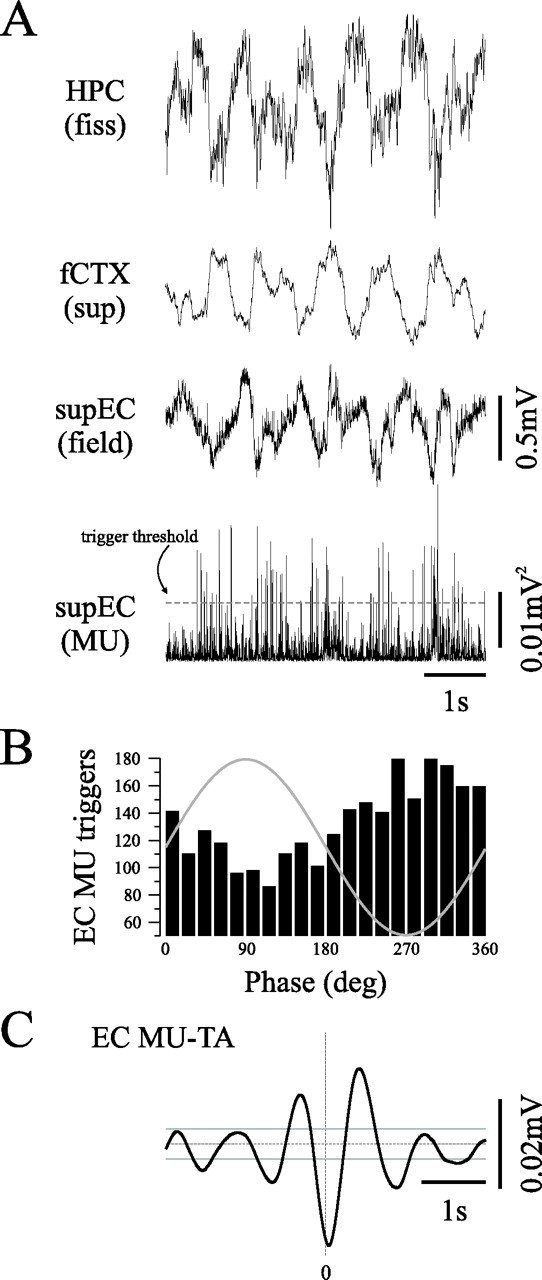
The slow oscillation is a prominent feature of entorhinal activity during urethane anesthesia. A, Simultaneously recorded hippocampal (top), neocortical, and superficial entorhinal (supEC) field activity show that the SO is prominent in all three structures. Rectified sup EC multiunit activity (supEC MU; bottom) was rhythmic (A) and was modulated by the ongoing SO (95% confidence interval represented by gray lines) (C). Phase histogram (B) was constructed using rectified supEC MU trigger (threshold represented by gray line) against supEC field and demonstrates that EC units tend to discharge just before the negative phase of the hippocampal field oscillation rhythmically at ∼1 Hz (C). fiss, Fissure.
Although the largest amplitude sink-source alternations occurred in SLM, intermittent (but somewhat rhythmic) current flow was also observed in SRad during the SO (Figs. 7E, 8D). Some of this activity may represent passive current flow generated by active zones at the level of SLM because it tended to be of lower amplitude, opposing direction, and appeared temporally correlated to the latter. However, based on their location, these events may also reflect hippocampal sharp waves (Buzsáki et al., 1983; Buzsáki, 1986; Suzuki and Smith, 1987) that are timed to the occurrence of the SO. To test this idea, we performed an analysis of the temporal relationship between the SO and hippocampal ripples (125–250 Hz) (O’Keefe and Nadel, 1978; Buzsáki et al., 1983; Buzsáki, 1986; Suzuki and Smith, 1988a; Ylinen et al., 1995) that frequently co-occur with sharp waves. By triggering on SPyr ripple activity, we assessed any possible phase relationship between ripples and the slow component of the SLM CSD (Fig. 10A–D). Ripple-triggered CSD waveform averages (Fig. 10D) and phase histograms (Fig. 10C) confirmed that no significant phase preference existed (Rayleigh, z = 6.7, n = 334, p > 0.01). This was not attributable to a reduction in overall ripple activity during the SO because the total ripple current flow was not significantly (t test, p > 0.01) different between LIA (1.13 ± 0.4) and the SO (1.24 ± 0.5).
Figure 10.

The SO modulates other synchronized ensemble patterns in the HPC during urethane anesthesia. A, E, I, Unfiltered slow oscillatory activity (top) and simultaneously recorded ripples (A), dentate spikes (E), and gamma (I) (bottom panels) recorded in SPyr, the inner molecular layer of the dentate gyrus (DG), and SLM, respectively. Traces are time aligned to (B, F, I) SO-filtered SLM CSD (top) and rectified ripples (B), dentate spikes (F), and gamma traces (J) (bottom panels). Phase histograms were constructed using rectified trace (trigger threshold represented by gray lines) against respective SLM CSD. Phase histograms and event-triggered CSD averages demonstrate that dentate spikes (G, H) and gamma rhythms (K, L) were phase modulated by the SLM SO CSD and that ripples (C, D) were not phase modulated by the SLM SO CSD. Dentate spikes tended to occur during or just after maximal SO sink at the level of SLM, and gamma was maximal during the maximal SO sink in SLM. Gray lines in D, H, and L represent values for 95% confidence intervals. TA, Triggered average; rectHPC, rectified (filtered) HPC voltage trace; rectDG, rectified (filtered) dentate trace.
In CSD profiles that straddled the hippocampal fissure and included the molecular layer of the dentate gyrus (SMol), sporadic current flow in concert with the SO was also observed (data not shown). Because these events appeared to be localized to the outer two-thirds of the molecular layer, this activity may represent dentate spikes (70–140 Hz) (Bragin et al., 1995a). Current flow corresponding to dentate spiking tended to occur more during the SO (10.2 ± 3.3 mV2/mm2) than during LIA (9.2 ± 3.5 mV2/mm2); however, this difference was not significant (t test, p > 0.01). Phase analysis of SMol dentate spikes in relation to the SO-filtered SLM CSD (Fig. 10E–H) revealed that they tended to occur during or just after the maximal sink in SLM (Rayleigh, z = 65, n = 729, p < 0.01) (Fig. 10G) and occurred rhythmically at ∼1 Hz (Fig. 10H).
In single electrode recordings (Figs. 1, 2, 3, 6) and laminar profiles (Fig. 7D), we noted that other high-frequency components were elevated during the SO. By triggering on gamma (25–80 Hz) activity, we assessed any possible phase relationship between SLM gamma and the slow component of the SLM CSD (Fig. 10I–L). Gamma-related current flow tended (not significant; t test, p > 0.01) to be greater during the SO (81.2 ± 45) than during LIA (40.8 ± 12) at the level of SLM. In addition, gamma-related activity fluctuated rhythmically at ∼1 Hz (Fig. 10L) in phase with the maximal SO sink in SLM (Rayleigh, z = 51, n = 732, p < 0.01) (Fig. 10K).
Discussion
The hippocampal SO as a novel state
Collectively, our data suggest that the rodent HPC demonstrates a previously undescribed, deactivated EEG state consisting of a rhythmic slow (≤1 Hz) oscillation similar to, and coordinated with, the previously described neocortical slow oscillation (Steriade et al., 1993b). Although this type of activity would have historically been categorized as slow delta, our terminology follows the interpretation of Amzica and Steriade (1997).
As shown previously for the neocortical SO (Steriade et al., 1993c,b, 2001; Timofeev et al., 2001), the hippocampal SO is a spontaneous and similar feature of both SWS and urethane anesthesia. Its unique temporal and spectral properties, its dynamic correspondence with the neocortical SO, and the differential activity of hippocampal units are all highly similar across both states and clearly demonstrate that the SO represents a different and more deactivated state than LIA. One characteristic difference was the sporadic and transient appearance of the SO during sleep, whereas it tended to last longer and was more stereotyped under urethane anesthesia. A similar phenomenon has been noted for the neocortical SO (Steriade et al., 1993b).
An important question concerns why this activity has never been previously reported or characterized. To a large extent, this is likely caused by the disproportionate attention paid to the hippocampal “activated” (i.e., theta) state, although brief descriptions of a slow oscillatory state in the HPC under urethane anesthesia (Leung, 1985; Suzuki and Smith, 1988b) and during sleep (Jouvet et al., 1959a) do exist. Recent attention has been directed toward transient synchronized hippocampal patterns occurring during sleep (Buzsáki, 1986, 1996) and especially to their relationship(s) to ongoing neocortical activity (Siapas and Wilson, 1998; Sirota et al., 2003; Battaglia et al., 2004). These patterns have been considered without reference to the hippocampal SO. This may be for a number of reasons: (1) the lack of stationarity of the SO, especially during natural sleep (Steriade et al., 1993b), (2) the erroneous interpretation of the hippocampal SO as volume conducted potentials from overlying nCTX, (3) elimination of the SO signal because of intrahippocampal bipolar electrode arrangements and differential amplification (Robinson, 1980; Bland, 1986), and (4) elimination of the SO signal because of the common practice of highpass filtering ≥1 Hz to reduce electrical artifacts in freely behaving animals (Steriade et al., 1993b).
Hippocampal cellular activity during the SO
As was suggested by one of the first paired single-unit recording studies in the HPC during sleep (Noda et al., 1969a,b), slow synchronization between hippocampal units appears to be a prominent feature of the deactivated state. During the SO under urethane anesthesia, hippocampal multiunit activity from both CA1 and dentate subfields appeared to be phase related to the ongoing SO field, and a high proportion of single units showed differential spike train dynamics during this field state.
The characteristics of single-unit activity during the SO did not seem to be predicted by their behavior during theta. Neither the classification of units as theta-on or theta-off nor the classification of units as being phase related to theta (phasic or tonic) as described by Bland and Colom (1993), reliably provided any systematic indication of subsequent firing behavior during the SO. Our data imply that the theta and SO states impose a distinct and overlapping influence on the dynamics of the hippocampal network and provide additional evidence that different EEG activities reflect different functional processing states.
Coordination of the hippocampal and neocortical slow oscillations
One of the most striking and perhaps most important findings of this study concerned the dynamic coordination of the SO between the HPC and nCTX. The SO was often observed in the nCTX without concomitant activity in the HPC, although the converse was not true. This suggests that the regulation of the SO state across hippocampal- and neo-cortices is dependent on activity in ascending activating systems (likely cholinergic) and also that it is not directly paced from a common source. The coordination of the SO within the nCTX and HPC was consistently strong, whereas the coordination between these areas was variable and often only transient. These data strongly suggest that the neocortical and hippocampal SO phenomena are independently regulated yet somehow coupled.
A likely mechanism for the coordination of neocortical and hippocampal SO is through synaptic interactions mediated via the EC. The bulk of neocortical input to the HPC arrives via the superficial layers (II and III) of the EC, and the bulk of the hippocampal output returns to the nCTX via the deep layers (V and VI) of the EC (Lavenex and Amaral, 2000; Witter et al., 2000). Our hippocampal CSD, EC field and EC multiunit recordings implicate the temporo-ammonic pathway (EC layer III to the apical dendritic zone of CA1, i.e., SLM) as providing robust, rhythmic, excitatory input at slow frequencies during the SO. In support of this, the SO has been noted previously in the EC of both the ketamine–xylazine anesthetized and naturally sleeping cat (Collins et al., 1999, 2001) as well as the urethane-anesthetized rat (Isomura et al., 2005). Furthermore, preliminary evidence from our laboratory (Dickson et al., 2005) suggests that lesions of the perforant pathway also affect the hippocampal SO.
Another possibility for regulation of hippocampal–cortical coordination comes from a thalamic input via the reuniens nucleus, which also terminates in SLM (Wouterlood et al., 1990) and is known to have feedforward excitatory and inhibitory influences on pyramidal cells in CA1 (Dolleman-Van der Weel et al., 1997; Bertram and Zhang, 1999). This input may be another, less direct pathway for cortical influences to be mediated in the HPC because the nCTX is known to modulate the SO in a variety of thalamic nuclei (Steriade et al., 1993d; Timofeev and Steriade, 1996). Future experiments should address the role of this structure in the coordination of neocortical and hippocampal SO.
Relationship of the SO to other hippocampal synchronized ensemble patterns
During non-REM sleep and anesthesia, two transient and irregularly occurring population events have been described previously in the HPC: sharp waves coexpressed with ripple oscillations (∼200 Hz) (O’Keefe and Nadel, 1978; Buzsáki, 1986; Suzuki and Smith, 1987; Buzsáki et al., 1992; Ylinen et al., 1995) and dentate spikes (∼100 Hz) (Bragin et al., 1995a). Because CA1 ripples are known to be weakly correlated with slow neocortical activity during sleep (Siapas and Wilson, 1998; Sirota et al., 2003; Battaglia et al., 2004), we were interested to know whether they were also related to the hippocampal SO. Although some weak ripple–SO coupling was observed, dentate spikes were far more consistently phase related to the SO. Because dentate spikes have been shown to be dependent on superficial entorhinal input (Bragin et al., 1995a), this provides further evidence that neocortical and hippocampal SO coordination may be mediated via the EC. At a minimum, our data suggest that the hippocampal SO plays a selective role in shaping transient population dynamics throughout the trisynaptic pathway.
Although the gamma rhythm (∼40 Hz) has been typically associated with the theta state (Bragin et al., 1995b), we also observed a large increase in this bandwidth during the SO. This gamma power increase appeared to be the largest in the SLM region and was phase related to the ongoing SO (maximal during the SO sink in SLM). We also observed a phase-related increase in gamma power at a similar position during ongoing theta. Although we can only speculate, this fast activity could be a result of either (1) fast synchronization of inputs to SLM or (2) a locally reverberating network in SLM.
Effects of pharmacological agents on hippocampal SO: implications for its generation and dependence on neural activity in ascending activating systems
The control of hippocampal activation during sleep and urethane anesthesia is known to occur solely via ascending cholinergic influences, unlike that in freely moving animals (for review, see Bland, 1986; Vanderwolf, 1988). Pharmacological challenges that promote muscarinic neurotransmission abolished the SO and resulted in an activated (theta) state. Conversely, muscarinic antagonism abolished the activated (theta) state and produced the SO. Parallel results have been reported previously for the neocortical SO (Steriade et al., 1993a). The hippocampal SO, like its neocortical counterpart (Sanchez-Vives and McCormick, 2000; Timofeev et al., 2000), appears to represent a spontaneous activity state allowed by a reduction in tone of the ascending activating system.
Another question that remains is whether the hippocampal SO can be elicited by other anesthetics, which have been shown to elicit the neocortical SO. For example, the neocortical SO is a prominent feature of ketamine/xylazine, but not barbiturate, anesthesia (Steriade et al., 1993b). Preliminary experiments in our laboratory using intravenous injections of these compounds have suggested that the same is true of the hippocampal SO (A. Lo, E. A. Clement, E. Mah, and C. T. Dickson, unpublished observations).
Functional relevance of the hippocampal SO
Transient synchronization of neuronal elements across and within networks could facilitate synaptic modifications during sleep (Buzsáki, 1998; Hasselmo, 1999; Peigneux et al., 2001; Tononi and Cirelli, 2001; Ribeiro and Nicolelis, 2004; Walker and Stickgold, 2004; Rauchs et al., 2005). We believe that the SO state presents an ideal platform for modification of synaptic weights in the bidirectional neocortico-hippocampal circuit that is considered to be the hardware of the brain for declarative memory formation. It is well known that neuronal synchronization is a critical factor in synaptic plasticity. Robust synchrony between presynaptic and postsynaptic neurons enhances, whereas a lack of synchrony decreases, synaptic efficacy (Lynch et al., 1977; McNaughton et al., 1978; Levy and Steward, 1979; Barrionuevo and Brown, 1983; Bramham and Srebro, 1987; Stanton and Sejnowski, 1989; Dan and Poo, 2004).
A link between SWS, the regulation of site-specific slow oscillatory activity, and memory consolidation has been recently shown for a procedural learning task (Huber et al., 2004), as well as for a hippocampal-dependent navigation task (Peigneux et al., 2004). In both studies, an increase in slow-wave activity during post-training sleep was correlated with a subsequent enhancement of performance. This suggests that memory consolidation may occur during SWS episodes. Although our observations do not allow for a direct link between the SO and hippocampal-dependent memory consolidation, it is of interest to note that recent studies have specifically implicated the temporo-ammonic pathway in this process (Remondes and Schuman, 2004; Brun et al., 2005). Because the present study shows that the coordination of the hippocampal and neocortical SO appears to rely on the temporo-ammonic pathway, it is intriguing to suggest that the regulation of the SO is the neurophysiological platform by which hippocampal-dependent memory consolidation occurs.
Footnotes
In memory of Angel Alonso, 1957–2005.
This study was supported by Natural Science and Engineering Research Council of Canada (NSERC) Grant RGPIN 249861 to C.T.D. C.T.D. is an Alberta Heritage Foundation for Medical Research (AHFMR) Scholar. S.R.P. was supported by NSERC and AHFMR summer studentships. Multichannel silicon probes were kindly provided by the University Of Michigan (Ann Arbor, MI) Center for Neural Communication Technology, sponsored by National Institutes of Health–National Center for Research Resources Grant P41-RR09754. We acknowledge the technical assistance of Jennifer Grams, Dr. Gerardo Biella, Jon Kerber, and Jill Miko. Dr. Chris Sturdy generously provided digital microscopy support.
References
- Amzica F, Steriade M (1997). The K-complex: its slow (<1-Hz) rhythmicity and relation to delta waves. Neurology 49:952–959. [DOI] [PubMed] [Google Scholar]
- Amzica F, Steriade M (1998). Cellular substrates and laminar profile of sleep K-complex. Neuroscience 82:671–686. [DOI] [PubMed] [Google Scholar]
- Barrionuevo G, Brown TH (1983). Associative long-term potentiation in hippocampal slices. Proc Natl Acad Sci USA 80:7347–7351. [DOI] [PMC free article] [PubMed] [Google Scholar]
- Battaglia FP, Sutherland GR, McNaughton BL (2004). Hippocampal sharp wave bursts coincide with neocortical “up-state” transitions. Learn Mem 11:697–704. [DOI] [PMC free article] [PubMed] [Google Scholar]
- Bertram EH, Zhang DX (1999). Thalamic excitation of hippocampal CA1 neurons: a comparison with the effects of CA3 stimulation. Neuroscience 92:15–26. [DOI] [PubMed] [Google Scholar]
- Bland BH (1986). The physiology and pharmacology of hippocampal formation theta rhythms. Prog Neurobiol 26:1–54. [DOI] [PubMed] [Google Scholar]
- Bland BH, Colom LV (1993). Extrinsic and intrinsic properties underlying oscillation and synchrony in limbic cortex. Prog Neurobiol 41:157–208. [DOI] [PubMed] [Google Scholar]
- Bland BH, Whishaw IQ (1976). Generators and topography of hippocampal theta (RSA) in the anaesthetized and freely moving rat. Brain Res 118:259–280. [DOI] [PubMed] [Google Scholar]
- Bland SK, Bland BH (1986). Medial septal modulation of hippocampal theta cell discharges. Brain Res 375:102–116. [DOI] [PubMed] [Google Scholar]
- Bragin A, Jando G, Nadasdy Z, van Landeghem M, Buzsáki G (1995a). Dentate EEG spikes and associated interneuronal population bursts in the hippocampal hilar region of the rat. J Neurophysiol 73:1691–1705. [DOI] [PubMed] [Google Scholar]
- Bragin A, Jandó G, Nádasdy Z, Hetke J, Wise K, Buzsáki G (1995b). Gamma (40–100 Hz) oscillation in the hippocampus of the behaving rat. J Neurosci 15:47–60. [DOI] [PMC free article] [PubMed] [Google Scholar]
- Bramham CR, Srebro B (1987). Induction of long-term depression and potentiation by low- and high-frequency stimulation in the dentate area of the anesthetized rat: magnitude, time course and EEG. Brain Res 405:100–107. [DOI] [PubMed] [Google Scholar]
- Brankack J, Stewart M, Fox SE (1993). Current source density analysis of the hippocampal theta rhythm: associated sustained potentials and candidate synaptic generators. Brain Res 615:310–327. [DOI] [PubMed] [Google Scholar]
- Brun VH, Leutgeb S, Wu HQ, Schwarcz R, Witter MP, Moser EI, Moser MB (2005). Direct input from entorhinal cortex is necessary for spatial representation in hippocampal area CA1. Soc Neuroci Abstr 31:198.192. [Google Scholar]
- Buzsáki G (1986). Hippocampal sharp waves: their origin and significance. Brain Res 398:242–252. [DOI] [PubMed] [Google Scholar]
- Buzsáki G (1989). Two-stage model of memory trace formation: a role for “noisy” brain states. Neuroscience 31:551–570. [DOI] [PubMed] [Google Scholar]
- Buzsáki G (1996). The hippocampo-neocortical dialogue. Cereb Cortex 6:81–92. [DOI] [PubMed] [Google Scholar]
- Buzsáki G (1998). Memory consolidation during sleep: a neurophysiological perspective. J Sleep Res 7:[Suppl 1], 17–23. [DOI] [PubMed] [Google Scholar]
- Buzsáki G (2002). Theta oscillations in the hippocampus. Neuron 33:325–340. [DOI] [PubMed] [Google Scholar]
- Buzsáki G, Leung LW, Vanderwolf CH (1983). Cellular bases of hippocampal EEG in the behaving rat. Brain Res 287:139–171. [DOI] [PubMed] [Google Scholar]
- Buzsáki G, Czopf J, Kondakor I, Kellenyi L (1986). Laminar distribution of hippocampal rhythmic slow activity (RSA) in the behaving rat: current-source density analysis, effects of urethane and atropine. Brain Res 365:125–137. [DOI] [PubMed] [Google Scholar]
- Buzsáki G, Horvath Z, Urioste R, Hetke J, Wise K (1992). High-frequency network oscillation in the hippocampus. Science 256:1025–1027. [DOI] [PubMed] [Google Scholar]
- Chaput M, Holley A (1980). Single unit responses of olfactory bulb neurones to odour presentation in awake rabbits. J Physiol (Paris) 76:551–558. [PubMed] [Google Scholar]
- Cohen NJ, Squire LR (1980). Preserved learning and retention of pattern-analyzing skill in amnesia: dissociation of knowing how and knowing that. Science 210:207–210. [DOI] [PubMed] [Google Scholar]
- Collins DR, Lang EJ, Pare D (1999). Spontaneous activity of the perirhinal cortex in behaving cats. Neuroscience 89:1025–1039. [DOI] [PubMed] [Google Scholar]
- Collins DR, Pelletier JG, Pare D (2001). Slow and fast (gamma) neuronal oscillations in the perirhinal cortex and lateral amygdala. J Neurophysiol 85:1661–1672. [DOI] [PubMed] [Google Scholar]
- Corkin S, Amaral DG, Gonzalez RG, Johnson KA, Hyman BT (1997). H.M.’s medial temporal lobe lesion: findings from magnetic resonance imaging. J Neurosci 17:3964–3979. [DOI] [PMC free article] [PubMed] [Google Scholar]
- Dan Y, Poo MM (2004). Spike timing-dependent plasticity of neural circuits. Neuron 44:23–30. [DOI] [PubMed] [Google Scholar]
- Day J, Damsma G, Fibiger HC (1991). Cholinergic activity in the rat hippocampus, cortex and striatum correlates with locomotor activity: an in vivo microdialysis study. Pharmacol Biochem Behav 38:723–729. [DOI] [PubMed] [Google Scholar]
- Dickson CT, Wolansky TD, Kerber JW (2005). Neocortical modulation of the hippocampal slow oscillation via the entorhinal cortex. Soc Neurosci Abstr 31:275.273. [Google Scholar]
- Dolleman-Van der Weel MJ, Lopes da Silva FH, Witter MP (1997). Nucleus reuniens thalami modulates activity in hippocampal field CA1 through excitatory and inhibitory mechanisms. J Neurosci 17:5640–5650. [DOI] [PMC free article] [PubMed] [Google Scholar]
- Eichenbaum H (2000). A cortical-hippocampal system for declarative memory. Nat Rev Neurosci 1:41–50. [DOI] [PubMed] [Google Scholar]
- Fontanini A, Bower JM (2005). Variable coupling between olfactory system activity and respiration in ketamine/xylazine anesthetized rats. J Neurophysiol 93:3573–3581. [DOI] [PubMed] [Google Scholar]
- Fontanini A, Spano P, Bower JM (2003). Ketamine–xylazine-induced slow (< 1.5 Hz) oscillations in the rat piriform (olfactory) cortex are functionally correlated with respiration. J Neurosci 23:7993–8001. [DOI] [PMC free article] [PubMed] [Google Scholar]
- Frankland PW, Bontempi B (2005). The organization of recent and remote memories. Nat Rev Neurosci 6:119–130. [DOI] [PubMed] [Google Scholar]
- Freeman WJ (1975). In: Mass action in the nervous system New York: Academic.
- Grams JD, Lamy AL, Wolansky TD, MA P, CT D (2003). Coordination of the slow rhythm in neo-, hippocampal and entorhinal cortices of the urethane anaesthetized rat. Soc Neurosci Abstr 29:932.932. [Google Scholar]
- Hasselmo ME (1999). Neuromodulation: acetylcholine and memory consolidation. Trends Cogn Sci 3:351–359. [DOI] [PubMed] [Google Scholar]
- Huber R, Ghilardi MF, Massimini M, Tononi G (2004). Local sleep and learning. Nature 430:78–81. [DOI] [PubMed] [Google Scholar]
- Isomura Y, Sirota A, Ozen S, Buzsaki G (2005). Entorhino-hippocampal interactions during slow and theta network oscillations. Soc Neurosci Abstr 31:275.211. [Google Scholar]
- Jasper HH, Tessier J (1971). Acetylcholine liberation from cerebral cortex during paradoxical (REM) sleep. Science 172:601–602. [DOI] [PubMed] [Google Scholar]
- Jouvet M, Michel F, Courjon J (1959a). L’activité électrique du rhinencéphale au cours du sommeil chez le Chat. C R Seances Soc Biol Fil 153:101–105. [PubMed] [Google Scholar]
- Jouvet M, Michel F, Courjon J (1959b). Sur un stade d’activité électrique cérébrale rapide ou cours de sommeil physiologique. C R Seances Soc Biol Fil 153:1024–1028.14408003 [Google Scholar]
- Kametani H, Kawamura H (1990). Alterations in acetylcholine release in the rat hippocampus during sleep-wakefulness detected by intracerebral dialysis. Life Sci 47:421–426. [DOI] [PubMed] [Google Scholar]
- Karni A, Tanne D, Rubenstein BS, Askenasy JJ, Sagi D (1994). Dependence on REM sleep of overnight improvement of a perceptual skill. Science 265:679–682. [DOI] [PubMed] [Google Scholar]
- Ketchum KL, Haberly LB (1993). Synaptic events that generate fast oscillations in piriform cortex. J Neurosci 13:3980–3985. [DOI] [PMC free article] [PubMed] [Google Scholar]
- King C, Henze DA, Leinekugel X, Buzsáki G (1999). Hebbian modification of a hippocampal population pattern in the rat. J Physiol 521:159–167. [DOI] [PMC free article] [PubMed] [Google Scholar]
- Lavenex P, Amaral DG (2000). Hippocampal-neocortical interaction: a hierarchy of associativity. Hippocampus 10:420–430. [DOI] [PubMed] [Google Scholar]
- Leung LW (1985). Spectral analysis of hippocampal EEG in the freely moving rat: effects of centrally active drugs and relations to evoked potentials. Electroencephalogr Clin Neurophysiol 60:65–77. [DOI] [PubMed] [Google Scholar]
- Leung LW, Lopes da Silva FH, Wadman WJ (1982). Spectral characteristics of the hippocampal EEG in the freely moving rat. Electroencephalogr Clin Neurophysiol 54:203–219. [DOI] [PubMed] [Google Scholar]
- Levy WB, Steward O (1979). Synapses as associative memory elements in the hippocampal formation. Brain Res 175:233–245. [DOI] [PubMed] [Google Scholar]
- Lynch GS, Dunwiddie T, Gribkoff V (1977). Heterosynaptic depression: a postsynaptic correlate of long-term potentiation. Nature 266:737–739. [DOI] [PubMed] [Google Scholar]
- Manns ID, Alonso A, Jones BE (2003). Rhythmically discharging basal forebrain units comprise cholinergic, GABAergic, and putative glutamatergic cells. J Neurophysiol 89:1057–1066. [DOI] [PubMed] [Google Scholar]
- Maquet P, Laureys S, Peigneux P, Fuchs S, Petiau C, Phillips C, Aerts J, Del Fiore G, Degueldre C, Meulemans T, Luxen A, Franck G, Van Der Linden M, Smith C, Cleeremans A (2000). Experience-dependent changes in cerebral activation during human REM sleep. Nat Neurosci 3:831–836. [DOI] [PubMed] [Google Scholar]
- Marr D (1970). A theory for cerebral neocortex. Proc R Soc Lond B Biol Sci 176: pp. 161–234. [DOI] [PubMed] [Google Scholar]
- Marr D (1971). Simple memory: a theory for archicortex. Philos Trans R Soc Lond B Biol Sci 262:23–81. [DOI] [PubMed] [Google Scholar]
- McGaugh JL (2000). Memory–a century of consolidation. Science 287:248–251. [DOI] [PubMed] [Google Scholar]
- McNaughton BL, Douglas RM, Goddard GV (1978). Synaptic enhancement in fascia dentata: cooperativity among coactive afferents. Brain Res 157:277–293. [DOI] [PubMed] [Google Scholar]
- Nadel L, Moscovitch M (1997). Memory consolidation, retrograde amnesia and the hippocampal complex. Curr Opin Neurobiol 7:217–227. [DOI] [PubMed] [Google Scholar]
- Noda H, Manohar S, Adey WR (1969a). Spontaneous activity of cat hippocampal neurons in sleep and wakefulness. Exp Neurol 24:217–231. [DOI] [PubMed] [Google Scholar]
- Noda H, Manohar S, Adey WR (1969b). Correlated firing of hippocampal neuron pairs in sleep and wakefulness. Exp Neurol 24:232–247. [DOI] [PubMed] [Google Scholar]
- O’Keefe J, Nadel L (1978). In: The hippocampus as a cognitive map Oxford: Oxford UP.
- Pavlides C, Winson J (1989). Influences of hippocampal place cell firing in the awake state on the activity of these cells during subsequent sleep episodes. J Neurosci 9:2907–2918. [DOI] [PMC free article] [PubMed] [Google Scholar]
- Peigneux P, Laureys S, Delbeuck X, Maquet P (2001). Sleeping brain, learning brain. The role of sleep for memory systems. NeuroReport 12:A111–A124. [DOI] [PubMed] [Google Scholar]
- Peigneux P, Laureys S, Fuchs S, Destrebecqz A, Collette F, Delbeuck X, Phillips C, Aerts J, Del Fiore G, Degueldre C, Luxen A, Cleeremans A, Maquet P (2003). Learned material content and acquisition level modulate cerebral reactivation during posttraining rapid-eye-movements sleep. NeuroImage 20:125–134. [DOI] [PubMed] [Google Scholar]
- Peigneux P, Laureys S, Fuchs S, Collette F, Perrin F, Reggers J, Phillips C, Degueldre C, Del Fiore G, Aerts J, Luxen A, Maquet P (2004). Are spatial memories strengthened in the human hippocampus during slow wave sleep? Neuron 44:535–545. [DOI] [PubMed] [Google Scholar]
- Plihal W, Born J (1997). Effects of early and late nocturnal sleep on declarative and procedural memory. J Cogn Neurosci 9:534–547. [DOI] [PubMed] [Google Scholar]
- Rauchs G, Desgranges B, Foret J, Eustache F (2005). The relationships between memory systems and sleep stages. J Sleep Res 14:123–140. [DOI] [PubMed] [Google Scholar]
- Remondes M, Schuman EM (2004). Role for a cortical input to hippocampal area CA1 in the consolidation of a long-term memory. Nature 431:699–703. [DOI] [PubMed] [Google Scholar]
- Ribeiro S, Nicolelis MA (2004). Reverberation, storage, and postsynaptic propagation of memories during sleep. Learn Mem 11:686–696. [DOI] [PMC free article] [PubMed] [Google Scholar]
- Ribeiro S, Gervasoni D, Soares ES, Zhou Y, Lin SC, Pantoja J, Lavine M, Nicolelis MA (2004). Long-lasting novelty-induced neuronal reverberation during slow-wave sleep in multiple forebrain areas. PLoS Biol 2:E24. [DOI] [PMC free article] [PubMed] [Google Scholar]
- Rimbaud L, Passouant P, Cadilhac J (1955). Participation de l’hippocampe a la regulation des etats de veille et de sommeil. Rev Neurol (Paris) 93:303–308. [PubMed] [Google Scholar]
- Robinson TE (1980). Hippocampal rhythmic slow activity (RSA; theta): a critical analysis of selected studies and discussion of possible species-differences. Brain Res 203:69–101. [DOI] [PubMed] [Google Scholar]
- Robinson TE, Kramis RC, Vanderwolf CH (1977). Two types of cerebral activation during active sleep: relations to behavior. Brain Res 124:544–549. [DOI] [PubMed] [Google Scholar]
- Rodriguez R, Haberly LB (1989). Analysis of synaptic events in the opossum piriform cortex with improved current source-density techniques. J Neurophysiol 61:702–718. [DOI] [PubMed] [Google Scholar]
- Samonds JM, Bonds AB (2005). Gamma oscillation maintains stimulus structure-dependent synchronization in cat visual cortex. J Neurophysiol 93:223–236. [DOI] [PubMed] [Google Scholar]
- Sanchez-Vives MV, McCormick DA (2000). Cellular and network mechanisms of rhythmic recurrent activity in neocortex. Nat Neurosci 10:1027–1034. [DOI] [PubMed] [Google Scholar]
- Scoville WB, Milner B (1957). Loss of recent memory after bilateral hippocampal lesions. J Neurol Neurosurg Psychiatry 20:11–21. [DOI] [PMC free article] [PubMed] [Google Scholar]
- Siapas AG, Wilson MA (1998). Coordinated interactions between hippocampal ripples and cortical spindles during slow-wave sleep. Neuron 21:1123–1128. [DOI] [PubMed] [Google Scholar]
- Siapas AG, Lubenov EV, Wilson MA (2005). Prefrontal phase locking to hippocampal theta oscillations. Neuron 46:141–151. [DOI] [PubMed] [Google Scholar]
- Sirota A, Csicsvari J, Buhl D, Buzsáki G (2003). Communication between neocortex and hippocampus during sleep in rodents. Proc Natl Acad Sci USA 100:2065–2069. [DOI] [PMC free article] [PubMed] [Google Scholar]
- Smith C, MacNeill C (1994). Impaired motor memory for a pursuit rotor task following stage 2 sleep loss in college students. J Sleep Res 3:206–213. [DOI] [PubMed] [Google Scholar]
- Squire LR (1992). Memory and the hippocampus: a synthesis from findings with rats, monkeys, and humans. Psychol Rev 99:195–231. [DOI] [PubMed] [Google Scholar]
- Squire LR, Alvarez P (1995). Retrograde amnesia and memory consolidation: a neurobiological perspective. Curr Opin Neurobiol 5:169–177. [DOI] [PubMed] [Google Scholar]
- Squire LR, Zola-Morgan S (1991). The medial temporal lobe memory system. Science 253:1380–1386. [DOI] [PubMed] [Google Scholar]
- Stanton PK, Sejnowski TJ (1989). Associative long-term depression in the hippocampus induced by hebbian covariance. Nature 339:215–218. [DOI] [PubMed] [Google Scholar]
- Stefanacci L, Buffalo EA, Schmolck H, Squire LR (2000). Profound amnesia after damage to the medial temporal lobe: a neuroanatomical and neuropsychological profile of patient E. P. J Neurosci 20:7024–7036. [DOI] [PMC free article] [PubMed] [Google Scholar]
- Steriade M (1999). Coherent oscillations and short-term plasticity in corticothalamic networks. Trends Neurosci 22:337–345. [DOI] [PubMed] [Google Scholar]
- Steriade M, Amzica F, Nunez A (1993a). Cholinergic and noradrenergic modulation of the slow (approximately 0.3 Hz) oscillation in neocortical cells. J Neurophysiol 70:1385–1400. [DOI] [PubMed] [Google Scholar]
- Steriade M, Nunez A, Amzica F (1993b). A novel slow (<1 Hz) oscillation of neocortical neurons in vivo: depolarizing and hyperpolarizing components. J Neurosci 13:3252–3265. [DOI] [PMC free article] [PubMed] [Google Scholar]
- Steriade M, Nunez A, Amzica F (1993c). Intracellular analysis of relations between the slow (<1 Hz) neocortical oscillation and other sleep rhythms of the electroencephalogram. J Neurosci 13:3266–3283. [DOI] [PMC free article] [PubMed] [Google Scholar]
- Steriade M, Contreras D, Curro Dossi R, Nunez A (1993d). The slow (<1 Hz) oscillation in reticular thalamic and thalamocortical neurons: scenario of sleep rhythm generation in interacting thalamic and neocortical networks. J Neurosci 13:3284–3299. [DOI] [PMC free article] [PubMed] [Google Scholar]
- Steriade M, Timofeev I, Grenier F (2001). Natural waking and sleep states: a view from inside neocortical neurons. J Neurophysiol 85:1969–1985. [DOI] [PubMed] [Google Scholar]
- Stewart DJ, Vanderwolf CH (1987). Hippocampal rhythmical slow activity following ibotenic acid lesions of the septal region. I. Relations to behavior and effects of atropine and urethane. Brain Res 423:88–100. [DOI] [PubMed] [Google Scholar]
- Suzuki SS, Smith GK (1987). Spontaneous EEG spikes in the normal hippocampus. I. Behavioral correlates, laminar profiles and bilateral synchrony. Electroencephalogr Clin Neurophysiol 67:348–359. [DOI] [PubMed] [Google Scholar]
- Suzuki SS, Smith GK (1988a). Spontaneous EEG spikes in the normal hippocampus. II. Relations to synchronous burst discharges. Electroencephalogr Clin Neurophysiol 69:532–540. [DOI] [PubMed] [Google Scholar]
- Suzuki SS, Smith GK (1988b). Spontaneous EEG spikes in the normal hippocampus. V. Effects of ether, urethane, pentobarbital, atropine, diazepam and bicuculline. Electroencephalogr Clin Neurophysiol 70:84–95. [DOI] [PubMed] [Google Scholar]
- Timofeev I, Steriade M (1996). Low-frequency rhythms in the thalamus of intact-cortex and decorticated cats. J Neurophysiol 76:4152–4168. [DOI] [PubMed] [Google Scholar]
- Timofeev I, Grenier F, Bazhenov M, Sejnowski TJ, Steriade M (2000). Origin of slow cortical oscillations in deafferented cortical slabs. Cereb Cortex 10:1185–1199. [DOI] [PubMed] [Google Scholar]
- Timofeev I, Grenier F, Steriade M (2001). Disfacilitation and active inhibition in the neocortex during the natural sleep-wake cycle: an intracellular study. Proc Natl Acad Sci USA 98:1924–1929. [DOI] [PMC free article] [PubMed] [Google Scholar]
- Tononi G, Cirelli C (2001). Some considerations on sleep and neural plasticity. Arch Ital Biol 139:221–241. [PubMed] [Google Scholar]
- Usui S, Iwahara S (1977). Effects of atropine upon the hippocampal electrical activity in rats with special reference to paradoxical sleep. Electroencephalogr Clin Neurophysiol 42:510–517. [DOI] [PubMed] [Google Scholar]
- Vanderwolf CH (1969). Hippocampal electrical activity and voluntary movement in the rat. Electroencephalogr Clin Neurophysiol 26:407–418. [DOI] [PubMed] [Google Scholar]
- Vanderwolf CH (1988). Cerebral activity and behavior: control by central cholinergic and serotoninergic systems. Int Rev Neurobiol 30:225–340. [DOI] [PubMed] [Google Scholar]
- Vanderwolf CH, Kramis R, Robinson TE (1977). Hippocampal electrical activity during waking behaviour and sleep: analyses using centrally acting drugs. Ciba Found Symp 199–226. [DOI] [PubMed]
- Vanderwolf CH, Kolb B, Cooley RK (1978). Behavior of the rat after removal of the neocortex and hippocampal formation. J Comp Physiol Psychol 92:156–175. [DOI] [PubMed] [Google Scholar]
- Vertes RP, Eastman KE (2000). The case against memory consolidation in REM sleep. Behav Brain Sci 23:867–876. discussion 904–1121. [DOI] [PubMed] [Google Scholar]
- Walker MP, Stickgold R (2004). Sleep-dependent learning and memory consolidation. Neuron 44:121–133. [DOI] [PubMed] [Google Scholar]
- Walker MP, Brakefield T, Morgan A, Hobson JA, Stickgold R (2002). Practice with sleep makes perfect: sleep-dependent motor skill learning. Neuron 35:205–211. [DOI] [PubMed] [Google Scholar]
- Whelan PJ (2003). Electromyogram recordings from freely moving animals. Methods 30:127–141. [DOI] [PubMed] [Google Scholar]
- Williams JA, Comisarow J, Day J, Fibiger HC, Reiner PB (1994). State-dependent release of acetylcholine in rat thalamus measured by in vivo microdialysis. J Neurosci 14:5236–5242. [DOI] [PMC free article] [PubMed] [Google Scholar]
- Wilson MA, McNaugghton BL (1994). Reactivation of hippocampal ensemble memories during sleep. Science 265:676–679. [DOI] [PubMed] [Google Scholar]
- Winson J (1972). Interspecies differences in the occurrence of theta. Behav Biol 7:479–487. [DOI] [PubMed] [Google Scholar]
- Winson J (1974). Patterns of hippocampal theta rhythm in the freely moving rat. Electroencephalogr Clin Neurophysiol 36:291–301. [DOI] [PubMed] [Google Scholar]
- Witter MP, Wouterlood FG, Naber PA, Van Haeften T (2000). Anatomical organization of the parahippocampal-hippocampal network. Ann NY Acad Sci 911:1–24. [DOI] [PubMed] [Google Scholar]
- Wolansky TD, Clement EA, Richard AG, Ailon JI, Peters SR, Palczak MA, Dickson CT (2004). Extrinsic influences on the coordination of hippocampal and neocortical slow oscillations. Soc Neurosci Abstr 30:196–114. [Google Scholar]
- Wouterlood FG, Saldana E, Witter MP (1990). Projection from the nucleus reuniens thalami to the hippocampal region: light and electron microscopic tracing study in the rat with the anterograde tracer Phaseolus vulgaris-leucoagglutinin. J Comp Neurol 296:179–203. [DOI] [PubMed] [Google Scholar]
- Ylinen A, Bragin A, Nadasdy Z, Jando G, Szabo I, Sik A, Buzsáki G (1995). Sharp wave-associated high-frequency oscillation (200 Hz) in the intact hippocampus: network and intracellular mechanisms. J Neurosci 15:30–46. [DOI] [PMC free article] [PubMed] [Google Scholar]
- Zar JH (1999). In: Biostatistical analysis Ed 4 pp. 592–615. Chap 26 Upper Saddle River, NJ: Prentice Hall.
- Zola-Morgan S, Squire L, Amaral DG (1986). Human amnesia and the medial temporal region: enduring memory impairment following a bilateral lesion limited to field CA1 of the hippocampus. J Neurosci 6:2950–2967. [DOI] [PMC free article] [PubMed] [Google Scholar]