

Abstract
To analyze the fundamental role of gap junctions in the vertebrate inner ear, we examined molecular and functional characteristics of gap junctional communication (GJC) in the auditory and vestibular system of the chicken. By screening inner ear tissues for connexin isoforms using degenerate reverse transcription-PCR, we identified, in addition to chicken Cx43 (cCx43) and the inner-ear-specific cCx30, an as yet uncharacterized connexin predicted to be the ortholog of the mammalian Cx26. In situ hybridization indicated that cCx30 and cCx26 transcripts were both widely expressed in the cochlear duct and utricle in an overlapping pattern, suggesting coexpression of these isoforms similar to that in the mammalian inner ear. Immunohistochemistry demonstrated that cCx43 was present in gap junctions connecting supporting cells of the basilar papilla, in which its immunofluorescence colocalized with that of cCx30. However, cCx43 was absent from supporting cell gap junctions of the utricular macula. This variation in the molecular composition of gap junction plaques coincided with differences in the functional properties of GJC between the auditory and vestibular sensory epithelia. Fluorescence recovery after photobleaching, adapted to examine the diffusion of calcein in inner ear explants, revealed asymmetric communication pathways among supporting cells in the basilar papilla but not in the utricular macula. This study supports the hypothesis that the coexpression of Cx26/Cx30 is unique to gap junctions in the vertebrate inner ear. Furthermore, it demonstrates asymmetric GJC within the supporting cell population of the auditory sensory epithelium, which might mediate potassium cycling and/or intercellular signaling.
Keywords: connexin, gap junction, fluorescence recovery after photobleaching, supporting cell, inner ear, chicken
Introduction
Gap junctions are clusters of intercellular channels that mediate direct communication between cells by allowing the diffusion of ions, metabolites, and second messengers up to a molecular weight of 1 kDa (for review, see Evans and Martin, 2002; Nicholson, 2003). In vertebrates, each hemichannel or connexon is formed by the oligomerization of six transmembrane proteins called connexins. Connexins show a tissue-specific expression, with many cells expressing more than one isoform. The presence of various connexins in a cell may lead to different molecular connexon compositions that influence the permeability and gating properties of gap junction channels (for review, see Harris, 2001; Goldberg et al., 2004).
In the mammalian inner ear, Cx26 and Cx30 are the major isoforms in gap junctions connecting the cells of the sensory and ion-transporting epithelia (Ahmad et al., 2003; Forge et al., 2003b). Variations in the arrangement and stoichiometry of these isoforms have been linked to directional current flow between supporting cells (Zhao, 2000; Zhao and Santos-Sacchi, 2000) and to the formation of communication compartments within the organ of Corti (Jagger and Forge, 2006). In particular, Cx26 and Cx30 form heteromeric connexons (Ahmad et al., 2003; Forge et al., 2003b; Sun et al., 2005), which are thought to be unique to the mammalian inner ear and might thus account for the nonsyndromic nature of deafness caused by mutations in their encoding genes (Forge et al., 2003a; Marziano et al., 2003).
It has been suggested that inner ear gap junctions play a role in the cycling of potassium ions (K+) (Santos-Sacchi, 1985; Kikuchi et al., 1995), which is essential for the maintenance of the ionic composition of the endolymph and the endocochlear potential in the cochlea (for review, see Wangemann, 2002a,b). In addition, gap junctions might be involved in intercellular signaling within the inner ear, because they have been shown to propagate calcium waves within the organ of Corti by mediating the intercellular diffusion of inositol 1,4,5-trisphosphate (IP3) (Beltramello et al., 2005; Zhang et al., 2005).
The avian inner ear is a valuable model to study not only the properties of gap junctions that are fundamental to auditory and vestibular function but also the role of gap junctions during hair cell regeneration. Unlike mammals, birds are able to produce new hair cells throughout their adult lives in both the auditory and vestibular sensory epithelia to replace any lost sensory cells (for review, see Cotanche, 1999; Bermingham-McDonogh and Rubel, 2003). However, little is known about the molecular and functional properties of gap junctional communication (GJC) in the avian inner ear. To date, the only connexin isoform that has been identified in the avian inner ear is the ortholog to mammalian Cx30 (cCx31) (Heller et al., 1998). In this study, we screened the avian inner ear for additional connexin isoforms using degenerate reverse transcription (RT)-PCR and examined their expression pattern in the auditory and vestibular endorgans by in situ hybridization and immunohistochemistry. Functional GJC was examined by fluorescence recovery after photobleaching (FRAP) in organotypic cultures of basilar papilla and utricular macula.
Materials and Methods
Animals.
Fertilized eggs of white leghorn chickens (Gallus domesticus) were obtained from a national supplier (Henry Stewart & Company, Lincolnshire, UK) and incubated at 37.4°C in a humidified, rotating incubator (Octagon 20; Brinsea, Sandford, UK) for 21 d. All data were collected from prehatch chicks at embryonic day 21.
Screening of inner ear connexins by degenerate RT-PCR.
Total RNA was isolated from cochlear ducts and utricles using the RNeasy Mini kit (Qiagen, Crawley, UK) according to the recommendations of the manufacturer. First-strand cDNA was synthesized from 2 μg of template RNA using the Omniscript RT kit (Qiagen) with oligo-dT primers (Roche Diagnostics, Lewes, UK). Degenerate primers corresponding to conserved regions of the first (forward: 5′-TGCAAYACBHWDCA-RCCKGG-3′) and second (reverse: 5′-CGDGAVABRAARCARTCYAC-3′) extracellular loop of selected chicken connexins were used to amplify cDNA fragments containing the second and third transmembrane domains and the cytoplasmic loop of variable length. PCR was performed using the Taq PCR Core kit (Qiagen) under the following conditions: initial denaturation at 94°C for 3 min followed by 35 cycles of denaturation at 94°C for 60 s, annealing at 50°C for 90 s and extension at 72°C for 90 s, and final extension for 10 min at 72°C. PCR products were separated on a 1.3% agarose gel, purified using the Quiaquick PCR Purification kit (Qiagen), and subcloned into the pGEM-T Easy vector (Promega, Southampton, UK). Clones were screened using RT-PCR with nested primers specific to cCx30 and cCx43 to eliminate colonies containing known inner ear connexins. The remaining clones were sequenced (Geneservice, Cambridge, UK).
Multiple-tissue RT-PCR.
To analyze the expression of inner ear connexins in different tissues, total RNA was isolated from cochlear ducts, utricles, eye, skin, brain, heart, and liver and reverse transcribed as described above. PCR was performed using the Taq PCR Core kit (Qiagen) at 94°C for 3 min followed by 35 cycles of 94°C for 60 s, 68°C for 90 s, and 72°C for 90 s and final extension for 10 min at 72°C. Specific primers for the following connexins were used to amplify their coding sequences: cCx30 (forward: 5′-ACAATGGATTGGGGAGCTCTG-3′; reverse: 5′-ACACCACCTTAGCTACTTGTGAATCC-3′), cCx26 (forward: 5′-AA-GATGGATTGGGGAACTCTGCA-3′; reverse: 5′-CGAAACAATCC-ACGACATTGG-3′), cCx43 (forward: 5′-AAGATGGGTGATTGGAGTGCC-3′; reverse: 5′-TTATTAGATCTCCAGGTCATCAGGTCG-3′). Glyceraldehyde-3-phosphate dehydrogenase (GAPDH) (forward: 5′-TGGTGACAGCCATTCCTCCA-3′; reverse: 5′-CTGAGCGGTGGTG-AAGAGCA-3′) served as a positive control, whereas the cDNA template was omitted in negative controls. Amplification products were separated on 1.3% agarose gels and visualized by ethidium bromide staining.
Preparation of RNA probes.
Purified PCR products of cCx30 (800 bp) and cCx26 (504 bp) were subcloned into pGEM-T Easy vectors (Promega). The plasmid DNA was purified using Midi plasmid kit (Qiagen), linearized with either NdeI or NcoI restriction enzymes (New England Biolabs, Hitchin, UK) and subsequently purified by phenol-chloroform extraction and ethanol precipitation. Digoxigenin (DIG)-labeled sense and antisense RNA probes were synthesized from 1 μg of linearized plasmid DNA using the DIG RNA Labeling Mix (Roche Diagnostics) according to the recommendations of the manufacturer. To obtain RNA probes of ∼300 bp length, the probes were hydrolyzed in carbonate buffer, pH 10.2, at 60°C for 15–20 min, followed by ethanol precipitation.
In situ hybridization.
Cochlear ducts and utricles were fixed for 2 h in 4% paraformaldehyde (PFA), cryoprotected overnight in a 30% sucrose/PBS solution and embedded the following day in a 1% low-temperature gelling agarose (type VII)/18% sucrose/PBS solution (all from Sigma-Aldrich, Poole, UK). Agarose blocks containing basilar papillae and utricular maculae were frozen with Cryospray (Bright Instrument, Huntingdon, UK) onto cryostat holders and 20 μm serial sections were cut at −25°C on a cryostat (CM1900; Leica, Milton Keynes, UK). The sections were mounted on polylysine-coated slides (VWR International, Lutterworth, UK), dried at 37°C for 30 min, and stored at −80°C until use.
To improve the accessibility of the target RNA, the sections were digested in1 μg/ml proteinase K for 5 min at 37°C. After a 20 min fixation in 4% PFA, the slides were incubated in 0.1 m triethanolamine buffer containing 0.25% acetic anhydride for 10 min to prevent nonspecific binding of the probe to positively charged amino groups. For hybridization, the sections were incubated overnight under coverslips in 50 μl of denatured RNA probe mixture diluted 1:100 in hybridization buffer [50% formamide, 10% dextran sulfate, 5× saline-sodium citrate (SSC), and 5 mm EDTA, 1 μg/ml yeast tRNA, 1× Denhardt’s solution (all from Sigma-Aldrich)] at 65°C in a humidified chamber. The coverslips were removed in 2× SSC, and the slides were washed twice for 30 min in 1× SSC containing 20% formamide and 0.1% Tween 20 (Sigma-Aldrich) at 65°C. Thereafter, the slides were washed two times for 10 min in 0.2× SSC and for 10 min in Tris-buffered saline (TBS) at room temperature.
For the colorimetric detection of the hybridized probes, the sections were blocked with 10% goat serum/TBS for 1 h at room temperature and incubated with an anti-DIG antibody conjugated to alkaline phosphatase (Roche Diagnostics) diluted 1:500 in TBS containing 0.1% goat serum (Sigma-Aldrich). Then, samples were rinsed three times in TBS and stained in a nitro blue tetrazolium and 5-bromo-4-chloro-3-indolyl phosphate solution (Roche Diagnostics) at room temperature for up to 3 h. To stop the reaction, the slides were rinsed in Tris-EDTA buffer. The samples were examined by differential interference contrast microscopy on an upright microscope (Axioplan 2 imaging; Zeiss, Welwyn Garden City, UK).
Antibodies.
For the immunodetection of cCx30, a polyclonal antibody was raised against a synthetic peptide corresponding to an amino acid sequence of the cytoplasmic loop of cCx30 (amino acids 102–112) (Sigma-Genosys, Haverhill, UK). In addition, a monoclonal antibody specific to a peptide sequence derived from the C terminus of mouse Cx30 (33-2500; Zymed, San Francisco, CA) was used to detect cCx30. Protein expression of cCx43 was examined using a monoclonal antibody (Gap 1A) that was generated against an amino acid peptide sequence from the cytoplasmic loop of mouse Cx43 (amino acids 131–142) and a polyclonal antibody that recognized an amino acid sequence (amino acids 363–382) at the C terminus of rat Cx43 (C26219; Sigma-Aldrich).
Western blotting.
Cochlear ducts, utricles, and brains were dissected in PBS and frozen in liquid nitrogen until additional use. The samples (∼0.1 mg/μl) were homogenized in 2× modified radioimmunoprecipitation buffer [2% Triton X-100 (TX-100), 2% sodium deoxycholate, 0.2% SDS, 316 mm sodium chloride, 20 mm Tris, pH 7.3, 2 mm EGTA, 2 mm phenylmethylsulfonyl fluoride (PMSF), 2 μg/ml aprotinin, and 2 μg/ml leupeptin (all from Sigma-Aldrich)], sonicated, and centrifuged at 10,000 × g for 5 min. The total protein concentration of the homogenates was determined using the BCA Protein assay kit (Perbio Science, Cramlington, UK) with bovine serum albumin (BSA) as the standard. Ten micrograms per lane of denatured proteins diluted in 2× Laemmli sample buffer (4% SDS, 200 mm dithiothreitol, 18 mm Tris, pH 6.8, 0.02% bromophenol blue, and 20% glycerol) were resolved by SDS-PAGE on 12% (cCx43) or 15% (cCx30) gels and run at 150 V for 1.5 h. The protein bands were transferred to a polyvinylidene fluoride membrane (Immobilon; Millipore, Watford, UK) in transfer buffer (0.04% SDS, 48 mm Tris, 39 mm glycine, and 20% v/v methanol) for 3 h at 100 V.
The methanol-wetted membranes were incubated for 1 h in PBS containing 5% skimmed milk powder and 0.1% Tween 20 at room temperature, followed by their incubation in primary antibodies diluted in the blocking solution for 1 h. The optimal concentration of the primary antisera was determined empirically as 1:1000 for anti-cCx30, 1:500 for Gap 1A and 33-2500 (Zymed), and 1:5000 for C6129 (Sigma-Aldrich). Before incubation in the secondary antibodies, the membranes were washed in PBS/Tween five times for 30 min. The membranes were then incubated for 1 h in PBS/Tween containing horseradish peroxidase (HRP)-conjugated anti-rabbit IgG (1:20,000; Chemicon, Chandlers Ford, UK) or anti-mouse IgG (1:20,000; Chemicon). After five washes in PBS/Tween, the HRP-labeled antigens were detected using the Immobilon HRP Western blot Detection System (Millipore).
Immunohistochemistry.
Cochlear ducts and utricles were dissected in PBS and immediately fixed in 4% PFA for 30 min. The tissues were cryoprotected and embedded in agarose/sucrose solution as outlined above. Frozen agarose blocks containing basilar papillae and utricular maculae were cut at −25°C on a cryostat. Serial sections of 15 μm thickness were collected on polylysine-coated slides, dried at 37°C for 30 min, and stored at −20°C until use.
The tissues were incubated for 1 h in PBS containing 10% goat serum and 0.2% TX-100 to block nonspecific sites and permeabilize the tissue. The epithelia were then incubated simultaneously for 2 h at room temperature in rabbit anti-cCx30 (1:500) and mouse anti-Cx43 (1:200; Gap1A) or rabbit anti-rCx43 (1:500; C26219) and mouse anti-mCx30 (1:400; 33-2500) antibodies diluted in PBS containing 100 mm l-lysine (Sigma-Aldrich) and 0.2% TX-100. After a 30 min wash with five changes of PBS, the epithelia were incubated in the dark for 1 h in Alexa Fluor 633-conjugated goat anti-rabbit IgG (1:200; Invitrogen, Paisley, UK), fluorescein isothiocyanate-conjugated goat anti-mouse-IgG (1:200; Pierce, Rockford, IL), and tetramethylrhodamine isothiocyanate (TRITC)-conjugated phalloidin (1:500; Invitrogen) in PBS/Lys/TX-100. After five washes in PBS, the tissues were mounted in Vectashield antifade medium (Vector Laboratories, Peterborough, UK). The samples were examined by confocal laser microscopy (Leica TCS SP2) using 20× [numerical aperture (NA), 0.7], 40× (NA, 1.25), or 63× (NA, 1.32) apochromatic objectives. Z-series of the tissues were taken at 1 μm intervals using triple-channel scanning and were transformed into projections of maximum pixel intensity.
Organotypic cultures.
Basilar papillae and utricles were dissected in cooled Medium 199 with HBSS and 25 mm HEPES (Invitrogen), and the otoconial membrane of the utricular macula and the tegmentum vasculosum overlying the basilar papilla were removed. The explants were placed on membrane inserts (Millicell-PCF; Millipore) and incubated in Medium 199 with Earle’s Salt, 25 mm HEPES, 26 mm sodium bicarbonate, 0.69 mm l-glutamine, and 10% horse serum (Invitrogen) in a 5% CO2 atmosphere at 37°C.
FRAP.
After 24 h in culture, the epithelia were loaded for 20 min with 1–2 μm calcein AM (Invitrogen) diluted in Medium 199 with Hanks’ salt solution. After loading, the cell culture dishes were washed several times with HBSS (Sigma-Aldrich) to remove the AM and prevent additional loading during the measurements. Measurements were taken within the next 2–3 h on a confocal laser-scanning microscope (Leica TCS SP2). The tissues, attached to the membrane inserts, were maintained in Medium 199 with HBSS with 25 mm HEPES at 35 ± 2°C. The monitoring of cell viability was intrinsic to the experiment, with the use of calcein AM, a marker for live cells, as fluorescent tracer. Additionally, 3 μm propidium iodide (Invitrogen), commonly used for identifying dead cells, was present in the medium.
A 63× water-immersion apochromatic objective lens (NA, 0.9) of an upright epifluorescence microscope was used to focus just below the lumenal surface of the epithelium. Optical sections were scanned in xyt mode at 1.6 s/frame. A 48 × 48 μm square was bleached at maximum laser power for 32 s. Preliminary experiments showed that successive bleaching of the epithelia did not disrupt the recovery of calcein, indicating that photobleaching did not interfere with cell coupling. An area of 119 × 119 μm was recorded for the prebleach and postbleach scans at low laser power to minimize bleaching, and fluorescence recovery was monitored for 5–10 min at intervals of 1.6 s.
Pharmacological blocking of gap junctions.
To corroborate that the dye transfer between cells was mediated through gap junctions, the explants were incubated in medium containing 100 μm of the gap junction blocker carbenoxolone (CBX; Sigma-Aldrich) for 30 min before FRAP measurements. Its inactive analog glycyrrhizic acid (GZA; Sigma-Aldrich) served as control.
Data analysis.
The fluorescence intensity of calcein before and after photobleaching in selected regions of interest (ROIs) within hair and supporting cells was expressed in 8-bit gray-level units as a function of time using LCS Lite 2.0 (Leica). ROIs in the unbleached area served as a control for an overall decrease in fluorescence attributable to successive scanning and/or leakage of calcein to the medium. The relative fluorescence recovery at time t was displayed as the percentage of prebleach levels:
where Ipre, I0, and It were the measured fluorescence intensities of the ROI before (prebleach), at the first postbleach scan, and at the time t after the first scan, respectively (Stein et al., 1992, 1993). Icontrol was measured in unbleached supporting cells and the fluorescence recovery was corrected for the overall bleaching (Ipre − Icontrol) attributable to successive scanning.
The mean percentage recovery of nine ROIs within supporting cells within a bleached area was sampled from different specimens to calculate the average fluorescence recovery for the distal and the proximal regions of the basilar papilla and the extrastriolar utricular macula. These fluorescence recovery curves were best fitted with either a biexponential (Eq. 2) or a monoexponential (Eq. 3) function using GraphPad Prism 4 (GraphPad Software, San Diego, CA):
where Imax is the fluorescence intensity at its estimated diffusion equilibrium, expressed as a percentage of the prebleach level, and k is the rate constant of the fluorescence recovery.
Directionality of dye spread was quantified by calculating the first derivative of the raw individual recovery curves for each ROI plot using the Savitzky–Golay smoothing method (five points). A grid of six ROIs was laid over the bleached area, with each ROI (10 × 43 μm) containing ∼7600 pixels. The first derivatives were sampled according to their location within the basilar papilla, i.e., closer to the abneural/neural edge or distal/proximal ends. In the utricular macula, the striola and anterior/posterior part of the epithelium were used as reference points. The recovery rates at t0 were expressed for each ROI as mean ± SD. Differences between the ROIs within a group were tested for statistical significance using the paired Student’s t test (GraphPad Prism 4).
Results
Connexin isoforms in the avian inner ear
Auditory and vestibular endorgans were screened for connexin isoforms using RT-PCR with degenerate primers corresponding to highly conserved regions in the extracellular loops. Amplification of connexin cDNA fragments containing the cytoplasmic domain of variable length yielded one band with a size of ∼390 bp for both the cochlear duct and the utricle (data not shown). The RT-PCR products were purified and subcloned in plasmid vectors. Fifty colonies of each organ type were screened for cCx31 (Heller et al., 1998) and cCx43 (Beyer, 1990; Forge et al., 2002) using RT-PCR with nested primers to eliminate known inner ear connexins. Eight remaining clones were sequenced, of which six significantly matched the sequences of a Cx26-like mRNA in the zebra finch Taeniopygia guttata (GenBank accession number DQ215527) and of a recently identified chicken connexin that was predicted to be similar to cCx31 (GenBank accession number XM_425641).
As submitted to the National Center for Biotechnology Information (Bethesda, MD), XM_425641 was predicted to translate a connexin protein with a molecular weight of 62.6 kDa. However, our examination of the genomic sequence of the predicted transcript on contig 4.434 at location 29,022–40,332 revealed an open reading frame of 675 bp. This observation is supported by the fact that, although a primer pair designed to amplify the first 504 bp after the start codon yielded a cDNA fragment of the predicted size, two primer pairs designed to amplify cDNA fragments between 862–1090 bp and 1379–1557 bp amplified genomic DNA but not reverse-transcribed cDNA (data not shown). Based on the RT-PCR results and alignment of the predicted chicken and the zebra finch mRNA sequences, and the genomic DNA sequence, we predict the gene to encode a connexin protein with a molecular weight of 26 kDa. The newly identified inner ear connexin is likely to be the avian ortholog of the mammalian Cx26 (β2), because sequence alignment with mouse Cx26 and human Cx26 showed a 70 and 73% homology, respectively (Fig. 1).
Figure 1.

Avian Cx26 is the ortholog to mammalian Cx26. Alignment of chicken connexin 26 (cCx26) and mouse connexin 26 (mCx26) sequences using the CLUSTAL algorithm revealed a 75% amino acid identity. cCx26 and mCx30 have an overall homology of 71%; however, length and sequence motifs of the C-terminal identify cCx30 as the ortholog of mammalian Cx30.
In accordance with the predominant nomenclature, cCx31 was originally designated according to its predicted molecular weight (Heller et al., 1998). However, this nomenclature does not take any phylogenetic homologies into consideration. This raises problems for the designation of connexin isoforms in nonmammalian species. Given that the protein sequence of cCx31 displays a 71% amino acid identity with murine Cx30 (β6) but only 46% with mCx31 (β3), we propose the reclassification of cCx31 to cCx30, to avoid association with mammalian Cx31.
Differential connexin expression in avian inner ear tissues
The expression of inner ear connexin transcripts was analyzed for different tissues by RT-PCR with specific primer sets (Fig. 2a). In agreement with Heller et. al. (1998), cCx30 mRNA was detected exclusively in inner ear tissue. Transcripts of cCx26 were amplified in cochlear duct, utricle, brain, and liver but not in eye, skin, and heart. Expression of cCx43 was detected in several tissues, and the signal intensity appeared to be strongest in cochlear duct, eye, skin, brain, and liver and lower in utricle and heart. No amplification was observed in control reactions in which the reverse transcriptase was omitted (data not shown).
Figure 2.

a, RT-PCR analysis of the expression of inner ear connexin transcripts in chick tissues. Transcripts of cCx30 were only detected in the inner ear. cCx26 was amplified in the cochlear duct (Bp), utricle (Ut), brain (Br), and liver (Li). Transcripts of cCx43 were detected in cochlear duct, eye (Ey), skin (Sk), brain, and liver, and weakly in utricle and heart (He). GAPDH served as positive control. b, Western blot analysis of antibodies to cCx30 and cCx43. Homogenates of cochlear ducts and utricles were resolved on 12 or 15% acrylamide gels and probed with rabbit anti-cCx30, mouse anti-mCx30 (33-2500; Zymed), mouse anti-mCx43 (Gap 1A), and rabbit anti-rCx43 (C26219; Sigma-Aldrich) antibodies. Brain homogenates served as control.
The cellular expression of connexins in the avian cochlear duct and utricle was analyzed by immunohistochemistry and, in the absence of an antibody specific to cCx26, by in situ hybridization. Western blot analysis of homogenates of chick cochlear ducts and utricles confirmed the specificity of the antibodies used (Fig. 2b). Rabbit anti-cCx30 and mouse anti-mCx30 (33-2500; Zymed) antibodies both recognized a protein of a molecular weight of 31 kDa in the cochlear duct and utricle, which corresponds to the predicted molecular weight of cCx30. Consistent with the RT-PCR results, no bands were detected in the chick brain. Monoclonal (Gap 1A) and polyclonal (C26219; Sigma-Aldrich) antibodies to mammalian Cx43 recognized three bands between 42 and 44 kDa in the cochlear duct, utricle, and brain. The comparison of the migration pattern with that of chicken lens (Musil et al., 1990) and pineal gland homogenates (Berthoud et al., 2000) revealed that the two main bands migrated similarly as the phosphorylated forms P1 (∼43 kDa) and P2 (∼44 kDa). The nonphosphorylated form of cCx43 (∼42 kDa) appeared to be weakly expressed in the chick inner ear.
To allow the direct comparison of cCx30 and cCx26 expression patterns, in situ hybridization with DIG-labeled antisense probes was performed for both isoforms. No labeling was observed using the corresponding sense probes (data not shown). Transcripts of cCx30 were abundantly expressed in both cochlear duct and utricle (Fig. 3a). In the cochlear duct, cCx30 mRNA was present in the supporting and border cells of the sensory epithelium, in the clear cells along the neural edge, and in the cuboidal and hyaline cells along the abneural edge of the basilar papilla, in the homogene cells of the lateral wall, and in the tegmentum vasculosum. No mRNA was detected in hair cells. In the utricle, cCx30 mRNA was present in the supporting cells of the sensory epithelium. Notably, cCx30 transcripts were highly labeled in the striolar region (Fig. 3b).
Figure 3.
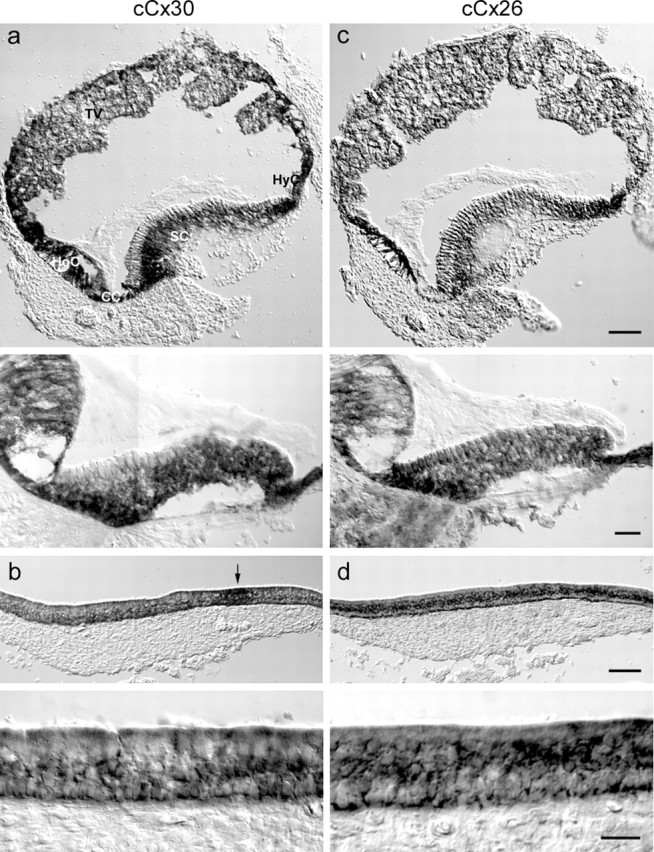
Coexpression of cCx30 and cCx26 in the avian inner ear. a, c, In the cochlear duct, cCx30 (a) and cCx26 (c) transcripts were both present in supporting cells (SC), clear cells (CC), hyaline cells (HyC), homogene cells (HoC), and in the tegmentum vasculosum (TV). Scale bar, 100 μm. Higher magnification of transverse sections of the mid-basilar papilla showed weak expression of cCx26 mRNA in tall hair cells. No cCx30 mRNA was detected in hair cells. Scale bar, 20 μm. b, d, In the utricle, cCx30 (b) and cCx26 (d) transcripts were present in supporting cells. The arrow marks a concentration of cCx30 mRNA in the striolar region.
Transcripts of cCx26 showed an expression pattern similar to that of cCx30 (Fig. 3c). In the cochlear duct, cCx26 mRNA was present in the supporting cells and border cells of the sensory epithelium, in the clear cells, cuboidal cells, hyaline cells and homogene cells, in the tegmentum vasculosum, and the spiral ganglion. Strong mRNA labeling was observed in supporting cells at the neural edge and hyaline cells. Low mRNA levels were detected in hair cells, particularly in the tall hair cells lining the neural edge. In the utricle, cCx26 mRNA was expressed in the supporting cells of the sensory epithelium (Fig. 3d). Unlike cCx30, no concentration of cCx26 transcripts was observed in the striola.
The protein distribution of cCx30 was consistent with its mRNA expression pattern (Fig. 4a). In the cochlear duct, immunoreactive punctae were visible in supporting cells, homogene cells, clear cells, hyaline cells, and cuboidal cells, as well as in the tegmentum vasculosum. In the basilar papilla, cCx30-positive gap junctions showed a distinct distribution pattern, with relatively small punctate plaques at the lumenal surface and large sheet-like plaques at the basal surface near the basilar membrane (Fig. 5). In addition, the size and density of cCx30 plaques gradually increased from distal to proximal (Figs. 4c, 5). In the utricle, immunostaining was present among supporting cells and transitional cells but not in the dark cell region (Fig. 4b). Within supporting cells, cCx30-positive plaques were concentrated at the lumenal and basal ends of the cells. The immunoreactive sites were linear and closely mirrored the hexagonal shape of supporting cell somata, especially near the basement membrane (Figs. 4e, 5). In agreement with its mRNA expression pattern, cCx30-positive gap junctions were concentrated in the striola region.
Figure 4.
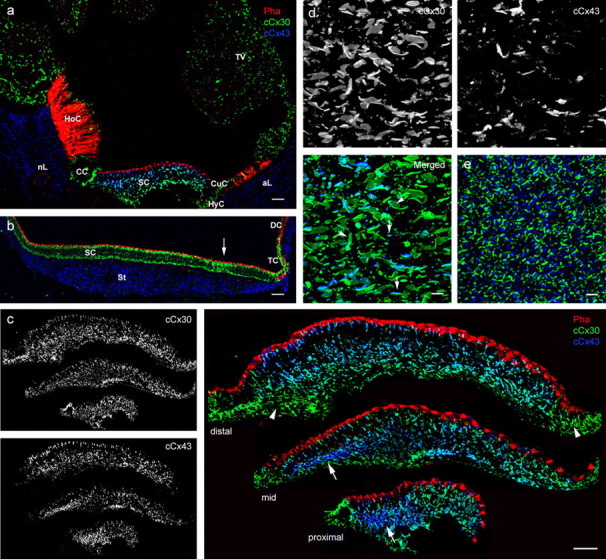
Expression of cCx30 and cCx43 in the avian inner ear. Double labeling of transverse sections of the cochlear duct and utricle with a polyclonal antibody to cCx30 and a monoclonal antibody to mCx43 (Gap 1A) (a, b) or a polyclonal antibody to rCx43 (C6129) and a monoclonal antibody to mCx30 (33-2500) (c–e). F-actin was detected by TRITC-conjugated phalloidin (Pha). a, In the cochlear duct, cCx30 immunostaining was present in supporting cells (SC), hyaline cells (HyC), and cuboidal cells (CuC), as well as in the tegmentum vasculosum (TV), homogene cells (HoC), and clear cells (CC). Immunofluorescence for Cx43 was confined to SCs of the basilar papilla and to the abneural limbus (aL) and neural limbus (nL). Scale bar, 50 μm. b, In the utricle, cCx30 immunostaining was present in SC and the transitional cells (TC) but not in the dark cells (DC). Cx43-positive gap junctions were confined to the stroma (St). Scale bar, 50 μm. c, Higher magnification of transverse sections of the distal (top), middle (mid) and proximal (bottom) regions of the basilar papilla. Turquoise immunofluorescence is attributable to the colocalization of Cx43 and Cx30 antibodies within gap junction plaques. Cx43-positive gap junctions were concentrated beneath the basal surfaces of tall hair cells (arrow) but were absent at the distal neural edge. Arrowheads indicate cCx30-only gap junctions at the neural edge. Scale bar, 20 μm. d, Projection view of gap junctions in a wholemount basilar papilla. Double labeling for cCx43 (blue) and cCx30 (green) resulted in the overlap of immunofluorescence. Arrows indicate possible heterotypic junctions; arrowheads mark segregated cCx43 domains within cCx30 gap junctions. Scale bar, 5 μm. e, Projection view of gap junctions in a wholemount utricular macula. Linear cCx30 gap junctions mirror the hexagonal SC arrangement. Diffuse Cx43 immunostaining was observed in SC cytoplasm. Scale bar, 5 μm.
Figure 5.
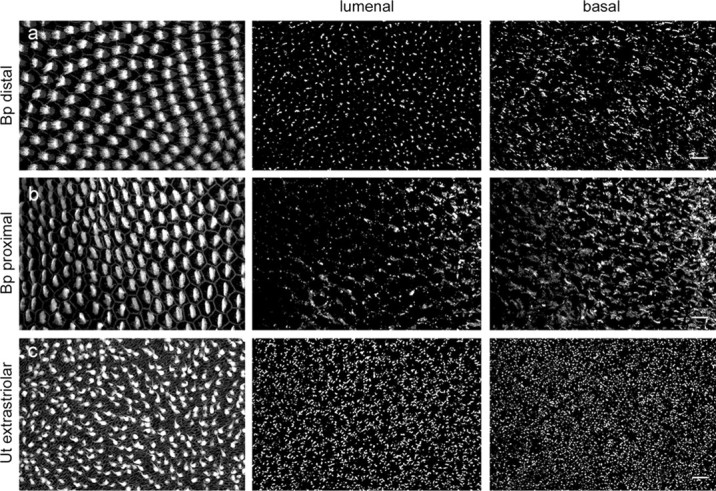
Gap junction distribution in the auditory and vestibular sensory epithelium. Contrasting projection views of immunofluorescent cCx30 gap junction plaques in the lumenal (middle) and basal (right) ends of supporting cells of the distal (a) and the proximal (b) regions of the basilar papilla (Bp), and the extrastriolar region (c) of the utricular macula (Ut). The left panel shows the respective surface views of phalloidin-labeled hair cells. Scale bar, 10 μm.
In contrast to the ubiquitous cCx30 labeling, cCx43 immunoreactivity in the cochlear duct was confined to the supporting cells of the basilar papilla and the neural and abneural limbus (Fig. 4a). As for cCx30, the size and the density of cCx43-positive gap junction plaques gradually increased in the basilar papilla from distal to proximal. Immunoreactive sites were concentrated below the basal surfaces of tall hair cells overlying the neural limbus (Fig. 4c). In the utricle, no cCx43 labeling was detected at membrane sites between supporting cells, but immunoreactive punctate were detected in the connective tissue underlying the sensory epithelium (Fig. 4b). However, it should be noted that diffuse staining in the cytoplasm of supporting cells was observed (Fig. 4e) when using the rabbit anti-rat Cx43 antibody (Sigma-Aldrich).
Double labeling of gap junctions with Cx30 and Cx43 antibodies revealed the presence of different gap junction classes in supporting cells of the basilar papilla (Fig. 4c,d). Plaques that were immunoreactive for only cCx30 were observed predominately at the neural edge and at the basal ends of supporting cells, whereas gap junctions labeled with only cCx43 were concentrated below the tall hair cells. In addition, cCx43 immunofluorescence colocalized with that of cCx30 throughout the basilar papilla, in which it appeared to be mainly segregated into discrete punctae within cCx30 plaques or concentrated on one side of the plaque (Fig. 4d).
FRAP in the intact inner ear
To examine GJC in the intact inner ear tissue, we adapted FRAP to visualize intercellular dye spread in organotypic cultures of the basilar papilla and utricular macula. In this technique, a gap junction-permeant fluorescent tracer is introduced at uniform concentrations into cells, and a concentration gradient is created by irreversibly photobleaching the fluorochrome in selected cells. If the bleached cells are connected with adjacent nonbleached cells via gap junctions, the tracer diffuses into the bleached cells, and the fluorescence recovers (Wade et al., 1986; Deleze et al., 2001).
The membrane-permeant AM ester derivative of calcein was used to introduce a fluorescent tracer into hair cells and supporting cells. Inside live cells, the lipophilic blocking groups are cleaved by nonspecific cytoplasmic esterases, releasing the membrane-impermeant fluorochrome calcein (623 Da, −4), which has been shown previously to pass through gap junctions (Goldberg et al., 1999). Differences in the uptake, in the hydrolysis of calcein AM and/or in the cytoplasmic Ca2+ concentrations between hair and supporting cells, led to a distinct pattern of brightly fluorescent hair cells surrounded by more weakly fluorescent supporting cells. Excitation with a single photon laser line caused a double cone-shaped bleaching pattern, resulting in the loss of fluorescence throughout the depth of tissue (25–35 μm) (Fig. 6a). The bleaching at maximum power with the 488 nm laser line of an argon laser for 31 s resulted in a decrease of fluorescence by 88 ± 5% (n = 15) in the supporting cells of the basilar papilla and 92 ± 3% (n = 9) in those of the utricular macula. The absence of propidium iodide within the bleached cells indicated that bleaching had no detectable cytotoxic effects on the cells (data not shown). The diffusion of unbleached calcein molecules into bleached cells was monitored in the lumenal region of the sensory epithelium, which allowed the simultaneous assessment of dye coupling in hair cells and supporting cells (Fig. 6b). Five minutes after bleaching, fluorescence had recovered to equilibrium in supporting cells of the basilar papilla (Fig. 6c) and utricular macula (Fig. 6d), but no recovery was observed in hair cells.
Figure 6.

FRAP in the auditory and vestibular sensory epithelium. a, Z-projection of the bleached area in a CBX-treated utricular macula. b, Perpendicular reconstruction of a Z-series through the basilar papilla taken before and 5 min after bleaching. The horizontal line indicates the area monitored by FRAP. Scale bar, 20 μm. Sequence of optical sections in the basilar papilla (c) and the utricular macula (d) taken before (prebleach) and immediately after bleaching (t = 0) and when the diffusion equilibrium of calcein is approached (t = 5 min). Fluorescence recovers only in supporting cells but not in hair cells (*). Scale bar, 20 μm.
To test whether calcein returned via gap junctions, FRAP experiments were conducted in the presence of the gap junction blocker CBX. The incubation of the explants in 100 μm CBX for 30 min before bleaching resulted in an 85–95% (n = 5) decrease of fluorescence recovery within supporting cells compared with the maximal recovery in cultures treated with the inactive analog GZA (Fig. 7a).
Figure 7.

Gap junctional communication between supporting cells. a, Blocking of dye transfer by CBX. FRAP in utricular macula explants incubated 30 min before bleaching in 100 μm GZA or CBX. Quantification of fluorescence recovery in supporting cells (ROI 3, 4) and hair cells (ROI 2, 5) within the bleached area revealed that no dye returned into supporting cells of CBX-treated supporting cells in the absence of overall bleaching (ROI 1). b, Fluorescence recovery curves of supporting cells. The mean percentage of the recovery of fluorescence intensity compared with prebleach levels within bleached supporting cells in the distal (n = 8) and proximal (n = 8) ends of the basilar papilla (BP) and the extrastriolar utricular macula (UT) (n = 5) is plotted as a function of time. The solid lines represent the fit to Equation 2, the dashed line to Equation 3. The dotted lines mark the mean SD of the recovery curves.
The permeability of gap junctions for calcein was quantified by estimating the rate constant k and the percentage of maximal fluorescence recovery in the supporting cells of the distal and proximal basilar papilla and the extrastriolar utricular macula. The best fit for the mean recovery curves was monoexponential for the utricular macula but biexponential for the basilar papilla (Fig. 7b). The fluorescence intensity in the supporting cells at its estimated equilibrium reached between 39 and 57% of its prebleach levels. In the utricular macula, the estimated rate constant k for calcein diffusion was 0.007 s−1, which resulted in a halftime of 106 s. In the basilar papilla, two components underlie the fluorescence recovery of calcein. During the first 20 s, diffusion followed a fast rate constant (distal, 0.07 s−1; proximal, 0.04 s−1) that was ∼10 times faster than the slow component. The slow rate constants were 0.005 s−1 in the distal half and 0.004 s−1 in the proximal half, which resulted in halftimes of 127 and 160 s, respectively.
Asymmetric GJC in the auditory sensory epithelium
In the utricular macula, calcein returned uniformly from all sides to the bleached area (Fig. 8a and supplemental movie, available at www.jneurosci.org as supplemental material), but in the basilar papilla, fluorescence recovered predominately from the abneural side of the square to the neural side (Fig. 8b and supplemental movie, available at www.jneurosci.org as supplemental material). This asymmetric dye transfer was not caused by scanning artifacts, because the rotation of the specimen by 90° altered the point of entry of the dye by the same angle (data not shown).
Figure 8.
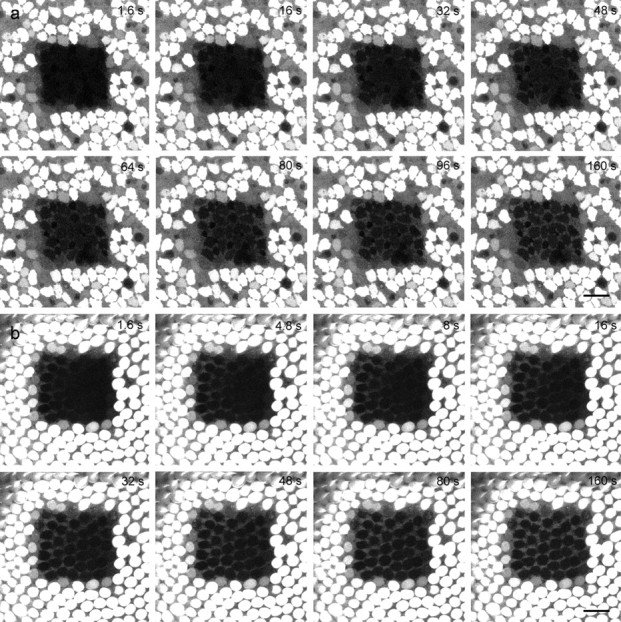
Asymmetric dye transfer in the basilar papilla. Still images at certain time points during FRAP in the utricle (a) and basilar papilla (b). Calcein returned uniformly from all sides, while it returned predominately from the abneural edge (left) in the basilar papilla. Scale bar, 20 μm.
To validate the asymmetric dye transfer in the basilar papilla, the change of fluorescence intensity immediately after photobleaching (dI/dt0) was calculated for six regions (Fig. 9). There were significant differences in the recovery rates between the abneural and neural edges of the bleached square in the distal (p < 0.001) and proximal (p < 0.05) basilar papilla, in that the initial increase in fluorescence intensity was highest at the abneural side. In contrast, no significant differences in the recovery rates were measured for the proximal/distal direction in the basilar papilla or the striolar/extrastriolar or the anterior/posterior direction within the utricular macula.
Figure 9.
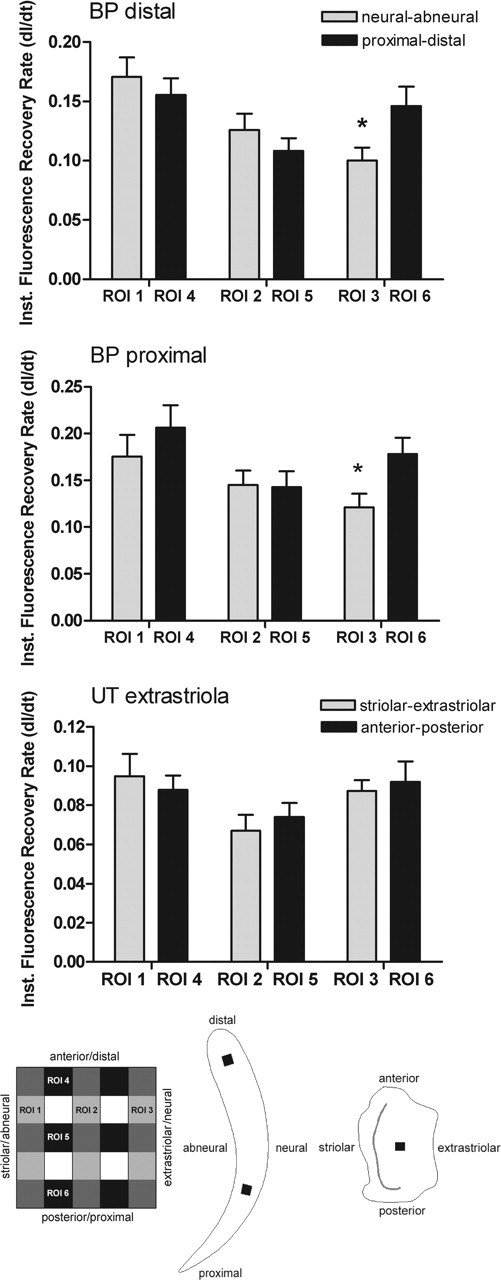
Quantification of the spatial patterns of fluorescence recovery. The mean derivatives (±SD) of the instantaneous fluorescence recovery rates within an optical section are plotted for six ROIs covering the bleached area in the distal basilar papilla (n = 11), the proximal basilar papilla (BP; n = 11), and the extrastriolar utricular macula (UT; n = 9). The asterisk indicates significant differences in the fluorescence recovery rates between the abneural (ROI 1) and neural (ROI 3) regions within the basilar papilla (paired Student’s t test; p < 0.05). The schematic illustrations indicate the orientation of the ROIs within the bleached square, and the locations of the bleached areas (black squares) within the basilar papilla and utricular macula. The gray strip in the utricle marks the striola.
Discussion
In this study, we identified chicken orthologs to the mammalian Cx30, Cx26, and Cx43 as major connexin isoforms in the avian inner ear. Analogous to the mammalian inner ear (Kikuchi et al., 1994, 1995; Forge et al., 2003b), cCx26 and cCx30 transcripts were widely expressed in gap junctions of the sensory and ion-transporting epithelia of the cochlear duct and utricle. Furthermore, their overlapping mRNA expression pattern suggests a colocalization in inner ear gap junctions similar to that found in the mammalian inner ear (Ahmad et al., 2003; Forge et al., 2003b; Sun et al., 2005). Given that cCx30 is specific to the inner ear (Heller et al., 1998), these results support the hypothesis that inner ear gap junctions are unique in their connexin composition and that their specialized physiological properties underlie the nonsyndromic nature of deafness caused by mutations in genes encoding Cx26 and Cx30 (Forge et al., 2003a).
One hypothesis for the role of gap junctions in the mammalian inner ear is that they are involved in the potassium cycling from the sensory to the ion-transporting epithelium (Santos-Sacchi, 1985; Kikuchi et al., 1995). Electrophysiological studies suggest that avian supporting cells are also involved in the spatial buffering of K+ (Masetto and Correia, 1997), which may contribute to the maintenance of the high endolymphatic K+ concentration (140–160 mm) (Ninoyu et al., 1987; Runhaar et al., 1991; Sauer et al., 1999) and the endocochlear potential (+20 mV) (Necker, 1970; Cotanche et al., 1987) in the cochlear duct. In the cochlear duct, K+ may be conveyed through the gap junction network of the supporting cells and the bordering epithelial cells to the tegmentum vasculosum, in which it would be taken up by dark cells through Na+, K+-ATPase at their basolateral membrane folds (Schneider et al., 1987) and ejected into the endolymph. In the utricle, K+ might be transported via the epithelial gap junction network and released into the extracellular space surrounding the dark cells (Helling and Merker, 2005).
The distribution pattern of gap junctions in the avian inner ear supports the hypothesis that gap junctions are indeed involved in K+ recycling in the vertebrate inner ear. In the utricular macular, cCx30 gap junctions are concentrated in the striolar region. This may reflect different homeostatic requirements of type I hair cells, which are confined to the striola (Si et al., 2003). In the cochlear duct, the size and density of cCx30/cCx43 plaques parallels the increase of outward K+ currents from the distal to the proximal end of the basilar papilla (Pantelias et al., 2001). This gradient reflects the systematic variation in the number and kinetics of K+ channels in the basolateral membrane of hair cells that underlies their electrical tuning (for review, see Fettiplace and Fuchs, 1999). In addition, Cx43 gap junctions are concentrated just below the basal surfaces of the tall hair cells overlying the neural limbus. These tall hair cells are considered the primary sensory receptors because they receive the majority of afferent innervation (Fischer, 1992). Thus, Cx43 channels might provide an additional pathway or modify the permeabilities of cCx30/cCx26 channels required for an efficient spatial buffering of K+ in the basilar papilla.
Although cCx43 might be involved in K+ cycling, its absence in the adult mouse inner ear (Cohen-Salmon et al., 2004) and its restricted and differential expression in the avian inner ear might point to a more specialized role in inner ear function. In addition to the maintenance of tissue homeostasis, gap junctions have been implicated in the coordination of cell proliferation and differentiation (Becker and Mobbs, 1999; Coutinho et al., 2003). Furthermore, the transformation of cells is accompanied by the loss of gap junctional communication, whereas the forced expression of connexins in neoplastic cells restores normal cell growth. This led to the proposal that gap junctions have a negative influence on cell growth and that certain connexins, in particular Cx43, may act as tumor suppressors (for review, see Trosko and Ruch, 1998; Yamasaki et al., 1999). Given that the postembryonic vestibular epithelia produce hair cells continuously (Jorgensen and Mathiesen, 1988), whereas supporting cells in the basilar papilla re-enter the cell cycle and proliferate only in response to hair cell loss (Cotanche, 1987; Stone and Rubel, 2000), the absence of cCx43 in the sensory epithelium of the utricle might point to an inhibitory effect of cCx43 on supporting cell proliferation. The potential regulatory role of cCx43 in the avian inner ear is subject of additional investigations.
The variation in cCx43 expression coincided with differences in the functional properties of supporting cell coupling in the auditory and vestibular system. Functional GJC in the intact inner ear tissues was examined by FRAP, which allowed the noninvasive monitoring of dye coupling in the sensory epithelia. The coupling between supporting cells was mediated by gap junctions, because the gap junction blocker, carbenoxolone, inhibited fluorescence recovery. Taking into account that no gap junctions could be detected between supporting cells and hair cells in the avian auditory and vestibular epithelia using freeze fracture (Forge et al., 2003b), the absence of calcein transfer between hair and supporting cells points to a functional isolation of avian hair cells. Such exclusion of hair cells from the syncytium of the supporting cells, which has also been demonstrated for the organ of Corti (Santos-Sacchi and Dallos, 1983; Oesterle and Dallos, 1990; Jagger and Forge, 2006), is to be expected for the basilar papilla because each auditory hair cell relies on finely adjusted potassium currents that underlie its electrical tuning.
As expected for diffusion along a concentration gradient, the fluorescence recovery curves followed an exponential time course. However, the temporal kinetics and, most notably, the spatial kinetics of GJC differed between the auditory and vestibular sensory epithelia. The functional differences may be caused by the presence of connexin isoforms with different permeabilities for calcein and, given that the major difference between the basilar papilla and utricular macula is cCx43 expression, that cCx43 underlies the initial fast fluorescence recovery and the asymmetric dye transfer in the basilar papilla.
Asymmetric dye coupling was first demonstrated in vitro between cell pairs forming heterotypic gap junctions (Flagg-Newton and Loewenstein, 1980). Directional coupling of nonexcitable cells has been observed in situ between Müller glial cells and astrocytes in the retina (Robinson et al., 1993; Zahs and Newman, 1997) and between astrocytes and oligodendrocytes in the CNS (Robinson et al., 1993; Zahs, 1998).
Glial cells in the CNS are coupled by a complex array of heterotypic junctions (Altevogt and Paul, 2004), which are thought to underlie directional coupling (for review, see Zahs, 1998). Indeed, gap junctions comprising different connexin isoforms have been shown to have divergent properties of voltage dependence, varying in their polarity and voltage sensitivity, which can result in the asymmetric current flow in certain heterotypic combinations (Barrio et al., 1991; Verselis et al., 1994; Bukauskas et al., 2002). In addition, the analysis of the intercellular diffusion of fluorescent dyes varying in size and charge, such as the negatively charged Lucifer yellow (443 Da, −2) and the positively charged Neurobiotin (287 Da, +1), has uncovered distinct limiting pore diameters, as well as charge preferences and molecular selectivity for different gap junction compositions (Elfgang et al., 1995; Cao et al., 2002). Of direct biological significance is the dramatic selectivity of some connexin isoforms for endogenous metabolites and second messengers, such as ATP, glutamate, (Goldberg et al., 1999, 2002), IP3 (Niessen et al., 2000), and cyclic nucleotides (Bevans et al., 1998).
The precise compositions and arrangements of connexons in auditory supporting cells remain to be determined, but double immunofluorescence indicated the presence of different gap junction types in the basilar papilla. In addition to gap junctions containing either cCx30 or cCx43, we observed the colocalization of cCx43 and cCx30 in numerous gap junctions. Interestingly, cCx43 immunofluorescence appeared to be mainly concentrated on one side of the junction, which is indicative of heterotypic junctions or segregated in distinct domains within cCx30 plaques. In any case, it is intriguing how a homologous cell population would traffic and assemble connexons with different permselectivities to create directional coupling.
In support of our data, asymmetric communication pathways have also been reported in the organ of Corti. Heteromeric and possibly heterotypic Cx26/Cx30 channels are thought to underlie the asymmetric current flow observed in isolated pairs of Deiters’ cells (Zhao, 2000) and Hensen cells (Zhao and Santos-Sacchi, 2000). Moreover, differences in the distribution of these gap junction channels lead to the formation of separate medial and lateral communication compartments within the supporting cell population (Jagger and Forge, 2006).
In summary, our results provide evidence that the coexpression of Cx26/Cx30 is a common, if not unique feature of gap junctions in the vertebrate inner ear. We have identified cCx43 as a potential regulatory protein in the avian inner ear, which may modulate the functional properties of gap junctional communication and supporting cell proliferation. Furthermore, we have demonstrated a directional pathway in the basilar papilla that may underlie potassium cycling and/or intercellular signaling within the auditory epithelium.
Footnotes
This work was supported by grants from Deafness Research UK. We thank Stefano Casalotti, Jonathan Gale, and Daniel Jagger for their helpful comments on this manuscript.
References
- Ahmad S, Chen S, Sun J, Lin X (2003). Connexins 26 and 30 are co-assembled to form gap junctions in the cochlea of mice. Biochem Biophys Res Commun 307:362–368. [DOI] [PubMed] [Google Scholar]
- Altevogt BM, Paul DL (2004). Four classes of intercellular channels between glial cells in the CNS. J Neurosci 24:4313–4323. [DOI] [PMC free article] [PubMed] [Google Scholar]
- Barrio LC, Suchyna T, Bargiello T, Xu LX, Roginski RS, Bennett MV, Nicholson BJ (1991). Gap junctions formed by connexins 26 and 32 alone and in combination are differently affected by applied voltage. Proc Natl Acad Sci USA 88:8410–8414. [DOI] [PMC free article] [PubMed] [Google Scholar]
- Becker DL, Mobbs P (1999). Connexin alpha1 and cell proliferation in the developing chick retina. Exp Neurol 156:326–332. [DOI] [PubMed] [Google Scholar]
- Beltramello M, Piazza V, Bukauskas FF, Pozzan T, Mammano F (2005). Impaired permeability to Ins(1,4,5)P3 in a mutant connexin underlies recessive hereditary deafness. Nat Cell Biol 7:63–69. [DOI] [PubMed] [Google Scholar]
- Bermingham-McDonogh O, Rubel EW (2003). Hair cell regeneration: winging our way towards a sound future. Curr Opin Neurobiol 13:119–126. [DOI] [PubMed] [Google Scholar]
- Berthoud V, Hall D, Strahsburger E, Beyer E, Saez J (2000). Gap junctions in the chicken pineal gland. Brain Res 861:257–270. [DOI] [PubMed] [Google Scholar]
- Bevans CG, Kordel M, Rhee SK, Harris AL (1998). Isoform composition of connexin channels determines selectivity among second messengers and uncharged molecules. J Biol Chem 273:2808–2816. [DOI] [PubMed] [Google Scholar]
- Beyer EC (1990). Molecular cloning and developmental expression of two chick embryo gap junction proteins. J Biol Chem 265:14439–14443. [PubMed] [Google Scholar]
- Bukauskas FF, Angele AB, Verselis VK, Bennett MV (2002). Coupling asymmetry of heterotypic connexin 45/connexin 43-EGFP gap junctions: properties of fast and slow gating mechanisms. Proc Natl Acad Sci USA 99:7113–7118. [DOI] [PMC free article] [PubMed] [Google Scholar]
- Cao Z, Wu HK, Bruce A, Wollenberg K, Panjwani N (2002). Detection of differentially expressed genes in healing mouse corneas, using cDNA microarrays. Invest Ophthalmol Vis Sci 43:2897–2904. [PubMed] [Google Scholar]
- Cohen-Salmon M, Maxeiner S, Kruger O, Theis M, Willecke K, Petit C (2004). Expression of the connexin43- and connexin45-encoding genes in the developing and mature mouse inner ear. Cell Tissue Res 316:15–22. [DOI] [PubMed] [Google Scholar]
- Cotanche DA (1987). Regeneration of hair cell stereociliary bundles in the chick cochlea following severe acoustic trauma. Hear Res 30:181–195. [DOI] [PubMed] [Google Scholar]
- Cotanche DA (1999). Structural recovery from sound and aminoglycoside damage in the avian cochlea. Audiol Neurootol 4:271–285. [DOI] [PubMed] [Google Scholar]
- Cotanche DA, Cotton CU, Gatzy JT, Sulik KK (1987). Ultrastructural and electrophysiological maturation of the chick tegmentum vasculosum. Hear Res 25:125–139. [DOI] [PubMed] [Google Scholar]
- Coutinho P, Qiu C, Frank S, Tamber K, Becker D (2003). Dynamic changes in connexin expression correlate with key events in the wound healing process. Cell Biol Int 27:525–541. [DOI] [PubMed] [Google Scholar]
- Deleze J, Delage B, Hentati-Ksibi O, Verrecchia F, Herve J (2001). Fluorescence recovery after photobleaching. In: Connexin methods and protocols (Giaume C, ed.) pp. 313–327. Totawa, NJ: Humana. [DOI] [PubMed]
- Elfgang C, Eckert R, Lichtenberg-Frate H, Butterweck A, Traub O, Klein RA, Hulser DF, Willecke K (1995). Specific permeability and selective formation of gap junction channels in connexin-transfected HeLa cells. J Cell Biol 129:805–817. [DOI] [PMC free article] [PubMed] [Google Scholar]
- Evans WH, Martin PE (2002). Gap junctions: structure and function (Rev). Mol Membr Biol 19:121–136. [DOI] [PubMed] [Google Scholar]
- Fettiplace R, Fuchs PA (1999). Mechanisms of hair cell tuning. Annu Rev Physiol 61:809–834. [DOI] [PubMed] [Google Scholar]
- Fischer FP (1992). Quantitative analysis of the innervation of the chicken basilar papilla. Hear Res 61:167–178. [DOI] [PubMed] [Google Scholar]
- Flagg-Newton JL, Loewenstein WR (1980). Asymmetrically permeable membrane channels in cell junction. Science 207:771–773. [DOI] [PubMed] [Google Scholar]
- Forge A, Becker D, Casalotti S, Edwards J, Marziano N, Nickel R (2002). Connexins and gap junctions in the inner ear. Audiol Neurootol 7:141–145. [DOI] [PubMed] [Google Scholar]
- Forge A, Marziano NK, Casalotti SO, Becker DL, Jagger D (2003a). The inner ear contains heteromeric channels composed of cx26 and cx30 and deafness-related mutations in cx26 have a dominant negative effect on cx30. Cell Commun Adhes 10:341–346. [DOI] [PubMed] [Google Scholar]
- Forge A, Becker D, Casalotti S, Edwards J, Marziano N, Nevill G (2003b). Gap junctions in the inner ear: comparison of distribution patterns in different vertebrates and assessment of connexin composition in mammals. J Comp Neurol 467:207–231. [DOI] [PubMed] [Google Scholar]
- Goldberg GS, Lampe PD, Nicholson BJ (1999). Selective transfer of endogenous metabolites through gap junctions composed of different connexins. Nat Cell Biol 1:457–459. [DOI] [PubMed] [Google Scholar]
- Goldberg GS, Moreno AP, Lampe PD (2002). Gap junctions between cells expressing connexin 43 or 32 show inverse permselectivity to adenosine and ATP. J Biol Chem 277:36725–36730. [DOI] [PubMed] [Google Scholar]
- Goldberg GS, Valiunas V, Brink PR (2004). Selective permeability of gap junction channels. Biochim Biophys Acta 1662:96–101. [DOI] [PubMed] [Google Scholar]
- Harris AL (2001). Emerging issues of connexin channels: biophysics fills the gap. Q Rev Biophys 34:325–472. [DOI] [PubMed] [Google Scholar]
- Heller S, Sheane CA, Javed Z, Hudspeth AJ (1998). Molecular markers for cell types of the inner ear and candidate genes for hearing disorders. Proc Natl Acad Sci USA 95:11400–11405. [DOI] [PMC free article] [PubMed] [Google Scholar]
- Helling K, Merker HJ (2005). Morphological aspects of potassium flow in the semicircular canal ampulla of the pigeon. Histol Histopathol 20:339–350. [DOI] [PubMed] [Google Scholar]
- Jagger DJ, Forge A (2006). Compartmentalized and signal-selective gap junctional coupling in the hearing cochlea. J Neurosci 26:1260–1268. [DOI] [PMC free article] [PubMed] [Google Scholar]
- Jorgensen JM, Mathiesen C (1988). The avian inner ear. Continuous production of hair cells in vestibular sensory organs, but not in the auditory papilla. Naturwissenschaften 75:319–320. [DOI] [PubMed] [Google Scholar]
- Kikuchi T, Adams JC, Paul DL, Kimura RS (1994). Gap junction systems in the rat vestibular labyrinth: immunohistochemical and ultrastructural analysis. Acta Otolaryngol 114:520–528. [DOI] [PubMed] [Google Scholar]
- Kikuchi T, Kimura RS, Paul DL, Adams JC (1995). Gap junctions in the rat cochlea: immunohistochemical and ultrastructural analysis. Anat Embryol (Berl) 191:101–118. [DOI] [PubMed] [Google Scholar]
- Marziano NK, Casalotti SO, Portelli AE, Becker DL, Forge DL (2003). A Mutations in the gene for connexin 26 (GJB2) that cause hearing loss have a dominant negative effect on connexin 30. Hum Mol Genet 12:805–812. [DOI] [PubMed] [Google Scholar]
- Masetto S, Correia MJ (1997). Electrophysiological properties of vestibular sensory and supporting cells in the labyrinth slice before and during regeneration. J Neurophysiol 78:1913–1927. [DOI] [PubMed] [Google Scholar]
- Musil LS, Beyer EC, Goodenough DA (1990). Expression of the gap junction protein connexin43 in embryonic chick lens: molecular cloning, ultrastructural localization, and post-translational phosphorylation. J Membr Biol 116:163–175. [DOI] [PubMed] [Google Scholar]
- Necker R (1970). Zur Enstehung der Cochleapotentiale von Voegeln: Verhalten bei O2-Mangel, Cyanidvergiftung und Unterkuehlung sowie Beobachtung ueber die raeumliche Verteilung. Z Vergl Physiol 69:367–425. [Google Scholar]
- Nicholson BJ (2003). Gap junctions–from cell to molecule. J Cell Sci 116:4479–4481. [DOI] [PubMed] [Google Scholar]
- Niessen H, Harz H, Bedner P, Kramer K, Willecke K (2000). Selective permeability of different connexin channels to the second messenger inositol 1,4,5-trisphosphate. J Cell Sci 113:1365–1372. [DOI] [PubMed] [Google Scholar]
- Ninoyu O, Hommerich C, Morgenstern C (1987). Endolymph formation in the inner ear of pigeons. ORL J Otorhinolaryngol Relat Spec 49:1–8. [DOI] [PubMed] [Google Scholar]
- Oesterle EC, Dallos P (1990). Intracellular recordings from supporting cells in the guinea pig cochlea: DC potentials. J Neurophysiol 64:617–636. [DOI] [PubMed] [Google Scholar]
- Pantelias AA, Monsivais P, Rubel EW (2001). Tonotopic map of potassium currents in chick auditory hair cells using an intact basilar papilla. Hear Res 156:81–94. [DOI] [PubMed] [Google Scholar]
- Robinson SR, Hampson EC, Munro MN, Vaney DI (1993). Unidirectional coupling of gap junctions between neuroglia. Science 262:1072–1074. [DOI] [PubMed] [Google Scholar]
- Runhaar G, Schedler J, Manley GA (1991). The potassium concentration in the cochlear fluids of the embryonic and post-hatching chick. Hear Res 56:227–238. [DOI] [PubMed] [Google Scholar]
- Santos-Sacchi J (1985). The effects of cytoplasmic acidification upon electrical coupling in the organ of Corti. Hear Res 19:207–215. [DOI] [PubMed] [Google Scholar]
- Santos-Sacchi J, Dallos P (1983). Intercellular communication in the supporting cells of the organ of Corti. Hear Res 9:317–326. [DOI] [PubMed] [Google Scholar]
- Sauer G, Richter CP, Klinke R (1999). Sodium, potassium, chloride and calcium concentrations measured in pigeon perilymph and endolymph. Hear Res 129:1–6. [DOI] [PubMed] [Google Scholar]
- Schneider ME, Cotanche DA, Fambrough DM, Saunders JC, Matschinsky FM (1987). Immunocytochemical and quantitative studies of Na+, K+-ATPase distribution in the developing chick cochlea. Hear Res 31:39–53. [DOI] [PubMed] [Google Scholar]
- Si X, Zakir MM, Dickman JD (2003). Afferent innervation of the utricular macula in pigeons. J Neurophysiol 89:1660–1677. [DOI] [PubMed] [Google Scholar]
- Stein LS, Boonstra J, Burghardt RC (1992). Reduced cell-cell communication between mitotic and nonmitotic coupled cells. Exp Cell Res 198:1–7. [DOI] [PubMed] [Google Scholar]
- Stein LS, Stein DW, Echols J, Burghardt RC (1993). Concomitant alterations of desmosomes, adhesiveness, and diffusion through gap junction channels in a rat ovarian transformation model system. Exp Cell Res 207:19–32. [DOI] [PubMed] [Google Scholar]
- Stone JS, Rubel EW (2000). Cellular studies of auditory hair cell regeneration in birds. Proc Natl Acad Sci USA 97:11714–11721. [DOI] [PMC free article] [PubMed] [Google Scholar]
- Sun J, Ahmad S, Chen S, Tang W, Zhang Y, Chen P, Lin X (2005). Cochlear gap junctions coassembled from Cx26 and 30 show faster intercellular Ca2+ signaling than homomeric counterparts. Am J Physiol Cell Physiol 288:C613–C623. [DOI] [PubMed] [Google Scholar]
- Trosko JE, Ruch RJ (1998). Cell-cell communication in carcinogenesis. Front Biosci 3:D208–D236. [DOI] [PubMed] [Google Scholar]
- Verselis VK, Ginter CS, Bargiello TA (1994). Opposite voltage gating polarities of two closely related connexins. Nature 368:348–351. [DOI] [PubMed] [Google Scholar]
- Wade MH, Trosko JE, Schindler M (1986). A fluorescence photobleaching assay of gap junction-mediated communication between human cells. Science 232:525–528. [DOI] [PubMed] [Google Scholar]
- Wangemann P (2002a). K(+) cycling and its regulation in the cochlea and the vestibular labyrinth. Audiol Neurootol 7:199–205. [DOI] [PubMed] [Google Scholar]
- Wangemann P (2002b). K+ cycling and the endocochlear potential. Hear Res 165:1–9. [DOI] [PubMed] [Google Scholar]
- Yamasaki H, Krutovskikh V, Mesnil M, Tanaka T, Zaidan-Dagli ML, Omori Y (1999). Role of connexin (gap junction) genes in cell growth control and carcinogenesis. C R Acad Sci III 322:151–159. [DOI] [PubMed] [Google Scholar]
- Zahs KR (1998). Heterotypic coupling between glial cells of the mammalian central nervous system. Glia 24:85–96. [PubMed] [Google Scholar]
- Zahs KR, Newman EA (1997). Asymmetric gap junctional coupling between glial cells in the rat retina. Glia 20:10–22. [PubMed] [Google Scholar]
- Zhang Y, Tang W, Ahmad S, Sipp JA, Chen P, Lin X (2005). Gap junction-mediated intercellular biochemical coupling in cochlear supporting cells is required for normal cochlear functions. Proc Natl Acad Sci USA 102:15201–15206. [DOI] [PMC free article] [PubMed] [Google Scholar]
- Zhao HB (2000). Directional rectification of gap junctional voltage gating between Deiters’ cells in the inner ear of guinea pig. Neurosci Lett 296:105–108. [DOI] [PubMed] [Google Scholar]
- Zhao HB, Santos-Sacchi J (2000). Voltage gating of gap junctions in cochlear supporting cells: evidence for nonhomotypic channels. J Membr Biol 175:17–24. [DOI] [PubMed] [Google Scholar]