

Abstract
The functional organization of the basal ganglia (BG) is often defined according to one of two opposing schemes. The first proposes multiple, essentially independent channels of information processing. The second posits convergence and lateral integration of striatal channels at the level of the globus pallidus (GP). We tested the hypothesis that these proposed aspects of functional connectivity within the striatopallidal axis are dynamic and related to brain state. Local field potentials (LFPs) were simultaneously recorded from multiple sites in striatum and GP in anesthetized rats during slow-wave activity (SWA) and during global activation evoked by sensory stimulation. Functional connectivity was inferred from comparative analyses of the internuclear and intranuclear coherence between bipolar derivations of LFPs.
During prominent SWA, as shown in the electrocorticogram and local field potentials in the basal ganglia, intranuclear coherence, and, thus, lateral functional connectivity within striatum or globus pallidus was relatively weak. Furthermore, the temporal coupling of LFPs recorded across these two nuclei involved functional convergence at the level of GP. Global activation, indicated by a loss of SWA, was accompanied by a rapid functional reorganization of the striatopallidal axis. Prominent lateral functional connectivity developed within GP and, to a significantly more constrained spatial extent, striatum. Additionally, functional convergence on GP was no longer apparent, despite increased internuclear coherence.
These data demonstrate that functional connectivity within the BG is highly dynamic and suggest that the relative expression of organizational principles, such as parallel, independent processing channels, striatopallidal convergence, and lateral integration within BG nuclei, is dependent on brain state.
Keywords: basal ganglia, striatum, globus pallidus, coherence, local field potentials, convergence
Introduction
The functional organization of the basal ganglia (BG), and particularly that of the striatopallidal axis, is often defined according to one of two opposing schemes. The first suggests the existence of multiple, essentially independent channels of information processing (Alexander and Crutcher, 1990; Middleton and Strick, 2000). Hence, functional connectivity within the striatopallidal axis is commonly perceived in terms of internuclear connections, i.e., a “vertical” organization of channels rather than intranuclear connections and a “lateral” integration of channels. The second scheme posits a progressive funneling of cortical information through the BG and predicts the convergence of striatal channels at the level of the globus pallidus (GP), together with the lateral integration of such activities within the GP (Percheron and Filion, 1991; Percheron et al., 1994; Yelnik, 2002; Bar-Gad et al., 2003b). Resolving these disparate views is dependent on the characterization of functional connectivity at the level of neuronal networks in vivo, with due consideration of both internuclear and intranuclear connections.
Functional connectivity between neuronal networks is dynamic, as exemplified in the cerebral cortex in which active information processing is often accompanied by the redefinition of interactions to create small, distributed ensembles of neurons engaged in related tasks (Engel and Singer, 2001; Engel et al., 2001; Varela et al., 2001; Buzsáki and Draguhn, 2004). Two of the major determinants of connection strengths are the discharge rates of presynaptic neurons and the level of synchronization between neurons (Shadlen and Newsome, 1994; König et al., 1996). With respect to the latter, establishing functional connectivity through coupled network oscillations, according to brain state, may be of fundamental importance (Buzsáki and Draguhn, 2004). Thus, BG organizational schemes should allow for rapid, brain-state or task-related changes in the effective strengths of connections within and between neuronal ensembles.
The functional connectivity between networks of neurons may be inferred from the synchronization of their respective activities (Glaser and Ruchkin, 1976; Thatcher et al., 1986; Thatcher et al., 1987; Fein et al., 1988; Rappelsberger and Petsche, 1988; Lopez da Silva et al., 1989; Nunez, 1995; Andrew and Pfurtscheller, 1996; Shen et al., 1999). This is regardless of whether synchronization is a consequence of common inputs to each neuronal group (Halliday et al., 1995) or the result of self-organization into synchronized networks for optimal interaction (Engel et al., 2001; Buzsáki and Draguhn, 2004) because both may effectively define functional connectivity. Synchronization between network activities can be measured by their coherence, which describes the distribution of synchronization across frequencies (Halliday et al., 1995; Nunez et al., 1997, 1999). If we consider rapid transitions across brain states, then any changes in functional connectivity and coherence are likely to reflect the modified use or efficacy of connections rather than the physical removal or addition of synapses between neurons.
Here we test the hypothesis that the core aspects of functional connectivity within the striatopallidal axis predicted by current organizational schemes (the existence of parallel independent processing channels and striatopallidal convergence together with lateral integration) are dependent on brain state.
Materials and Methods
Electrophysiological recordings.
Experimental procedures were performed on adult male Sprague Dawley rats (Charles River, Margate, UK) and were conducted in accordance with the Animals (Scientific Procedures) Act of 1986 (United Kingdom) and with Society for Neuroscience policies on the Use of Animals in Neuroscience Research.
Electrophysiological recordings were made in eight rats (280–330 g). Anesthesia was induced with 4% v/v isoflurane (Isoflo; Schering-Plough, Welwyn Garden City, UK) in O2 and maintained with urethane (1.3 g/kg, i.p.; ethyl carbamate; Sigma, Poole, UK) and supplemental doses of ketamine (30 mg/kg, i.p.; Ketaset; Willows Francis, Crawley, UK) and xylazine (3 mg/kg, i.p.; Rompun, Bayer, Wuppertal, Germany), as described previously (Magill et al., 2004b; Sharott et al., 2005). All wound margins were infiltrated with the local anesthetic, bupivacaine (0.75% w/v; Astra, Kings Langley, UK), and corneal dehydration was prevented with application of Hypromellose eye drops (Norton Pharmaceuticals, Harlow, UK). Animals were then placed in a stereotaxic frame (David Kopf Instruments, Tujunga, CA). Body temperature was maintained at 37 ± 0.5°C with the use of a homeothermic heating device (Harvard Apparatus, Edenbridge, UK). Anesthesia levels were assessed by examination of the electrocorticogram (ECoG) (see below) and by testing reflexes to a cutaneous pinch or gentle corneal stimulation. Supplemental doses of the ketamine/xylazine mixture were given when necessary (typically, once per 60–90 min). Electrocardiographic (ECG) activity and respiration rate were also monitored constantly to ensure the animals' well being.
The ECoG was recorded via a 1-mm-diameter steel screw juxtaposed to the dura mater above the right frontal cortex [4.5 mm anterior and 2.0 mm lateral of bregma (Paxinos and Watson, 1986), which corresponds to the medial agranular field of the somatic sensorimotor cortex (Donoghue and Wise, 1982)] and was referenced against another screw implanted in the skull above the ipsilateral cerebellar hemisphere. Raw ECoG was bandpass filtered (0.3–1500 Hz, −3 dB limits) and amplified (2000×; DPA-2FS filter/amplifier; Scientifica, Harpenden, UK) before acquisition. The ECG was differentially recorded via two silver wires inserted subcutaneously in the ipsilateral forelimb and hindlimb. Raw ECG was bandpass filtered (5–500 Hz) and amplified (5000×; DPA-2FS filter/amplifier) before acquisition. The chest movements accompanying respiration were recorded using a miniature accelerometer (AP19; Bay Systems, Somerset, UK) and charge amplifier (type 5007; Kistler Instrumente, Winterthur, Switzerland). The signal from the accelerometer allowed the depth and rate of respiration to be accurately assessed on-line and off-line (Magill et al., 2004a).
A discrete craniotomy (3–4 mm2) was performed above the right striatum, and the dura mater was removed (reflected) for insertion of recording electrodes. Saline solution (∼10 μl of 0.9% w/v NaCl) and then a single small drop (∼5 μl) of mineral oil was applied to the exposed cortex to prevent dehydration. Although we cannot rule out a possible influence of mineral oil on the ECoG recordings, any unfavorable effects were unlikely because (1) the distance between the point of oil application and the site of the ECoG recording was relatively large (>3 mm), and (2) only a tiny amount of oil was used. Extracellular recordings of local field potentials (LFPs) and unit activity in the striatum and GP were simultaneously made using “silicon probes” (model number 1 cm100–400; NeuroNexus Technologies, Ann Arbor, MI). Each probe had 16 recording contacts arranged in a single vertical plane, with a contact separation of 100 μm. Each contact had an impedance of 0.9–1.3 MΩ (measured at 1000 Hz) and an area of ∼400 μm2. Two probes were used in this experiment. The mean impedances at the different contacts of the first and second probes were 1.08 and 1.17 MΩ, respectively. These differences in the impedance of the probe contacts would have had negligible effects on measured voltages because we used high-impedance operational amplifiers (Advanced LinCMOS; Texas Instruments, Dallas, TX), with differential and common-mode input resistances of 1 × 10¹² Ω (Neidermeyer and Lopes da Silva, 1987). Electrical crosstalk between recording channels of a silicon probe may arise through capacitive coupling (Najafi et al., 1990; Blanche et al., 2005). One probe feature of direct relevance for crosstalk is the separation distance between each interconnecting “lead” in the probe shank. Importantly, theoretical predictions (Najafi et al., 1990), supported by empirical estimates (Blanche et al., 2005), suggest that crosstalk levels in our probes, which have a lead spacing of 3 μm, would be at <0.1% of the recorded signal. These levels can be considered as negligible when compared with background noise (Najafi et al., 1990). Thus, it is very unlikely that our probe recordings were unduly influenced by non-negligible crosstalk between channels.
Monopolar signals recorded using the probes were referenced against a screw implanted in the skull above the contralateral cerebellar hemisphere. Probes were advanced into the brain under stereotaxic control (Paxinos and Watson, 1986), at an angle of 15° to the vertical to maximize the spread of recording contacts across the striatopallidal axis (Fig. 1A). Probes were advanced slowly using a zero-drift micromanipulator (1760-61; David Kopf Instruments), and large blood vessels (greater than ∼50 μm diameter) lying on the cortical surface, which were left intact, were avoided. This approach ensured that dimpling of the cortex was avoided and that no gross deformation or bending of the probe occurred. The latter is borne out by the straight tracks that were seen in the tissue after histological processing (see below). Extracellular signals from the silicon probe were amplified (1000–2000×) and low-pass filtered (0–6000 Hz) using computer-controlled differential amplifiers (Lynx-8; Neuralynx, Tucson, AZ). The ECoG and probe signals were each sampled at 17.5 kHz. The ECG and respiration signals were sampled at 400 and 64 Hz, respectively. All biopotentials were digitized on-line using a Power1401 analog-to-digital converter (Cambridge Electronic Design, Cambridge, UK) and a personal computer running Spike2 acquisition and analysis software (version 5; Cambridge Electronic Design).
Figure 1.

Recording configuration and histological verification of recording location across the striatopallidal axis. A, Scheme showing recording configuration as superimposed on a parasagittal section of rat brain. Local field potentials and unit activity were simultaneously recorded from 16 contacts distributed across the striatopallidal axis using a silicon probe. The ongoing brain state was also assessed from the ipsilateral frontal ECoG. B, Digital micrograph of tissue section at the level of the striatum (Str) and globus pallidus (GP), with the dashed line indicating the border between the two. The pink streak in the tissue indicates the recording position of the dye-coated silicon probe. Electrophysiological recordings from this animal are shown in Figure 3. IC, Internal capsule; C, caudal; D, dorsal; R, rostral; V, ventral.
Recording locations were identified by comparison of recorded unit activity with the known characteristic discharges of striatal and pallidal neurons under urethane anesthesia. Striatal projection neurons typically have low firing rates (<5 Hz) and phasic activity patterns, whereas pallidal projection neurons have relatively high firing rates (15–30 Hz) and tonic activity patterns (Magill et al., 2000, 2001; Kasanetz et al., 2002). The recording strategy was to have an even spread of probe contacts across the striatopallidal axis, with contacts 1–8 in the GP and contacts 9–16 in the striatum (supplemental Fig. 6, available at www.jneurosci.org as supplemental material). In two of the animals, recording locations were additionally verified using histological procedures (see below).
Activity was recorded, first, during slow-wave activity (SWA), which accompanies deep anesthesia and is similar to activity observed during natural sleep, and second, during episodes of sensory-evoked “global activation,” which contains patterns of activity that are more analogous to those observed during the awake, behaving state (for review, see Steriade, 2000). It is important to note that the neuronal activity patterns present under this anesthetic regimen may only be qualitatively similar to those present in the unanesthetized brain. Nevertheless, the urethane-anesthetized animal still serves as a useful model for assessing the impact of extremes of brain state on functional connectivity within and between the basal ganglia and cortex (Magill et al., 2000, 2004a). Sensory stimulation and subsequent global activation were elicited by pinching the hindpaw for 15 s with serrated forceps that were driven by a standard pneumatic pressure, as described previously (Magill et al., 2004a; Sharott et al., 2005). The animals did not exhibit a marked change in ECG or respiration rate and did not exhibit a hindpaw withdrawal reflex in response to the pinch. After the recording session, probes were immediately rinsed in deionized water, before additional cleaning by overnight immersion in a proteolytic enzyme solution [Proteinase K (Sigma) dissolved at 1 mg/ml in a buffer containing 1 mm CaCl2 and 50 mm Tris, pH 8.0]. After thorough rinsing in deionized water, probe contacts were microscopically verified as being free from accumulated proteinaceous material. This cleaning procedure was sufficient to ensure that contact impedances, and recording performance, were not altered by probe use and reuse (Blanche et al., 2005).
Histology.
Recording locations were histologically verified in two animals. Before recording in these animals, the silicon probe was evenly coated with the red fluorescent dye 1,1′-dioctadecyl-3,3,3′,3′-tetramethylindocarbocyanine perchlorate (DiI) (Invitrogen, Carlsbad, CA), by immersion of the probe in a 80 mg/ml solution (in 50/50% acetone/methanol) under microscopic control. No differences in recording quality (signal-to-noise ratio) or neuronal activity were observed when the probe was coated with DiI, in agreement with the findings of others (Blanche et al., 2005). Because DiI is nontoxic to neurons and highly lipophylic, it is taken up into cell membranes and white matter tracts when the probe is in situ.
After the recording sessions, the animals were given a lethal dose of ketamine and perfused via the ascending aorta with 100 ml of 0.01 m PBS at pH 7.4, followed by 300 ml of 0.1% w/v glutaraldehyde and 4% w/v paraformaldehyde in 0.1 m phosphate buffer, pH 7.4, and then by 100 ml of PBS. Brains were then left in the latter solution at 4°C until sectioning 24–72 h later. The fixed brain was cut into 60-μm-thick sections in the parasagittal plane on a vibrating blade microtome (VT1000S; Leica, Milton Keynes, UK). Sections were then washed in PBS and viewed on a light microscope using a 10× objective. Probe locations were indicated by discrete red/pink staining of the tissue (Fig. 1B). Images of sections were captured using a digital camera (Photometrix CoolSnap; Roper Scientific, Tucson, AZ) and associated imaging software (OpenLab; Improvision, Coventry, UK).
Data analysis.
Data from the recording sessions were first visually scrutinized for prominent ECG artifacts [brief episodes of stereotyped LFP deflections at low frequency (∼5 Hz), in time with cardiac activity] and respiration artifacts (brief episodes of LFP oscillations at ∼1.5 Hz, in time with respiration, as detected by an accelerometer on the chest wall) (Magill et al., 2004b), and contaminated data (10–30 s in duration) were rejected in three animals. Thereafter, (remaining) epochs of robust cortical slow-wave activity or global activation were selected according to the previously described characteristics of these brain states (Magill et al., 2000, 2001, 2004a; Sharott et al., 2005). Any ECG or respiration artifacts remaining in such epochs were not apparent on visual inspection of data traces or in power spectra. Single data epochs of recordings made during global activation were derived for analysis by splicing together recordings made during and immediately after hindpaw pinches (Sharott et al., 2005). Frequency analysis was performed on 120 ± 12 s (mean ± SEMs) and 121 s ± 13 s of data recorded during robust SWA and during activation, respectively.
Although data from monopolar recordings are also presented, the main analyses use bipolar derivations. Raw (monopolar) signals were digitally converted off-line to bipolar derivations (hereafter referred to as signals from “bipolar electrodes”) so as to measure the potential difference between adjacent probe contacts. Such “bipolar recordings” are particularly useful for measuring local current flow because simultaneous oscillations of identical voltage at both probe contacts will be cancelled out, limiting the potential effects of volume-conducted currents, which may be important over short distances (see below). All signals were low-pass filtered at 80 Hz to remove unit activity, thus leaving LFPs only. Adjacent contacts of the probe were used to make up the bipolar electrodes so that potential differences were measured across small distances (∼100 μm). Thus, only the synchronized activity of small local ensembles was registered and subsequently analyzed. The heterogeneous nature of the populations of neural elements underlying our bipolar electrode signals is underscored by the fact that significant signal was actually detected after derivation; had signals recorded at each contact in the bipolar pair been entirely homogeneous, then they would have been rejected during the derivation process. Additional evidence for signal heterogeneity in contacts/electrodes separated by ≥100 μm can be derived from recordings of unit activity. In contrast to probe recordings in the cerebral cortex (Blanche et al., 2005), our unit activity data indicate that the action potential discharges of individual striatal or pallidal neurons were only very rarely represented on more than one recording contact (supplemental Fig. 6, available at www.jneurosci.org as supplemental material). It follows that coherence (see below) between LFPs in bipolar electrodes implies that two small, heterogeneous, local ensembles are coupled (although such ensembles may be separated by hundreds of micrometers). Note that coherence between bipolar electrode pairs with a common recording contact was not calculated to avoid artificially inflated coherence estimates.
Local field potential data from bipolar electrodes were down-sampled to 200 Hz in Spike2 for analysis purposes. Spectral analysis was performed in Matlab version 6.0 (MathWorks, Natick, MA) using a mixed-radix algorithm. Coherence is a measure of the linear association (correlation) between two signals across frequencies. It is a bounded measure taking values from 0 to 1, in which 0 indicates that there is no linear association (i.e., that one process is of no use in linearly predicting another process) and 1 indicates a perfect linear association. The coherence |Rab(λ)|2 was calculated (Halliday et al., 1995) by using the formula |Rab(λ)|2 = |fab(λ)|2 /faa(λ) fbb(λ). In this equation, f characterizes the spectral estimate of two signals, a and b, for a given frequency (λ). The numerator includes the cross-spectrum for a and b (fab), whereas the denominator includes the autospectra for a (faa) and b (fbb). Spectra were estimated by dividing the data epochs into a number of disjoint sections of 1 s duration. Frequency resolution was 1 Hz. Data were windowed with a Hanning filter to control “spectral leakage.” The square root of the coherence was normalized using a Fisher's transform before averaging and statistical analysis, and it is these transformed values that are given in the text and figures (Halliday et al., 1995). Coherence was used in this study as a marker of functional connectivity (Thatcher et al., 1986, 1987; Fein et al., 1988; Rappelsberger and Petsche, 1988; Lopez da Silva et al., 1989; Nunez, 1995; Andrew and Pfurtscheller, 1996; Shen et al., 1999). Power values were normalized by logarithmic transformation (Halliday et al., 1995).
The use of bipolar electrodes should cancel out simultaneous oscillations of identical voltage at both probe contacts, such as those caused by volume-conducted currents. However, such cancellation depends on isotropic tissue impedance, which may not always be the case, especially in the globus pallidus and striatum because they are complex structures containing large bundles of myelinated axons. Accordingly, we investigated whether differences in tissue impedance at the two probe contacts comprising a bipolar electrode might lead to a failure to cancel global activities common to both contacts, such as volume conduction. If so, then there should be a certain gain factor that could be applied to one of the two probe contacts that would compensate for differences in tissue impedance and therefore lead to smaller estimates of power at each bipolar electrode, as well as smaller estimates of coherence between bipolar electrodes. We therefore scaled the gain, in a stepwise manner from 0.9 to 1.1 using increments of 0.01, of one of the two voltage signals in each bipolar electrode before off-line subtraction. This operation was performed on the complete dataset, and, thereafter, we estimated the mean power and coherence over a frequency band from 4 to 20 Hz (the core frequency band of interest) (see Results). Power in striatum or globus pallidus was not appreciably reduced with gain scaling from 0.9 to 1.1 (supplemental Fig. 1, available at www.jneurosci.org as supplemental material). Thus, mean gain scaled power was <1% lower than mean nongain scaled power, regardless of recording site and brain state. Similarly, coherence estimates between bipolar electrodes within striatum or globus pallidus or between bipolar electrodes in each nucleus were not appreciably reduced. In fact, in the SWA state only, coherence estimates tended to increase at the extremes of our gain-scaling range (supplemental Fig. 2, available at www.jneurosci.org as supplemental material). Thus, mean gain scaled coherence was <1% lower than mean nongain scaled coherence, regardless of recording site and brain state. Furthermore, differences in both power and coherence were normally distributed (supplemental Fig. 4, 5, available at www.jneurosci.org as supplemental material). In summary, these observations suggest that global activity was well matched between neighboring sites and that, therefore, tissue impedances did not vary much between sites. Accordingly, global activity and volume conduction effects were likely to have been subtracted out by our bipolar derivation.
The phase between pairs of signals, defined as the argument of the cross spectrum, was estimated by φab (λ) = arg {fab (λ)}.
Confidence limits (95%) of each phase estimate were calculated as described by Halliday et al. (1995). The interpretation of phase data can be ambiguous in complex systems, at least when one analytical approach is used in isolation (Gotman, 1983; Cassidy and Brown, 2003). However, here we only estimated phase to identify lags between bipolar signals that were incompatible with incompletely subtracted global activity, such as volume conduction. A substantial proportion of such phase differences would provide additional evidence against subtraction artifacts arising from imperfect matching of global activity between neighboring sites attributable to non-isotropic tissue impedance. Accordingly, we calculated the percentage of phase estimates whose confidence limits excluded 0 or ±180°. We included the latter because simple polarity reversals might occur as a result of our bipolar derivations, without any true conduction delay between sites. We grouped phase estimates according to whether they referred to intrastriatal, intrapallidal, or striatopallidal couplings. By definition, we would have expected only 5% of phase estimates to differ from 0 by chance (and fewer still to differ from both 0 and ±180°). Supplemental Figure 3 (available at www.jneurosci.org as supplemental material) shows that ∼50% of phase estimates were incompatible with 0 phase lag or ±180° phase difference. A Fisher's exact test comparing the actual number of phase estimates differing from 0 and from ±180° with the number expected by chance (assumed to be 5% of the total number of phase estimates) indicated that the difference was highly significant (p < 0.0001). The remaining phase estimates that did not differ significantly from 0 or ±180° could represent not only volume conduction effects but also very short conduction delays across distances as short as 200 μm, zero phase synchronization of neuronal activities, as suggested at higher frequencies in the cerebral cortex (Singer, 1993), or phase estimates with very large confidence limits, such as those occurring with bipolar electrode pairs that are only weakly coherent.
Finally, for each animal and nucleus, we separately averaged the transformed internuclear coherences involving each bipolar electrode and then determined the coefficient of variation (CV) of these mean coherences across the bipolar electrodes in each nucleus. The CVs of the mean internuclear coherences can be used to infer the level of convergence of functional connectivity (Fig. 2). A greater CV in GP compared with striatum would indicate that internuclear coherence was more variable across all pallidal channels and therefore relatively more concentrated at fewer sites in GP. Such a result would in turn imply a convergence of functional connectivity from striatum to GP (Fig. 2).
Figure 2.

Scheme illustrating how convergence/divergence of functional connectivity can be inferred from transformed internuclear coherences. In this simplified scheme, there are three striatal bipolar electrodes as well as three pallidal (GP) electrodes. Note that coherence was normalized using a Fisher's transform before averaging and statistical analysis (see Materials and Methods). For each animal and nucleus, the internuclear coherences between each electrode (black and gray links) were separately averaged (above for striatum, below for GP), and then the CV of these mean coherences were determined for all electrodes in each nucleus. Each striatal electrode (considered in turn from left to right) has a mean internuclear coherence of 0.5 [(1 + 0.4 + 0.1)/3]. The CV for these three striatal electrodes is thus 0. In contrast, the mean internuclear coherences are highly variable (1, 0.4, and 0.1) across the pallidal electrodes. The CV for these three pallidal electrodes is 0.8. A greater CV in GP compared with striatum would indicate that internuclear coherence was more variable across all pallidal electrodes and therefore relatively more concentrated at fewer sites in GP. Such a result in turn implies a relative convergence of functional connectivity from striatum to GP.
When transformed spectral measures were normally distributed, as confirmed by the one-sample Kolmogorov–Smirnov test (SPSS for Windows; SPSS, Chicago, IL), group analysis of transformed data were performed by repeated-measures ANOVA as described in Results (SPSS). No corrections for nonsphericity were necessary, and significance was set at p ≤ 0.05. Post hoc testing was by two-tailed paired t tests. Normally distributed data are expressed as mean ± SEM. In the case of transformed intranuclear coherences across different distances, the presence of three outlying values (more than three times the interquartile range from the median) precluded the use of parametric statistics. These data are presented as box plots and were analyzed by Friedman's tests, with post hoc testing by Wilcoxon's signed ranks test. All post hoc tests that are quoted as significant remained significant at p ≤ 0.05 after correction for multiple testing using the false discovery rate procedure (Curran-Everett, 2000).
Results
We made simultaneous recordings from multiple sites in the striatum and globus pallidus using 16-contact silicon probes in eight animals (Fig. 1A). Recording locations were identified using the established electrophysiological characteristics of single neurons of the striatum and GP recorded during urethane anesthesia (see Materials and Methods). In the two animals used for histological analysis, the locations of the probes across the striatopallidal axis were in agreement with the positions predicted on the basis of the characteristic unit activity recorded in striatum and GP (Fig. 1B). To maximize our ability to detect the synchronized activity of local populations of neurons, we recorded LFPs (Hubbard et al., 1969; Mitzdorf, 1985). The frontal ECoG and striatal and pallidal LFPs were simultaneously recorded during robust cortical SWA and during global activation (Fig. 3A). The power of ECoG slow-wave activities at <3 Hz dropped by 67 ± 17% (p < 0.01, two-way paired t test) during pinch-induced activation. This reduction in low-frequency ECoG activity was accompanied by a significant increase (25 ± 13%; p = 0.03, two way paired t test) in the power of activities between 55 and 80 Hz. These data are consistent with the sensory stimulus eliciting cortical activation and, indeed, more global activation (Munk et al., 1996; Steriade et al., 1996; van der Togt et al., 1998; Destexhe et al., 1999).
Figure 3.

Simultaneous recordings of local field potentials across the striatopallidal axis. A, Frontal ECoG and monopolar LFPs recorded in striatum and GP during SWA and global activation. Probe contacts were separated by 100 μm. For clarity, only even-numbered probe contacts are shown. In this example, recordings of unit activity (see Materials and Methods) suggested that contacts 9–16 were in the striatum, whereas contacts 1–8 were in the GP, in agreement with the histological analysis (recordings taken from same animal as that shown in Fig. 1B). The LFPs were isolated after low-pass filtering at 400 Hz. The ECoG and LFPs in striatum and GP were dominated by large-amplitude, slow oscillations (∼1 Hz) during SWA. Global activation of the forebrain after pinch onset (arrow) was exemplified by a loss of SWA in the ECoG, and LFPs in striatum and GP, and a shift to oscillatory activity of smaller amplitude and higher frequency. B, Bipolar derivations of monopolar LFPs were constructed by subtracting signals recorded on neighboring probe contacts. Highly synchronous activity that was common to all contacts in striatum (e.g., contacts 13 and 14) and GP (e.g., contacts 5 and 6), such as the slow oscillation present during SWA, were eliminated in bipolar derivations.
Changes in power of local field potentials
The differences in functional connectivity between local populations of neurons in striatum and GP during SWA and during global activation were determined. We used the coherence between aggregated neuronal activities, as represented by LFPs, rather than the coherence between single neurons as our index of functional connectivity. The former is a far more sensitive measure of correlated activity (Christakos, 1997) and is also less subject to sampling bias. Local field potentials were primarily evaluated across bipolar electrodes, consisting of adjacent probe contacts separated by 100 μm (Fig. 3B) (see Materials and Methods), so that only the synchronized activity of small local ensembles was registered and subsequently analyzed. The subtraction of monopolar LFPs during the creation of bipolar electrodes led to a suppression of global activity, such as the widespread slow oscillation at ∼1 Hz, in bipolar signals (Fig. 3B). We tested whether the suppression of highly synchronous activity was statistically significant by comparing the spectral power of bipolar and monopolar signals. It can be predicted that, if bipolar electrodes fail to record synchronized activity generated across large populations of neurons, or activity volume-conducted from distant sources of synchronization, then power estimates at bipolar electrodes should be substantially less than those at monopolar electrodes. The mean power over 4–20 Hz (see below) at bipolar electrodes was 8.0 ± 4.9, 13.0 ± 3.6, 9.2 ± 2.8, and 26.8 ± 8.3% (mean ± SEM) of that at monopolar electrodes in striatum during SWA, in striatum during global activation, in GP during SWA, and in GP during global activation, respectively (p < 0.001 for all comparisons, paired t tests). Over 21–45 Hz, mean power at bipolar electrodes was 13.3 ± 3.8, 15.2 ± 3.0, 24.6 ± 6.1, and 37.8 ± 9.3% of that at monopolar electrodes in striatum during SWA, in striatum during global activation, in GP during SWA, and in GP during global activation, respectively (p < 0.001 for all comparisons, paired t tests). Together, these data suggest that only the synchronized activity of small local ensembles was registered with bipolar electrodes (see Materials and Methods and supplemental data, available at www.jneurosci.org as supplemental material).
Spectral power of bipolar LFPs was also calculated to test whether changes in coherence (see below) were the result of modulations of nonlinearly related frequency components (Fein et al., 1988; Florian et al., 1998). Coherence denotes the proportion of a pair of signals that linearly covaries with respect to phase and amplitude at a given frequency. Thus, increases in activities that do not linearly covary may lead to reductions in coherence, although the absolute degree of biological functional connectivity between sites may not have changed. Such a relationship can be suspected when coherence and power changes occur in opposite directions. An ANOVA of the mean LFP power between 4 and 20 Hz, with main effects of state (two levels, SWA and activation) and nucleus (two levels, striatum and GP), showed that this was not the case. The only significant interaction was between state and nucleus (F(1,7) = 8.409; p = 0.023), which post hoc tests indicated was attributable to significantly greater power (t(7) = −3.296; p = 0.013) over 4–20 Hz in GP than striatum during activation (Fig. 4A,B). There was, however, a trend (t(7) = 2.193; p = 0.064) for power within GP to increase, rather than decrease, during activation (Fig. 4B), so that the increase in coherence during activation likely represented a real increase in biological linear coupling. This is supported by our data demonstrating that the differences in averaged LFP power between activation and SWA were consistently positive (Fig. 4A).
Figure 4.

Brain state-dependent changes in local field potential power in basal ganglia. A, Mean LFP power during activation minus mean LFP power during SWA for all animals. B, Mean LFP power over the 4–20 Hz range in both brain states. Note that relative changes are small. ∗p < 0.05, significant difference between intrapallidal and intrastriatal LFP power during activation. a.u., Arbitrary units. Error bars in A and B are SEMs.
Measures of functional connectivity
Coherence between pairs of LFPs recorded with bipolar electrodes derived from contacts separated by 100 μm implies that two small and spatially separate local ensembles are linearly coupled. To determine the frequency band(s) at which coherence showed the greatest change between SWA and activation, the coherence between such LFPs was estimated for all possible combinations of bipolar electrodes, barring those sharing contacts, for each brain state, and at all frequencies between 1 and 80 Hz. When averaged across all animals and all separations between bipolar electrodes, both intranuclear coherences and internuclear (i.e., between striatum and GP) coherences were increased during activation (Fig. 5A–C), especially over a frequency band from 4 to 20 Hz (Fig. 5D). Accordingly, changes in the transformed coherence between LFPs in the 4–20 Hz band were used as our specific indices of changes in functional connectivity. A representative example of coherence across all combinations of bipolar electrodes in both brain states in a single animal is shown in Figure 5E. A representative example of how significant changes in coherence at a given frequency in the 4–20 Hz band were distributed within one recording along the striatopallidal axis during SWA and activated brain states is shown in Figure 5F. There was no significant coherence between bipolar electrodes in either striatum or GP during SWA at this frequency in this animal, and all significant changes in coherence involved increases during activation. In the case of internuclear coherence, bipolar electrodes separated by as much as 800 μm could show brain state-dependent modulation of their temporal and spatial coupling.
Figure 5.

Activation-related changes in intrastriatal, intrapallidal, and internuclear coherence. A, Averaged transformed coherence between LFPs during SWA for all animals. B, Averaged transformed coherence between LFPs during activation for all animals. C, Difference between averaged transformed coherences present during activation and SWA for all animals. The major increase in coherence is over 4–20 Hz. Error bars in A–C represent SEMs. D, Box plots of group transformed intrastriatal, intrapallidal, and internuclear coherences over 4–20 Hz. In each box plot, the central line represents the median, the box represents the interquartile range, and the outer edges represent the 5 and 95% confidence limits. E, Examples of coherence spectra in one animal (same case as in Figs. 1B and 3). Thick and thin lines are spectra derived from activity recorded during SWA and global activation, respectively. Coherence is increased during activation. F, Schematic of the detailed spatial distribution of significant changes in coherence at 7 Hz during activation in same animal as in E. Probe recording contacts and bipolar derivations are shown as the spatial reference. Dark gray, light gray, and black lines linking bipolar electrodes indicate significantly increased coherence in intrastriatal, intrapallidal, and internuclear (striatopallidal) connections, respectively. There was no significant coherence between bipolar electrodes in either striatum or GP during SWA at this frequency in this animal.
Intrastriatal and intrapallidal coherence
The recording of activity at up to eight probe contacts within striatum or GP allowed us to perform a detailed analysis of the spatial extent of coupling. To determine whether changes in the spatial characteristics of coherence during activation were similar within striatum and GP, we separately analyzed coherence in all animals according to bipolar electrode separation (Fig. 6). The distance between bipolar electrodes within each nucleus ranged from 200 to 500 μm (excluding those electrodes sharing contacts). Comparing the mean transformed 4–20 Hz coherence between LFPs separated by 200, 300, 400, or 500 μm, we found a significant difference between SWA and activation in both the striatum and GP (Friedman's tests, p = 0.025 and 0.004, respectively). Post hoc tests confirmed that intrastriatal coherence was significantly elevated during activation but only for the shortest separation (200 μm) between bipolar electrodes (Wilcoxon's signed ranks test, p = 0.012) (Fig. 6). In contrast, intrapallidal coherence was significantly increased during activation over distances of 200, 300, and 400 μm between electrodes (Wilcoxon's signed ranks test, p = 0.036, 0.017, and 0.017, respectively) (Fig. 6). The increase in intrapallidal coherence during activation was found to exceed the increase in intrastriatal coherence at a distance of 300 μm between bipolar electrodes (Wilcoxon's signed ranks test, p = 0.017).
Figure 6.

Box plots of transformed intrastriatal and intrapallidal coherence over 4–20 Hz according to distance between bipolar electrodes. In each box plot, the central line represents the median, the box represents the interquartile range, and the outer edges represent the 5 and 95% confidence limits. White and gray boxes represent interquartile ranges for SWA and global activation, respectively. ∗p < 0.05, significant difference between SWA and activation (Wilcoxon's signed ranks test).
Changes in intranuclear coherence were not only organized according to spatial extent but were also frequency selective. No difference was found between SWA and activation for mean transformed coherence over 21–45 Hz between LFPs separated by 200, 300, 400, or 500 μm in either the striatum and GP (Friedman's tests, p > 0.05; data not shown).
Finally, it is noteworthy that the mean transformed intranuclear coherences over 4–20 Hz averaged across bipolar electrode separations of 200, 300, 400, and 500 μm were 21.5 ± 2.6 and 8.3 ± 0.7% of coherences across monopolar electrodes during activation and SWA, respectively (p < 0.001 in both cases, paired t tests). Similarly, the mean transformed intranuclear coherences over 21–45 Hz averaged across bipolar electrode separations of 200, 300, 400, and 500 μm were 14.7 ± 1.9 and 9.6 ± 0.5% of coherences across monopolar electrodes during activation and SWA, respectively (p < 0.001 in both cases, paired t tests). These differences are consistent with the hypothesis that the coherence between bipolar electrodes reflects coupling between small, spatially distinct populations of neurons, whereas coherence between monopolar electrodes is also sensitive to synchronized activity across very large areas, as well to volume conduction effects from distant sources.
Coherence between striatum and globus pallidus
We then investigated whether the functional internuclear connectivity between small neuronal populations in striatum and GP differed according to brain state. Internuclear coherence was relatively low during SWA but higher during activation (Fig. 5). Thus, the mean transformed coherence between LFPs in the 4–20 Hz band was significantly higher during activation (0.329 ± 0.044) compared with SWA (0.151 ± 0.045; t(7) = 3.401; p = 0.001).
In addition, for each animal and nucleus, we separately averaged the internuclear coherences involving each bipolar electrode and then determined the CV of these mean coherences across the bipolar electrodes in each nucleus. The CVs of the mean internuclear coherences can be used to infer the level of convergence of functional connectivity (see Materials and Methods) (Fig. 2). An ANOVA of the mean coefficient of variation of the internuclear coherence between 4 and 20 Hz, with main effects of state (two levels, SWA and activation) and nucleus (two levels, striatum and GP), showed a significant interaction only between state and nucleus (F(1,7) = 7.126; p = 0.032). Post hoc tests indicated that the CV was indeed significantly greater for GP than for striatum (t(7) = −2.868; p = 0.024) but only during SWA (Fig. 7). The lack of a difference between GP and striatum during activation was attributable to a significant increase (t(7) = −3.699; p = 0.008) in the CV for the striatum during activation compared with SWA (Fig. 7). Thus, there was evidence for convergence of functional connectivity from striatum to GP but only during SWA. Internuclear connectivity changed during activation so that it had a similar distribution in striatum and GP (Fig. 7).
Figure 7.

Changes in coefficient of variations of striatopallidal coherences during activation. The coefficient of variation of the mean internuclear coherences over 4–20 Hz involving each bipolar electrode significantly increases in striatum during activation (#p < 0.01). The coefficient of variation is greater in GP than striatum during SWA but is not different during activation (∗p < 0.05). Data points are mean values in each subject that were then averaged across subjects. Error bars are SEMs.
Coherence between ECoG and basal ganglia LFPs
Finally, we determined whether the change in the pattern of coherence between and within the striatum and GP during activation was secondary to a change in the coherence between the activity in these nuclei and that in frontal cortex. Across all animals, the coherence over the 4–20 Hz band between frontal ECoG and bipolar LFPs in striatum and GP did not change with brain state (Fig. 8A). An ANOVA of the mean transformed coherence between frontal ECoG and BG LFPs over 4–20 Hz, with main effects of state (two levels, SWA and activation) and nucleus (two levels, striatum and GP), revealed no significant main effects or interaction (Fig. 8B). Thus, coherence between and within the striatum and GP during activation was unlikely to be secondary to a systematic change in the coherence between the activity in these nuclei and that in frontal cortex when the whole 4–20 Hz band is considered. This result is in apparent contrast to previous studies, which have demonstrated a change in the coherence between ECoG and pallidal LFPs when the latter were recorded and analyzed in a monopolar configuration across a similar sized group of animals (Magill et al., 2004a; Sharott et al., 2005). The difference may be attributable to several factors. Importantly, different types of synchronized activity may be emphasized in recordings made with monopolar electrodes compared with bipolar electrodes with close contacts. The latter electrodes are likely to cancel out wide-scale synchronization and only pick-up synchronization between small, local populations of neurons. This conclusion is supported by the absence during SWA of large, slow (∼1 Hz) oscillations in bipolar electrode traces (Fig. 3B) and the absence of a peak at slow-wave frequencies (∼1 Hz) in autospectra of striatal and pallidal bipolar LFPs (Fig. 4A). Such activity and spectral peak are clearly evident in BG LFPs recorded with monopolar electrodes, with this wide-scale synchronization being driven from the cortex (Magill et al., 2004a; Sharott et al., 2005). Together, these findings suggest that the LFPs that can be recorded in striatum and GP are the reflections of two types of synchronized activity: (1) synchronized activity that is generated by relatively large populations of neurons and is related to cortical activity; and 2) synchronized activity that is generated by relatively small populations of neurons and is far less related to cortical activity. The relative contribution of each type of activity to any given LFP would be dependent on the underlying neuronal population and the recording method/electrode used. The differences between recording techniques are, however, unlikely to be absolute, and Figure 8A shows that corticostriatal and corticopallidal coherences at slow-wave frequencies (<4 Hz) decrease during activation, in line with previous coherence estimates from monopolar recordings (Magill et al., 2004a; Sharott et al., 2005). For the purposes of the current study, however, the critical finding is that changes in coherence at 4–20 Hz between and within the striatum and GP during activation cannot be ascribed to a systematic change in the coherence between the activity in these nuclei and that in frontal cortex over the same frequency band.
Figure 8.

Brain state-dependent changes in coherence between cortex and basal ganglia LFPs. A, Mean transformed ECoG–LFP coherence during activation minus coherence during SWA for all animals. B, Mean transformed ECoG–LFP coherence over the 4–20 Hz range in both brain states. Error bars in A and B are SEMs.
Discussion
We tested the hypothesis that the core aspects of functional connectivity within the striatopallidal axis predicted by current schemes of BG organization (the existence of parallel independent processing channels, striatopallidal convergence, and lateral integration) are dependent on brain state. During SWA, there was relatively low intranuclear coherence and, thus, little evidence of lateral functional connectivity within the striatum or GP, and the temporal coupling of activity across these two nuclei suggested functional convergence at the level of the GP. This organization markedly changed during stimulus-evoked brain activation, such that prominent lateral functional connectivity developed, particularly within the GP, and convergence in the GP was no longer apparent. The principal differences in functional connectivity in the striatopallidal system during SWA and global activation are schematically summarized (Fig. 9). Although this dramatic functional reorganization occurred without any significant modulation of the coupling between frontal cortex and striatum or GP, it could still reflect the selection of behaviorally relevant cortical input by the striatopallidal system during activation.
Figure 9.
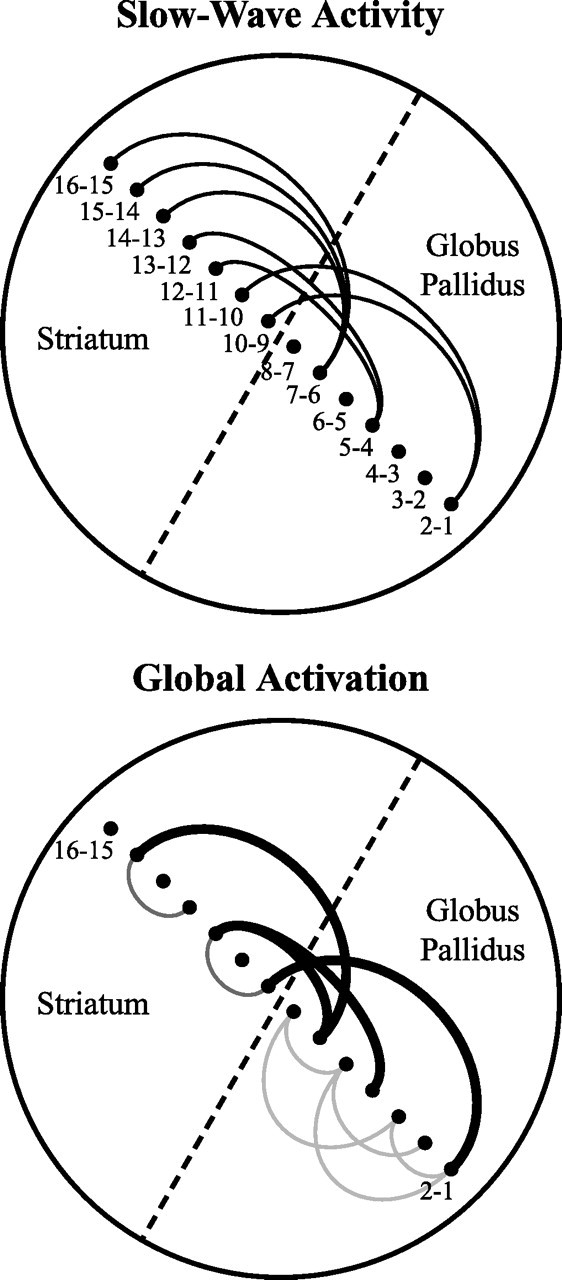
Schematic summary of the principal differences in functional connectivity during slow-wave activity and global activation. Bipolar electrodes (black circles) are numbered according to the contributing recording contacts along the probe, which is set at an angle to the striatopallidal border (dashed line). Black, dark gray, and light gray links represent internuclear, intrastriatal, and intrapallidal connectivity, respectively. Top, During slow-wave activity, local populations of neurons in the striatum and GP exhibit relatively low levels of lateral connectivity and vertical internuclear connectivity but with convergence of striatal connections on GP. Bottom, During activation, the relative internuclear connectivity increases (denoted by wider black links), but convergence is reduced. In addition, lateral connections become more pronounced (denoted by new dark gray and light gray links), particularly within GP in which connectivity increases over larger distances than in striatum.
The interpretation of our findings rests on three assumptions. The first is that LFPs recorded in the striatum and GP do indeed reflect the aggregate activity of locally synchronized neuronal elements, whether presynaptic and/or postsynaptic. The likelihood of this is suggested by the temporal coupling between single-unit or multiunit activity and LFPs recorded in the BG (Levy et al., 2002; Courtemanche et al., 2003; Berke et al., 2004; Goldberg et al., 2004; Magill et al., 2004a,b; Boraud et al., 2005; Kühn et al., 2005; Mallet et al., 2005) and that between intracellular membrane potentials and LFPs (Goto and O'Donnell, 2001). The second assumption is that the patterns of coherence estimated using our bipolar electrodes are relatively free of the effects of volume conduction. The validity of our approach is supported by the fact that activation-related increases in coherence were spatially selective, sparing striatal (but not pallidal) activities separated by longer distances; volume conduction effects would be expected to affect connectivity over similar distances in striatum and GP. The third assumption is that our findings in the anesthetized rat are relevant for our understanding of the physiological mechanisms in the awake, behaving animal. This seems reasonable because the activities of local populations of neurons in the anesthetized animal were coherent at frequencies evident in the LFPs recorded from the striatum of awake rodents (Vorobyov et al., 2003; Berke et al., 2004) and monkeys (Courtemanche et al., 2003). The functional relevance of shifts in oscillatory population activity along the striatopallidal axis, as measured in LFPs, is supported by the demonstration that striatal LFPs are systematically modulated by behavior (Courtemanche et al., 2003; Berke et al., 2004; Gervasoni et al., 2004; Boraud et al., 2005; Fujii and Graybiel, 2005).
Lateral connectivity within the globus pallidus increases during activation
Two of our key findings are that global activation produced a significant increase in the coherence between LFPs separated by distances of 200–400 μm within GP and that the corresponding increase within striatum was limited to a distance of 200 μm (Fig. 9). These findings raise the question of the anatomical substrate(s) and physiological mechanism(s) that might underlie such a difference in lateral functional connectivity. Networks of GABAergic neurons are well equipped for the generation, maintenance, and/or orchestration of synchronized population activity (Buzsáki and Chrobak, 1995; Whittington and Traub, 2003; Buzsáki et al., 2004; Tepper and Bolam, 2004; Fuentealba and Steriade, 2005; Somogyi and Klausberger, 2005). All principal neurons of the GP are GABAergic and give rise to extensive local axon collaterals (Smith et al., 1998). These axon collaterals can extend from the soma for up to 1000 μm and invariably project to areas well outside of the ellipsoid dendritic arborization of the parent cell, which, with a long axis of 800–1000 μm, occupies a relatively large cross-sectional area of the GP in one or more planes (Kita and Kitai, 1994; Bevan et al., 1998; Sadek et al., 2005). The local axon collaterals of striatal projection neurons are more restricted. The axonal collateral plexus rarely extends much further than the more compact, spherical dendritic arbor (300–500 μm diameter) of the parent cell, and plexus density is low at distances >200 μm from the somata (Chang et al., 1981; Bishop et al., 1982; Tepper et al., 2004). Thus, from the anatomical characteristics of the respective principal neurons alone, it could be predicted that distributed networks of GP projection neurons are able to communicate more effectively, and over larger distances, than distributed networks of striatal projection neurons.
In themselves, however, the above anatomical considerations cannot explain why lateral functional connectivity was not as readily apparent in the GP or striatum during SWA. There are three additional considerations of interest in this regard. First, synaptic interactions between striatal projection neurons are generally considered to be weak (Jaeger et al., 1994; Plenz, 2003; Tepper et al., 2004), such that input from a single presynaptic neuron is rarely powerful enough to repeatedly phase lock the activity of the postsynaptic neuron (Tunstall et al., 2002; Koós et al., 2004). The same has been argued for GP neurons, although direct evidence is lacking (Bar-Gad et al., 2003a). Second, synaptic connections in pallidal and striatal circuits may have particular frequency- and pattern-dependent properties (Thomson, 2003) that are changed by neurotransmitters and neuromodulators released during global activation (Stanford and Cooper, 1999; Czubayko and Plenz, 2002; Koós and Tepper, 2002; Plenz, 2003). Third, activity in local axon collaterals may be relatively more synchronized in the activated state, thereby increasing the effectiveness of lateral connectivity. This may represent intrinsic change or follow the increased strength of common inputs from outside of GP. Common inputs from striatum are likely to be particularly important for lateral functional connectivity in GP, as supported by our findings of increased striatopallidal and intrastriatal coherences during activation. Because GP projects to striatum (Bevan et al., 1998), the opposite case may also be true. However, whatever the causes of the increased intranuclear coherence, it is stressed that it calls into question the independence of parallel channels of processing during the activated brain state.
Loss of convergence at the level of the globus pallidus during activation
The pattern of internuclear connectivity also changed during activation, so that the convergent connectivity present during SWA was lost. During activation, internuclear coherence was concentrated at fewer sites across the striatum than during SWA and hence was more variable across this structure, despite the overall increase in internuclear coherence. Thus, during activation, whereas more local populations of GP neurons interacted with one another, striatopallidal interactions were less distributed over the striatum (Fig. 9). We used changes in the CVs of coherences to assess changes in convergence. Although our approach makes empiric sense, it awaits additional validation through application to better characterized systems. In addition, connections within the striatopallidal axis are organized both perpendicular and parallel to the border between striatum and GP. Only the former was studied here, and it would be of interest to study the latter in the future.
Just why striatal functional connectivity with GP may change during activation is unclear. Our finding that the coefficient of variation of coherences increased in striatum but not in GP during activation suggests that striatum was the primary site of functional reorganization. As such, dopamine may play a key role, given that dopamine levels will likely change during activation (Chiodo et al., 1980; Horvitz, 2000; Ungless, 2004) and that the striatum is most densely innervated by dopaminergic terminals (Smith and Kieval, 2000). There are also differences in the actions of dopamine in striatum and GP, and dopamine directly modulates the efficacy of striatal inputs to GP (Cooper and Stanford, 2001). However, although a possibility, direct evidence supporting a role for dopamine in modulating functional connectivity is lacking. Dopamine aside, populations of striatal projection neurons assume prolonged “up states” during activation (Kasanetz et al., 2002), which is also likely to be important because the up state must be reached before firing can occur (Wickens and Wilson, 1998).
In interpreting striatopallidal functional connectivity, we have assumed that such connectivity is direct rather than indirect. It remains to be seen whether brain state-dependent changes in common inputs to both striatum and GP, such as those from the thalamus (Smith et al., 2004), might also contribute to the apparent focusing of striatopallidal coupling on fewer striatal sites. Regardless, the net effect of changes in functional connectivity, whether direct or indirect, is that the convergence of information flow at the level of the GP that is apparent during SWA is lost during activation.
Additional functional considerations
Functional connectivity, as indicated by coherence, is a function of both the number of connections between neuronal ensembles and the relative strength of these connections (Thatcher et al., 1986, 1987; Shen et al., 1999). The former was fixed over the time period of the brain-state transitions examined here. Thus, an important implication of our data is that activation is accompanied by substantial changes in the functional organization of the striatopallidal axis through the alteration of synaptic efficacy. Whether this is subserved by presynaptic and/or postsynaptic mechanisms, and whether it is caused by increased synchronization per se, or just mirrored by increased synchronization, remains to be determined. Nevertheless, the current study demonstrates that the coupling of the synchronized activity of neuronal networks within and between the striatum and GP is dynamic. Our data further suggest that the relative importance of the organizational principles highlighted by different schemes of BG function (the existence of parallel independent processing channels, striatopallidal convergence, and lateral integration) is dependent on brain state.
Footnotes
*P.J.M., A.P., and A.S. contributed equally to this work.
This work was supported by the Medical Research Council (United Kingdom) and the Brain Research Trust. P.J.M. held a Fellowship by Examination at Magdalen College (Oxford, United Kingdom) for part of this study. We thank D. Henze and B. Micklem ARPS for their advice and help with the probe histology. We thank E. Norman, J. O'Neill, T. Senior, and C. Francis for expert technical assistance.
References
- Alexander GE, Crutcher MD (1990). Functional architecture of basal ganglia circuits: neural substrates of parallel processing. Trends Neurosci 13:266–371. [DOI] [PubMed] [Google Scholar]
- Andrew C, Pfurtscheller G (1996). Event-related coherence as a tool for studying dynamic interaction of brain regions. Electroencephalogr Clin Neurophysiol 98:144–148. [DOI] [PubMed] [Google Scholar]
- Bar-Gad I, Heimer G, Ritov Y, Bergman H (2003a). Functional correlations between neighboring neurons in the primate globus pallidus are weak or nonexistent. J Neurosci 23:4012–4016. [DOI] [PMC free article] [PubMed] [Google Scholar]
- Bar-Gad I, Morris G, Bergman H (2003b). Information processing, dimensionality reduction and reinforcement learning in the basal ganglia. Prog Neurobiol 71:439–473. [DOI] [PubMed] [Google Scholar]
- Berke JD, Okatan M, Skurski J, Eichenbaum HB (2004). Oscillatory entrainment of striatal neurons in freely moving rats. Neuron 43:883–896. [DOI] [PubMed] [Google Scholar]
- Bevan MD, Booth PA, Eaton SA, Bolam JP (1998). Selective innervation of neostriatal interneurons by a subclass of neuron in the globus pallidus of the rat. J Neurosci 18:9438–9452. [DOI] [PMC free article] [PubMed] [Google Scholar]
- Bishop GA, Chang HT, Kitai ST (1982). Morphological and physiological properties of neostriatal neurons: an intracellular horseradish peroxidase study in the rat. Neuroscience 7:179–191. [DOI] [PubMed] [Google Scholar]
- Blanche TJ, Spacek MA, Hetke JF, Swindale NV (2005). Polytrodes: high-density silicon electrode arrays for large-scale multiunit recording. J Neurophysiol 93:2987–3000. [DOI] [PubMed] [Google Scholar]
- Boraud T, Brown P, Goldberg JA, Graybiel AM, Magill PJ (2005). Oscillations in the basal ganglia: the good, the bad and the unexpected. In: The basal ganglia VIII (Bolam JP, Ingham CA, Magill PJ, eds) pp. 3–24. New York: Springer Science and Business Media.
- Buzsáki G, Chrobak JJ (1995). Temporal structure in spatially organized neuronal ensembles: a role for interneuronal networks. Curr Opin Neurobiol 5:504–510. [DOI] [PubMed] [Google Scholar]
- Buzsáki G, Draguhn A (2004). Neuronal oscillations in cortical networks. Science 304:1926–1929. [DOI] [PubMed] [Google Scholar]
- Buzsáki G, Geisler G, Henze DA, Wang XJ (2004). Interneuron diversity series: circuit complexity and axon wiring economy of cortical interneurons. Trends Neurosci 27:186–193. [DOI] [PubMed] [Google Scholar]
- Cassidy MJ, Brown P (2003). Spectral phase estimates in the setting of multidirectional coupling. J Neurosci Methods 127:95–103. [DOI] [PubMed] [Google Scholar]
- Chang HT, Wilson CJ, Kitai ST (1981). Single neostriatal efferent axons in the globus pallidus: a light and electron microscopic study. Science 213:915–918. [DOI] [PubMed] [Google Scholar]
- Chiodo LA, Antelman SM, Caggiula AR, Linberry CG (1980). Sensory stimuli alter the discharge rate of dopamine (DA) neurons: evidence for two functional types of DA cells in the substantia nigra. Brain Res 189:544–549. [DOI] [PubMed] [Google Scholar]
- Christakos CN (1997). On the detection and measurement of synchrony in neural populations by coherence analysis. J Neurophysiol 78:3453–3459. [DOI] [PubMed] [Google Scholar]
- Cooper AJ, Stanford IM (2001). Dopamine D2 receptor mediated presynaptic inhibition of striatopallidal GABAA IPSCs in vitro. Neuropharmacology 41:62–71. [DOI] [PubMed] [Google Scholar]
- Courtemanche R, Fujii N, Graybiel AM (2003). Synchronous, focally modulated beta-band oscillations characterize local field potential activity in the striatum of awake behaving monkeys. J Neurosci 23:11741–11752. [DOI] [PMC free article] [PubMed] [Google Scholar]
- Curran-Everett D (2000). Multiple comparisons: philosophies and illustrations. Am J Physiol Regul Integr Comp Physiol 279:R1–R8. [DOI] [PubMed] [Google Scholar]
- Czubayko U, Plenz D (2002). Fast synaptic transmission between striatal spiny projection neurons. Proc Natl Acad Sci USA 99:15764–15769. [DOI] [PMC free article] [PubMed] [Google Scholar]
- Destexhe A, Contreras D, Steriade M (1999). Spatiotemporal analysis of local field potentials and unit discharges in cat cerebral cortex during natural wake and sleep states. J Neurosci 19:4595–4608. [DOI] [PMC free article] [PubMed] [Google Scholar]
- Donoghue JP, Wise SP (1982). The motor cortex of the rat: cytoarchitecture and microstimulation mapping. J Comp Neurol 212:76–88. [DOI] [PubMed] [Google Scholar]
- Engel AK, Singer W (2001). Temporal binding and the neural correlates of sensory awareness. Trends Cogn Sci 5:16–25. [DOI] [PubMed] [Google Scholar]
- Engel AK, Fries P, Singer W (2001). Dynamic predictions: oscillations and synchrony in top-down processing. Nat Rev Neurosci 2:704–716. [DOI] [PubMed] [Google Scholar]
- Fein G, Raz J, Brown FF, Merrin EL (1988). Common reference coherence data are confounded by power and phase effects. Electroencephalogr Clin Neurophysiol 69:581–584. [DOI] [PubMed] [Google Scholar]
- Florian G, Andrew C, Pfurtscheller G (1998). Do changes in coherence always reflect changes in functional coupling? Electroencephalogr Clin Neurophysiol 106:87–91. [DOI] [PubMed] [Google Scholar]
- Fuentealba P, Steriade M (2005). The reticular nucleus revisited: intrinsic and network properties of a thalamic pacemaker. Prog Neurobiol 75:125–141. [DOI] [PubMed] [Google Scholar]
- Fujii N, Graybiel AM (2005). Time-varying covariance of neural activities recorded in stratum and frontal cortex as monkeys perform sequential-saccade tasks. Proc Natl Acad Sci USA 102:9032–9037. [DOI] [PMC free article] [PubMed] [Google Scholar]
- Gervasoni D, Linn S-C, Ribeiro S, Soares ES, Pantoja J, Nicolelis MAL (2004). Global forebrain dynamics predict rat behavioral states and their transitions. J Neurosci 24:11137–11147. [DOI] [PMC free article] [PubMed] [Google Scholar]
- Glaser EM, Ruchkin DS (1976). In: Principles of neurobiological signal analysis New York: Academic.
- Goldberg JA, Rokni U, Boraud T, Vaadia E, Bergman H (2004). Spike synchronization in the cortex/basal ganglia networks of parkinsonian primates reflects global dynamics of the local field potentials. J Neurosci 24:6003–6010. [DOI] [PMC free article] [PubMed] [Google Scholar]
- Gotman J (1983). Measurement of small time differences between EEG channels: method and application to epileptic seizure propagation. Electroencephalogr Clin Neurophysiol 56:501–514. [DOI] [PubMed] [Google Scholar]
- Goto Y, O'Donnell P (2001). Network synchrony in the nucleus accumbens in vivo. J Neurosci 21:4498–4504. [DOI] [PMC free article] [PubMed] [Google Scholar]
- Halliday DM, Rosenberg JR, Amjad AM, Breeze P, Conway BA, Farmer SF (1995). A framework for the analysis of mixed time series/point process data: theory and application to the study of physiological tremor, single motor unit discharges and electromyograms. Prog Biophys Mol Biol 64:237–278. [DOI] [PubMed] [Google Scholar]
- Horvitz JC (2000). Mesolimbocortical and nigrostriatal dopamine responses to salient non-reward events. Neuroscience 96:651–656. [DOI] [PubMed] [Google Scholar]
- Hubbard JI, Llinás R, Quastel DMJ (1969). Extracellular field potentials in the central nervous system. In: Electrophysiological analysis of synaptic transmission pp. 265–293. London: Arnold.
- Jaeger D, Kita H, Wilson CJ (1994). Surround inhibition among projection neurons is weak or nonexistent in the rat neostriatum. J Neurophysiol 72:2555–2558. [DOI] [PubMed] [Google Scholar]
- Kasanetz F, Riquelme LA, Murer MG (2002). Disruption of the two-state membrane potential of striatal neurones during cortical desynchronisation in anaesthetised rats. J Physiol (Lond) 543:577–589. [DOI] [PMC free article] [PubMed] [Google Scholar]
- Kita H, Kitai ST (1994). The morphology of globus pallidus projection neurons in the rat: an intracellular staining study. Brain Res 636:308–319. [DOI] [PubMed] [Google Scholar]
- König P, Engel AK, Singer W (1996). Integrator or coincidence detector? The role of the cortical neuron revisited. Trends Neurosci 19:130–137. [DOI] [PubMed] [Google Scholar]
- Koós T, Tepper JM (2002). Dual cholinergic control of fast-spiking interneurons in the neostriatum. J Neurosci 22:529–535. [DOI] [PMC free article] [PubMed] [Google Scholar]
- Koós T, Tepper JM, Wilson CJ (2004). Comparison of IPSCs evoked by spiny and fast-spiking neurons in the neostriatum. J Neurosci 24:7916–7922. [DOI] [PMC free article] [PubMed] [Google Scholar]
- Kühn AA, Trottenberg T, Kivi A, Kupsch A, Schneider G-H, Brown P (2005). The relationship between local field potential and neuronal discharge in the subthalamic nucleus of patients with Parkinson's disease. Exp Neurol 194:212–220. [DOI] [PubMed] [Google Scholar]
- Levy R, Ashby P, Hutchinson WD, Lang AE, Lozano AM, Dostrovsky JO (2002). Dependence of subthalamic nucleus oscillations on movement and dopamine in Parkinson's disease. Brain 125:1196–1209. [DOI] [PubMed] [Google Scholar]
- Lopez da Silva F, Pijn JP, Boeijinga P (1989). Interdependence of EEG signals: linear vs. nonlinear associations and the significance of time delays and phase shifts. Brain Topogr 2:9–18. [DOI] [PubMed] [Google Scholar]
- Magill PJ, Bolam JP, Bevan MD (2000). Relationship of activity in the subthalamic nucleus–globus pallidus network to cortical electroencephalogram. J Neurosci 20:820–833. [DOI] [PMC free article] [PubMed] [Google Scholar]
- Magill PJ, Bolam JP, Bevan MD (2001). Dopamine regulates the impact of the cerebral cortex on the subthalamic nucleus-globus pallidus network. Neuroscience 106:313–330. [DOI] [PubMed] [Google Scholar]
- Magill PJ, Sharott A, Bevan MD, Brown P, Bolam JP (2004b). Synchronous unit activity and local field potentials evoked in the subthalamic nucleus by cortical stimulation. J Neurophysiol 92:700–714. [DOI] [PubMed] [Google Scholar]
- Magill PJ, Sharott A, Bolam JP, Brown P (2004a). Brain state-dependency of coherent oscillatory activity in the cerebral cortex and basal ganglia of the rat. J Neurophysiol 92:2122–2136. [DOI] [PubMed] [Google Scholar]
- Mallet N, Le Moine C, Charpier S, Gonon F (2005). Feedforward inhibition of projection neurons by fast-spiking GABA interneurons in the rat striatum in vivo. J Neurosci 25:3857–3869. [DOI] [PMC free article] [PubMed] [Google Scholar]
- Middleton FA, Strick PL (2000). Basal ganglia and cerebellar loops: motor and cognitive circuits. Brain Res Brain Res Rev 31:236–250. [DOI] [PubMed] [Google Scholar]
- Mitzdorf U (1985). Current-source density method and application in cat cerebral cortex: investigation of evoked potentials and EEG phenomena. Physiol Rev 65:37–100. [DOI] [PubMed] [Google Scholar]
- Munk MH, Roelfsema PR, König P, Engel AK, Singer W (1996). Role of reticular activation in the modulation of intracortical synchronization. Science 272:271–274. [DOI] [PubMed] [Google Scholar]
- Najafi K, Ji J, Wise KD (1990). Scaling limitations of silicon multichannel recording probes. IEEE Trans Biomed Eng 37:1–11. [DOI] [PubMed] [Google Scholar]
- Neidermeyer E, Lopes da Silva F (1987). In: Electroencephalography: basic principles, clinical applications and related fields Munich: Urban and Schwarzenberg.
- Nunez PL (1995). In: Neocortical dynamics and human EEG rhythms New York: Oxford UP.
- Nunez PL, Srinivasan R, Westdorp AF, Wijesinghe RS, Tucker DM, Silberstein RB, Cadusch PJ (1997). EEG coherency. I. Statistics, reference electrode, volume conduction, Laplacians, cortical imaging, and interpretation at multiple scales. Electroencephalogr Clin Neurophysiol 103:499–515. [DOI] [PubMed] [Google Scholar]
- Nunez PL, Silberstein RB, Shi Z, Carpenter MR, Srinivasan R, Tucker DM, Doran SM, Cadusch PJ, Wijesinghe RS (1999). EEG coherency. II. Experimental comparisons of multiple measures. Clin Neurophysiol 110:469–486. [DOI] [PubMed] [Google Scholar]
- Paxinos G, Watson C (1986). In: The rat brain in stereotaxic coordinates, Ed 2 Sydney: Academic.
- Percheron G, Filion M (1991). Parallel processing in the basal ganglia: up to a point. Trends Neurosci 14:55–59. [DOI] [PubMed] [Google Scholar]
- Percheron G, Francois C, Yelnik J, Fenelon G, Talbi B (1994). The basal ganglia related system of primates: definition, description and informational analysis. In: The basal ganglia IV (Percheron G, McKenzie JS, Féger J, eds) pp. 3–20. New York: Plenum.
- Plenz D (2003). When inhibition goes incognito: feedback interaction between spiny projection neurons in striatal function. Trends Neurosci 26:436–443. [DOI] [PubMed] [Google Scholar]
- Rappelsberger P, Petsche H (1988). Probability mapping: power and coherence analyses of cognitive processes. Brain Topogr 1:46–54. [DOI] [PubMed] [Google Scholar]
- Sadek AR, Magill PJ, Bolam JP (2005). Local connectivity between neurons of the rat globus pallidus. In: The basal ganglia VIII (Bolam JP, Ingham CA, Magill PJ, eds) pp. 611–619. New York: Springer Science and Business Media.
- Shadlen MN, Newsome WT (1994). Noise, neural codes and cortical organization. Curr Opin Neurobiol 4:569–579. [DOI] [PubMed] [Google Scholar]
- Sharott A, Magill PJ, Bolam JP, Brown P (2005). Directional analysis of coherent oscillatory field potentials in the cerebral cortex and basal ganglia of the rat. J Physiol (Lond) 562:951–963. [DOI] [PMC free article] [PubMed] [Google Scholar]
- Shen B, Nadkarni M, Zappulla RA (1999). Spectral modulation of cortical connections measured by EEG coherence in humans. Clin Neurophysiol 110:115–125. [DOI] [PubMed] [Google Scholar]
- Singer W (1993). Synchronization of cortical activity and its putative role in information processing and learning. Annu Rev Physiol 55:349–374. [DOI] [PubMed] [Google Scholar]
- Smith Y, Kieval JZ (2000). Anatomy of the dopamine system in the basal ganglia. Trends Neurosci 23:[Suppl 10], S28–S33. [DOI] [PubMed] [Google Scholar]
- Smith Y, Bevan MD, Shink E, Bolam JP (1998). Microcircuitry of the direct and indirect pathways of the basal ganglia. Neuroscience 86:353–387. [DOI] [PubMed] [Google Scholar]
- Smith Y, Raju DV, Pare JF, Sidibé M (2004). The thalamostriatal system: a highly specific network of the basal ganglia circuitry. Trends Neurosci 27:520–527. [DOI] [PubMed] [Google Scholar]
- Somogyi P, Klausberger T (2005). Defined types of cortical interneurone structure space and spike timing in the hippocampus. J Physiol (Lond) 562:9–26. [DOI] [PMC free article] [PubMed] [Google Scholar]
- Stanford IM, Cooper AJ (1999). Presynaptic μ and δ opioid receptor modulation of GABAa IPSCs in the rat globus pallidus in vitro. J Neurosci 19:4796–4803. [DOI] [PMC free article] [PubMed] [Google Scholar]
- Steriade M (2000). Corticothalamic resonance, states of vigilance and mentation. Neuroscience 101:243–276. [DOI] [PubMed] [Google Scholar]
- Steriade M, Amzica F, Contreras D (1996). Synchronization of fast (30–40 Hz) spontaneous cortical rhythms during brain activation. J Neurosci 16:392–417. [DOI] [PMC free article] [PubMed] [Google Scholar]
- Tepper JM, Bolam JP (2004). Functional diversity and specificity of neostriatal interneurons. Curr Opin Neurobiol 14:685–692. [DOI] [PubMed] [Google Scholar]
- Tepper JM, Koós T, Wilson CJ (2004). GABAergic microcircuits in the neostriatum. Trends Neurosci 27:662–669. [DOI] [PubMed] [Google Scholar]
- Thatcher RW, Krause PJ, Hrybyk M (1986). Cortico-cortical associations and EEG coherence: a two compartmental model. Electroencephalogr Clin Neurophysiol 64:123–143. [DOI] [PubMed] [Google Scholar]
- Thatcher RW, Walker RA, Giudice S (1987). Human cerebral hemispheres develop at different rates and ages. Science 236:1110–1113. [DOI] [PubMed] [Google Scholar]
- Thomson AM (2003). Presynaptic frequency- and pattern-dependent filtering. J Comput Neurosci 15:159–202. [DOI] [PubMed] [Google Scholar]
- Tunstall MJ, Oorschot DE, Kean A, Wickens JR (2002). Inhibitory interactions between spiny projection neurons in the rat striatum. J Neurophysiol 88:1263–1269. [DOI] [PubMed] [Google Scholar]
- Ungless MA (2004). Dopamine: the salient issue. Trends Neurosci 27:702–706. [DOI] [PubMed] [Google Scholar]
- van der Togt C, Lamme VAF, Spekreijse H (1998). Functional connectivity within the visual cortex of the rat shows state changes. Eur J Neurosci 10:1490–1507. [DOI] [PubMed] [Google Scholar]
- Varela F, Lachaux JP, Rodriguez E, Martinerie J (2001). The brainweb: phase synchronization and large-scale integration. Nat Rev Neurosci 2:229–239. [DOI] [PubMed] [Google Scholar]
- Vorobyov VV, Schibaev NV, Morelli M, Carta AR (2003). EEG modifications in the cortex and striatum after dopaminergic priming in the 6-hydroxydopamine rat model of Parkinson's disease. Brain Res 972:177–185. [DOI] [PubMed] [Google Scholar]
- Whittington MA, Traub RD (2003). Interneuron diversity series: inhibitory interneurons and network oscillations in vitro. Trends Neurosci 26:676–682. [DOI] [PubMed] [Google Scholar]
- Wickens JR, Wilson CJ (1998). Regulation of action-potential firing in spiny neurons of the rat neostriatum in vivo. J Neurophysiol 79:2358–2364. [DOI] [PubMed] [Google Scholar]
- Yelnik J (2002). Functional anatomy of the basal ganglia. Mov Disord 17:[Suppl 3], S15–S21. [DOI] [PubMed] [Google Scholar]