

Abstract
Efficient analysis of written words in normal reading is likely to reflect use of neural circuits formed by experience during childhood rather than an innate process. We investigated the cortical sequence of word perception in first-graders (7–8 years old), with special emphasis on occipitotemporal cortex in which, in adults, letter-string-sensitive responses are detected at 150 ms after stimulus. To identify neural activation that is sensitive to either the amount of basic visual features or specifically to letter strings, we recorded whole-head magnetoencephalography responses to words embedded in three different levels of noise and to symbol strings. As was shown previously in adults, activation reflecting stimulus nonspecific visual feature analysis was localized to occipital cortex in children. It was followed by letter-string-sensitive activation in the left occipitotemporal cortex and, subsequently, in the temporal cortex. These processing stages were correlated in timing and activation strength. Compared with adults, however, the timing of activation was clearly delayed in children, and the delay was progressively increased from occipital to occipitotemporal and further to temporal areas. This finding is likely to reflect increasing immaturity of the underlying neural generators when advancing from low-level visual analysis to higher-order areas involved in written word perception. When a salient occipitotemporal letter-string-sensitive activation was detected (10 of 18 children), its strength was correlated with phonological skills, in line with the known relevance of phonological awareness in reading acquisition.
Keywords: children, magnetoencephalography, neuroimaging, occipitotemporal cortex, reading, visual system
Introduction
Reading is an evolutionarily new skill, and thus no “letter-string-specific” neuronal populations are supposed to exist at birth (Liberman, 1992). It appears more likely that certain neural circuits are recruited and specialized for processing linguistically relevant symbols during early reading development. When learning to read, the child must be able to pay attention to subword level units of spoken language such as syllables and phonemes to learn that speech is related to print via a set of rules. Phonological recoding, i.e., grapheme-to-phoneme coding, is the most critical component in learning to read, especially in the early phases of reading acquisition (Share, 1995; Sprenger-Charolles et al., 2003).
Time-sensitive brain-imaging methods [magnetoencephalography (MEG) and electroencephalography (EEG)] have elucidated the cortical dynamics of written word perception in adults (Nobre and McCarthy, 1994; Salmelin et al., 1996; Tarkiainen et al., 1999; Marinkovic et al., 2003; Wydell et al., 2003). When reading isolated words, activation has been found to proceed from basic visual feature (VF) analysis in bilateral occipital cortex at ∼100 ms to analysis of letters/letter strings (LS) in (predominantly left) occipitotemporal cortex within 150–200 ms and finally to analysis of semantic information in the left (and right) temporal lobes (Helenius et al., 1998; Tarkiainen et al., 1999).
These different analysis stages at different time windows are approximately in concordance with theoretical models of reading. Information processing is thought to start with visual feature analysis of letter forms, followed by orthographic processes related to letter identification, lexical–semantic processes related to the meaning of the word, and phonological processes related to the sound structure of the word (Seidenberg and McClelland, 1989; Coltheart et al., 1993).
Hemodynamic [functional magnetic resonance imaging (fMRI) and positron emission tomography] studies of word and letter recognition have also indicated involvement of the left occipitotemporal cortex in orthographic analysis (Petersen et al., 1990; Puce et al., 1996; Pugh et al., 1996; Paulesu et al., 2000; Polk et al., 2002; McCandliss et al., 2003), with the locus of activation in reasonable agreement with that obtained for the 150 ms letter-string-sensitive activation in MEG recordings (Tarkiainen et al., 1999, 2002). Studies on dyslexic adults have shown missing or delayed activation in this area, whereas activations reflecting low-level visual feature analysis seem to be intact (Salmelin et al., 1996; Shaywitz et al., 1998; Helenius et al., 1999). This region and time window thus seem to be critical for successful word perception in adults. Although the importance of occipitotemporal cortex in word and letter perception is well established in adult studies, the functional role of this region in children remains elusive.
Here, we used whole-head MEG to characterize the cortical sequence of activation elicited by written words in first-graders. In particular, we asked whether occipitotemporal activation sensitive to letter strings can be identified in children and whether the timing or strength of this activation is correlated with behavioral estimates of phonological and reading skills. The results of the present study on children were compared with our previous findings on letter-string processing in adults (Tarkiainen et al., 1999).
Materials and Methods
Subjects.
The subjects in the present study were 10 girls and eight boys (7.2–8.0 years); in the following, they are referred to as females 1–10 (f1–f10) and males 1–8 (m1–m8). All subjects were native Finnish speakers recruited from Finnish schools. They were right-handed, had normal vision, and no history of neurological abnormalities. An informed consent was obtained from all subjects (and their parents), in agreement with the previous approval of the Helsinki and Uusimaa Ethics Committee. The children attended the first class of the elementary school and had normal language development. All children participating in the experiment had an average level of reading skills (or above), as screened in the classroom using the comprehension of statements test (TL3: A and B versions) of standardized Elementary School Reading Test battery [ALLU (Lindeman, 1998)] that has been constructed to evaluate the reading status of 7- to 13-year-old Finnish-speaking children. This test consists of three practice and 52 testing trials, each composed of one statement (sentence). The child was asked to read the sentences and decide whether they were true or not (e.g., “Adults eat books”) with a time limit of 5 min. The number of correct answers was measured.
The MEG data on children were compared with data collected from 12 adult subjects, four females and eight males (21–42 years), in our previous study on letter-string perception in adults (Tarkiainen et al., 1999).
Behavioral tests.
The reading skills of each child were additionally evaluated using three more tests. Two of the tests were from the Elementary School Reading Test battery (Lindeman, 1998). The word recognition test (TL2: A version) and the sentence comprehension test (TL4: A version) consist of 4/3 (TL2/TL4, words/sentences) practice trials and 80/20 testing trials. Each trial is composed of a picture that matches one of four written words/sentences. The task is to identify as many correct picture word/sentence pairs as possible in 5/2 min. The total score was the number of correct of 80/20 trials. In the story reading task, the child was given a narrative 55-word story printed on paper and asked to read it aloud in the way he/she usually does in a reading situation (Kajamies et al., 2003). The experimenter recorded the time the child spent on the story and the number of incorrectly read words.
In addition to reading skills, we tested phonological awareness, rapid naming, and phonological memory of each child. The test of phonological awareness consisted of four subtests, each having 10 items (Poskiparta et al., 1994) (for psychometric properties, see Silvén et al., 2004). In syllable deletion, the examiner said aloud a word and asked the child to pronounce the word without a given syllable, the remaining part also forming a word. The deleted syllables were at the end, at the beginning, or in the middle of the original word. In phoneme blending, two- to four-letter words were presented phoneme-by-phoneme, and the child was asked to say aloud the resulting word. In single-phoneme isolation, the child was asked to say aloud the first phoneme/letter of the word. In phoneme deletion, the child was asked to delete the initial phoneme and to say aloud the remaining part, which formed a word. In single-phoneme isolation test, all children identified all initial phonemes correctly (10 of 10) and, therefore, this measure was not included in additional analysis.
Rapid naming tests were used to measure the efficiency of phonological information retrieval from the long-term store. We used two tasks of the Finnish version of the rapid serial naming test (Ahonen et al., 1999), which is based on the Rapid Automatized Naming test by Denckla and Rudel (1976). In the rapid naming of colors and letters, the child named as fast and correctly as possible a series of colored squares and letters, 50 items of each. The speed of naming was measured as the time in seconds to complete each task, and the speed variables were computed (total task duration/50).
Phonological memory/auditory short-term memory was tested using digit span and general linguistic and nonlinguistic abilities using similarities and block design items of the Wechsler Intelligence Scale for Children–Revised (WISC-R) (Wechsler, 1984). Tests were administered 7–10 months after the school entrance.
Stimuli.
Visual degradation of objects by, for example, noise (Malach et al., 1995) or image scrambling (Puce et al., 1996; Grill-Spector et al., 1998) is commonly used for detecting functional specialization within the visual system. Stimuli for the present study were modified from Tarkiainen et al. (1999) to be suitable for children. The paradigm was designed to distinguish between activation that is sensitive to the amount of visual information (basic visual features) and activation that is specifically sensitive to letter strings. The stimuli were (1) four-letter words embedded in three different levels of Gaussian noise and (2) symbol strings (SS) with no noise (Fig. 1). In the letter-string patches, the luminance of each pixel (both the word written in black and the gray background) was varied randomly. The amount of variation was taken from a Gaussian distribution with 0 mean; the SD determining the applied noise level was set at 0, 12, and 24 (word 0, word 12, word 24). Accordingly, the mean luminance in the stimuli was kept unchanged, but the parametrically added local luminance contrast increased the visual complexity of the stimuli. This created a three-step continuum in which the number of visual features was highest in the noisiest patches (word 24), whereas the visibility of the letter strings was highest in the noiseless patches (word 0).
Figure 1.
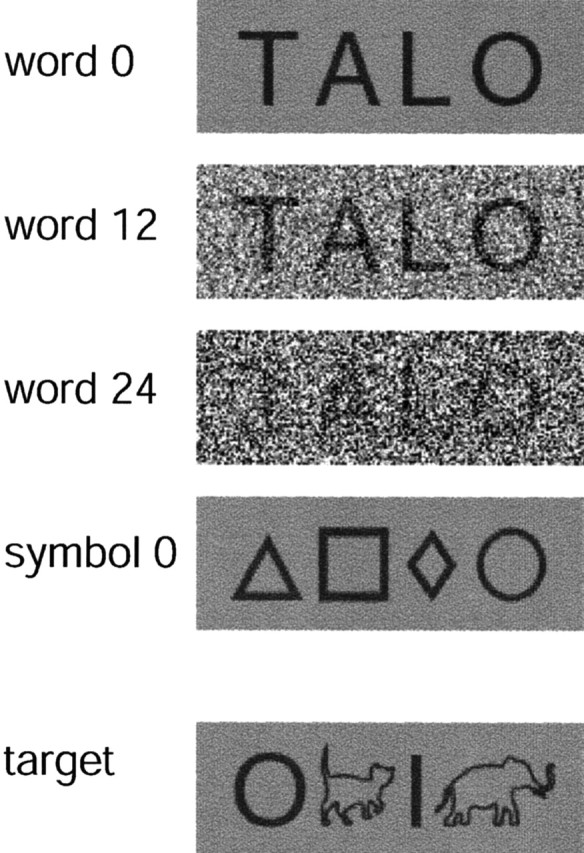
Stimulus types. The stimuli were four-letter words embedded in three different levels of Gaussian noise (word 0, word 12, and word 24) and symbol strings with no noise (symbol 0). Animal figures presented among symbols were used as targets.
Brain areas involved in object-invariant visual feature analysis should display increased activity with increasing noise level, whereas areas preferentially activated by letter strings should show increased activity as the noise is decreased and the words are easier to discern. Noiseless symbol strings (symbol 0) served as a nonlinguistic control for the letter strings, being visually equally complex but having no linguistic significance. In addition to the experimental stimuli, we used target strings in which animals were presented among symbols. Targets were always presented without noise. In the adult paradigm (Tarkiainen et al., 1999), the words were embedded in four levels of noise (0, 8, 16, and 24), and there were also plain Gaussian noise patches without embedded figures.
Measurement procedure.
Before the measurement, the child practiced the task in front of a computer screen. She/he had to pay attention to the stimuli and press a button whenever an animal was presented on the screen. All children learned the task easily. The measurement was conducted in a magnetically shielded room. The stimuli were presented for 100 ms, every 2 s, on a screen placed at a distance of 1 m. Words, symbols, and targets (7%) were presented in a randomized sequence in two sessions, 7.5 min each. There was always an adult with the child in the measurement room.
Magnetic measurements and data analysis.
The magnetic signals were recorded using a whole-head neuromagnetometer (Vectorview; Elekta Neuromag Oy, Helsinki, Finland) with two planar gradiometers and one magnetometer in 102 locations. The MEG signals were bandpass filtered at 0.03–200 Hz, sampled at 600 Hz, and averaged on-line from 200 ms before stimulus onset to 800 ms after it. The horizontal and vertical electro-oculograms were recorded for on-line rejection of epochs contaminated by blinks or saccades. On average, 60 artifact-free epochs were gathered and averaged separately for each of the four stimulus categories (word 0, word 12, word 24, and symbol 0).
In the adult study, the magnetic signals were recorded using a whole-head neuromagnetometer (Neuromag-122; Elekta Neuromag Oy). The temporal sampling and amplitude calibration of the two neuromagnetometers have been verified by the manufacturer to be practically identical, thus allowing direct comparison of data collected with these two systems. For verification, they used a standard test phantom with artificial sources of precisely known locations, strengths, and time courses. The comparability of the two MEG systems has also been tested experimentally by Cornelissen et al. (2003), who found no differences in latency or amplitude of cortical responses to visually presented four-letter words when the data were recorded with the Neuromag-122 device or the Vectorview device. The preprocessing and source analysis of the magnetic signals in the present study were conducted in the same way as for the original adult data.
For localization of the activated brain areas, the position of the subject's head within the MEG helmet needs to be defined. For this purpose, four head-position indicator coils were attached to the subject's head. The location of these coils was determined with respect to three anatomical landmarks (nasion, preauricular reference points) and, at the beginning of the MEG recording, with respect to the measurement helmet. In the off-line analysis of the data, a spherical estimation was used to describe the conductivity profile of the brain. Because structural MR images were not available for the healthy children in the present study, we used an average sphere model of all female adult subjects in our MRI archive. The sphere models constructed for female brains, on average, have been found to match well (within 5 mm) with the sphere models generated from MR images of the small number of children (6–11 years) studied previously in our laboratory for medical diagnosis/treatment. Small variations in the parameters of the sphere model do not significantly affect source localization (Tarkiainen et al., 2003).
The signals detected with MEG are generated by synchronous activation in the apical dendrites of pyramidal cells (Hämäläinen et al., 1993). MEG is most sensitive to activation in the fissural cortex. The activated brain areas were modeled using equivalent current dipoles (ECDs) (Hämäläinen et al., 1993). An ECD represents the mean location of an active cortical patch and the activation strength and direction of current flow in this area. Separately for each subject, the magnetic field patterns were visually inspected to identify local dipolar fields, and sensors covering each of these patterns were chosen to calculate isolated ECDs. These ECDs were incorporated into a multidipole model in which the locations and orientations of the dipoles were fixed but their strengths were allowed to vary in time to best explain the signals recorded by all sensors over the entire analysis interval. The number of dipoles in the multidipole model varied from 6 to 10 per subject. A single set of dipoles accounted for the activation patterns in all four stimulus conditions.
To search for visual feature and letter-string activation as demonstrated previously in adults, we used the procedure introduced by Tarkiainen et al. (1999) and modified by Helenius et al. (1999) for a reduced stimulus set. After determining the multidipole model for each subject, the time course of activation in each source area was tested for differences in source strength between words with lowest and highest noise (word 0 vs word 24) and between noiseless words and symbols (word 0 vs symbol 0). A source area was considered to be involved in basic visual feature analysis if the peak activation was statistically significantly stronger for the noisiest words than clearly visible words (word 24 > word 0) and symbols (word 24 > symbol 0), i.e., activation was stronger for items with a larger number of contrast borders. The difference was required to exceed 1.96 times the SD in the prestimulus interval (−200 ms to stimulus onset), corresponding to a significance level of p < 0.05. Correspondingly, a source was considered to reflect preference for letter-string stimuli if it showed significantly stronger activation for clearly visible words than noisiest words (word 0 > word 24) and also for clearly visible words than symbols (word 0 > symbol 0). To be accepted as reflecting either visual-feature-specific activation or letter-string-specific activation, the ECD had to show a clear peak for the relevant category (word 24 or word 0, respectively).
To estimate the overall level of activity in the left occipitotemporal cortex at group level, we also computed the areal means of signal strength from 24 sensors (12 gradiometer sensor pairs) over the left occipitotemporal cortex of each subject. The signals from each gradiometer sensor pair were squared and summed together, and a square root was calculated from the resulting signal. The vector sums were averaged across the selected set of sensors.
Statistical analysis.
A repeated-measures mixed-model ANOVA, with noise level (24, 12, 0) or stimulus type (word, symbol) as within-subject factor and gender (male, female) as between-subjects factor, was used to evaluate systematic effects in activation strength and latency for different stimulus types in children. The differences in the activation strength and latency between children and adults were tested with independent samples t test, after determining the normality of the data with Shapiro–Wilks test. To measure the correlation between cortical activation patterns (strength and latency), we computed the Pearson's correlation coefficient. For correlation between cortical measures and behavioral performance, we computed Spearman's rank correlation because most of the behavioral measures did not follow the normal distribution.
Results
The behavioral results are summarized in Table 1 (left). All children had normal (or better) general cognitive skills (WISC-R) (Wechsler, 1984). The overall reading level was within or above the age-normal range [ALLU; mean score of word and sentence recognition and sentence comprehension (Lindeman, 1998)]. Nevertheless, the speed of reading a passage of narrative text aloud (Kajamies et al., 2003) varied substantially between individuals, from 0.5 to 6.6 s/word. A measure of phonological awareness was obtained as an average across three tests: syllable deletion, phoneme blending, and phoneme deletion (Poskiparta et al., 1994); the subjects' performance varied from 7 to 10, 6 to 10, and 5 to 10 (max of 10), respectively. Naming speed of colors varied from 0.8 to 1.8 s/item and that of letters from 0.5 to 1.0 s/item (Ahonen et al., 1999); results of both tests fell within normal limits.
Table 1.
Summary of the behavioral results and the presence of different source types in individual children sorted by reading level
| Behavioral measures | Cortical measures | |||||||||
|---|---|---|---|---|---|---|---|---|---|---|
| Early visual feature source | Early letter-string source | Early symbol-string source | Late letter-string source | |||||||
| Male/female subjects | Reading levela | Reading speedb | Phonol awarenessc | Naming lettersd | WISC-Re | L/R | L | L | L | R |
| m1 | 9 | 0.5 | 9.67 | 0.5 | 14 | × | × | |||
| f1 | 9 | 0.7 | 10.00 | 0.6 | 9 | × | × | × | × | × |
| m2 | 8 | 0.6 | 10.00 | 0.6 | 15 | × | × | × | × | |
| m3 | 8 | 1.3 | 9.33 | 0.6 | 10 | × | × | × | × | |
| f2 | 8 | 0.9 | 10.00 | 0.8 | 11 | × | ||||
| f3 | 8 | 1.5 | 8.00 | 0.6 | 12 | × | × | × | ||
| f4 | 8 | 1.2 | 10.00 | 0.6 | 11 | × | × | |||
| f5 | 7 | 1.1 | 9.67 | 0.6 | 12 | × | × | × | × | |
| f6 | 7 | 1.5 | 8.67 | 0.8 | 10 | × | × | × | × | |
| f7 | 6 | 1.8 | 9.33 | 0.7 | 12 | × | × | × | ||
| f8 | 6 | 1.1 | 7.67 | 0.8 | 9 | × | × | × | ||
| m4 | 6 | 2.3 | 9.67 | 0.8 | 9 | × | × | × | ||
| m5 | 5 | 2.0 | 9.33 | 0.7 | 11 | × | × | × | × | |
| m6 | 5 | 2.4 | 8.33 | 0.7 | 10 | × | × | × | × | |
| m7 | 5 | 2.6 | 9.67 | 0.6 | 11 | × | × | |||
| f9 | 5 | 2.6 | 7.00 | 10 | × | |||||
| f10 | 4 | 6.6 | 9.00 | 1.0 | 11 | × | × | |||
| m8 | 4 | 5.0 | 8.67 | 1.0 | 10 | × | ||||
L, Left hemisphere; R, right hemisphere.
aTested with ALLU [Comprehensive School Reading Test battery (Lindeman, 1998)]: 1–3, difficulties in reading; 4–6, age group mean; 7–9, above age group mean.
bIn seconds per word (Kajamies et al., 2003).
cAverage over three tests, with a maximum of 10 points (Poskiparta et al., 1994).
dAge group mean ± SD, 0.7 ± 0.2 s/letter (Ahonen et al., 1999).
eAverage over three tests; age group mean ± SD, 10 ± 3 scores (Wechsler, 1984).
Figure 2a depicts the MEG responses of one child, subject m5, to the noiseless and the noisiest words (word 0 and word 24). Three selected sensors are shown enlarged. The sensor over the occipital region shows strongest response to stimuli with highest noise level. For a slightly later signal more anteriorly over the left hemisphere, the pattern is reversed and the response is stronger for the noiseless words. Still later, there is a strong response to noiseless words over the left temporal lobe.
Figure 2.
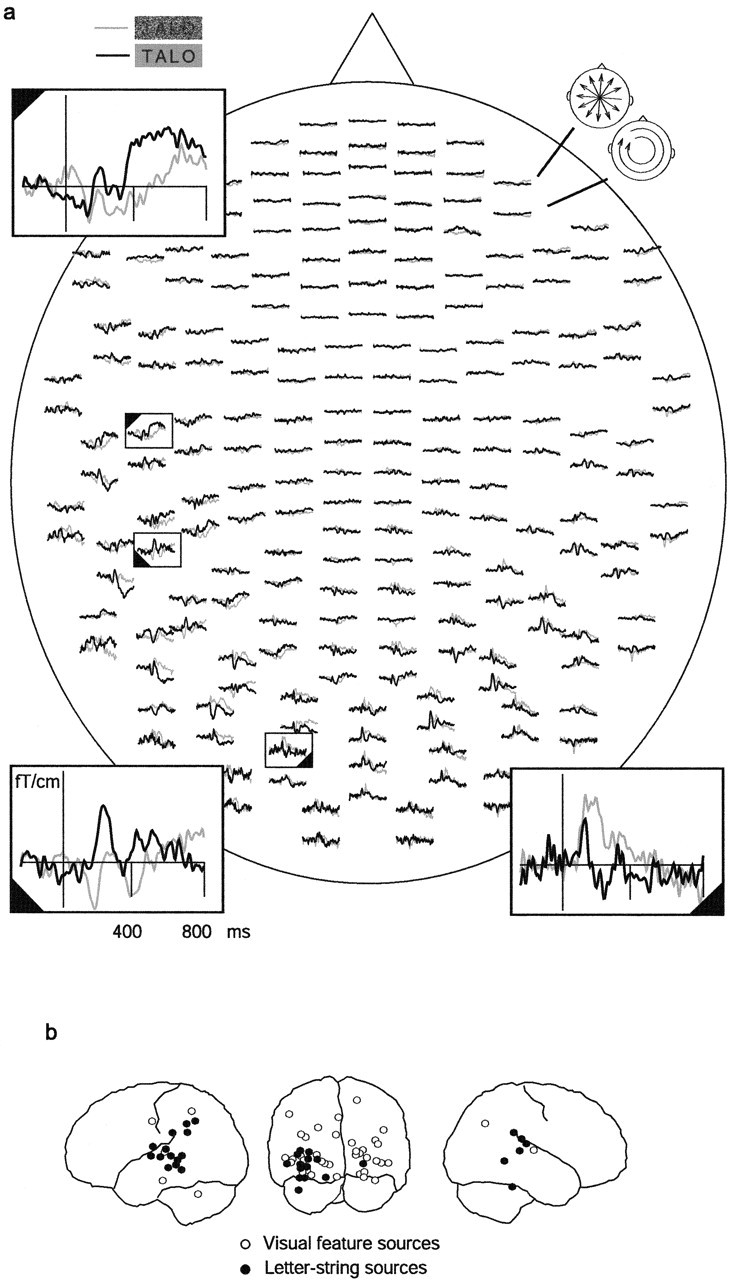
MEG signals and underlying source areas. a, Distribution of MEG signals in the individual sensors to the noisiest (gray line) and noiseless (black line) words, in one child (subject m5). The signals were averaged from −200 to 800 ms with respect to the stimulus onset. The measurement helmet is viewed from above, flattened onto a plane, with the nose pointing upward. The 204 planar gradiometers of the Vectorview system are arranged in 102 locations along the helmet. At each location, there are two orthogonally oriented sensors, with the top and bottom curve depicting the output of the gradiometer most sensitive to longitudinally and latitudinally oriented currents (schematic heads in the top right corner), respectively. Three selected sensors (rectangles) are shown enlarged, illustrating the varying stimulus dependence of the signal picked by different sensors in different time windows. b, Brain areas generating the MEG response were localized using current dipoles, and the amplitude curve of each dipole was tested for significant differences between the noisiest (word 24) and noiseless (word 0) words and symbol strings (symbol 0). All sources from all children that were accepted as reflecting visual feature analysis (word 24 > word 0 and symbol 0; white circles) or letter-string analysis (word 0 > word 24 and symbol 0; black circles) are illustrated on a schematic brain.
Figure 2b displays all sources that passed the test for visual feature (white circles) or letter-string (black circles) analysis from all 18 children. VF sources, i.e., sources that showed strongest activation for noisiest words, were distributed predominantly in the occipital lobe. LS sources, i.e., sources that showed strongest activation for noiseless words, were clustered to the left occipitotemporal cortex and to the left and right temporal lobes. Although there was individual variability in timing, a clear spatiotemporal sequence was evident in the source activations. The majority of the posterior VF sources (90%) showed maximum activation between 90 and 360 ms (median, 140 ms; n = 39) and the majority of the posterior LS sources between 135 and 280 ms (median, 205 ms; n = 14). LS sources in the left and right temporal cortices became active clearly later and reached the maximum between 257 and 630 ms (median, 465 ms; n = 21).
Based on these time windows and spatial clusters, the additional analysis was focused on three types of responses: early VF activation in the occipital cortex, early LS activation in the left occipitotemporal cortex, and late LS activation (LLS) in the left (and right) temporal cortex. If a subject had multiple sources in one of these source areas, the earliest one was chosen for additional statistical analysis.
There was also an additional type of systematic behavior in the source waveforms. Some source areas showed a significantly stronger response to the noiseless than the noisiest words (word 0 > word 24) but an equal or weaker response to words than symbols (word 0 ≤ symbol 0). Activation of these SS sources was thus stronger for noiseless than noisy stimulus strings but did not show sensitivity for letter strings. They were distributed widely in both posterior and anterior brain regions. At least one SS source was found in 16 of 18 subjects, but, because they showed substantial variation in location and timing, they were not included in the statistical analysis.
Visual feature sources in children
At least one VF source was found in 16 of 18 measured children (range of one to six sources; mean of two). There were no gender differences in the number of sources. Figure 3a displays the selected VF sources (one per child) across all children and the mean time course of activation of these sources to the noiseless words, noisiest words, and symbol strings. Activation reached the maximum at 121 ± 21 ms (mean ± SD) for the noisiest words and at 105 ± 19 ms for noiseless words after stimulus presentation. The timing of VF activation was relatively constant across the children (Fig. 4). In 13 of 16 subjects, the source waveform showed a second (or more) peak(s) at later time windows. All of the statistics were calculated for the first peak.
Figure 3.
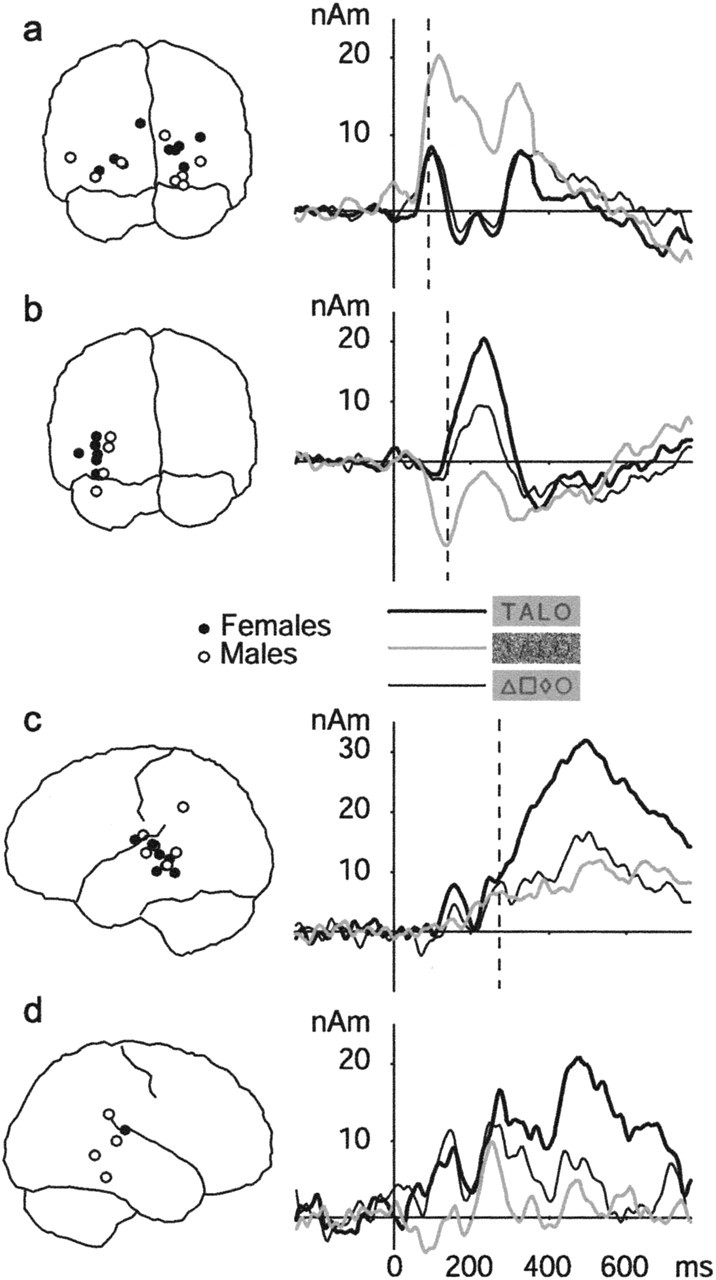
Location and timing of activation for visual word perception in children. The spatial distribution (left column) and mean time course of activation (right column) of the occipital visual feature sources (a), left occipitotemporal letter-string sources (b), and left and right temporal letter-string sources (c, d) are shown. Black and white circles represent sources of female and male subjects, respectively. The responses to the noisiest words, noiseless words, and symbol strings are plotted with different line types. The mean timing of the corresponding activations in adults (Helenius et al., 1999; Tarkiainen et al., 1999) is marked with a dashed line.
Figure 4.

Timing of activation in children (black) and in adults (gray). The peak latency for the occipital VF response, the occipitotemporal LS response, and the left temporal LLS response is depicted for individual subjects. The responses of the same subject are connected with a line.
Table 2 summarizes the mean ± SD values for the different conditions, separately for the female and male subject groups. The VF activation strength and latency increased significantly with increasing noise level, similarly for both genders [3 (noise level) × 2 (gender) ANOVA; main effect of noise level for activation strength, F(2,28) = 36.3, p < 0.001; response latency, F(2,28) = 15.0, p < 0.001]. There was no difference between noiseless words and symbols in amplitude or latency [2 (stimulus types) × 2 (gender) ANOVA].
Table 2.
Strengths and latencies (mean ± SD) of the responses in children in the three source areas (occipital VF, occipitotemporal LS, and left temporal LLS) for symbol strings and words with noise levels 0, 12, and 24, separately for the female and male subjects
| Activation strength (nAm) | Peak latency (ms) | |||||||||||
|---|---|---|---|---|---|---|---|---|---|---|---|---|
| VF | LS | Left LLS | VF | LS | Left LLS | |||||||
| Males | Females | Males | Females | Males | Females | Males | Females | Males | Females | Males | Females | |
| Word 0 | 12 ± 8 | 10 ± 7 | 21 ± 7 | 7 ± 14 | 39 ± 15 | 40 ± 19 | 100 ± 18 | 109 ± 20 | 221 ± 39 | 226 ± 26 | 543 ± 97 | 472 ± 94 |
| Word 12 | 15 ± 11 | 16 ± 10 | 9 ± 6 | 20 ± 11 | 34 ± 27 | 36 ± 15 | 117 ± 14 | 111 ± 13 | 242 ± 36 | 234 ± 29 | 531 ± 108 | 510 ± 119 |
| Word 24 | 33 ± 17 | 21 ± 8 | −4 ± 4 | 4 ± 7 | 23 ± 17 | 22 ± 11 | 117 ± 17 | 126 ± 24 | 240 ± 40 | 241 ± 32 | 533 ± 148 | 594 ± 131 |
| Symbol | 15 ± 9 | 9 ± 5 | 8 ± 5 | 17 ± 10 | 27 ± 19 | 22 ± 11 | 108 ± 20 | 107 ± 26 | 209 ± 49 | 234 ± 23 | 545 ± 126 | 550 ± 109 |
Early letter-string sources in children
Figure 3b (left) displays the selected LS sources in children. At least one LS source was found in 10 of 18 subjects (range of one to two sources; mean of one; similarly for both genders). The sources were clustered to the left occipitotemporal cortex. In two subjects, LS sources were found also in the right occipitotemporal cortex, reaching the maximum later than the left-hemisphere sources of the same subject. The mean time course of activation in the selected LS sources is plotted in Figure 3b (right). The activation peaked at 226 ± 30 ms for words with no noise but showed somewhat more interindividual variability in timing than the preceding VF source (Fig. 4). The activation strength of LS sources increased with decreasing noise level, similarly for both genders (Table 2) [3 (noise levels) × 2 (gender) ANOVA; main effect of noise level, F(2,16) = 46.8, p < 0.001].
Figure 5 shows the areal mean signals, i.e., the average of the signals in sensors over the left occipitotemporal cortex, averaged across the 10 subjects in whom an LS source was identified (Fig. 5a) and across the eight subjects in whom no such source was found (Fig. 5b). Both groups showed a clear and equally strong response at ∼200 ms. However, only the former group displayed a difference between words and symbols.
Figure 5.
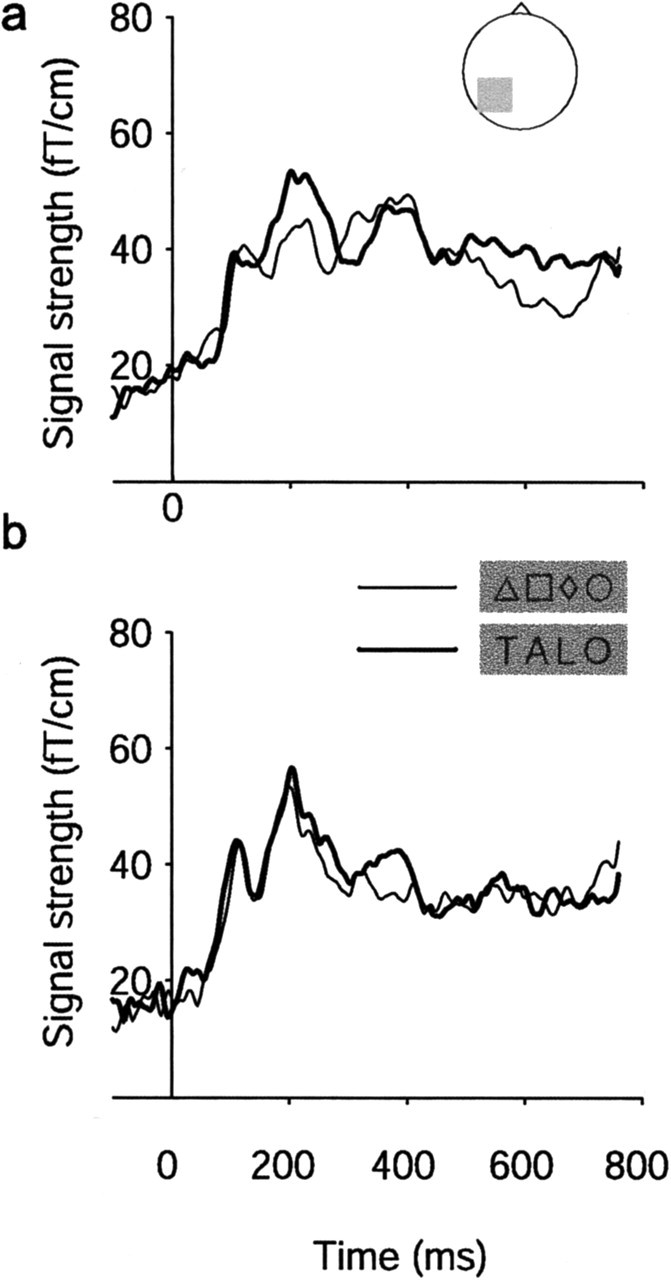
Signal strength over the left occipitotemporal cortex in children. The areal mean signal of the left occipitotemporal responses to noiseless letter strings (thick line) and symbol strings (thin line) in those subjects who showed an occipitotemporal letter-string response (a; n = 10) and in those subjects who did not show the response (b; n = 8) is shown.
Late letter-string sources in children
A sustained activation in the left and right temporal cortex, sensitive to visible words, started at ∼400 ms, peaked at 505 ± 100 ms (in the left hemisphere), and lasted until 800 ms (Fig. 3c,d), with large interindividual variation in timing (Fig. 4). In 13 of 18 subjects, LLS sources were found in the left hemisphere and, in 6 of 18 subjects, in the right hemisphere.
The sustained activation was characterized by its maximum amplitude and the duration of activation, defined as the full width of the activation at half the maximum amplitude. Both the activation strength and duration increased with better visibility of the words (main effect of noise level, maximum amplitude, F(2,22) = 10.7, p < 0.001; duration, F(2,22) = 11.9, p < 0.001). The onset of the LLS activa-tion was delayed with increasing noise (F(2,22) = 5.1, p < 0.05). There were no gender differences.
Of those 10 subjects who had an occipitotemporal LS response, eight had an LLS activation in the left temporal cortex and five had an LLS activation additionally in the right temporal cortex.
Comparison of activation patterns between children and adults
In adults, 9 of 12 subjects showed early visual-feature-sensitive activation in occipital cortex (Tarkiainen et al., 1999). This activation peaked at 101 ± 14 ms for the noisiest words and at 92 ± 12 ms for the noiseless words. In 10 of 12 subjects, there was early letter-string-sensitive activation in left occipitotemporal cortex, peaking at 140 ± 11 ms. Three subjects showed letter-string-sensitive activation (also) in the right occipitotemporal cortex. Sustained letter-string-sensitive activation in the left temporal cortex was found in 8 of 12 subjects, and it peaked at 278 ± 47 ms for these short high-frequency words.
Figure 4 shows the peak latencies of the three activation types (occipital visual feature activation and occipitotemporal and left temporal letter-string activation) in each individual subject for both children and adults. Compared with adults, the timing of activation in children was progressively delayed when advancing from occipital (difference of 12 ms, NS), to occipitotemporal (difference of 84 ms, t(11.5) = −8.3, p < 0.001), and further to temporal (difference of 227 ms, t(19) = −6.1, p < 0.001) source areas.
The activation strength in children was ∼1.4, 1.5, and 2 times as strong as that in adults (Helenius et al., 1999; Tarkiainen et al., 1999) in the occipital, occipitotemporal, and temporal source areas, respectively (on average, 11 vs 8 nAm in occipital, 25 vs 17 nAm in occipitotemporal and 40 vs 19 nAm in temporal source area). The difference was significant only in the left temporal source area (t(19) = −3.2, p < 0.01).
Correlation between cortical activation patterns in children
There was a significant positive correlation between the VF and LS activations in both timing and activation strength (latency, r = 0.65, p < 0.05; amplitude, r = 0.75, p < 0.05 for words with no noise) (Fig. 6a,b). In addition, the strength of the sustained LLS activation in the temporal cortex increased with increasing strength of the preceding occipitotemporal LS activation (r = 0.79, p < 0.05 for words with no noise) (Fig. 6c), and there was a similar trend for the latency (r = 0.62, p = 0.1). Thus, subjects tended to show concordant activation strength and timing along the sequence from occipital visual feature analysis to occipitotemporal and further to temporal letter-string analysis. The VF and sustained LLS activations were not directly correlated in either amplitude or latency.
Figure 6.
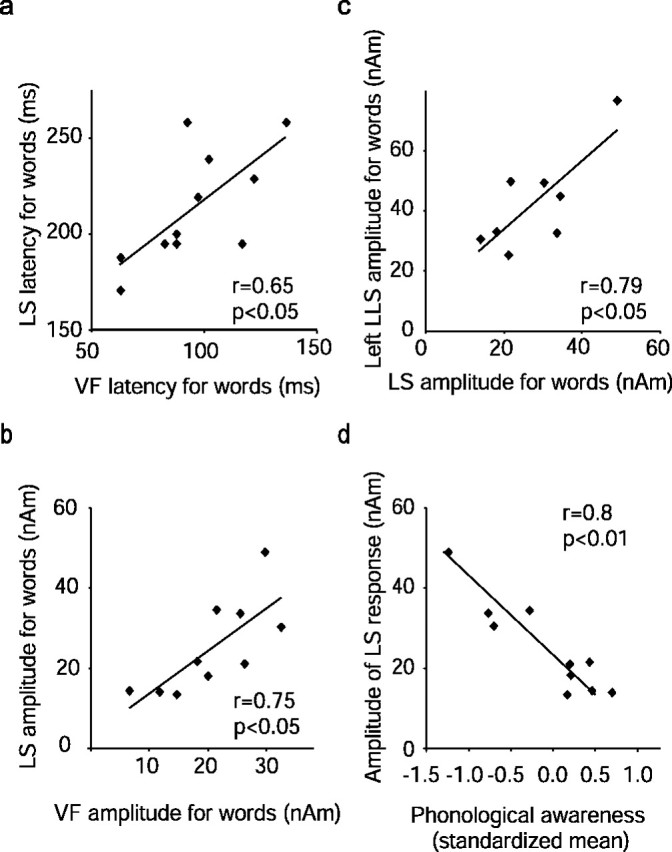
Correlation between the different source areas and between cortical activation and behavioral scores in children. a–c, Latency (a) and amplitude (b) of the occipital VF response plotted against the latency and amplitude of the left occipitotemporal LS response (LS) and amplitude of the LS response plotted against the amplitude of the left temporal LLS response (c). All measures are for noiseless words. d, Amplitude of the occipitotemporal LS response plotted against standardized mean of tests measuring phonological awareness.
Correlation between cortical responses and behavioral measures in children
Table 1 summarizes the behavioral results across individual subjects and the presence of occipital VF, occipitotemporal LS, and temporal LLS sources in individual subjects. The presence or absence of any particular source type was not coupled with specific behavioral skills.
For those subjects who showed LS activation in the occipitotemporal cortex, the strength of the response to words was negatively correlated with phonological skills (r = −0.78, p < 0.01); subjects with better phonological skills (standardized mean over phoneme awareness tests) had smaller LS amplitudes (Fig. 6d).
Age was correlated with response latencies in LS activation (r = 0.9, p < 0.001); older children showed longer latencies. However, this result must be interpreted with caution, because the age of children varied only within 8 months. Reading skills or other linguistic skills were not correlated with age.
Discussion
We studied beginning readers using stimuli that can dissociate between stimulus nonspecific visual feature analysis and letter-string-sensitive analysis. The overall cortical sequence of activation in children was similar to that shown previously in adults (Tarkiainen et al., 1999): responses sensitive to the amount of visual features were found in occipital areas, and responses sensitive to word-likeness of the stimuli were found in the occipitotemporal and temporal areas. However, some marked differences emerged. First, the overall timing of activations was clearly delayed in children. Second, although occipital sources reflecting visual feature analysis were found in nearly all children, only half of them showed the subsequent letter-string activation in the occipitotemporal cortex. In adults, letter-string responses are detected in almost every subject (10 of 12) (Tarkiainen et al., 1999). The presence of the occipitotemporal letter-string response was not directly linked to reading skills. However, for those children who had the response, the strength of activation showed interesting correlation with an essential subcomponent of reading, namely, phonological skills.
Most of the children (80%) showing occipitotemporal letter-string activation also displayed the later sustained temporal activation for words. The covariation between the occipital visual feature and occipitotemporal letter-string activations and between the occipitotemporal and sustained left temporal letter-string activations implies functional connectivity between these three areas in perception of visual words and uniquely illustrates how maturing nervous system with larger interindividual variance enables examination of phenomena that are not necessarily accessible in mature systems.
Visual response latency and amplitude differences in children versus adults
Longer latencies and stronger activation in children than adults are in line with previous EEG (Licht et al., 1988; Grossi et al., 2001) and MEG (Simos et al., 2001) reports. Interestingly, our results demonstrated that the difference in cortical timing between children and adults increased when the activation proceeded from basic visual feature analysis to occipitotemporal letter-string analysis and, further, to sustained letter-string activation in the temporal cortex. Furthermore, the interindividual variability in timing increased toward the later response components. Increased delay in the response timing in children versus adults, when advancing from low-level visual analysis to letter-string-sensitive analysis, is likely to reflect increasing immaturity of the neuronal generators with increasing latency and functional complexity. This idea is supported by the observation that neuronal development in humans (e.g., synapse elimination) approximately reflects the sequence from primary sensory cortices to higher-level association areas (Huttenlocher and de Courten, 1987; Huttenlocher and Dabholkar, 1997). Differences in cognitive skill (reading fluency) between adults and children could also contribute to this latency difference in neural activation beyond primary responses. It is, however, difficult to tell apart changes caused by maturation versus cognitive development in the activation of neural populations, because the plastic changes in neural systems are always influenced by environmental input. Importantly, whatever the influencing factors in the progressive increase of the cortical delay may be, the correlated activation between these three areas indicates that their development is not independent.
Occipitotemporal letter-string-sensitive responses in children
The first visual-evoked response component in the adult brain that has been shown to reflect letter-string-sensitive activation, as distinct from stimulus nonspecific visual feature activation, arises from the (left) occipitotemporal cortex at 150–200 ms (Nobre et al., 1994; Salmelin et al., 1996; Helenius et al., 1999; Tarkiainen et al., 1999, 2002). In beginning readers, the response characteristics of the occipitotemporal letter-string-evoked responses have not been studied before. Previous MEG studies conducted on children have focused on higher-level linguistic processes (Simos et al., 2000, 2002); the lack of nonlinguistic control stimuli precluded the possibility to examine early activation sensitive to letter strings over other visual symbols.
A recent fMRI study on children (<9 years) reported stronger activation to words than false fonts in the left posterior temporal cortex but no difference in occipital/occipitotemporal visual areas (Turkeltaub et al., 2003). In hemodynamic measures, however, the rapidly decaying transients without an associated sustained neural activation may go undetected (for neural vs BOLD signal comparison, see Logothetis et al., 2001). Indeed, the transient category-related neural response for faces at ∼200 ms was shown recently to contribute little to the hemodynamic response in fusiform cortex, whereas the later sustained response in the same area was modulated similarly as the hemodynamic response (Furey et al., 2006).
In the absence of relevant reference data on category-specific analysis of letter strings in children, cortical analysis of faces may provide useful information. The adult occipitotemporal cortex shows letter-string and face-sensitive responses with identical timing (Allison et al., 1994; Tarkiainen et al., 2002). The face-sensitive response has been detected also in children, but it shows strong maturational changes in timing during childhood and adolescence (Taylor et al., 2004). An EEG study in children (8–10 years) reported early visual analysis at 155 ms and face-sensitive analysis at 223 ms (Henderson et al., 2003), thus clearly later than in adults and in agreement with our present findings on letter-string analysis. Because most of the studies report group level results, it is not known whether the category-specific responses to faces are found in all individuals in a given age group. In the present study, occipitotemporal letter-string-sensitive responses were detected in approximately half of the 8-year-old children. Although the children possessed basic reading skills and the sensitivity in the neural response had emerged, the latencies were markedly longer than in adults, indicating that the system is still under maturation.
The other half of the children were behaviorally equally competent in reading, but early letter-string-sensitive activation was not detected. Clearly, it was not attributable to lack of occipitotemporal activation per se (compare with Fig. 5) but rather lack of sensitivity of the visual responses. It is also worth noting that, if the letter-string-sensitive effect is very small, it could be masked by the preceding occipital activation, which is considerably longer lasting than that in adults.
Letter-string response and learning to read
A hypothesis of “visual tuning” for language (McCandliss et al., 2003) suggests that the left occipitotemporal region would be tuned to visual features of letters during massive exposure to printed words. The involvement of this region in reading is supported by fMRI studies on dyslexic children: occipitotemporal activation was found to be positively correlated with performance in pseudoword reading (Shaywitz et al., 2002) and affected by phonological training (Shaywitz et al., 2004). These findings imply association between activation of the occipitotemporal cortex and reading skills but do not reveal, more specifically, whether this neural activation reflects specialization for word/letter-string perception in children.
Our results indicate that, in children with normal reading ability, the mere presence of letter-string-sensitive MEG response in occipitotemporal cortex does not directly predict the level of reading skills or vice versa. Nevertheless, because only half of the children showed letter-string-sensitive sources in occipitotemporal cortex, it seems to be less likely to find letter-string-sensitive activation in occipitotemporal cortex of beginning readers than in fluently reading adults.
The present MEG results imply two processes that are reflected in activation of the left occipitotemporal cortex. One is the emergence of a distinction between language (letter-strings) and nonlanguage (symbol-strings) stimuli, which does not seem to be directly tied to reading competence. In addition, we observed that increase in phonological skills was accompanied with a decrease in the amplitude of the left occipitotemporal letter-string-sensitive response, which thus approached adult values.
Behaviorally, phonological skills correlate highly with reading skills, especially in the early phases of reading acquisition (Wagner and Torgesen, 1987), and phonological awareness is a prerequisite for learning of orthographic information (Adams, 1990; Share, 1995). Thus, it is not surprising that phonological skills may correlate with processing of written words at the neural level as well. The decrease in amplitude in occipitotemporal cortex could reflect a more mature state of synaptic connections and enhanced information processing resulting from interaction between auditory (phonological) and visual (orthographic) input. During postnatal development, maturation of neurons is proposed to depend on connections to other neurons and their activation patterns (Johnson, 2001; Hua and Smith, 2004). Repeated exposure to specific auditory/visual features may sharpen the neuronal response so that eventually only the neurons that are sensitive to the critical, distinctive properties of the stimulus are activated, and the mean firing rate is decreased, similar to what has been proposed in the case of perceptual priming (Desimone, 1996; Wiggs and Martin, 1998). This hypothesis, however, requires additional research to clarify how activity-dependent modification of connections at the neural and synaptic level is manifested in strength/latency of the evoked responses measured from outside the skull.
According to some theoretical accounts of learning to read, after acquiring reasonable grapheme–phoneme coding skills, only very few exposures to the visual word forms are required to learn the orthographic representation of a word (Share, 2004). This view is in line with behavioral results (Aghababian and Nazir, 2000) showing that an adult-like pattern of word recognition, measured with the number of fixations to a word, is reached rapidly (within 8 months) after exposure to text; additional reading experience mainly reduces the duration the words have to be fixated, without changing the overall pattern of performance. This time estimate matches the duration of formal teaching received by the children in our study. Based on the present MEG data and these behavioral findings, it seems that the general spatiotemporal organization of brain activation and word recognition skills can develop rapidly after exposure to printed material to resemble the patterns seen in adults, but with marked differences especially in timing.
Footnotes
This work was supported by the Finnish Cultural Foundation, Ella and Georg Ehrnrooth Foundation, Sigrid Juselius Foundation, and Centre of Excellence Programmes 2000-2005 and 2006-2011 of the Academy of Finland. We thank Antti Tarkiainen for providing the stimulus materials and the original data on adults. We also thank Mia Illman for the help in the MEG recordings and Prof. Heikki Lyytinen for useful comments on this manuscript. Most importantly, we thank all of the children, their parents, and the personnel of Revontuli, Jousenkaari, and Seppo elementary schools for pleasant collaboration.
References
- Adams M (1990). In: Beginning to read, thinking and learning about print London: MIT.
- Aghababian V, Nazir TA (2000). Developing normal reading skills: aspects of the visual processes underlying word recognition. J Exp Child Psychol 76:123–150. [DOI] [PubMed] [Google Scholar]
- Ahonen T, Tuovinen S, Leppäsaari T (1999). In: Nopean sarjallisen nimeämisen testi Jyväskylä, Finland: Haukkarannan koulu, Niilo Mäki Instituutti.
- Allison T, McCarthy G, Nobre A, Puce A, Belger A (1994). Human extrastriate visual cortex and the perception of faces, words, numbers, and colors. Cereb Cortex 4:544–554. [DOI] [PubMed] [Google Scholar]
- Coltheart M, Curtis B, Atkins P, Haller M (1993). Models of reading aloud: dual-route and parallel-distributed-processing approaches. Psychol Rev 100:589–608. [Google Scholar]
- Cornelissen P, Tarkiainen A, Helenius P, Salmelin R (2003). Cortical effects of shifting letter position in letter strings of varying length. J Cogn Neurosci 15:731–746. [DOI] [PubMed] [Google Scholar]
- Denckla MB, Rudel RG (1976). Rapid “automatized” naming (R.A.N): dyslexia differentiated from other learning disabilities. Neuropsychologia 14:471–479. [DOI] [PubMed] [Google Scholar]
- Desimone R (1996). Neural mechanisms for visual memory and their role in attention. Proc Natl Acad Sci USA 93:13494–13499. [DOI] [PMC free article] [PubMed] [Google Scholar]
- Furey ML, Tanskanen T, Beauchamp M, Avikainen S, Uutela K, Hari R, Haxby JV (2006). Dissociation of face-selective cortical responses by attention. Proc Acad Natl Sci USA 103:1065–1070. [DOI] [PMC free article] [PubMed] [Google Scholar]
- Grill-Spector K, Kushnir T, Hendler T, Edelman S, Itzchak Y, Malach R (1998). A sequence of object-processing stages revealed by fMRI in the human occipital lobe. Hum Brain Mapp 6:316–328. [DOI] [PMC free article] [PubMed] [Google Scholar]
- Grossi G, Coch D, Coffey-Corina S, Holcomb PJ, Neville HJ (2001). Phonological processing in visual rhyming: a developmental ERP study. J Cogn Neurosci 13:610–625. [DOI] [PubMed] [Google Scholar]
- Hämäläinen M, Hari R, Ilmoniemi RJ, Knuutila L, Lounasmaa OV (1993). Magnetoencephalography: theory, instrumentation, and applications to noninvasive studies of the working human brain. Rev Mod Physics 65:413–497. [Google Scholar]
- Helenius P, Salmelin R, Service E, Connolly JF (1998). Distinct time courses of word and context comprehension in the left temporal cortex. Brain 121:1133–1142. [DOI] [PubMed] [Google Scholar]
- Helenius P, Tarkiainen A, Cornelissen P, Hansen PC, Salmelin R (1999). Dissociation of normal feature analysis and deficient processing of letter-strings in dyslexic adults. Cereb Cortex 9:476–483. [DOI] [PubMed] [Google Scholar]
- Henderson RM, McCulloch DL, Herbert AM (2003). Event-related potentials (ERPs) to schematic faces in adults and children. Int J Psychophysiol 51:59–67. [DOI] [PubMed] [Google Scholar]
- Hua JY, Smith SJ (2004). Neural activity and the dynamics of central nervous system development. Nat Neurosci 7:327–332. [DOI] [PubMed] [Google Scholar]
- Huttenlocher PR, Dabholkar AS (1997). Regional differences in synaptogenesis in human cerebral cortex. J Comp Neurol 387:167–178. [DOI] [PubMed] [Google Scholar]
- Huttenlocher PR, de Courten C (1987). The development of synapses in striate cortex of man. Hum Neurobiol 6:1–9. [PubMed] [Google Scholar]
- Johnson MH (2001). Functional brain development in humans. Nat Rev Neurosci 2:475–483. [DOI] [PubMed] [Google Scholar]
- Kajamies A, Poskiparta E, Annevirta T, Dufva M, Vauras M (2003). In: YTTE. Luetun ja kuullun ymmärtämisen ja lukemisen sujuvuuden arviointi Turku, Finland: University of Turku, Centre for Learning Research.
- Liberman AMFrost R, Katz L (1992). The relation of speech to reading and writing. In: Orthography, phonology, morphology and meaning pp. 167–178. Amsterdam: North Holland Publishers, Elsevier.
- Licht R, Bakker DJ, Kok A, Bouma A (1988). The development of lateral event-related potentials (ERPs) related to word naming: a four year longitudinal study. Neuropsychologia 26:327–340. [DOI] [PubMed] [Google Scholar]
- Lindeman J (1998). In: ALLU: Ala-asteen Lukutesti Turku, Finland: University of Turku, Center for Learning Research.
- Logothetis NK, Pauls J, Augath M, Trinath T, Oeltermann A (2001). Neurophysiological investigation of the basis of the fMRI signal. Nature 412:150–157. [DOI] [PubMed] [Google Scholar]
- Malach R, Reppas JB, Benson RR, Kwong KK, Jiang H, Ledden PJ, Brady TJ, Rosen BR, Tootell RBH (1995). Object-related activity revealed by functional magnetic resonance imaging in human occipital cortex. Proc Natl Acad Sci USA 92:8135–8139. [DOI] [PMC free article] [PubMed] [Google Scholar]
- Marinkovic K, Dhond RP, Dale AM, Glessner M, Carr V, Halgren E (2003). Spatiotemporal dynamics of modality-specific and supramodal word processing. Neuron 38:487–497. [DOI] [PMC free article] [PubMed] [Google Scholar]
- McCandliss BD, Cohen L, Dehaene S (2003). The visual word form area: expertise for reading in the fusiform gyrus. Trends Cogn Sci 7:293–299. [DOI] [PubMed] [Google Scholar]
- Nobre AC, McCarthy G (1994). Language-related ERPs: scalp distributions and modulations by word type and semantic priming. J Cogn Neurosci 6:233–255. [DOI] [PubMed] [Google Scholar]
- Nobre AC, Allison T, McCarthy G (1994). Word recognition in the human inferior temporal lobe. Nature 372:260–263. [DOI] [PubMed] [Google Scholar]
- Paulesu E, McCrory E, Fazio F, Menoncello L, Brunswick N, Cappa SF, Cotelli M, Cossu G, Corte F, Lorusso M, Pesenti S, Gallagher A, Perani D, Price C, Frith CD, Frith U (2000). A cultural effect on brain function. Nat Neurosci 3:91–96. [DOI] [PubMed] [Google Scholar]
- Petersen SE, Fox PT, Snyder AZ, Raichle ME (1990). Activation of extrastriate and frontal cortical areas by visual words and word-like stimuli. Science 249:1041–1044. [DOI] [PubMed] [Google Scholar]
- Polk TA, Stallcup M, Aguirre GK, Alsop DC, D'Esposito M, Detre JA, Farah MJ (2002). Neural specialization for letter recognition. J Cogn Neurosci 14:145–159. [DOI] [PubMed] [Google Scholar]
- Poskiparta E, Niemi P, Lepola J (1994). In: Diagnostiset testit 1. Lukeminen ja kirjoittaminen Turku, Finland: University of Turku, Centre for Learning Research.
- Puce A, Allison T, Asgari M, Gore JC, McCarthy G (1996). Differential sensitivity of human visual cortex to faces, letterstrings, and textures: a functional magnetic resonance imaging study. J Neurosci 16:5205–5215. [DOI] [PMC free article] [PubMed] [Google Scholar]
- Pugh KR, Shaywitz BA, Shaywitz SE, Constable RT, Skudlarski P, Fulbright RK, Bronen RA, Shankweiler DP, Katz L, Fletcher JM, Gore JC (1996). Cerebral organization of component processes in reading. Brain 119:1221–1238. [DOI] [PubMed] [Google Scholar]
- Salmelin R, Service E, Kiesilä P, Uutela K, Salonen O (1996). Impaired visual word processing in dyslexia revealed with magnetoencephalography. Ann Neurol 40:157–162. [DOI] [PubMed] [Google Scholar]
- Seidenberg MS, McClelland JL (1989). A distributed, developmental model of word recognition and naming. Psychol Rev 96:523–568. [DOI] [PubMed] [Google Scholar]
- Share DL (1995). Phonological recoding and self-teaching: sine qua non of reading acquisition. Cognition 55:151–218. discussion 219–226. [DOI] [PubMed] [Google Scholar]
- Share DL (2004). Orthographic learning at a glance: on the time course and developmental onset of self-teaching. J Exp Child Psychol 87:267–298. [DOI] [PubMed] [Google Scholar]
- Shaywitz SE, Shaywitz BA, Pugh KR, Fulbright RK, Constable RT, Mencl WE, Shankweiler DP, Liberman AM, Skudlarski P, Fletcher JM, Katz L, Marchione KE, Lacadie C, Gatenby C, Gore JC (1998). Functional disruption in the organization of the brain for reading in dyslexia. Proc Natl Acad Sci USA 95:2636–2641. [DOI] [PMC free article] [PubMed] [Google Scholar]
- Shaywitz BA, Shaywitz SE, Pugh KR, Mencl WE, Fulbright RK, Skudlarski P, Constable RT, Marchione KE, Fletcher JM, Lyon GR, Gore JC (2002). Disruption of posterior brain systems for reading in children with developmental dyslexia. Biol Psychiatry 52:101–110. [DOI] [PubMed] [Google Scholar]
- Shaywitz BA, Shaywitz SE, Blachman BA, Pugh KR, Fulbright RK, Skudlarski P, Mencl WE, Constable RT, Holahan JM, Marchione KE, Fletcher JM, Lyon GR, Gore JC (2004). Development of left occipitotemporal systems for skilled reading in children after a phonologically-based intervention. Biol Psychiatry 55:926–933. [DOI] [PubMed] [Google Scholar]
- Silvén M, Poskiparta E, Niemi P (2004). The odds of becoming a precocious reader in Finnish. J Educ Psychol 96:152–164. [Google Scholar]
- Simos PG, Breier JI, Fletcher JM, Bergman E, Papanicolaou AC (2000). Cerebral mechanisms involved in word reading in dyslexic children: a magnetic source imaging approach. Cereb Cortex 10:809–816. [DOI] [PubMed] [Google Scholar]
- Simos PG, Breier JI, Fletcher JM, Foorman BR, Mouzaki A, Papanicolaou AC (2001). Age-related changes in regional brain activation during phonological decoding and printed word recognition. Dev Neuropsychol 19:191–210. [DOI] [PubMed] [Google Scholar]
- Simos PG, Fletcher JM, Foorman BR, Francis DJ, Castillo EM, Davis RN, Fitzgerald M, Mathes PG, Denton C, Papanicolaou AC (2002). Brain activation profiles during the early stages of reading acquisition. J Child Neurol 17:159–163. [DOI] [PubMed] [Google Scholar]
- Sprenger-Charolles L, Siegel LS, Bechennec D, Serniclaes W (2003). Development of phonological and orthographic processing in reading aloud, in silent reading, and in spelling: a four-year longitudinal study. J Exp Child Psychol 84:194–217. [DOI] [PubMed] [Google Scholar]
- Tarkiainen A, Helenius P, Hansen PC, Cornelissen PL, Salmelin R (1999). Dynamics of letter string perception in the human occipitotemporal cortex. Brain 122:2119–2132. [DOI] [PubMed] [Google Scholar]
- Tarkiainen A, Cornelissen PL, Salmelin R (2002). Dynamics of visual feature analysis and object-level processing in face versus letter-string perception. Brain 125:1125–1136. [DOI] [PubMed] [Google Scholar]
- Tarkiainen A, Liljeström M, Seppä M, Salmelin R (2003). The 3D topography of MEG source localization accuracy: effects of conductor model and noise. Clin Neurophysiol 114:1977–1992. [DOI] [PubMed] [Google Scholar]
- Taylor MJ, Batty M, Itier RJ (2004). The faces of development: a review of early face processing over childhood. J Cogn Neurosci 16:1426–1442. [DOI] [PubMed] [Google Scholar]
- Turkeltaub PE, Gareau L, Flowers DL, Zeffiro TA, Eden GF (2003). Development of neural mechanisms for reading. Nat Neurosci 6:767–773. [DOI] [PubMed] [Google Scholar]
- Wagner RK, Torgesen JK (1987). The nature of phonological processing and its causal role in the acquisition of reading skills. Psychol Bull 101:192–212. [Google Scholar]
- Wechsler D (1974). In: Wechsler Intelligence Scale for Children–Revised: manual Finnish translation, Psykologien Kustannus Oy, 1984 New York: Psychological Corporation.
- Wiggs CL, Martin A (1998). Properties and mechanisms of perceptual priming. Curr Opin Neurobiol 8:227–233. [DOI] [PubMed] [Google Scholar]
- Wydell TN, Vuorinen T, Helenius P, Salmelin R (2003). Neural correlates of letter-string length and lexicality during reading in a regular orthography. J Cogn Neurosci 15:1052–1062. [DOI] [PubMed] [Google Scholar]