

Abstract
We recorded the optical intrinsic signal response of squirrel monkey primary somatosensory cortex (SI) to 25 Hz vibrotactile (“flutter”) stimulation applied independently to the thenar eminence on each hand and also to bilateral (simultaneous) stimulation of both thenars. The following observations were obtained in every subject (n = 5). (1) Ipsilateral stimulation was accompanied by an increase in absorbance within the SI hand region substantially smaller than the absorbance increase evoked by contralateral stimulation. (2) The absorbance increase evoked by simultaneous bilateral stimulation was smaller (by ∼30%) than that evoked by contralateral stimulation. (3) The spatiointensive pattern of the SI response to bilateral flutter was distinctly different than the pattern that accompanied contralateral flutter stimulation: with contralateral flutter, the center of the responding region of SI underwent a large increase in absorbance, whereas absorbance decreased in the surrounding region; in contrast, during bilateral flutter, absorbance decreased (relative to that evoked by contralateral flutter) in the central region of SI but increased in the surround. The results raise the possibility that somatosensory perceptual experiences specific to bimanual tactile object exploration derive, at least in part, from the unique spatiointensive activity pattern evoked in SI when the stimulus makes contact with both hands. It is suggested that modulatory influences evoked by ipsilateral thenar flutter stimulation reach SI via a two-stage pathway involving interhemispheric (callosal) connections between information processing levels higher than SI and subsequently via intrahemispheric (corticocortical) projections to the SI hand region.
Keywords: ipsilateral, bilateral, somatosensory cortex, somatosensory, cerebral cortex, SI
Introduction
The activity a stimulus evokes in skin mechanoreceptive afferents is projected at short latency and with great security to neurons in the middle laminas of primary somatosensory cortex (SI) in the contralateral hemisphere. Additionally, imaging and neurophysiological studies (in monkeys, Iwamura et al., 2001; Lipton et al., 2006; in humans, Allison et al., 1989a,b; Korvenoja et al., 1995; Nihashi et al., 2005; Hlushchuk et al., 2006) described modifications of SI (area 3b) activity in response to input evoked by either mechanical stimulation of an ipsilateral skin site or electrical stimulation of an ipsilateral peripheral nerve. Human investigations have shown that ipsilateral input can modify the SI response to a subsequent contralateral stimulus. Schnitzler et al. (1995), using magnetoencephalography (MEG), reported that concurrent tactile stimulation of the ipsilateral hand enhances the response of SI to stimulation of the contralateral median nerve. Conversely, (1) Korvenoja et al. (1995) reported that the SI activation (detected using MEG) evoked by contralateral median nerve stimulation is suppressed during ipsilateral hand movement, (2) functional magnetic resonance imaging studies in both monkeys (Lipton et al., 2006) and humans (Hlushchuk et al., 2006) showed that an ipsilateral skin stimulus evokes CNS actions that partially suppress the SI response to a contralateral stimulus, (3) destruction of SI in one hemisphere (rats) was shown to be accompanied by the appearance (in the opposite SI) of neurons with bilateral receptive fields [interpreted to indicate that SI activity exerts a suppressive influence on SI neurons in the opposite hemisphere (Pluto et al., 2005)], and (4) low-frequency transcranial magnetic stimulation of sensorimotor cortex (in humans, Pal et al., 2005) was found to reduce excitability in the opposite hemisphere. Viewed collectively, these findings raise the possibility that the response of the SI hand region to a tactile stimulus (and thus the stimulus-evoked perceptual experience) may be subject to modulatory influences arising from the ipsilateral hand.
The concept of the SI (especially area 3b) hand region as a processor of tactile information arising exclusively in contralateral skin mechanoreceptors has coexisted with the idea that fusion of tactile information from the two hands occurs at a relatively early stage of cortical information processing. Casual observation makes it evident that concurrent and/or sequential tactile stimulation of the hands is the frequent result of subject-initiated motor behaviors (e.g., bimanual tactile exploration), and experimentation has shown that such stimulation underlies perceptual capacities of considerable adaptive value. Examples are the abilities to (1) categorize and discriminate tactile patterns that engage both hands (Craig, 1985; Craig and Qian, 1997), (2) detect and discriminate the direction and velocity of stimuli that move sequentially or simultaneously over the two hands (Essick and Whitsel, 1988), and (3) compare the frequencies of vibrotactile stimuli applied to bilateral sites on the distal forelimbs or hindlimbs (Harris et al., 2001).
This study used the optical intrinsic signal (OIS) imaging method to evaluate the impact of ipsilateral stimulation on SI tactile information processing. More specifically, we determined the effects of 25 Hz vibrotactile (“flutter”) stimulation of the ipsilateral thenar eminence on the SI response to an identical stimulus applied contralaterally. The results suggest that the effect of ipsilateral input to tactile information processing in the SI hand region is substantial and provide clues about the underlying neural mechanisms.
Materials and Methods
Subjects and preparation.
Adult squirrel monkeys (males and females; n = 5) were subjects. All surgical procedures were performed under deep general anesthesia (1–4% halothane in a 50:50 mixture of oxygen and nitrous oxide). After induction of general anesthesia, the trachea was intubated with a soft tube; a polyethylene cannula was inserted in the femoral vein to allow administration of drugs and fluids (5% dextrose and 0.9% NaCl). A 1.5-cm-diameter opening was made in the skull overlying SI cortex, a chamber was mounted to the skull over the opening with dental acrylic, and the dura overlying SI was incised and removed. After completion of the surgical procedures, all wound margins were infiltrated with long-lasting local anesthetic, and skin and muscle incisions were closed with sutures, dressed with topical local anesthetic, and bandaged.
At 1–3 h before the image data acquisition phase of the experiment, the subject was immobilized by intravenous infusion of Norcuron (vecuronium; 15 μg · kg−1 · h−1) and ventilated with a gas mixture (a 50:50 mix of oxygen and nitrous oxide; supplemented with 0.1–1.0% halothane when necessary) delivered via a positive pressure respirator. Respirator rate and volume were adjusted to maintain end-tidal CO2 between 3.0 and 4.0%; EEG and autonomic signs (slow-wave content, heart rate, etc.) were monitored continuously and titrated (by adjustments of the anesthetic gas mixture) to maintain levels consistent with general anesthesia. Rectal temperature was maintained (using a heating pad) at 37.5°C. The animals were killed by intravenous injection of pentobarbital (45 mg/kg) and by intracardial perfusion with saline followed by fixative (10% Formalin). After the perfusion, a tissue block was removed that contained the cortical region from which images were obtained and placed in fixative. After adequate fixation, each cortical tissue block was serially sectioned, and the sections were mounted and stained to demonstrate cortical cytoarchitecture.
All experimental procedures were reviewed and approved in advance by an institutional committee and are in full compliance with current National Institutes of Health policy on animal welfare.
Stimuli and stimulus protocols.
Precisely controlled sinusoidal vertical skin displacement stimulation [25 Hz, 200 μm, stimulus duration of 5 s, interstimulus interval of 60 s (“skin flutter”)] was delivered using two servocontrolled transducers (Cantek Enterprises, Canonsburg, PA). The probe of each stimulator was advanced (using micropositioners) so that, in the absence of stimulation, the probe of each stimulator indented the skin by 500 μm, i.e., each stimulator probe was advanced 500 μm from the point at which it made initial contact with the skin. Skin contact was detected and signaled by the force transducer and readout circuitry of each servocontroller.
The flutter stimuli were delivered (1) independently to each member of a pair of mirror-symmetric ipsilateral and contralateral skin sites and (2) simultaneously to the two sites (bilateral stimulation). Stimulus sites were located on the center of the thenar eminence. The sinusoidal contralateral and ipsilateral components of each bilateral flutter stimulus always were in-phase and synchronized so that the two stimuli started and stopped at the same time. The contralateral, ipsilateral, and bilateral skin flutter stimuli were delivered in the same run and interleaved on a trial-by-trial basis.
OIS imaging.
The imaging system consisted of a computer-interfaced CCD camera (Quantix 540; Roper Scientific, Trenton, NJ), light source, guide and filters required for near-infrared (833 nm) illumination of the cortical surface, a focusing device, and a recording chamber capped by an optical window (for additional details concerning procedures and apparatus see, Tommerdahl et al., 1999a,b). Images of the exposed cortical surface were acquired 200 ms before stimulus onset (“reference images”) and continuously thereafter for 22 s after stimulus onset (“poststimulus images”) at a rate of one image every 0.9–1.4 s. Exposure time for each image was 200 ms. Difference images were generated by subtracting each prestimulus image from its corresponding poststimulus image. Averaged OIS difference images typically show regions of both increased light absorption (decreased reflectance) and decreased light absorption (increased reflectance) believed widely (Grinvald, 1985; Grinvald et al., 1991) to be accompanied by neuronal activation and inhibition, respectively. Use of near-infrared illumination minimizes the contributions to OIS images of the changes in cerebral cortical blood flow and flow/volume that normally accompany neuronal activation, and thus reflects the spatial location of stimulus-evoked changes in neuronal activity more accurately than do images obtained at lower wavelengths (Ba et al., 2002). Every difference image was examined before generation of summary graphics or statistical analyses. Any image containing random high-amplitude noise was eliminated, and the remaining images obtained under a given stimulus condition (never fewer than 15; all obtained during the same run) were averaged to improve the signal-to-noise ratio of the response to that stimulus. Image analysis was performed using custom routines written in Matlab (MathWorks, Natick, MA).
Histological procedures/identification of cytoarchitectural boundaries.
After adequate fixation, the tissue block containing the imaged cortical region was cryoprotected, frozen, and sectioned serially at 30 μm, and the sections were stained with cresyl fast violet. The boundaries between adjacent cytoarchitectonic areas were identified by scanning individual sagittal sections separated by no more than 300 μm and were plotted at high resolution using a microscope with a drawing tube attachment. The resulting plots were used to reconstruct a two-dimensional surface map of the cytoarchitectonic boundaries within the region studied. As the final step, the cytoarchitectonic boundaries were mapped onto the images of the stimulus-evoked intrinsic signal obtained from the same subject, using fiducial points (made by postmortem applications of India ink or by needle stabs) as well as morphological landmarks (e.g., blood vessels and sulci evident in both the optical images and histological sections). Locations of cytoarchitectonic boundaries were identified using established criteria (Powell and Mountcastle, 1959a,b; Jones and Porter, 1980).
Results
The response of SI in the right hemisphere to vibrotactile stimulation of a site on each hand (center of thenar eminence) was studied in five squirrel monkeys. The goal in each experiment/subject was to assess the influence, if any, of ipsilateral stimulation on the response evoked from the mirror-symmetric contralateral skin site.
The patterns of absorbance change recorded in the hand representational region of SI in two of the five subjects are shown in Figure 1. The grayscale average difference images in rows 1 and 3 of Figure 1 show not only the response of the SI hand region to each of the three conditions of skin flutter stimulation (i.e., contralateral, bilateral, and ipsilateral) but also the spatiointensive pattern of absorbance values recorded in the same SI region in the absence of intentional stimulation (control). Visual inspection of these grayscale images reveal that, in both exemplary subjects, (1) the magnitude of the response to contralateral flutter exceeds by far the response to flutter stimulation of the mirror-symmetric ipsilateral skin site, and (2) although differences between the responses to contralateral versus bilateral skin flutter can be discerned, they are relatively subtle.
Figure 1.
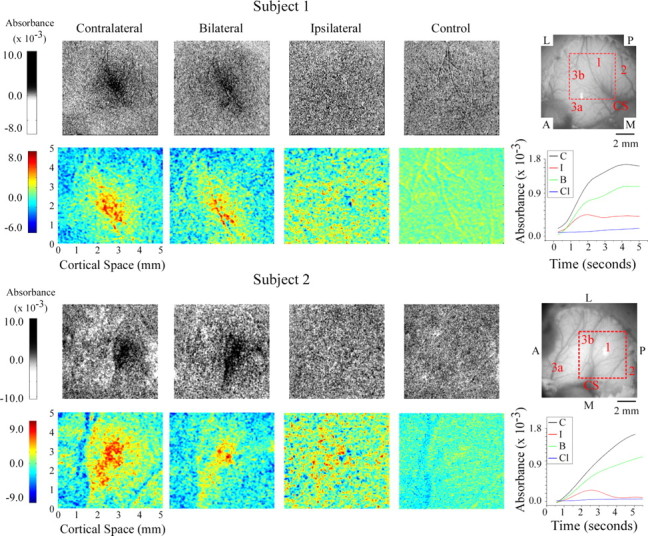
OIS response evoked by flutter stimulation of the thenar eminence in two subjects. Rows 1, 3, Averaged difference images for responses evoked by contralateral (Cl), bilateral (B), and ipsilateral (I) stimuli as well as the no-stimulus control (C). Orientation of images is indicated in the reference image at the right. P, Posterior; A, anterior; M, medial; L, lateral; CS, central sulcus. Rows 2, 4, Selected regions (ROI is defined in image at far right of rows 1, 3) from absorbance images for each subject. Absorbance time courses are plotted and color coded for each stimulus condition at far right; time courses were calculated within a 2-mm-diameter area centered on the region that maximally responded to contralateral stimulation.
Color maps of the responding region within each average difference image [region of interest (ROI); the 5 × 5 mm region centered on the maximal response evoked by the contralateral stimulus (outlined in red in the image of the cortical surface shown at right of rows 1 and 3 in Fig. 1)] make evident the differences between the responses of SI of each subject to the three conditions of skin flutter stimulation. First, under the bilateral condition, not only is the average response weaker than that evoked by contralateral skin flutter (for each subject, compare first and second color maps from left) but it also is spatially less extensive. Second, although the response to ipsilateral flutter is located in the same SI region that responds to contralateral flutter, the spatial distribution of absorbance values evoked by the ipsilateral stimulus is distinctly different from that (1) evoked from the contralateral site and (2) obtained in the absence of stimulation (the no-stimulus condition), i.e., in each subject, ipsilateral flutter evoked a unique and spatially inhomogeneous pattern of absorbance values within the ROI. For both of the subjects whose data are illustrated in Figure 1, the average across-ROI increase in absorbance evoked by ipsilateral flutter is substantially smaller than the average across-ROI absorbance increase evoked by contralateral flutter, and, at numerous loci within the ROI, the absorbance values attained during ipsilateral skin flutter exceed by far the values measured at the same locations in the absence of stimulation (Fig. 1, compare left two color maps from rows 2, 4).
The absorbance versus time plots at the right of Figure 1 (rows 2, 4) show the time course of the response of SI to each of the four conditions (points on each curve show absorbance values at successive time intervals averaged across the 2-mm-diameter region that responded maximally to contralateral stimulation) (for methodological details, see Simons et al., 2005). Such plots quantitatively confirm the impression (gained from visual inspection of the grayscale difference images in Fig. 1) that the response of SI of each subject to bilateral skin flutter was substantially weaker than the response to contralateral flutter. In addition, the plots demonstrate that the SI responses (absorbance increases) to contralateral versus bilateral skin flutter follow a very similar time course.
The across-subject consistency of the observations was evaluated by determining the average across-subject (n = 5) absorbance value associated with each condition (Fig. 2, summary graph). The fact that the contralateral-only stimulus condition evoked the strongest response in every subject permitted convenient normalization of the values of the absorbance increase obtained from each subject, i.e., the absorbance values obtained from each subject under the ipsilateral and the bilateral stimulus conditions were expressed in terms of the absorbance value obtained from the same subject under the contralateral stimulus condition (as a consequence, SE for the response to the contralateral stimulus condition is 0). Surprisingly, the bar graph in Figure 2 reveals that, although the average across-subject response to ipsilateral stimulation is only slightly greater than the across-subject average response observed in the absence of stimulation, the average response to bilateral flutter stimulation is ∼35% smaller than the average response to contralateral skin flutter. In every subject, the absorbance increase evoked in SI by bilateral flutter was smaller than the response to contralateral flutter. The data were evaluated statistically to determine whether the average (across-subject) SI response evoked by bilateral stimulation differed significantly from the corresponding response to contralateral stimulation (i.e., if the across-subject bilateral/contralateral response ratio was <1 at 5 s after stimulus onset). ANOVA showed that the average across-subject bilateral/contralateral SI response ratio was between 0.55 and 0.80 (p < 0.001; Ho was a ratio of 1).
Figure 2.

Average across-subject (n = 5) absorbance change (increase; normalized) in SI hand region. Measurements obtained at 5 s after stimulus onset. Note that, although all three stimulus conditions (contralateral, ipsilateral, and bilateral) evoked an absorbance increase, the response under the bilateral stimulus condition is ∼35% less than that evoked by contralateral-only stimulation.
Figure 3 compares the responses evoked in SI of another subject by contralateral (A) and bilateral (B) stimulation. The image (color map) in C was generated by computing the difference between the average difference images obtained under the two conditions (i.e., by subtracting the contralateral image from the bilateral image). C reveals that, in this subject, a region located centrally within the imaged region in SI responded more vigorously to contralateral stimulation than to bilateral stimulation (indicated by red pixels), and, in contrast, the region surrounding the vigorously responding central region responded more vigorously to bilateral than to contralateral skin flutter (indicated by blue pixels). This center–surround relationship between the territories that responded differentially to contralateral versus bilateral flutter stimulation also is demonstrated by the distance versus difference in absorbance plot (D) obtained by radial histogram analysis of the color map in C. The origin of the x-axis (distance of 0) of the plot in D corresponds to the center of the response evoked by contralateral stimulation in A (point at center of the circle in C). Accordingly, the plot in D shows that the difference between the absorbance increases detected at the same location in the imaged field under the two stimulus conditions (bilateral minus contralateral; DABSORBANCE) varies systematically with increasing radial distance (in millimeters) from the center of the ROI. In other words, DABSORBANCE is negative (the response to contralateral stimulation > the response to bilateral stimulation) at distances <2.5 mm from the center of the ROI but is positive (the response to contralateral stimulation < the response to bilateral stimulation) in regions located >2.5 mm from the center of the ROI).
Figure 3.

Comparison of SI hand region responses to contralateral versus bilateral stimulation of the thenar eminence. A, Contralateral response to skin flutter. B, Response to the flutter stimulus applied bilaterally. C, Color map showing DABSORBANCE values obtained by subtracting image A from image B. Red pixels show central region (region in vicinity of point 0) at which response evoked by contralateral-only stimulation exceeded the response to bilateral stimulation; blue pixels identify a surrounding region in which response to bilateral flutter exceeded the response to contralateral flutter. D, Result of radial histogram analysis of color map in C. Distance = 0 mm is the origin of the plot (i.e., the central point in the circular region in image C, identified by dotted white line). DABSORBANCE values <0 (negative) indicate that the response at that location during contralateral-only stimulation was greater than the response measured at that same location during bilateral stimulation; similarly, DABSORBANCE values >0 (positive) indicate that, at that location, the response evoked by bilateral stimulation exceeded the response to contralateral stimulation. P, Posterior; A, anterior; M, medial; L, lateral.
Figure 4 shows average across-subject (n = 5) distance versus DABSORBANCE plot obtained by radial histogram analysis of the responses of each of the five subjects to contralateral versus bilateral skin flutter stimulation. Clearly, Figure 4 confirms that the SI hand region generates a different response to bilateral stimulation than it does to contralateral stimulation. In particular, (1) in the “center” region that extends ∼1 mm from the center of the region that responds maximally to contralateral flutter, the response to bilateral flutter is less than that evoked by contralateral flutter, and (2) at distances between 2.0 and at least 5.0 mm from the center of the ROI (“the surround”), the response to bilateral flutter exceeds the response to contralateral flutter.
Figure 4.

Average across-subject (n = 5) DABSORBANCE versus distance plot generated using radial histogram analysis. Note that across-subject average DABSORBANCE values in the vicinity of the center of the ROI are negative, indicating that, in this region, the response to stimulation of the contralateral thenar was greater than the response to bilateral thenar stimulation. In contrast, positive DABSORBANCE values were obtained in the surrounding territory (the surround occupies the region located at radial distances between 3 and 5 mm from point 0). Horizontal bars below abscissa indicate locations of regions within the ROI identified as center versus surround.
Figure 5 compares the average across-subject responses (normalized absorbance changes) evoked by contralateral versus bilateral flutter stimulation in the above-defined center versus surround areas within the ROI in all five subjects. Although both the center and surround regions responded to ipsilateral flutter with a relatively weak absorbance increase, the response of the same regions to contralateral flutter was very different. In fact, the average across-subject response evoked in the surround region by contralateral flutter was a decrease in absorbance (the OIS sign of stimulus-evoked neuronal inhibition) (Simons et al., 2005). In contrast, under both the bilateral and ipsilateral stimulus conditions, absorbance increased in the surround region, although the increase was smaller under the ipsilateral condition. Statistical analysis revealed that the responses of the center and surround regions were significantly different for the contralateral (p < 0.001, t test) and bilateral (p = 0.078) conditions. The responses in the center and surround of the ROI that were evoked by ipsilateral stimulation were not significantly different (p = 0.634). However, the response evoked in the surround by the contralateral stimulus was significantly different from that evoked by bilateral stimulation (p = 0.001).
Figure 5.

Average across-subject results (n = 5). Filled bars indicate average across-subject absorbance values (normalized) for each stimulus condition measured within the maximally responding central region (radius of 1 mm; compare with Fig. 4) at 5 s after stimulus onset. A positive value of normalized absorbance indicates that absorbance increased above that measured in the same region in the absence of stimulation. Note that response to bilateral flutter is ∼30% less than the response to contralateral flutter. Open bars indicate average across-subject absorbance values obtained under the same conditions but within the surround (defined in Fig. 4). Under one condition (contralateral stimulation), average across-subject absorbance in the surround decreased below that measured in the absence of stimulation. The difference between the responses evoked in the center and surround for the ipsilateral condition is not statistically significant.
To examine the spatial distribution of the modulatory effect of ipsilateral stimulation on the response of SI to simultaneous stimulation of the contralateral thenar, we evaluated the central 2 × 2 mm boxel of the SI region that responded maximally to contralateral stimulation at higher resolution. The images in Figure 6 show the absorbance patterns evoked in this 2 × 2 mm region in two subjects by contralateral flutter stimulation (image pair in column 1) and by simultaneous stimulation of both thenar sites (image pair in column 2). The highlighted (red) areas in each image in the third column from the left indicate the sectors within this 2 × 2 mm region that were maximally activated (sectors involving the upper 10% of the activated pixels are shown in red) under the contralateral stimulus condition. The plots in the second column from the right reveal that, for each subject, the average time course of the absorbance change (increase) within the maximally driven region is virtually identical under the two stimulus conditions. In striking contrast, the plots in the right column show that the two stimulus conditions evoke very different absorbance changes in the territory outside the region that responds maximally to contralateral stimulation. Clearly, therefore, the latter plots reveal that differences in SI activation that occur under the contralateral and bilateral stimulus conditions occur primarily in the SI region nonmaximally activated by flutter stimulation of the contralateral thenar. Across all subjects (n = 5), the percentage decrease change between the contralateral and bilateral conditions in the maximally driven region of SI was 2.5 ± 1% (NS), whereas the percentage decrease observed in the nonmaximally activated region was 41 ± 6% (p < 0.005).
Figure 6.

Within-ROI analysis for two subjects. Images in each row show the OIS response in the central 2 × 2 mm for one subject. Region maximally activated by contralateral stimulation (threshold set at maximal 10% of absorbance values) is indicated with red overlay. Two right columns, Absorbance versus time plots for highlighted region (red pixels) and nonhighlighted region (all non-red pixels) in the 2 × 2 mm ROI. Note that, in the highlighted region, similar absorbance values were obtained under the two stimulus conditions (plots in second column from right), but, in the nonhighlighted region, the response evoked by bilateral stimulation is, at all but the earliest times after stimulus onset, less than the response to contralateral flutter.
To obtain information about the specificity of the modulatory effect of ipsilateral input on the SI response to contralateral stimulation, we investigated in one subject the effect of changing the location of the ipsilateral stimulus. This subject’s data showed that, when the ipsilateral component of the bilateral stimulus was shifted to the tip of digit 2 (the contralateral stimulus was delivered to the thenar), a response reduction occurred that was indistinguishable from that observed when mirror-symmetric sites on the thenar were stimulated simultaneously. However, when the ipsilateral stimulus was shifted to the medial pad on the foot (as before, the contralateral stimulus was delivered to the thenar eminence on the hand), the response evoked within the SI hand region by simultaneous bilateral flutter did not differ significantly from that evoked by flutter stimulation applied independently to the contralateral thenar.
Discussion
It is established that a non-noxious mechanical skin stimulus activates via a short-latency, high-security neural transmission path, neurons in the middle layers of SI in the contralateral hemisphere (Mountcastle, 1984). Furthermore, much of the current literature reflects the long-held idea that gentle mechanical stimulation of the skin of the hand either has either no or, at most, a negligible influence on neurons in areas 3b and 1 of the SI hand representational region in the ipsilateral hemisphere.
The findings reported in this study are incompatible with the widely accepted idea that areas 3b and 1 in the SI hand region are insensitive to mechanical events on the ipsilateral hand. First, they provide unambiguous evidence that a skin flutter stimulus to the ipsilateral thenar eminence of the squirrel monkey evokes a statistically significant optical response (OIS; an absorbance increase) within the same SI territory than in previous combined OIS–neurophysiological studies (Shoham and Grinvald, 2001; Whitsel et al., 2001, 2003; Tommerdahl et al., 2002) was shown to undergo increased single-neuron spike discharge activity in response to flutter stimulation of the contralateral hand. Second, our experiments demonstrate that simultaneous bilateral stimulation of both the ipsilateral and contralateral hand sites evokes an SI response significantly smaller and spatially less coherent than the response evoked in the same SI region by stimulation of only a site on the contralateral hand, a finding that strongly suggests that input from the ipsilateral hand can modify the ability of SI to process information about the status of mechanoreceptors in the skin of the contralateral hand.
The above-described modulatory effect of ipsilateral input on the SI response to stimulation of the contralateral hand, together with (1) reports by others of neurons with ipsilateral receptive fields in SI of nonhuman primates (for review, see Iwamura et al., 2002), (2) demonstrations of short-latency activation of human SI in response to electrical stimulation of the ipsilateral median nerve (Allison et al., 1989a,b, 1992; Korvenoja et al., 1995; Nihashi et al., 2005), and (3) the recent discovery that unilaterally applied flutter stimulation of the hand evokes short-latency neuromagnetic activity in both the contralateral and ipsilateral SI of conscious humans (Tan et al., 2004), demonstrates not only that the SI hand representational region receives substantial ipsilateral input but, in addition, shows that ipsilateral input evoked by gentle mechanical skin stimulation can alter the SI response to contralateral flutter stimulation.
Insofar as the perceptual meaning of our finding that ipsilateral input alters the optical response of the SI hand region to skin flutter is concerned, observations reported in published human psychophysical studies are highly suggestive: those observations clearly indicate that input from a skin region on one hand can significantly alter one’s perception of a tactile stimulus to the opposite hand. Importantly, although some of the published psychophysical findings indicate that concurrent input from mirror-symmetric sites on the two hands can enhance tactile perceptual performance above that obtained with unilateral stimulation, other studies indicate that tactile input from the two hands can lead to perceptual performance inferior to that observed when the stimulus is applied unilaterally. As examples of the former, (1) Lappin and Foulke (1973) observed that, when a subject scans the pattern using two fingers on opposite hands, Braille cell perception improves over that achieved unilaterally, (2) Craig (1985) reported that a subject’s ability to correctly identify a split tactile pattern (dot array) is substantially greater when the two halves of the pattern are presented simultaneously to two fingers on opposite hands (relative to the performance achieved when the two halves are delivered to two fingers, neighboring or non-neighboring, on the same hand), and (3) Essick and Whitsel found that human subjects’ accuracy of perceived direction of tactile motion on the hands improves greatly over that obtained with unilateral stimulation when the bilateral stimuli (the sites on the two hands were mirror symmetric) move across the two sites at the same time, in the same direction, and at the same velocity. Essick and Whitsel also reported that, whenever the physical properties of the brushing stimulus applied to one hand differed in some way (e.g., in direction, velocity, relative timing) from those of the stimulus to the opposite hand, the subject’s ability to accurately report direction of bilaterally applied stimulus motion declined, often reaching performance levels well below those achieved when each moving stimulus was applied unilaterally (Essick and Whitsel, 1988). Furthermore, a recent human psychophysical study found that vibrotactile stimulation of an unattended hand reduces tactile spatial acuity (as measured using a two-point discrimination paradigm) on the attended hand by as much as 35% (Tannan et al., 2005). That same study also found that two-point discrimination improves substantially when a small-amplitude high-frequency vibration is superimposed on both of the probes used to present the two-point stimulus but worsens during the delivery of high-frequency stimulation of the mirror-symmetric site on the opposite hand. Together, these observations strongly suggest that multiple factors (e.g., positional, temporal, and modal correspondence between the two stimuli) may determine the sign and magnitude of the influence of input from one hand on how a stimulus to the other hand is perceived.
How does input that arises in the mechanoreceptors of the skin of the ipsilateral hand access the SI hand region? Although the available evidence does not enable this question to be answered definitively, the observations obtained in multiple neuroanatomical tracing studies (for review, see Jones, 1986) make it clear that the modulatory influence exerted on the SI hand representational region evoked by stimulation of the ipsilateral hand is not mediated directly via interhemispheric connections that cross the midline in the corpus callosum. Indeed, the fact that a distinguishing feature of the SI hand area is its lack of direct interhemispheric connections forces the conclusion that the modulatory influence on SI of ipsilateral hand stimulation detected in the present study is mediated by a two-stage path: a route that initially involves the extensive interhemispheric (callosal) connections that directly link higher-level (integrative) areas in the two hemispheres and, subsequently, involves intrahemispheric connections from those higher-level areas to the SI hand region in the same hemisphere. A recent study, using cats as subjects, made simultaneous observations of activity evoked in SI and SII under conditions of ipsilateral, contralateral, and bilateral mechanical skin stimulation very similar to those reported in this paper (Tommerdahl et al., 2005a,b). The data obtained in that study indicated that, although different regions of SII were activated under the different conditions of stimulation, there was significant correlation (both positive and negative) between the stimulus-evoked activities in SII and SI, and the sign of the correlation was stimulus dependent. Thus, there is indirect evidence that SII, which receives extensive interhemispheric projections, may be the source of the modulatory influence that is exerted on SI during stimulation of the ipsilateral hand. The fact that the modulatory influence is only crudely somatotopic [i.e., the effect is evident even when the ipsilateral stimulus is delivered to a site in the general vicinity of the mirror-symmetric site (Fig. 5)] is regarded as consistent with the suggestion that the influence derives from SII, because the receptive fields of SII neurons are large relative those of neurons in SI.
The evidence presented in this paper leads us to suggest that, although the distal limb regions of SI are relatively acallosal, this should not (as is frequently done) be interpreted to indicate that these SI regions are free of influences arising from the ipsilateral body. The extraordinary ability of primates to use the two hands cooperatively to explore and discriminate the features of tactile objects shows not only that fusion of sensory input from both hands occurs within the CNS but that it underlies essential behaviors. With this in mind, therefore, the absence of direct callosal connections should not be viewed to indicate that an SI region does not receive significant influences from the ipsilateral body. Instead, absence of callosal connections in the distal limb regions of SI may be a reflection of (1) the extraordinary flexibility/mobility of the primate hands (i.e., the ability to substantially alter the positional relationships between distal forelimb skin regions in the accomplishment of tactile object exploration and feature extraction; in contrast, the positional relationship between skin regions on opposite sides of the midline at the level of the proximal limbs/trunk is relatively fixed), and (2) the need for the participation of higher-level cortical areas in fusing the elaborate time-, position-, and modality-dependent somatosensory experiences gained via bimanual tactile exploration.
Footnotes
This work was supported in part by National Institutes of Health Grants NS043375 (M.T.) and NS35222 (B.W.).
References
- Allison T, McCarthy G, Wood CC (1992). The relationship between human long-latency somatosensory evoked potentials recorded from the cortical surface and from the scalp. Electroencephalogr Clin Neurophysiol 84:301–314. [DOI] [PubMed] [Google Scholar]
- Allison T, McCarthy G, Wood C, Darcey T, Spencer D, Williamson P (1989a). Human cortical potentials evoked by stimulation of the median nerve. J Neurophysiology 62:694–710. [DOI] [PubMed] [Google Scholar]
- Allison T, McCarthy G, Wood C, Williamson P, Spencer D (1989b). Human cortical potentials evoked by stimulation of the median nerve. II. Cytoarchitectonic areas generating long-latency activity. J Neurophysiology 62:711–722. [DOI] [PubMed] [Google Scholar]
- Ba A, Guiou M, Pouratian N, Muthialu A, Rex D, Cannestra A, Chen J, Toga AW (2002). Multiwavelength optical intrinsic signal imaging of cortical spreading depression. J Neurophysiol 88:2726–2735. [DOI] [PubMed] [Google Scholar]
- Craig J (1985). Attending to two fingers: two hands are better than one. Percept Psychophys 38:496–511. [DOI] [PubMed] [Google Scholar]
- Craig J, Qian X (1997). Tactile pattern perception by two fingers: temporal interference and response competition. Percept Psychophys 59:252–265. [DOI] [PubMed] [Google Scholar]
- Essick G, Whitsel B (1988). The capacity of human subjects to process directional information provided at two skin sites. Somatosens Mot Res 6:1–20. [DOI] [PubMed] [Google Scholar]
- Grinvald A (1985). Real-time optical mapping of neuronal activity: from single growth cones to the intact mammalian brain. Annu Rev Neurosci 8:263–305. [DOI] [PubMed] [Google Scholar]
- Grinvald A, Bonhoeffer T, Malonek D, Shoham D, Bartfeld E, Arierli A, Hildesheim R, Ratzlaff E (1991). Optical imaging of architecture and function in the living brain. In: Memory organization and locus of change (Squire L, Weinberger N, Lynch G, McGaugh J, eds) pp. 49–85. New York: Oxford UP.
- Harris J, Harris I, Diamond M (2001). The topography of tactile learning in humans. J Neurosci 21:1056–1061. [DOI] [PMC free article] [PubMed] [Google Scholar]
- Hlushchuk Y, Hari R (2006). Transient suppression of ipsilateral SI cortex during tactile finger stimulation. J Neurosci in press. [DOI] [PMC free article] [PubMed]
- Iwamura Y, Taoka M, Atsushi I (2001). Bilateral activity and callosal connections in the somatosensory cortex. The Neuroscientist 7:419–429. [DOI] [PubMed] [Google Scholar]
- Iwamura Y, Tanaka M, Iriki A, Taoka M, Toda T (2002). Processing of tactile and kinesthetic signals from bilateral sides of the body in the postcentral gyrus of awake monkeys. Behav Brain Res 135:185–190. [DOI] [PubMed] [Google Scholar]
- Jones E (1986). Connectivity of the primate sensory-motor cortex. In: Cerebral cortex: sensory-motor areas and aspects of cortical connectivity (Jones E, Peters A, eds) New York: Plenum.
- Jones E, Porter R (1980). What is area 3a? Brain Res 203:1–43. [DOI] [PubMed] [Google Scholar]
- Korvenoja A, Wikstrom H, Huttunen J, Virtanan J, Laine P, Aronen HJ, Seppalainen AM, Ilmoniemi RJ (1995). Activation of ipsilateral primary sensorimotor cortex by median nerve stimulation. NeuroReport 6:2589–2593. [DOI] [PubMed] [Google Scholar]
- Lappin J, Foulke E (1973). Expanding the tactual field of view. Percept Psychophys 14:237–241. [Google Scholar]
- Lipton ML, Fu K-M, Branch CA, Schroeder CE (2006). Ipsilateral hand input to area 3b revealed by converging hemodynamic and electrophysiological analyses in macaque monkeys. J Neurosci 26:180–185. [DOI] [PMC free article] [PubMed] [Google Scholar]
- Mountcastle VB (1984). Mechanoreceptive sensibility. In: Handbook of physiology (Darian-Smith I, ed.) Bethesda, MD: American Physiological Society.
- Nihashi T, Naganawa S, Sato C, Kawai H, Nakamura T, Fukatsu H, Ishigaki T, Aoki I (2005). Contralateral and ipsilateral responses in primary somatosensory cortex following electrical median nerve stimulation: an fMRI study. J Neurophysiol 116:842–848. [DOI] [PubMed] [Google Scholar]
- Pal PK, Hanajima R, Gunraj CA, Li J-Y, Wagle-Shukla A, Morgante F, Chen R (2005). Effect of low-frequency repetitive transcranial magnetic stimulation on interhemispheric inhibition. J Neurophysiol 94:1668–1675. [DOI] [PubMed] [Google Scholar]
- Pluto CP, Chiaia NL, Rhodes RW, Lane RD (2005). Reducing contralateral SI activity reveals hindlimb receptive fields in the SI forelimb-stump representation of neonatally amputated rats. J Neurophysiol 94:1727–1732. [DOI] [PubMed] [Google Scholar]
- Powell T, Mountcastle V (1959a). The cytoarchitecture of the postcentral gyrus of the monkey Macaca mulatta Bull Johns Hopkins Hosp 105:108–131. [PubMed] [Google Scholar]
- Powell TPS, Mountcastle VB (1959b). Some aspects of the functional organization of the cortex of the postcentral gyrus of the monkey: a correlation of findings obtained in a single unit analysis with cytoarchitecture. Bull Johns Hopkins Hosp 105:133–162. [PubMed] [Google Scholar]
- Schnitzler A, Salmelin R, Salenius S, Jousmaki V, Hari R (1995). Tactile information from the human hand reaches the ipsilateral primary somatosensory cortex. Neurosci Lett 200:25–28. [DOI] [PubMed] [Google Scholar]
- Shoham D, Grinvald A (2001). The cortical representation of the hand in macaque and human area S-I: high resolution optical imaging. J Neurosci 21:6820–6825. [DOI] [PMC free article] [PubMed] [Google Scholar]
- Simons SB, Tannan V, Chiu J, Favorov OV, Whitsel BL, Tommerdahl M (2005). Amplitude-dependency of response of SI cortex to vibrotactile stimulation. BMC Neuroscience 6:43. [DOI] [PMC free article] [PubMed] [Google Scholar]
- Tan H, Wuhle A, Braun C (2004). Unilaterally applied stimuli in a frequency discrimination task are represented bilaterally in primary somatosensory cortex. Neurol Clin Neurophysiol 2004:83. [PubMed] [Google Scholar]
- Tannan V, Dennis R, Tommerdahl M (2005). Stimulus-dependent changes in spatial acuity. Behav Brain Funct 1:18. [DOI] [PMC free article] [PubMed] [Google Scholar]
- Tommerdahl M, Delemos KA, Whitsel BL, Favorov OV, Metz CB (1999a). Response of anterior parietal cortex to cutaneous flutter and vibration. J Neurophysiol 82:16–33. [DOI] [PubMed] [Google Scholar]
- Tommerdahl M, Whitsel BL, Favorov OV, Metz CB, O’Quinn BL (1999b). Responses of contralateral SI and SII in cat to same site cutaneous flutter versus vibration. J Neurophysiol 82:1982–1992. [DOI] [PubMed] [Google Scholar]
- Tommerdahl M, Favorov OV, Whitsel BL (2002). Optical imaging of intrinsic signals in somatosensory cortex. Behav Brain Res 135:83–91. [DOI] [PubMed] [Google Scholar]
- Tommerdahl M, Simons S, Chiu J, Tannan V, Favorov OV, Whitsel BL (2005a). Response of SII cortex to ipsilateral, contralateral and bilateral flutter stimulation in the cat. BMC Neurosci 6:11. [DOI] [PMC free article] [PubMed] [Google Scholar]
- Tommerdahl M, Simons S, Chiu J, Favorov OV, Whitsel BL (2005b). Response of SI cortex to ipsilateral, contralateral and bilateral flutter stimulation in the cat. BMC Neurosci 6:29. [DOI] [PMC free article] [PubMed] [Google Scholar]
- Whitsel BL, Kelly EF, Xu M, Tommerdahl M, Quibrera M (2001). Frequency-dependent response of SI RA-class neurons to vibrotactile stimulation of the receptive field. Somatosens Mot Res 18:263–285. [DOI] [PubMed] [Google Scholar]
- Whitsel BL, Kelly EF, Quibrera M, Tommerdahl M, Li Y, Favorov OV, Xu M, Metz CB (2003). Time-dependence of SI RA neuron response to cutaneous flutter stimulation. Somatosens Mot Res 20:45–69. [DOI] [PubMed] [Google Scholar]