

Abstract
Nogo-A, a membrane protein enriched in myelin of the adult CNS, inhibits neurite growth and regeneration; neutralizing antibodies or receptor blockers enhance regeneration and plasticity in the injured adult CNS and lead to improved functional outcome. Here we show that Nogo-A-specific knock-outs in backcrossed 129X1/SvJ and C57BL/6 mice display enhanced regeneration of the corticospinal tract after injury. Surprisingly, 129X1/SvJ Nogo-A knock-out mice had two to four times more regenerating fibers than C57BL/6 Nogo-A knock-out mice. Wild-type newborn 129X1/SvJ dorsal root ganglia in vitro grew a much higher number of processes in 3 d than C57BL/6 ganglia, confirming the stronger endogenous neurite growth potential of the 129X1/SvJ strain. cDNA microarrays of the intact and lesioned spinal cord of wild-type as well as Nogo-A knock-out animals showed a number of genes to be differentially expressed in the two mouse strains; many of them belong to functional categories associated with neurite growth, synapse formation, and inflammation/immune responses. These results show that neurite regeneration in vivo, under the permissive condition of Nogo-A deletion, and neurite outgrowth in vitro differ significantly in two widely used mouse strains and that Nogo-A is an important endogenous inhibitor of axonal regeneration in the adult spinal cord.
Keywords: CNS repair, Nogo, mouse strain, regeneration, spinal cord injury, neurite outgrowth
Introduction
Neurite growth in the adult injured CNS of higher vertebrates is limited to distances of often <1 mm (Schwab and Bartholdi, 1996; Schwab, 2002). Specific neurite growth inhibitory factors were found in the adult CNS in which they are particularly enriched in the axonal myelin sheaths (Caroni and Schwab, 1988; Schwab, 2002; Filbin, 2003). Scars represent an additional mechanical and biochemical barrier (Fitch and Silver, 1997; Bradbury et al., 2002). Functional importance of these factors has been demonstrated in vivo by inactivation experiments, in particular with regard to scar-associated chondroitin sulfate proteoglycans (Bradbury et al., 2002) and to Nogo-A (Schwab, 2004). Nogo-A is a protein with potent neurite growth inhibitory activity. It is enriched in CNS myelin and was the first discovered neurite growth inhibitor in the adult CNS (Caroni and Schwab, 1988; Spillmann et al., 1998; Chen et al., 2000). In vivo studies in rats using neutralizing antibodies against Nogo-A (Schnell and Schwab, 1990; Brosamle et al., 2000; Merkler et al., 2001; Liebscher et al., 2005), an activity-blocking receptor fragment (Fournier et al., 2002; Li et al., 2004), or peptides blocking the Nogo receptor subunit NgR (GrandPrè et al., 2002) showed successful regeneration of corticospinal tract (CST) axons over long distances and significant enhancement of functional recovery (Schwab, 2004). Although some other proteins that inhibit neurite growth in vitro have been found in CNS myelin, including MAG, oligodendrocyte myelin glycoprotein, netrin-1, semaphorin-4D and -5A, and ephrinB3 (Filbin, 2003; Moreau-Fauvarque et al., 2003; Goldberg et al., 2004; Schwab, 2004; Benson et al., 2005), in vivo evidence for enhanced regeneration after injury is still missing for all of these candidates.
Nogo-A- and -A,-B-specific knock-outs revealed an enhancement of CST regeneration in the partially transected spinal cord in two laboratories (Kim et al., 2003; Simonen et al., 2003), but this effect was not observed by a third group (Zheng et al., 2003). Finally, a Nogo-A,-B,-C knock-out line bred from a single animal that escaped lethality also did not show enhanced regeneration (Zheng et al., 2003). Like for the majority of the conventional knock-out studies, all the three Nogo studies used embryonic stem (ES) cells of the 129X1/SvJ (Sv129) strain injected into C57BL/6 (BL/6) blastocysts, and the analyzed mice were early generation chimeric animals. Such lines always contain unknown proportions of 129X1/SvJ and C57BL/6 genetic background, i.e., of two inbred mouse strains that differ in many aspects of their phenotypes. Although so far not studied, these genetic differences could also concern the endogenous regeneration potential of neurons. To study the effect of Nogo-A deletion under clearly defined conditions, the Nogo-A-specific knock-out was backcrossed into 129X1/SvJ and C57BL/6 strains. We observed consistent enhancement of regeneration of transected CST axons in adult mouse spinal cords in both knock-outs. Interestingly, fiber numbers caudal to the lesion were two to four times higher in the 129X1/SvJ knock-outs than in the C57BL/6 ones. Neurite growth was also strongly enhanced in vitro in Sv129 neurons compared with BL/6 neurons. A microarray experiment showed many differentially regulated genes between the two strains that belong to functional categories associated with neurite growth, synapse formation, and inflammation, showing a higher endogenous potential for neurite growth in the Sv129 strain.
Materials and Methods
Generation of backcrossed Nogo-A knock-outs.
All animal studies were performed under the license of the Veterinary Office of the Canton of Zurich. The deletion of the Nogo-A-specific region of the Nogo gene, exon 2 and 3, was produced by homologous recombination in 129X1/SvJ ES cells, which were injected into C57BL/6 blastocysts (Simonen et al., 2003). The resulting chimeric mice were then backcrossed with either C57BL/6 or 129X1/SvJ wild-type mice for >10 generations. Male mice from the sixth and eighth generation were screened with a panel of at least 50 strain-specific microsatellite markers using the “speed congenics” approach (Markel et al., 1997) (Medigenomix, Munich, Germany). The males with the highest proportion of specific strain markers were used for additional breeding. In this way, the strain purity of the Nogo-A knock-out animals of the 10th generation was >99% for the Sv129 mice and >99.98% for the BL/6 mice. The backcrossed heterozygous mice were then bred accordingly to get homozygous wild-type or knock-out mice. Genotyping was done with different PCRs described by Simonen et al. (2003).
Western blot analysis.
Total brain extracts were made from freshly dissected tissue of 3.5-month-old mice (two mice of each genotype and background) in extraction buffer [50 mm NaH2PO4, 150 mm NaCl, and 0.5% 3-[(3-cholamidopropyl)dimethylammonio]-1-propanesulfonate with a protease inhibitor cocktail (Roche Pharma, Basel, Switzerland)], using a polytron homogenizer at the highest setting (20–30 s). Insoluble material and nuclei were pelleted by centrifugation. The protein concentration was measured using Advanced Protein Assay Reagent (Cytoskeleton, Denver, CO). Equal amounts of protein (20 μg) were size separated on denaturing 10% SDS-polyacrylamide gels and transferred onto polyvinylidene difluoride membranes (Immobilon-P; Millipore, Bedford, MA). Blot membranes were incubated first with primary antibodies overnight at 4°C and then with horseradish peroxidase-conjugated secondary antibodies for 1 h at room temperature. Immunoreactive protein was detected with an enhanced chemiluminescence kit (Pierce, Rockford, IL). Western blots were then washed (not stripped) and probed with an α-glyceraldehyde-3-phosphate dehydrogenase (GAPDH) antibody as an internal standard for quantification. The NIH program Scion Image (Scion, Frederick, MD) was used to quantify the densitometric data.
The Nogo-A antiserum Bianca (Rb1) detecting the common N terminus of Nogo-A,-B (Oertle et al., 2003; Dodd et al., 2005) was diluted 1:20,000. Monoclonal mouse α-GAPDH antibody (Abcam, Cambridge, UK) was diluted 1:6000, and the secondary antibodies HRP-α mouse IgG was at 1:10,000 and HRP-α rabbit IgG was at 1:15,000 (Pierce).
Spinal cord injury and corticospinal tract tracing.
Six- to 7-week-old homozygous Nogo-A knock-out and wild-type mice of both strains and sexes were deeply anesthetized by an intraperitoneal injection of Hypnorm (Jansen Pharmaceutica, Beerse, Belgium) and Dormicum (Roche Pharma). A partial laminectomy was performed at the thoracic level T8. After opening the dura, the spinal cord was lesioned with the help of fine iridectomy scissors to produce a bilateral lesion of the dorsal and the dorsolateral funiculi and the dorsal horn. The resultant bleeding was usually minor and easily stopped with Gelfoam. The muscle layers over the laminectomy were sutured, and the skin on the back was closed with surgical staples. After closure of the wound, animals were passed to a second surgery in which they received injections of biotin dextran amine (BDA) (10,000 molecular weight; 2% solution; Invitrogen, Carlsbad, CA) into the sensorimotor cortex to label the CST (four injection sites, 0.5 μl each). The scalp was opened, a hole was drilled into the scull overlying the sensorimotor cortex 1 mm lateral and 1 mm posterior to bregma, and BDA was injected. Animals were killed 2 weeks after injury [homozygous Nogo-A knock-outs (n = 10 and n = 15 for Sv129 and BL/6, respectively) and wild types (n = 10 and n = 15 for Sv129 and BL/6 respectively)].
Histology and analysis of CST reaction to injury.
Two weeks after spinal cord injury, the mice received an overdose of the anesthetic Nembutal (75 mg/100 g body weight; Abbott Laboratories, North Chicago, IL) and were perfused with 4% paraformaldehyde in 0.1 m phosphate buffer, pH 7.6 with 5% sucrose. The spinal cords were removed and postfixed overnight at 4°C. On the following day, the tissue was placed for 1–2 d in 30% sucrose in phosphate buffer for cryopreservation. The thoracic and lumbar parts of the spinal cord were dissected, so that a piece of ∼2 cm, comprising the lesion and ∼15 mm of the spinal cord caudal to the lesion, resulted. Cryostat sections of 25 μm were cut in the sagittal plane, mounted as a continuous section series on slides, and stained for BDA using a nickel-enhanced diaminobenzidine protocol (Herzog and Brösamle, 1997). The sections were then air dried, dehydrated, and coverslipped.
Quantification of regeneration properties.
The number of labeled axons was counted at different levels, i.e., 0.5, 2, and 5 mm caudal to the lesion in bright-field illumination on all of the five to seven adjacent sections of the traced half of the spinal cord at a magnification of 400×. Regenerative sprouting of the transected main CST axons rostral to the lesion was judged by two experienced observers using a 0–3 point scoring scale (0, no sprouting; 1, single and short fine fibers; 2, longer fibers, rarely reach the lesion, rarely growth cones; 3, dense fine outgrowth of curved fibers from the main CST toward and around the lesion, frequent growth cones). All of the animals were number coded and randomly mixed during the whole course of the evaluation. The Mann–Whitney U test was used for statistical analysis.
Dorsal root ganglion explants and quantification.
Sv129 and BL/6 wild-type lumbar dorsal root ganglia (DRGs) at postnatal day 0–1 were dissected, trimmed of connective tissue, and cultured for 3 d in the presence of 50 ng/ml nerve growth factor (NGF) on poly-l-lysine-coated plates, as described by Niederost et al. (2002). The neurite density was assessed as the number of neurites crossing a line placed at 200 μm from the edge of the DRG within one quadrant. The length of DRG neurites was measured under a phase-contrast microscope at the magnification of 10×. The average distance of the three longest neurites between the edge of the explant and the tip of the maximally extended neurite was designated as the maximal neurite length. Values obtained are expressed as a mean of three independent experiments.
Microarrays.
Lumbar spinal cords from three naive, non-injured, wild-type, and knock-out male mice (3 months of age) per strain and genotype were dissected and immediately frozen in liquid nitrogen. For lesion microarray experiment, five female mice (6–7 weeks old) of each genotype and strain were lesioned as described above (see Spinal cord injury and corticospinal tract tracing). Six days after the lesion, we performed a Basso Mouse Scale behavioral analysis for open-field locomotion. We chose four of the five mice per category with the most similar score to use for microarray analysis. One week after the lesion, we dissected 1 cm of the spinal cord with the lesion site in the middle and immediately froze it in liquid nitrogen. For probe preparation, procedures described in the Affymetrix (Santa Clara, CA) GeneChip Analysis manual were followed. Biotinylated cRNA was hybridized onto Affymetrix Mouse Genome 430 2.0 arrays, which represent >45,000 probe sets, in the Affymetrix fluidics station 450, and the chips were then scanned with the Affymetrix Scanner 3000. Each chip was used for hybridization with cRNA isolated from one spinal cord sample from a single animal in a total number of 28 samples. Results were subsequently analyzed using the Affymetrix Microarray Suite 5, followed by the Genespring 7.2 (Silicon Genetics, Redwood City, CA). We applied a present call filter (two of three at least in one of the two strains for naive, non-injured spinal cord samples and three of four for the lesioned spinal cord samples), fold change thresholds (>1.5/<0.66 or >2/<0.5), and ANOVA, with p < 0.05.
Inflammation and scar formation.
For immunohistochemistry for the activated microglia/macrophage marker FA/11 (Rabinowitz and Gordon, 1991) and for GFAP, 25 μm cryostat sections of the nontraced half of the spinal cord were incubated with the primary antibodies FA/11 (hybridoma supernatant at 1:20; generous gift from Dr. V. H. Perry, University of Southampton, Southampton, UK) or α-GFAP (rabbit antiserum, 1:2000; Chemicon, Temecula, CA) overnight at 4°C. Specifically bound antibodies were detected by HRP-coupled secondary antibodies.
Microglia/macrophage invasion was scored on a 0–3 point scale taking the following parameters into consideration: the number and tissue density of FA/11-positive cells in lesion center and in the surrounding tissue and the size of infiltrated area. Astrocytic scarring reaction was scored (0–3 points) by considering the area containing strong GFAP-positive cells and the process network density.
Results
Nogo-A knock-out mice
Nogo-A (200 kDa, 1163 aa) differs from Nogo-B (55 kDa, 357 aa) by the insertion of a large 787 aa exon (exon 3). A Nogo-A knock-out mouse was generated by homologous recombination as described by Simonen et al. (2003). The chimeric Nogo-A knock-out mice were backcrossed to either Sv129 mice or BL/6 mice for at least 10 generations. The speed congenics strain marker analysis (Markel et al., 1997) was used during backcrossing. Speed congenic breeding, or marker-assisted congenic production, uses microsatellite markers to follow the inheritance of the chromosomal segments of each strain. Optimal breeder mice are selected by the highest level of markers for each strain. The mice used in the present study had a 100% pure C57BL/6 background according to their marker profile, and a >99% pure background for the 129X1/SvJ strain. PCR and Northern blots showed the absence of Nogo-A or truncated Nogo-A mRNAs (data not shown) (Simonen et al., 2003). Western blots of brain and spinal cord lysates of wild-type, heterozygous, and homozygous Nogo-A knock-out animals showed the following results. (1) Protein levels for Nogo-A and -B were significantly different in the wild types of the two mouse strains: the Nogo-A protein level was approximately three times higher in the BL/6 wild types than in the Sv129 mice, whereas Nogo-B levels were approximately two times higher (Fig. 1). (2) In the homozygous knock-outs, Nogo-A was absent as expected, and Nogo-B was upregulated threefold to fivefold (Fig. 1) in both strains. No significant differences between the two strains and the different genotypes could be seen for the very low Nogo-C levels (data not shown). The absence of Nogo-A was confirmed for its typical expression sites (CNS white matter, oligodendrocytes, and specific subtypes of neurons) by immunofluorescence. The results (data not shown) were identical to those described previously for the mixed-strain knock-out animals (Simonen et al., 2003).
Figure 1.
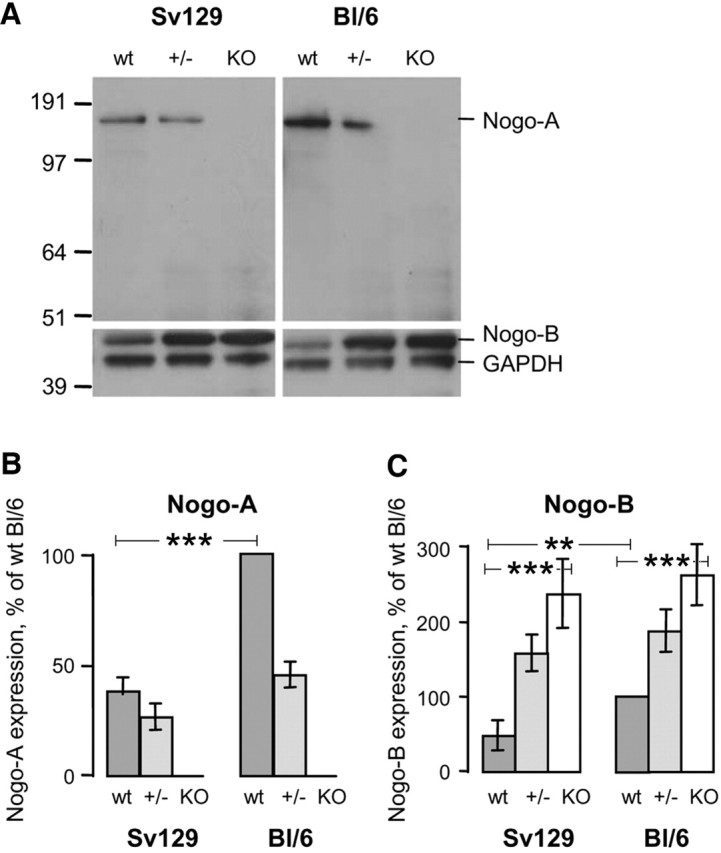
Endogenous Nogo-A and Nogo-B protein levels differ depending on the mouse strain. Levels of Nogo-A and -B in wild-type mice (wt) are higher in BL/6 than in Sv129 mice. In the homozygous Nogo-A knock-outs (KO), Nogo-A is absent and Nogo-B is upregulated three to five times in both strains. A, Immunoblotting with antiserum Bianca (Rb1) that recognizes Nogo-A and -B and an α-GAPDH antibody as internal standard. Total brain lysates from wild-type (wt), heterozygous (+/−), and homozygous Nogo-A knock-outs (KO) of 129X1/SvJ and C57BL/6 backgrounds are loaded in each lane. Molecular weight markers are indicated on the left. B, C, Densitometry of immunoblots for Nogo-A (B) and Nogo-B (C). Values are expressed in percentage of the BL/6 wild-type values.
CST regeneration in injured adult spinal cord
The well defined spinal cord injury model of a partial microsurgical transection was used in adult 6- to 7-week-old mice. The dorsal columns containing the main CST, the dorsal part of the dorsal horn, and the dorsolateral funiculus (containing a minor CST component) were transected bilaterally in wild-type or homozygous Nogo-A knock-out mice of the Sv129 and the BL/6 strains. Two weeks after the lesion, the mice were analyzed histologically by evaluating complete sagittal section series of the half of the spinal cord containing the labeled CST. The analyzed region comprised the lesion site, 2–3 mm of spinal cord tissue rostral and 15 mm caudal to the lesion. Wild-type and homozygous knock-out animals were number coded, randomly mixed, and evaluated blindly for the entire experiment. Sprouting of the transected main CST axons rostral to the lesion was judged by two experienced observers using a 0–3 point scoring scale. Regenerating axons were counted on every section for every animal on three levels: at 0.5, 2, and 5 mm caudal to the lesion. Because of the occasional occurrence of labeled CST axons in the ventral funiculus, which was spared by the lesion, regenerating axons had to fulfill the following criteria for being identified as regenerating and counted: no connection to possibly intact fibers in the ventral funiculus on serial sections; connection to fibers growing through/around the lesion area, often in a typical waving and irregular course on lateral or ventral tissue bridges; and frequent anatomically aberrant position outside of the original main CST territory, i.e., elongating over long distances in the gray matter or at the white matter/gray matter interface. Only animals with incomplete lesions of the main CST were excluded.
Sprouting of the transected CST axons rostral to the lesion was moderate in the wild types (Fig. 2A,B,E) compared with the strong sprouting in Nogo-A knock-out littermates (Fig. 2C–E). Many of the sprouts ended close to or in the lesion scar. In the Nogo-A knock-out animals, fine fibers growing around the lesion, often on the tissue bridges of the lateral and ventral cord, and entering the caudal spinal cord were observed (Fig. 2C,D). At the level of the lesion center, wild-type mice had no or only very few fibers in a minority of the animals. Nogo-A knock-out mice had more fibers crossing the lesion center in both strains. A very irregular course and a thin axon caliber were typical for these regenerating fibers (Fig. 2C,D, 3B–F). Long axons and axonal arbors could be observed in the spinal cord caudal of the lesion in most of the knock-out animals but only very rarely in the wild types (Fig. 3). Fiber numbers increased with distance from the lesion, probably because of arborization (Fig. 3H). Interestingly, fiber numbers in the caudal spinal cord were twofold to fourfold higher in the Sv129 knock-out animals than in the BL/6 knock-out mice. Weaker and more variable regeneration enhancement was also seen in heterozygous knock-out mice of both strains (data not shown). The values of the individual animals plotted in Figure 3H show the large scatter that is typical for these experiments. The extent of secondary tissue damage and scarring and therefore the availability of conducive tissue bridges across the lesion varied from animal to animal. Although nonregenerating mice (mice showing no fibers caudal to the lesion) occurred in all of the groups, the percentage of successfully regenerating mice (animals showing CST fibers at two or three of the three counting levels) was clearly higher in the Nogo-A knock-out groups of both strains (Fig. 3G).
Figure 2.

Regenerative sprouting in wild-type and Nogo-A knock-out mice after spinal cord injury. In wild types, sprouts (thin arrows) are short (A, B). In knock-out mice (KO), sprouts elongate over ventral tissue bridges toward the caudal spinal cord in both strains (C, D). Many sprouts end at the scar in all of the animals (thick arrow). Scale bar, 68 μm. E, Quantification of regenerative sprouting of the transected main CST axons rostral to the lesion in wild-type (wt) and homozygous Nogo-A knock-out (KO) animals of the Sv129 and the BL/6 strain. Sprouting was assessed by two experienced observers using a 0–3 point scoring scale. *p < 0.02 (Mann–Whitney U test).
Figure 3.
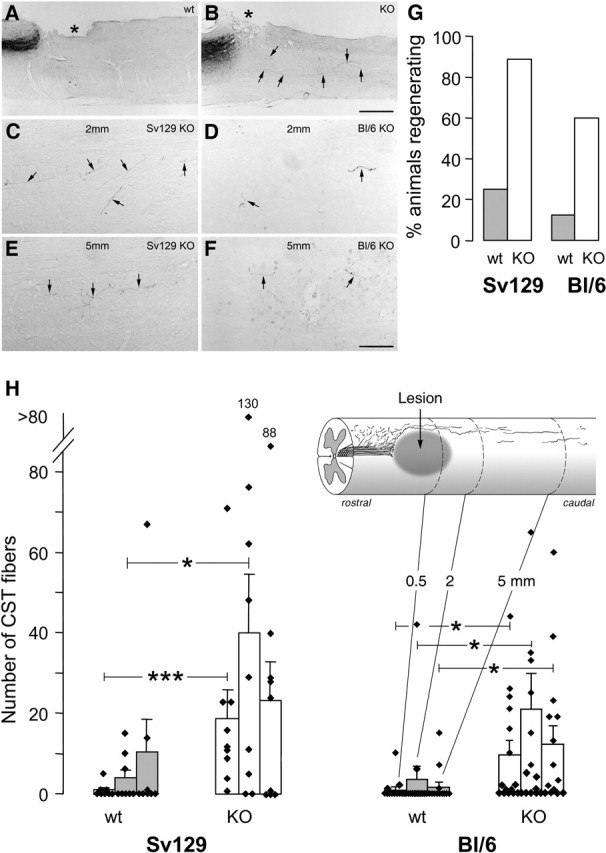
CST axons caudal to the lesion and quantification of regeneration in Nogo-A knock-out and wild-type animals of different strains. A, B, Low magnification of sagittal spinal cord section with injury site (asterisk), transected CST, and axons coursing into the caudal spinal cord (arrows). A, Wild-type animal without CST fibers caudal to lesion. B, Knock-out mouse with regenerating fibers. C–F, CST fibers (arrows) in the caudal spinal cord of Nogo-A knock-out animals at 2 mm (C, D) and 5 mm (E, F) from the lesion. Fibers are fine and show a typical irregular course. They are more numerous in the Sv129 (C, E) than in the BL/6 (D, F) animals. Scale bars: A, B, 520 μm; C–F, 68 μm. G, Percentage of the animals of the different strain and genotype groups showing CST fibers at two or three of the three counting levels caudal to the injury. H, Quantitation of labeled CST fibers found in white and gray matter of wild types (wt) (n = 8 and 13, respectively) and homozygous Nogo-A knock-out (KO) (n = 9 and 15, respectively) mice of the Sv129 and the BL/6 strains at 0.5, 2, and 5 mm caudal to the lesion. Bars represent mean ± SEM values. *p < 0.05, ***p < 0.0006 (Mann–Whitney U test).
Neurite outgrowth of newborn DRGs in vitro
To examine whether there are differences in the intrinsic capacity of neurite outgrowth between the two strains, we cultivated DRGs of newborn Sv129 and BL/6 wild-type mice for 3 d in presence of NGF and measured the following parameters: (1) the number of neurites per quadrant of DRG explant at a 200 μm distance from the edge of the explant (Fig. 4A, inset), and (2) the average length of the three longest neurites of every explant. We measured DRGs of three independent experiments with at least 10 DRGs for each strain and experiment, and we only quantified DRGs of similar size and equal distribution of the grown neurites (Fig. 4A,B). In the Sv129 strain, the majority of the explants (>92%) grew >50 axons per quadrant, whereas only a very small proportion (14%) of the BL/6 DRGs showed such a high number of neurites (Fig. 4C). The average length of the three longest neurites of every explant did not show a significant difference between the two strains (Fig. 4D).
Figure 4.

Comparison of intrinsic growth capacity of DRG neurites. Lumbar DRG explants cultivated from wild-type Sv129 (A) and BL/6 (B) newborn mice. The majority of the Sv129 DRGs (92%) extended >50 neurites per quadrant, whereas only a small percentage (14%) of the BL/6 DRGs was able to grow this high number of neurites (C). To determine neurite density, the number of neurites crossing a line placed at 200 μm from the edge of the DRG within one quadrant was quantified (inset in A). The average length of the three longest neurites of each DRG showed no significant difference between the strains (D).
Gene expression differences between Sv129 and BL/6 spinal cords
To identify genes that are differentially expressed in the spinal cords of Sv129 and BL/6 mice and that could account for the strain differences in the axonal growth response, we used GeneChip arrays on wild-type and knock-out spinal cords of naive, non-injured, and spinal cord injured animals. Analysis of the non-injured wild-type microarrays showed ∼2100 differentially expressed transcripts (fold changes >1.5 or <0.66), of which ∼940 were coding for known proteins. A total of 365 genes were differentially expressed >2- or <0.5-fold in Sv129 compared with BL/6 mice. A large proportion (36%) of these differentially regulated genes are associated with cytoskeletal functions (3.8%), neurite growth (3.6%) and guidance (1.4%), cell adhesion and extracellular matrix (ECM) (5.5%), synaptic function (1.9%), signaling (12.9%), and inflammatory and immune responses (7.1%) (Tables 1, 2). Analysis of the nonlesioned knock-out microarrays revealed similar numbers as in the wild types, with 930 genes regulated >1.5- or <0.66-fold and 314 genes regulated >2- or <0.5-fold. A total of 38.5% of these differentially regulated genes belonged to functional categories important for neurite outgrowth such as that shown for the wild types (Tables 1, 3). Interestingly, many of the neurite growth-related genes were expressed at higher levels in the Sv129 mice than in BL/6 spinal cords (Tables 2, 3). We then compared the spinal cord gene expression profiles of the two mouse strains 1 week after a spinal cord lesion. We identified many genes that were differentially regulated between the two strains independent of the analyzed genotype. In the wild-type lesioned animals, we found 757 (Table 2) and in the knock-out lesioned animals 682 (Table 3) known genes that were differentially regulated >1.5- and <0.66-fold between the two strains. Table 1 shows the number of regulated genes and the percentage of genes belonging to each category depending on the analyzed condition and genotype. Interestingly, the categories but also a high number of single genes were regulated similarly in all conditions. A list of all regulated genes is provided in the supplemental table (available at www.jneurosci.org as supplemental material).
Table 1.
Number of genes regulated in Sv129 naive or spinal cord lesioned wild-type/Nogo-A knock-out mice compared with BL/6
| Genotype | Wild type | Knock-out | Wild type | Knock-out |
|---|---|---|---|---|
| Lesion | − | − | + | + |
| Regulated genes >1.5 or <0.66 | 940 | 930 | 757 | 682 |
| Regulated genes >2 or <0.5 | 365 | 314 | 309 | 271 |
| Signaling | 47/12.9% | 34/11.1% | 35/11.3% | 28/10.3% |
| Cytoskeleton | 14/3.8% | 11/3.5% | 14/4.5% | 13/4.8% |
| Guidance | 5/1.4% | 9/2.9% | 4/1.3% | 2/0.7% |
| Extracellular matrix/cell adhesion | 20/5.5% | 20/6.4% | 12/3.9% | 12/4.4% |
| Growth machinery | 13/3.6% | 15/4.8% | 12/3.9% | 11/4.1% |
| Synapse | 7/1.9% | 5/1.6% | 4/1.3% | 3/1.1% |
| Immune response | 26/7.1% | 24/7.6% | 45/14.6% | 32/11.8% |
| Myelin proteins | 2/0.6% | 2/0.6% | 2/0.6% | 2/0.7% |
| Channels | 2/0.5% | 4/1.3% | 12/3.9% | 14/5.2% |
| Transport related | 35/9.6% | 30/9.6% | 5/1.6% | 3/1.1% |
| Cancer related | 3/0.8% | 4/1.3% | 2/0.6% | 2/0.7% |
| Blood related | 4/1.1% | 1/0.3% | 6/1.9% | 3/1.1% |
| Cell cycle/growth | 27/7.4% | 8/2.5% | 9/2.9% | 10/3.7% |
| DNA/RNA related | 56/15.3% | 37/11.8% | 31/10.0% | 34/12.5% |
| Transcription factors | 10/2.7% | 17/5.4% | 10/3.2% | 8/3.0% |
| Protein related | 27/7.4% | 25/8 % | 21/6.8% | 18/6.6% |
| Organelle related | 1/0.3% | 4/1.3% | 3/1.0% | 3/1.1% |
| Metabolism | 29/7.9% | 29/9.2% | 23/7.4% | 24/8.9% |
| Others | 37/10.1% | 34/10.8% | 60/19.4% | 49/18.1% |
Differentially regulated genes (Sv129 compared with BL/6) were sorted in different categories, and the number of regulated genes and percentage are shown for every condition.
Table 2.
List of genes regulated >2- and <0.5-fold in Sv129 wild-type mice compared with BL/6
| Cytoskeleton | ||
| ARP1 actin-related protein 1 homolog A | Actr1a | 0.34 |
| ARP1 actin-related protein 1 homolog A (yeast) | Actr1a | 0.14 |
| Axonemal dynein heavy chain 7 | 0.45 | |
| Beaded filament structural protein 2, phakinin | Bfsp2 | 0.41 |
| Capping protein (actin filament), gelsolin-like | Capg | 2.39 |
| Centrin 4 | LOC207175 | 0.48 |
| CLIP-associating protein 1 | Clasp1 | 3.14 |
| CLIP-associating protein 2 | Clasp2 | 3.85 |
| Cysteine-rich hydrophobic domain 1 | Chic1 | 0.31 |
| Ectodermal-neural cortex 1 | Enc1 | 3.18 |
| Formin 2 | Fmn2 | 0.47 |
| Gelsolin | Gsn | 0.14 |
| Gelsolin | Gsn | 0.15 |
| Kinesin 7 | 0.47 | |
| Kinesin family member 11 | Kif11 | 2.68 |
| LIM and SH3 protein 1 | Lasp1 | 2.12 |
| LIM homeobox protein 2 | Lhx2 | 6.25 |
| Myosin IB | Myo1b | 2.31 |
| Myosin VIIa | Myo7a | 0.44 |
| Spectrin α 1 | Spna1 | 2.08 |
| Spectrin α 1 | Spna1 | 7.10 |
| Tau tubulin kinase 1 | Ttbk1 | 2.27 |
| T-complex testis expressed 1 | Tctex1 | 2.05 |
| T-complex testis expressed 1 | Tctex1 | 2.72 |
| T-complex-associated testis expressed 1 | Tcte1 | 2.04 |
| Tropomodulin 2 | Tmod2 | 0.30 |
| Troponin I, skeletal, slow 1 | Tnni1 | 0.07 |
| Villin 2 | Vil2 | 2.77 |
| ECM/cell adhesion | ||
| Cadherin 1 | Cdh1 | 3.63 |
| Cadherin 4 | Cdh4 | 0.42 |
| Calnexin | Canx | 0.40 |
| Catenin α 1 | Catna1 | 2.48 |
| Cell adhesion molecule with homology to L1CAM | Chl1 | 0.32 |
| Collagen XII α 1 (Col12a1) | Cox7a2 | 0.45 |
| Dentin matrix protein 1 | Dmp1 | 0.38 |
| Dentin matrix protein 1 | Dmp1 | 0.48 |
| EGF-like module containing, mucin-like, hormone receptor-like sequence 4 | Emr4 | 3.19 |
| Hyaluronic acid binding protein 4 | Habp4 | 2.58 |
| Integrin α 4 | Itga4 | 3.50 |
| Integrin α 6 | Itga6 | 2.38 |
| Kin of IRRE-like 3 (Drosophila) | Kirrel3 | 2.41 |
| Kin of IRRE-like 3 (Drosophila) | Kirrel3 | 2.01 |
| Lectin, galactose binding, soluble 3 | Lgals3 | 0.49 |
| Lectin, galactoside-binding, soluble 3, binding protein | Ppicap | 0.40 |
| Neogenin | Neo1 | 2.01 |
| Ninjurin 2 | Ninj2 | 0.30 |
| Periostin, osteoblast-specific factor | AI747096 | 3.64 |
| Poliovirus receptor-related 3 | Pvrl3 | 2.77 |
| Procollagen, type I, α 2 | Col1a2 | 3.47 |
| Procollagen, type IV, α 1 | Col4a1 | 2.05 |
| Procollagen, type V, α 2 | Col5a2 | 3.35 |
| Procollagen, type XIV, α 1 | Col14a1 | 3.54 |
| Proteoglycan 4 (megakaryocyte-stimulating factor, articular superficial zone protein) | Prg4 | 2.63 |
| Protocadherin 10 | Pcdh10 | 2.77 |
| Protocadherin 18 | Pcdh18 | 0.45 |
| Protocadherin 8 | Pcdh8 | 2.44 |
| Protocadherin β 16 | Pcdhb16 | 2.24 |
| Spondin 1 (f-spondin) extracellular matrix protein | Spon1 | 0.41 |
| UBX domain containing 2 | 1300013G12Rik | 0.28 |
| UBX domain containing 2 | 1300013G12Rik | 0.42 |
| Growth machinery | ||
| Bone morphogenetic protein 1 | Bmp1 | 0.25 |
| Bone morphogenetic protein 4 | Bmp4 | 2.66 |
| CAP, adenylate cyclase-associated protein 1 | Cap1 | 12.95 |
| Doublecortin | Dcx | 0.40 |
| Fibroblast growth factor 1 | Fgf1 | 3.43 |
| Fibroblast growth factor 7 | Fgf7 | 3.59 |
| Growth arrest-specific 5 | Gas5 | 0.43 |
| Heat shock protein 1-like | Hspa1l | 0.15 |
| Histocompatibility 2, class II antigen A, β 1 | H2-Ab1 | 2.69 |
| Histocompatibility 2, class II antigen E, β | H2-Eb1 | 0.34 |
| Histocompatibility 28 | H28 | 19.07 |
| Hypoxia upregulated 1 | Cab140 | 2.92 |
| IL2-inducible T-cell kinase | Itk | 7.88 |
| Ig heavy chain (J558 family) | Igh-VJ558 | 0.49 |
| Ig κ chain variable 8 (V8) | Igk-V8 | 2.87 |
| Ig superfamily, member 4 | A830029E02Rik | 2.35 |
| Interferon activated gene 202B | Ifi202b | 101.53 |
| Interferon activated gene 202B | Ifi202b | 10.22 |
| Interferon activated gene 205 | Ifi205 | 0.18 |
| Interferon-dependent positive-acting transcription factor 3γ | Isgf3g | 0.47 |
| Interferon γ -induced GTPase | Igtp | 0.46 |
| Interferon γ -inducible protein 30 | Ifi30 | 2.04 |
| Interferon inducible protein 1 | Ifi1 | 0.41 |
| Interferon γ -inducible protein 16 | Ifi16 | 0.38 |
| Interferon-induced protein plus tetratrico repeats 1 | Ifit1 | 0.31 |
| Interferon-induced protein plus tetratrico repeats3 | Ifit3 | 0.35 |
| Interferon-stimulated protein | G1p2 | 0.30 |
| Interleukin 2 receptor, γ chain | Il2rg | 0.47 |
| Lymphocyte-activation gene 3 | Lag3 | 0.35 |
| Macrophage scavenger receptor 2 | Msr2 | 0.17 |
| Mouse IgE-binding factor mRNA | 0.27 | |
| Myeloid cell leukemia sequence 1 | Mcl1 | 2.10 |
| Paired Ig-like type 2 receptor β | Pilrb | 3.12 |
| Pentaxin-related gene | Ptx3 | 0.38 |
| Programmed cell death 4 | Pdcd4 | 3.19 |
| Programmed cell death 6-interacting protein | Pdcd6ip | 0.46 |
| Serine (or cysteine) proteinase inhibitor, clade A, 1b | Serpina1b | 86.03 |
| Serine (or cysteine) proteinase inhibitor, clade A, 3N | Serpina3n | 3.30 |
| TAP binding protein | Tapbp | 0.44 |
| T-cell-specific GTPase | Tgtp | 0.31 |
| TRAF-binding protein | Trabid | 2.07 |
| Tumor necrosis factor receptor superfamily, 11b | Tnfrsf11b | 2.94 |
| Myelin proteins | ||
| Galactosylceramidase | Galc | 0.12 |
| Galactosylceramidase | Galc | 0.10 |
| Myelin basic protein | Mbp | 2.80 |
| Myelin basic protein | Mbp | 7.56 |
| Synapse formation/maintenance | ||
| Caveolin, caveolae protein | Cav | 2.54 |
| Cellubrevin | Vamp3 | 0.45 |
| Pam, highwire, rpm 1 | Phr1 | 2.60 |
| Rab6 interacting protein 2 | Rab6ip2 | 0.26 |
| Receptor-associated protein of the synapse | Rapsn | 4.09 |
| SNAP-associated protein | Ilf2 | 3.09 |
| Synaptic vesicle glycoprotein 2c | Sv2c | 21.13 |
| Synaptopodin | Synpo | 0.48 |
| Synaptotagmin 1 | Syt1 | 2.17 |
| Synaptotagmin 2 | Syt2 | 0.35 |
| Syntaxin 11 | Stx11 | 2.67 |
| Signaling | ||
| 3-Monooxygenase/tryptophan 5-monooxygenase activation protein, γ | Ywhag | 0.44 |
| Activin receptor IIA | Acvr2 | 2.71 |
| Adenomatosis polyposis coli | Apc | 2.21 |
| Adenylate cyclase 7 | Adcy7 | 2.73 |
| Adenylate kinase 3α -like | Ak3l | 0.27 |
| Ankyrin repeat domain 17 | Ankrd17 | 2.13 |
| Ankyrin repeat domain 17 | Ankrd17 | 2.33 |
| Calbindin-28K | Calb1 | 2.32 |
| Calcium/calmodulin-dependent kinase II, δ | Camk2d | 0.23 |
| Growth factor receptor bound protein 2-associated protein 3 | Gab3 | 3.51 |
| Insulin-induced gene 2 | Insig2 | 2.42 |
| Insulin-like growth factor binding protein 3 | Igfbp3 | 2.98 |
| Insulin-like growth factor binding protein 3 | Igfbp3 | 2.92 |
| MAD homolog 4 (Drosophila) | Madh4 | 2.81 |
| Myocilin | Myoc | 0.14 |
| Myocilin | Myoc | 0.05 |
| Platelet-derived growth factor, D polypeptide | Pdgfd | 0.28 |
| Platelet-derived growth factor, D polypeptide | Pdgfd | 0.36 |
| Suprabasin | Sbsn | 0.43 |
| Suprabasin | Sbsn | 0.35 |
| Teratocarcinoma-derived growth factor | Tdgf1 | 0.24 |
| Timeless homolog (Drosophila) | Timeless | 2.25 |
| Timeless interacting protein | 1110005A05Ri | 2.72 |
| Timeless interacting protein | 1110005A05Ri | 5.98 |
| Transforming growth factor β 1-induced transcript 4 | Tgfb1i4 | 15.92 |
| Transforming growth factor, β induced | Tgfbi | 2.88 |
| Zinc finger protein 91 | Zfp91 | 2.51 |
| Guidance | ||
| Deleted in colorectal carcinoma | Dcc | 2.90 |
| Eph receptor A3 | Epha3 | 2.64 |
| Eph receptor B3 | Ephb3 | 2.32 |
| Neuron navigator 1 | Nav1 | 0.48 |
| Sema domain 6D | Sema6d | 7.56 |
| Sema domain 6D | Sema6d | 2.37 |
| Sema domain 5A | Sema5a | 2.08 |
| SemaF cytoplasmic domain-associated protein 3 | 1110020C07Ri | 2.48 |
| Slit homolog 2 (Drosophila) | Slit2 | 2.43 |
| Immune response | ||
| Baculoviral IAP repeat-containing 6 | Birc6 | 0.40 |
| Bcl2-antagonist/killer 1 | Bak1 | 2.84 |
| Bcl2-like 2 | Bcl2l2 | 2.42 |
| Beclin 1 (myosin-like Bcl2-interacting protein) | Becn1 | 3.08 |
| β 2 microglobulin | B2m | 0.39 |
| C1q and tumor necrosis factor-related protein 4 | 0710001E10Rik | 14.28 |
| Caspase 8-associated protein 2 | Casp8ap2 | 3.12 |
| Caspase recruitment domain family, member 10 | Card10 | 2.58 |
| Cathepsin E | Ctse | 7.52 |
| CD5 antigen-like | Cd5l | 0.03 |
| CD59a antigen | Cd59a | 2.72 |
| CD59a antigen | Cd59a | 2.32 |
| CD84 antigen | Cd84 | 0.29 |
| Chemokine (C-C motif) ligand 12 | Ccl12 | 0.30 |
| Chemokine (C-C motif) ligand 2 | Ccl2 | 0.48 |
| Chemokine (C-C motif) ligand 25 | Ccl25 | 3.67 |
| Chemokine (C-C) receptor-like 1 | Ccrl1 | 3.55 |
| Chemokine (C-X-C motif) ligand 10 | Cxcl10 | 0.27 |
| Chemokine (C-X-C motif) ligand 9 | Cxcl9 | 0.12 |
| Colony stimulating factor 2 receptor | Csf2rb2 | 7.67 |
| Complement component 1, q subcomponent, β polypeptide | C1qb | 0.40 |
| Complement component 1, q subcomponent, γ polypeptide | C1qg | 0.46 |
| Complement component 1, q subcomponent, γ polypeptide | C1qg | 0.43 |
| Complement component 1, r subcomponent | C1r | 0.49 |
| Complement protein C1q B-chain | C1qb | 0.39 |
| Constant region of Ig μ | Igh-6 | 0.41 |
| Cystatin F (leukocystatin) | Cst7 | 0.44 |
| Cytotoxic granule-associated RNA binding protein 1 | Tia1 | 0.04 |
| EF hand domain containing 2 | D4Wsu27e | 0.38 |
| EF hand domain containing 2 | D4Wsu27e | 0.35 |
| Fibrinogen-like protein 2 | Fgl2 | 2.13 |
| Friend virus susceptibility 1 | Fv1 | 3.28 |
| Friend virus susceptibility 1 | Fv1 | 2.98 |
| Heat shock 70 kDa protein 8 | 0.45 | |
| Heat shock protein 1-like | Hspa1l | 0.09 |
| Calmodulin-like 4 | Calml4 | 2.04 |
| Diacylglycerol kinase ζ | Dgkz | 2.08 |
| Diaphanous homolog 2 (Drosophila) | Diap2 | 2.66 |
| Doublecortin plus calcium/calmodulin-dependent kinase-like 1 | Dcamkl1 | 0.46 |
| Doublecortin plus calcium/calmodulin-dependent kinase-like 1 | Dcamkl1 | 2.69 |
| Down syndrome critical region gene 1-like 1 | Dscr1l1 | 0.30 |
| Fibroblast activation protein | Fap | 2.16 |
| Formyl peptide receptor-like 1 | Fprl1 | 2.66 |
| Frizzled-related protein | Frzb | 2.17 |
| G-protein-coupled receptor 23 | Gpr23 | 2.63 |
| G-protein-coupled receptor 27 | Gpr27 | 2.47 |
| G-protein-coupled receptor 84 | Gpr84 | 0.45 |
| G-protein-coupled receptor, family C, group 5, B | Gprc5b | 4.96 |
| Guanine nucleotide binding protein, γ 4 subtype | Gng4 | 0.31 |
| Guanine nucleotide binding protein, β 1 | Gnb1 | 3.45 |
| GDP dissociation inhibitor 3 | Gdi3 | 2.02 |
| Guanylate nucleotide binding protein 1 | Gbp1 | 47.62 |
| Guanylate nucleotide binding protein 2 | Gbp2 | 0.33 |
| Guanylate nucleotide binding protein 3 | Gbp3 | 0.39 |
| Guanylate nucleotide binding protein 3 | Gbp3 | 2.90 |
| Inositol polyphosphate-4-phosphatase, type I | Inpp4a | 3.09 |
| Jagged 1 | Jag1 | 5.42 |
| Microtubule associated serine/threonine kinase 2 | Mtssk | 2.14 |
| Mitogen-activated protein kinase 8 | Mapk8 | 3.54 |
| Mitogen-activated protein kinase kinase kinase 12 | Map3k12 | 3.19 |
| Mitogen-activated protein kinase kinase kinase 6 | Map3k6 | 0.46 |
| Patched homolog | Ptch | 0.26 |
| Periaxin | Prx | 2.77 |
| Phosphatidylinositol 3 kinase, regulatory subunit, polypeptide 4, p150 | Pik3r4 | 0.42 |
| Phosphatidylinositol 3-kinase, C2 domain-containing, α polypeptide | Pik3c2a | 8.33 |
| Phosphatidylinositol 4-kinase, catalytic, β | Pik4cb | 5.45 |
| Phosphatidylinositol glycan, class F | Pigf | 2.01 |
| Phosphodiesterase 7A | Pde7a | 2.28 |
| Phosphoinositide-3-kinase adaptor protein 1 | Pik3ap1 | 2.74 |
| Phospholipase C, β 4 | Plcb4 | 2.06 |
| Protein kinase C, α | Prkca | 5.00 |
| Protein kinase inhibitor, γ | Pkig | 0.45 |
| Protein kinase, AMP-activated, α 2 catalytic | Prkaa2 | 2.03 |
| Protein phosphatase 1, regulatory (inhibitor) 1A | Ppp1r1a | 2.10 |
| Protein phosphatase 1, regulatory (inhibitor) 1A | Ppp1r1a | 2.74 |
| Protein phosphatase 1, regulatory (inhibitor) 7 | Ppp1r7 | 2.02 |
| Protein tyrosine phosphatase 4a2 | Ptp4a2 | 2.24 |
| Protein tyrosine phosphatase, nonreceptor type 12 | Ptpn12 | 2.32 |
| Protein tyrosine phosphatase, receptor type, C | Ptprc | 2.20 |
| RAB2, member Ras oncogene family | Rab2 | 2.58 |
| RAB3C, member Ras oncogene family | Rab3c | 0.19 |
| Ras association (RalGDS/AF-6) domain family 2 | Rassf2 | 0.40 |
| Ras association (RalGDS/AF-6) domain family 2 | Rassf2 | 0.48 |
| Ras association (RalGDS/AF-6) domain family 5 | Rassf5 | 0.22 |
| Regulator of G-protein signaling 2 | Rgs2 | 2.17 |
| Regulator of G-protein signaling 4 | Rgs4 | 2.04 |
| Rhophilin, Rho GTPase binding protein 2 | Rhpn2 | 0.48 |
| Rhophilin, Rho GTPase binding protein 2 | Rhpn2 | 0.50 |
| Secreted Frizzled-related sequence protein 1 | Sfrp1 | 0.40 |
| Secreted Frizzled-related sequence protein1 | Sfrp1 | 0.33 |
| Septin 3 (Sept3), mRNA | 2.02 | |
| Serine/threonine kinase 25 (yeast) | Stk25 | 0.49 |
| Serine/threonine kinase 25 (yeast) | Stk25 | 0.27 |
| Sorting nexin 4 | Snx4 | 2.03 |
| T-complex expressed gene 1 | Tce1 | 0.26 |
| Transducer of ErbB2, 2 | Tob2 | 2.54 |
| Transducin-like enhancer of split 1 | Tle1 | 2.10 |
| Tripartite motif protein 12 | Trim12 | 0.05 |
| Tripartite motif protein 30 | Trim30 | 0.35 |
| Tripartite motif protein 30-like | LOC209387 | 0.16 |
| Tripartite motif protein 30-like | LOC209387 | 0.27 |
| Tripartite motif protein 34 | Trim34 | 0.12 |
| Tripartite motif protein 34 | Trim34 | 0.24 |
| Tubby-like protein 4 | Tulp4 | 3.22 |
| Tyrosine 3-monooxygenase/tryptophan 5-monooxygenase activation protein, ζ | Ywhaz | 4.86 |
| tyrosine 3-monooxygenase/tryptophan 5-monooxygenase activation protein, ζ | Ywhaz | 5.52 |
| Unc-51-like kinase 2 (Caenorhabditis elegans) | Ulk2 | 4.74 |
| Wingless-related MMTV integration site 7B | Wnt7b | 0.47 |
Differentially regulated genes (Sv129 compared with BL/6) belonging to the categories cytoskeleton, neurite growth and guidance, ECM/cell adhesion, immune response, myelin, synaptic function, and signaling, which show fold changes >2 or <0.5 (regulated genes 1 week after lesion in bold). A list of all of the regulated genes (also categories metabolism, RNA and DNA related, protein synthesis, proteolysis, channels/transporters/carriers, cell cycle, stress related, endocytosis, and transport) with fold changes >1.5 or <0.66 are shown in the supplemental table (available at www.jneurosci.org as supplemental material). CLIP, Cytoplasmic linker protein; EGF, epidermal growth factor; Eph, ephrin; IAP, inhibitor of apoptosis; IRRE, irregular chiasm; LIM, Lin-11/Isl-1/Mec-3; PDZ, postsynaptic density 95/Discs large/zona occludens-1; REC8, recombination 8; Sema, semaphorin; SH3, Src homology 3; UBX, ubiquitin-like.
Table 3.
List of genes regulated >2- and <0.5-fold in Sv129 Nogo-A knock-out mice compared with BL/6
| Cytoskeleton | ||
| ARP1 actin-related protein 1 homolog A (yeast) | Actr1a | 0.12 |
| Axonemal dynein heavy chain 7 | 0.46 | |
| Beaded filament structural protein 2, phakinin | Bfsp2 | 0.37 |
| Beaded filament structural protein 2, phakinin | Bfsp2 | 0.31 |
| Bicaudal D homolog 1 (Drosophila) | Bicd1 | 2.15 |
| Centrin 4 | LOC207175 | 0.43 |
| CLIP-associating protein 1 | Clasp1 | 2.07 |
| CLIP-associating protein 1 | Clasp1 | 2.99 |
| CLIP-associating protein 2 | Clasp2 | 3.22 |
| Coiled-coil-helix-coiled-coil-helix domain containing 3 | 0610041L09Rik | 2.45 |
| Cysteine-rich hydrophobic domain 1 | Chic1 | 0.14 |
| Fascin homolog 1, actin bundling protein | Fscn1 | 0.40 |
| Formin 2 | Fmn2 | 0.44 |
| Gelsolin | Gsn | 0.25 |
| Gelsolin | Gsn | 0.10 |
| Keratin complex 2, basic, gene 8 | Krt2–8 | 0.42 |
| Microtubule-associated protein 1 light chain 3α | 1010001H21Rik | 0.47 |
| Myosin VIIa | Myo7a | 0.34 |
| Myosin, heavy polypeptide 4, skeletal muscle | Myh4 | 0.03 |
| Myosin, heavy polypeptide 6, cardiac muscle, α | Myh6 | 0.43 |
| T-complex testis expressed 1 | Tctex1 | 2.54 |
| Tropomodulin 2 | Tmod2 | 0.25 |
| Troponin I, skeletal, slow 1 | Tnni1 | 0.06 |
| Troponin I, skeletal, slow 1 | Tnni1 | 0.05 |
| ECM/cell adhesion | ||
| Bone morphogenetic protein 1 | Bmp1 | 0.32 |
| Chondroitin sulfate proteoglycan 2 | Cspg2 | 2.25 |
| Chondroitin sulfate proteoglycan 3 | 2.20 | |
| Claudin 19 | Cldn19 | 0.46 |
| Contactin 2 | Cntn2 | 2.69 |
| Dedicator of cytokinesis 1 | Dock1 | 0.34 |
| Dedicator of cytokinesis 4 | Dock4 | 5.18 |
| Dentin matrix protein 1 | Dmp1 | 0.46 |
| EGF-like repeats and discordin I-like domains 3 | Edil3 | 2.23 |
| Fibromodulin | Fmod | 0.46 |
| Fibulin 1 | Fbln1 | 0.42 |
| Glypican 6 | Gpc6 | 2.09 |
| Hemicentin; fibulin 6 | 0.40 | |
| Hyaluronic acid binding protein 4 | Habp4 | 2.55 |
| Integrin α 4 | Itga4 | 2.66 |
| Integrin α 4 | Itga4 | 3.76 |
| Integrin, β -like 1 | B930011D01R | 0.26 |
| Kin of IRRE-like 3 (Drosophila) | Kirrel3 | 2.67 |
| Laminin B1 subunit 1 | Lamb1–1 | 2.58 |
| Matrilin-2 precursor | 0.42 | |
| Neural cell adhesion molecule 1 | Ncam1 | 2.19 |
| Neural cell adhesion molecule 2 | Ncam2 | 2.12 |
| Procollagen, type VIII, α 2 | Col8a2 | 0.47 |
| Protocadherin 8 | Pcdh8 | 2.15 |
| Protocadherin β 16 | Pcdhb16 | 3.60 |
| Protocadherin γ subfamily A, 12 | Pcdhga12 | 0.49 |
| Spondin 1 (f-spondin) extracellular matrix protein | Spon1 | 0.42 |
| Spondin 2, extracellular matrix protein | Spon2 | 0.45 |
| Thrombospondin 1 | Thbs1 | 0.24 |
| UBX domain containing 2 | 1300013G12R | 0.31 |
| Growth machinery | ||
| BMP2 inducible kinase | Bmp2k | 0.30 |
| CAP, adenylate cyclase-associated protein 1 | Cap1 | 9.03 |
| CAP, adenylate cyclase-associated protein 1 | Cap1 | 3.99 |
| c-fos induced growth factor | Figf | 2.40 |
| Doublecortin | Dcx | 0.41 |
| Fibroblast growth factor inducible 15 | Fin15 | 2.43 |
| Growth arrest-specific 5 | Gas5 | 0.43 |
| Growth factor receptor bound protein 14 | Grb14 | 2.35 |
| Growth factor receptor bound protein 14 | Grb14 | 2.11 |
| Hepatoma-derived growth factor | Hdgf | 6.78 |
| Hepatoma-derived growth factor, related protein 3 | Hdgfrp3 | 2.13 |
| Insulin-like growth factor binding protein 2 | Igfbp2 | 0.50 |
| Insulin-like growth factor binding protein 2 | Igfbp2 | 0.50 |
| Myocilin | Myoc | 0.06 |
| Myocilin | Myoc | 0.05 |
| Papillary renal cell carcinoma | Prcc | 0.32 |
| Platelet-derived growth factor, D polypeptide | Pdgfd | 0.20 |
| Platelet-derived growth factor, D polypeptide | Pdgfd | 0.29 |
| T-cell lymphoma invasion and metastasis 1 | Tiam1 | 2.07 |
| Tumor necrosis factor α induced protein 6 | Tnfaip6 | 2.39 |
| Myelin | ||
| Galactosylceramidase | Galc | 0.10 |
| Galactosylceramidase | Galc | 0.11 |
| Myelin basic protein | Mbp | 6.05 |
| Myelin basic protein | Mbp | 3.14 |
| Synapse formation/maintenance | ||
| Cellubrevin | Vamp3 | 0.39 |
| Rab6 interacting protein 2 | Rab6ip2 | 0.24 |
| SNAP-associated protein | Ilf2 | 2.54 |
| Synaptic vesicle glycoprotein 2c | Sv2c | 13.36 |
| Synaptic vesicle glycoprotein 2c | Sv2c | 14.06 |
| Synaptotagmin 2 | Syt2 | 0.30 |
| Synaptotagmin 7 | Syt7 | 2.73 |
| Tubulin, β 2 | Tubb2 | 2.11 |
| Signaling | ||
| Adenylate cyclase 7 | Adcy7 | 2.50 |
| Adenylate kinase 3 α -like | Ak3l | 0.32 |
| Adenylate kinase 3 α -like | Ak3l | 0.24 |
| Calcium/calmodulin-dependent kinase II α | Camk2a | 2.26 |
| Calcium/calmodulin-dependent kinase II, δ | Camk2d | 0.40 |
| Calmodulin-like 4 | Calml4 | 2.52 |
| Casein kinase II, α 1 polypeptide | Csnk2a1 | 2.51 |
| Deleted in liver cancer 1 | Dlc1 | 4.18 |
| Diaphanous homolog 2 (Drosophila) | Diap2 | 2.10 |
| Doublecortin and calcium/calmodulin-dependent protein kinase-like 1 | Dcamkl1 | 0.32 |
| Down syndrome critical region gene 1-like 1 | Dscr1l1 | 0.36 |
| Dual specificity phosphatase 16 | Dusp16 | 2.17 |
| Era (G-protein)-like 1 (Escherichia coli) | Eral1 | 2.01 |
| G-protein-coupled receptor 23 | Gpr23 | 2.19 |
| G-protein-coupled receptor 34 | Gpr34 | 2.00 |
| G-protein-coupled receptor 64 | Gpr64 | 2.80 |
| G-protein-coupled receptor, family C, group 5, B | Gprc5b | 4.30 |
| G-protein-coupled receptor, family C, group 5, B | Gprc5b | 5.22 |
| Guanine nucleotide binding protein, γ 4 | Gng4 | 0.33 |
| Guanine nucleotide binding protein, β 1 | Gnb1 | 3.04 |
| Guanine nucleotide binding protein, β 1 | Gnb1 | 3.12 |
| Guanylate nucleotide binding protein 1 | Gbp1 | 8.53 |
| REC8-like 1 (yeast) | Rec8L1 | 0.07 |
| REC8-like 1 (yeast) | Rec8L1 | 0.02 |
| Suprabasin | Sbsn | 0.31 |
| Suprabasin | Sbsn | 0.26 |
| Teratocarcinoma-derived growth factor | Tdgf1 | 0.30 |
| Teratocarcinoma-derived growth factor | Tdgf1 | 0.33 |
| Timeless interacting protein | 1110005A05Rik | 4.53 |
| Transforming growth factor β 1 induced 4 | Tgfb1i4 | 9.50 |
| Guidance | ||
| Deleted in colorectal carcinoma | Dcc | 2.38 |
| Eph receptor B2 | Ephb2 | 2.19 |
| Ephrin B2 | Efnb2 | 2.11 |
| Netrin G1 | Ntng1 | 2.05 |
| Neuron navigator 1 | Nav1 | 0.35 |
| Plexin C1 | Plxnc1 | 0.47 |
| Sema domain 5A | Sema5a | 3.21 |
| Sema domain 6D | Sema6d | 6.62 |
| Sema domain 7A | Sema7a | 2.01 |
| Sema domain 6D | Sema6d | 4.13 |
| Slit homolog 2 (Drosophila) | Slit2 | 2.38 |
| Immune response | ||
| Baculoviral IAP repeat-containing 6 | Birc6 | 2.03 |
| B-cell stimulating factor 3 | Bsf3 | 0.35 |
| Bcl2-like 11 (apoptosis facilitator) | Bcl2l11 | 0.36 |
| Bcl2-like 2 | Bcl2l2 | 3.09 |
| C1q and tumor necrosis factor-related protein 4 | 0710001E10R | 17.35 |
| Caspase 8-associated protein 2 | Casp8ap2 | 2.75 |
| Caspase recruitment domain family 10 | Card10 | 2.48 |
| Cathepsin E | Ctse | 5.72 |
| CD1d1 antigen | Cd1d1 | 2.36 |
| CD5 antigen-like | Cd5l | 0.01 |
| CD59a antigen | Cd59a | 2.58 |
| CD84 antigen | Cd84 | 0.20 |
| Chemokine (C-C) receptor 2 | Ccr2 | 0.35 |
| Chemokine (C-C) receptor-like 1 | Ccrl1 | 2.52 |
| Chemokine (C-X-C motif) ligand 13 | Cxcl13 | 2.93 |
| Chemokine (C-X-C motif) ligand 7 | Cxcl7 | 0.47 |
| Complement component 1, q subcomponent, β | C1qb | 0.35 |
| Complement component 1, q subcomponent, β | C1qb | 0.33 |
| Complement component1,q subcomponent, γ | C1qg | 0.31 |
| Complement component factor h | Cfh | 0.34 |
| Complement protein C1q B-chain | C1qb | 0.35 |
| Constant region of Ig μ | Igh-6 | 0.29 |
| Cystatin F (leukocystatin) | Cst7 | 0.42 |
| Cytotoxic granule-associated RNA binding protein 1 | Tia1 | 0.01 |
| EF hand domain containing 2 | D4Wsu27e | 0.11 |
| Engulfment and cell motility 1, ced-12 homology | Elmo1 | 2.17 |
| Friend virus susceptibility 1 | Fv1 | 3.20 |
| Guanylate nucleotide binding protein 1 | Gbp1 | 48.55 |
| Guanylate nucleotide binding protein 3 | Gbp3 | 2.24 |
| Heat shock protein 4 | Hspa4 | 2.33 |
| Histocompatibility 2, class II antigen A, α | H2-Aa | 0.32 |
| Histocompatibility 2, class II antigen A, β 1 | H2-Ab1 | 2.06 |
| Histocompatibility 2, class II antigen E β | H2-Eb1 | 0.26 |
| Histocompatibility 2, class II antigen E β | H2-Eb1 | 0.41 |
| Histocompatibility 2, K region | H2-K | 2.55 |
| Histocompatibility 2, T region locus 24 | H2-T24 | 2.14 |
| Histocompatibility 28 | H28 | 34.75 |
| Hypoxia upregulated 1 | Cab140 | 2.26 |
| Ig heavy chain 6 (of IgM) | Igh-6 | 0.39 |
| Ig heavy chain 6 (of IgM) | Igh-6 | 0.28 |
| Ig κ chain variable 8 (V8) | Igk-V8 | 0.21 |
| Interferon activated gene 202B | Ifi202b | 45.89 |
| Interferon activated gene 202B | Ifi202b | 37.97 |
| Interferon activated gene 205 | Ifi205 | 0.21 |
| Interferon-stimulated protein | Isg20 | 0.45 |
| Interleukin 15 | Il15 | 0.50 |
| Interleukin 6 signal transducer | Il6st | 3.16 |
| Macrophage scavenger receptor 2 | Msr2 | 0.08 |
| Macrophage scavenger receptor 2 | Msr2 | 0.15 |
| Myeloid/lymphoid or mixed-lineage leukemia 5 | Mll5 | 2.92 |
| Pentaxin-related gene | Ptx3 | 0.37 |
| Programmed cell death 4 | Pdcd4 | 2.39 |
| Serine/cysteine proteinase inhibitor, clade A, 1b | Serpina1b | 49.97 |
| Serine/cysteine proteinase inhibitor, clade A, 1b | Serpina1b | 59.35 |
| Guanylate nucleotide binding protein 2 | Gbp2 | 0.39 |
| Inositol polyphosphate-4phosphatase, type I | Inpp4a | 2.31 |
| Intersectin (SH3 domain protein 1A) | Itsn | 2.62 |
| Mitogen-activated protein kinase 8 | Mapk8 | 4.27 |
| Mitogen-activated protein kinase 8 | Mapk8 | 3.48 |
| Mitogen-activated protein kinase kinase kinase 12 | Map3k12 | 4.12 |
| Mitogen-activated protein kinase 6 | Mapk6 | 0.43 |
| Myristoylated alanine-rich protein kinase C substrate | Marcks | 2.56 |
| Patched homolog | Ptch | 0.36 |
| PDZ and LIM domain 2 | Pdlim2 | 0.49 |
| Phosphatidylinositol 3 kinase, regulatory subunit, polypeptide 4, p150 | Pik3r4 | 0.44 |
| Phosphatidylinositol 3 kinase, regulatory subunit, polypeptide 4, p150 | Pik3r4 | 0.39 |
| Phosphatidylinositol 4-kinase, catalytic, β | Pik4cb | 6.59 |
| Phosphoinositide-3-kinase adaptor protein 1 | Pik3ap1 | 4.15 |
| Phosphoinositide-3-kinase adaptor protein 1 | Pik3ap1 | 2.56 |
| Protein kinase inhibitor, γ | Pkig | 0.41 |
| Protein kinase inhibitor, γ | Pkig | 0.40 |
| Protein phosphatase 1, catalytic subunit, β | Ppp1cb | 2.21 |
| Protein phosphatase 1, regulatory (inhibitor) 16B | Ppp1r16b | 2.13 |
| Protein phosphatase 2, regulatory B α | Ppp2r5a | 2.03 |
| Protein phosphatase 2, regulatory B, ϵ | Ppp2r5e | 2.19 |
| Protein phosphatase 2, regulatory B, δ | Ppp2r2d | 2.19 |
| Protein tyrosine phosphatase 4a2 | Ptp4a2 | 6.46 |
| Protein tyrosine phosphatase, nonreceptor type 11 | Ptpn11 | 0.39 |
| Protein-tyrosine kinase | 0.42 | |
| ras homolog gene family, member G | Arhg | 0.40 |
| Rhophilin, Rho GTPase binding protein 2 | Rhpn2 | 0.50 |
| Secreted frizzled-related sequence protein 1 | Sfrp1 | 0.50 |
| Serine/threonine kinase 25 (yeast) | Stk25 | 0.48 |
| Sorting nexin 5 | Snx5 | 0.49 |
| Sorting nexin 6 | Snx6 | 0.04 |
| Spinocerebellar ataxia 1 homolog (human) | Sca1 | 2.09 |
| Spinocerebellar ataxia 2 homolog (human) | Sca2 | 2.21 |
| Sprouty homolog 4 (Drosophila) | Spry4 | 0.50 |
| Suppressor of cytokine signaling 3 | Socs3 | 2.42 |
| T-complex expressed gene 1 | Tce1 | 0.27 |
| T-complex expressed gene 1 | Tce1 | 0.09 |
| Tripartite motif protein 12 | Trim12 | 0.03 |
| Tripartite motif protein 30-like | LOC209387 | 0.19 |
| Tripartite motif protein 34 | Trim34 | 0.27 |
| Tubby-like protein 4 | Tulp4 | 2.44 |
Differentially regulated genes (Sv129 compared with BL/6) belonging to the categories cytoskeleton, neurite growth and guidance, ECM/cell adhesion, immune response, myelin, synaptic function, and signaling, which show fold changes >2 or <0.5 (regulated genes 1 week after lesion in bold). CLIP, Cytoplasmic linker protein; EGF, epidermal growth factor; Eph, ephrin; IAP, inhibitor of apoptosis; IL2, interleukin 2; IRRE, irregular chiasm; L1CAM, L1 cell adhesion molecule; LIM, Lin-11/Isl-1/Mec-3; MAD, max dimerization protein; PDZ, postsynaptic density 95/Discs large/zona occludens-1; REC8, recombination 8; Sema, semaphorin; SH3, Src homology 3; TAP, tapasin precursor; TRAF, tumor necrosis factor receptor-associated factor; UBX, ubiquitin-like.
Macrophage invasion and scar formation
To study possible strain differences in the inflammatory reaction of the spinal cord to injury, we stained the sections of the nontraced side of the injured spinal cords with the antibody FA/11, which recognizes a membrane sialoglycoprotein highly expressed by activated macrophages and microglia (Rabinowitz and Gordon, 1991). The astrocytic scar was visualized by immunohistochemistry for GFAP. Activated microglia/macrophages carrying the FA/11 antigen filled the debris zone of the lesion center 2 weeks after injury and were also found in the surrounding tissue with pronounced differences between the two mouse strains and between wild-type and knock-out animals (Fig. 5A–D). The areas of tissue infiltrated with activated microglia/macrophages were scored by three blinded observers on three sections per animal for four to six animals per group. The results (Fig. 5E) show a conspicuous difference in macrophage recruitment between the Sv129 and the BL/6 strains: not only was the number of activated microglia/macrophages much lower in the Sv129 strain, but their FA/11 staining was also remarkably weaker, pointing toward a lower expression of this activation-specific antigen (Fig. 5A–E). In both strains, more microglia/macrophages were observed in the Nogo-A knock-out than in the wild-type animals (Fig. 5A–E). In contrast to the microglia/macrophage reaction, the astrocytic scar as reflected by the staining for GFAP was similar in the two mouse strains at this time point after lesion and not significantly enhanced in the Nogo-A knock-out animals (Fig. 5F).
Figure 5.
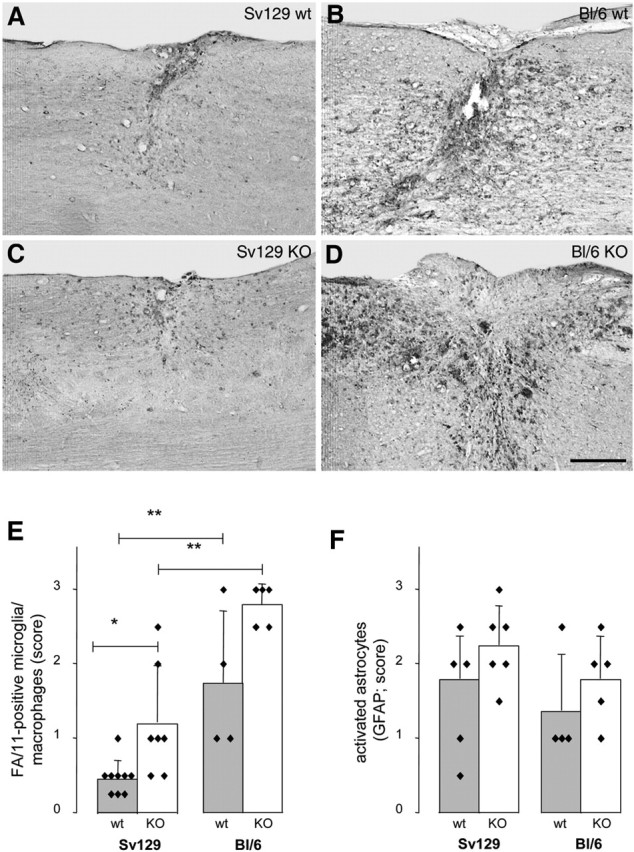
Inflammatory response and scar formation in Sv129 and BL/6 wild-type and Nogo-A knock-out mice. Mouse strain- and genotype-specific differences in number, density, and staining intensity of activated, FA/11-positive microglia/macrophages in and around the lesion site 2 weeks after spinal cord injury. A, 129X1/SvJ wild type (wt). B, C57BL/6 wild type (wt). C, 129X1/SvJ Nogo-A knock-out (KO). D, C57BL/6 Nogo-A knock-out (KO). Activated microglia/macrophages are more numerous and more activated in the BL/6 strain than in Sv129 mice and more frequent in the KO mice in both strains. Scale bar, 250 μm. E, Quantification of activated, FA/11-positive microglia/macrophages in and around lesion sites. F, Quantification of activated, strongly GFAP-positive astrocytes and astrocyte process network. *p < 0.05, **p < 0.01 (Mann–Whitney U test).
Discussion
Partial transection of the spinal cord in Nogo-A knock-out mice with the pure strain backgrounds of 129X1/SvJ and C57BL/6 resulted in enhanced regenerative sprouting and long-distance regeneration compared with wild-type mice of the same strains. Surprisingly, Nogo-A knock-out animals of the Sv129 strain had two to four times higher numbers of fibers regenerating caudal to the lesion than the knock-out animals of the BL/6 strain. A higher endogenous neurite growth potential of the Sv129 strain was also demonstrated by the higher number of DRG neurites growing from ganglion explants in culture, as well as by RNA profiling of non-injured but also lesioned adult spinal cord tissue: Sv129 mice showed stronger endogenous expression of many neurite growth-related genes when compared with spinal cords of BL/6 mice. Important differences of the two mouse strains were also observed in the posttraumatic inflammatory reaction.
The importance of Nogo-A as a physiological inhibitor of neurite growth in the adult CNS of higher vertebrates was for a long time based on the in vivo effects of neutralizing monoclonal antibodies (Schwab, 2004; Liebscher et al., 2005), which showed enhancement of regenerative and compensatory fiber growth and increased functional recovery. A confusing situation arose, however, when three papers (Kim et al., 2003; Simonen et al., 2003; Zheng et al., 2003) describing independently generated lines of Nogo knock-out mice came to partially divergent results. The scatter in the data were large in all the three studies, and all of them used early F2/F3 generations of chimeric mice originating from Sv129 recombined ES cells implanted into BL/6 blastocysts. None of the three laboratories has determined the proportions of the strain-specific genomes in their mouse lines.
The present results show two remarkable features compared with these previous studies. (1) The Nogo-A-deleted mice in both of the pure backgrounds showed clear enhancement of CST regeneration within 2 weeks after lesion in adult mice. The scatter among the individual animals within each group was large, but this is typical for partial spinal cord lesions in which the detailed anatomy of the lesion and the availability of tissue bridges vary from animal to animal because of ischemia, bleeding, and secondary tissue loss. (2) Regenerative growth and arborization of CST fibers was two to four times higher in the Sv129 Nogo-A knock-out mice than in the BL/6 background. This result is in line with a previous observation showing the occurrence of local sprouting of primary afferent nociceptive fibers caudal to a spinal cord lesion in Sv129 but not in BL/6 mice (Jacob et al., 2003). The present data therefore clearly show a major regeneration-enhancing effect of Nogo-A deletion in mice and a strong influence of the genetic background. If we take into account that even the best tracing techniques only stain a few percent of the total number of axons in the CST and that the mice used in this study had a mean number of 1100 ± 339 (mean ± SD; n = 14) labeled CST fibers, then the numbers observed correspond to 5–15% of all traced CST fibers. This is well in line with regeneration results using antibodies or Nogo-blocking peptides (Schwab, 2004).
Many strain differences have been observed between inbred mouse strains. Sv129 strains have been studied extensively because of their widespread use as donors of ES cells. The following properties of Sv129 mice are remarkable in the context of the present regeneration results: Sv129 mice have lower endogenous Nogo-A and Nogo-B levels than BL/6 mice. Sv129 DRG explants grow a higher number of axons within 3 d in vitro compared with BL/6 DRGs. In line with these findings, Sv129 mice express higher mRNA levels of a number of neurite growth-related genes in the adult spinal cord. Sv129 mice show a lower level of inflammatory cell recruitment after thioglycolate injection into the peritoneum (White et al., 2002). After spinal cord contusion, the initial lesion development and macrophage number was identical in 129X1/SvJ and C57BL/6 mice, but, at 2 weeks after injury, the Sv129 mice were observed to have less inflammation, more astrocytes and Schwann cells migrating into the lesion, less chondroitin sulfate proteoglycans, more laminin, and also more serotonergic (central) and calcitonin gene-related peptide-positive (peripheral) axons within the lesion (Ma et al., 2004). These results are in good agreement with the observations on microglia/macrophage recruitment made in the present study. Interestingly, the enhanced activation of microglia/macrophages in knock-outs of the BL/6 strain correlates with the higher sprouting score in these mice. It has been shown that the molecular mechanism of sprouting rostral to a lesion is involving neurotrophic factors such as BDNF and glial cell line-derived neurotrophic factor, which are produced by activated macrophages and microglia as a local trophic gradient increasing toward the lesion center (Batchelor et al., 2000, 2002). A lower level of inflammatory reactions in Sv129 mice is also reflected by the fact that these mice are resistant to experimental allergic encephalomyelitis induced by myelin oligodendrocyte glycoprotein, in contrast to BL/6 mice, which mount a severe, progressing disease (Willenborg et al., 1996). All of these data clearly show the big differences between Sv129 and BL/6 mice in a number of parameters that may be relevant to neurite growth, regeneration, and circuit rearrangement after spinal cord lesions. We hypothesize that the contradictory results obtained in the previous Nogo knock-out studies are attributable to specific properties of the mouse lines used, in particular their specific composition and mixture of background genes. The fact that the Nogo-A,-B,-C knock-out line used by one of the laboratories originated from a single animal that escaped lethality (Zheng et al., 2003) already demonstrates drastically how background genes can influence the outcome of gene deletions.
For a better understanding of the strain differences in regeneration capacity of the two Nogo-A knock-outs, we performed gene expression microarray analyses on spinal cords of Sv129 and BL/6 wild-type and knock-out animals. To study the endogenous, strain-specific capacity of these animals to regenerate, in the absence of the very complex gene expression changes induced by the lesion, we first used naive, non-injured animals. The results show, independent of the genotype, higher mRNA levels in adult Sv129 mice for a remarkable number of genes involved in neurite growth, axonal guidance, cell adhesion, and synapse formation and function. The lower intrinsic growth capacity of BL/6 mice, in turn, could well explain why regeneration was much more difficult to detect if chimeric mice have a high proportion of BL/6 genetic background. To better understand potential differences in repair capacity of animals of the two different strains, we also performed a gene chip experiment between Sv129 and BL/6 spinal cords 1 week after a spinal cord injury. Again, the same functional categories of differentially expressed genes in the Sv129 versus the BL/6 mice were observed as in the intact spinal cords.
Many of the differentially expressed genes in Sv129 versus BL/6, independent of the genotype (wild type or Nogo-A knock-out) or presence or absence of a spinal cord lesion belong to functional categories such as signaling, cytoskeleton, growth and trophic factors, extracellular matrix, guidance, synapse formation, and maintenance. Signaling molecules such as the small GTPases and the mitogen-activated protein kinases, which are differentially expressed between the two strains, are known to play a role in growth of neurites and cytoskeletal dynamics. Interesting differences in cytoskeletal proteins were seen for tubulins and troponins, the actin regulator Gelsolin (downregulated in Sv129), or the cytoplasmic linker-associated proteins (CLASPs) that are involved in stabilizing microtubules in neuronal growth cones (upregulated in Sv129). Growth-promoting substrates such as laminins and neural cell adhesion molecules were upregulated in the Sv129 knock-out spinal cords after the lesion. Strain-specific differential expression was also seen for axonal guidance molecules, such as ephrins and semaphorins, and their receptors (ephrins, netrins, slits, deleted in colorectal cancer), which were mainly upregulated in the Sv129 strain. In addition to neurite growth-associated components, we also observed strain differences in many synaptic mRNAs, e.g., synaptotagmins, syntaxins, soluble N-ethylmaleimide-sensitive factor attached proteins, and Piccolo. These distinct patterns of gene expression support the hypothesis that a higher endogenous neurite growth capacity of the adult Sv129 CNS could lead to the higher numbers of regenerating CST fibers observed in the injured spinal cord of Sv129 Nogo-A knock-out compared with the BL/6 mice.
In conclusion, comparison of the Sv129 to BL/6 mice showed a surprising difference in neurite growth capacity, both in vivo in the injured spinal cord under the growth-permissive conditions of Nogo-A deletion and in vitro for newborn wild-type DRG neurons. Differences in gene expression levels of the intact or lesioned adult spinal cord mirror the strain difference in neurite growth capacity, suggesting underlying genetic differences in regulatory factors. The present results also demonstrate the importance of Nogo-A as an in vivo inhibitor of neurite growth and regeneration in the spinal cord. The regeneration obtained in the knock-out mice closely resemble the results obtained with acute treatments with neutralizing antibodies in the rat (Schwab, 2004; Liebscher et al., 2005). These findings on important genetic differences in neurite growth and regeneration may be relevant for studies of nervous system development and repair in experimental animals, as well as in humans.
Footnotes
* L.D. and L.S. contributed equally to this work.
M. Simonen's present address: Novartis Institutes for Biomedical Research, Novartis Pharma, CH-4000 Basel, Switzerland.
The study was supported by Swiss National Science Foundation Grant 31-63633.00, the National Center of Competence in Research “Neural Plasticity and Repair” of the Swiss National Science Foundation, the Spinal Cord Consortium of the Christopher Reeve Paralysis Foundation (Springfield, NJ), the Transregio-Sonderforschungsbereich Konstanz–Zurich, and the European Union NeuroNetwork Project. We thank Prof. V. H. Perry, University of Southampton (Southampton, UK) for the FA/11 antibody, the Functional Genomics Center Zurich for assistance with the gene chips, Franziska Christ (Zurich, Switzerland) for genotyping of the mice, Jeannette Scholl for her help with the histology, and Roland Schoeb and Eva Hochreutener for the assistance with the figures.
References
- Batchelor PE, Liberatore GT, Porritt MJ, Donnan GA, Howells DW (2000). Inhibition of brain-derived neurotrophic factor and glial cell line-derived neurotrophic factor expression reduces dopaminergic sprouting in the injured striatum. Eur J Neurosci 12:3462–3468. [DOI] [PubMed] [Google Scholar]
- Batchelor PE, Porritt MJ, Martinello P, Parish CL, Liberatore GT, Donnan GA, Howells DW (2002). Macrophages and microglia produce local trophic gradients that stimulate axonal sprouting toward but not beyond the wound edge. Mol Cell Neurosci 21:436–453. [DOI] [PubMed] [Google Scholar]
- Benson MD, Romero MI, Lush ME, Lu QR, Henkemeyer M, Parada LF (2005). Ephrin-B3 is a myelin-based inhibitor of neurite outgrowth. Proc Natl Acad Sci USA 102:10694–10699. [DOI] [PMC free article] [PubMed] [Google Scholar]
- Bradbury EJ, Moon LDF, Popat RJKVR, Bennet GS, Patel PN, Fawcett JW, McMahon SB (2002). Chondroitinase ABC promotes functional recovery after spinal cord injury. Nature 416:636–640. [DOI] [PubMed] [Google Scholar]
- Brosamle C, Huber AB, Fiedler M, Skerra A, Schwab ME (2000). Regeneration of lesioned corticospinal tract fibers in the adult rat induced by a recombinant, humanized IN-1 antibody fragment. J Neurosci 20:8061–8068. [DOI] [PMC free article] [PubMed] [Google Scholar]
- Caroni P, Schwab ME (1988). Two membrane protein fractions from rat central myelin with inhibitory properties for neurite growth and fibroblast spreading. J Cell Biol 106:1281–1288. [DOI] [PMC free article] [PubMed] [Google Scholar]
- Chen MS, Huber AB, van der Haar ME, Frank M, Schnell L, Spillmann AA, Christ F, Schwab ME (2000). Nogo-A is a myelin-associated neurite outgrowth inhibitor and an antigen form monoclonal antibody IN-1. Nature 403:434–439. [DOI] [PubMed] [Google Scholar]
- Dodd DA, Niederoest B, Bloechlinger S, Dupuis L, Loeffler JP, Schwab ME (2005). Nogo-A, -B, and -C are found on the cell surface and interact together in many different cell types. J Biol Chem 280:12494–12502. [DOI] [PubMed] [Google Scholar]
- Filbin MT (2003). Myelin-associated inhibitors of axonal regeneration in the adult mammalian CNS. Nat Rev Neurosci 4:703–713. [DOI] [PubMed] [Google Scholar]
- Fitch MT, Silver J (1997). Glial cell extracellular matrix: boundaries for axon growth in development and regeneration. Cell Tissue Res 290:379–384. [DOI] [PubMed] [Google Scholar]
- Fournier AE, Gould GC, Liu BP, Strittmatter SM (2002). Truncated soluble Nogo receptor binds Nogo-66 and blocks inhibition of axon growth by myelin. J Neurosci 22:8876–8883. [DOI] [PMC free article] [PubMed] [Google Scholar]
- Goldberg JL, Vargas ME, Wang JT, Mandemakers W, Oster SF, Sretavan DW, Barres BA (2004). An oligodendorcyte lineage-specific semaphorin, Sema5A, inhibits axon growth by retinal ganglion cells. J Neurosci 24:4989–4999. [DOI] [PMC free article] [PubMed] [Google Scholar]
- GrandPré T, Li S, Strittmatter SM (2002). Nogo-66 receptor antagonist peptide promotes axonal regeneration. Nature 417:547–551. [DOI] [PubMed] [Google Scholar]
- Herzog A, Brösamle C (1997). “Semi-floating” treatment: a simple and fast method to process consecutive sections for immunohistochemistry and neuronal tracing. J Neurosci Methods 72:57–63. [DOI] [PubMed] [Google Scholar]
- Jacob JE, Gris P, Fehlings MG, Weaver LC, Brown A (2003). Autonomic dysreflexia after spinal cord transection or compression in 129Sv, C57BL, and Wallerian degeneration slow mutant mice. Exp Neurol 183:136–146. [DOI] [PubMed] [Google Scholar]
- Kim JE, Li S, GrandPre T, Qiu D, Strittmatter SM (2003). Axon regeneration in young adult mice lacking Nogo-A/B. Neuron 38:187–199. [DOI] [PubMed] [Google Scholar]
- Li S, Liu BP, Budel S, Li M, Ji B, Walus L, Li W, Jirik A, Rabacchi S, Choi E, Worley D, Sah DW, Pepinsky B, Lee D, Relton J, Strittmatter SM (2004). Blockade of Nogo-66, myelin-associated glycoprotein, and oligodendrocyte myelin glycoprotein by soluble Nogo-66 receptor promotes axonal sprouting and recovery after spinal injury. J Neurosci 24:10511–10520. [DOI] [PMC free article] [PubMed] [Google Scholar]
- Liebscher T, Schnell L, Schnell D, Scholl J, Schneider R, Gullo M, Fouad K, Mir A, Rausch M, Kindler D, Hamers FPT, Schwab ME (2005). Nogo-A antibody improves regeneration and locomotion of spinal cord-injured rats. Ann Neurol 58:706–719. [DOI] [PubMed] [Google Scholar]
- Ma M, Wei P, Wei T, Ransohoff RM, Jakeman LB (2004). Enhanced axonal growth into a spinal cord contusion injury site in a strain of mouse (129X1/SvJ) with a diminished inflammatory response. J Comp Neurol 474:469–486. [DOI] [PubMed] [Google Scholar]
- Markel P, Shu P, Ebeling C, Carlson GA, Nagle DL, Smutko JS, Moore KJ (1997). Theoretical and empirical issues for marker-assisted breeding of congenic mouse strains. Nat Genet 17:280–284. [DOI] [PubMed] [Google Scholar]
- Merkler D, Metz GAS, Raineteau O, Dietz V, Schwab ME, Fouad K (2001). Locomotor recovery in spinal cord-injured rats treated with an antibody neutralizing the myelin-associated neurite growth inhibitor Nogo-A. J Neurosci 21:3665–3673. [DOI] [PMC free article] [PubMed] [Google Scholar]
- Moreau-Fauvarque C, Kumanogoh A, Camand E, Jaillard C, Barbin G, Boquet I, Love C, Jones EY, Kikutani H, Lubetzki C, Dusart I, Chédotal A (2003). The transmembrane semaphorin Sema4D/CD100, an inhibitor of axonal growth, is expressed on oligodendrocytes and upregulated after CNS lesion. J Neurosci 23:9229–9239. [DOI] [PMC free article] [PubMed] [Google Scholar]
- Niederost B, Oertle T, Fritsche J, McKinney RA, Bandtlow CE (2002). Nogo-A and myelin-associated glycoprotein mediate neurite growth inhibition by antagonistic regulation of RhoA and Rac1. J Neurosci 22:10368–10376. [DOI] [PMC free article] [PubMed] [Google Scholar]
- Oertle T, van der Haar ME, Bandtlow CE, Robeva A, Burfeind P, Buss A, Huber AB, Simonen M, Schnell L, Brösamle C, Kaupmann K, Vallon R, Schwab ME (2003). Nogo-A inhibits neurite outgrowth and cell spreading with three discrete regions. J Neurosci 23:5393–5406. [DOI] [PMC free article] [PubMed] [Google Scholar]
- Rabinowitz SS, Gordon S (1991). Macrosialin, a macrophage-restricted membrane sialoprotein differentially glycosylated in response to inflammatory stimuli. J Exp Med 174:827–836. [DOI] [PMC free article] [PubMed] [Google Scholar]
- Schnell L, Schwab ME (1990). Axonal regeneration in the rat spinal cord produced by an antibody against myelin-associated neurite growth inhibitors. Nature 343:269–272. [DOI] [PubMed] [Google Scholar]
- Schwab ME (2002). Repairing the injured spinal cord. Science 295:1029–1031. [DOI] [PubMed] [Google Scholar]
- Schwab ME (2004). Nogo and axon regeneration. Curr Opin Neurobiol 14:118–124. [DOI] [PubMed] [Google Scholar]
- Schwab ME, Bartholdi D (1996). Degeneration and regeneration of axons in the lesioned spinal cord. Physiol Rev 76:319–370. [DOI] [PubMed] [Google Scholar]
- Simonen M, Pedersen V, Weinmann O, Schnell L, Buss A, Ledermann B, Christ F, van der Putten M, Schwawb ME (2003). Systemic deletion of the myelin-associated outgrowth inhibitor Nogo-A improves regenerative and plastic responses after spinal cord injury. Neuron 38:201–211. [DOI] [PubMed] [Google Scholar]
- Spillmann AA, Bandtlow CE, Lottspeich F, Keller F, Schwab ME (1998). Identification and characterization of a bovine neurite growth inhibitor (bNI-220). J Biol Chem 273:19283–19293. [DOI] [PubMed] [Google Scholar]
- White P, Liebhaber SA, Cooke NE (2002). 129X1/SvJ mouse strain has a novel defect in inflammatory cell recruitment. J Immunol 168:869–874. [DOI] [PubMed] [Google Scholar]
- Willenborg DO, Fordham S, Bernard CC, Coweden WB, Ramshaw IA (1996). IFN-gamma plays a critical down-regulatory role in the induction and effector phase of myelin oligodendrocyte glycoprotein-induced autoimmune encephalomyelitis. J Immunol 157:3223–3227. [PubMed] [Google Scholar]
- Zheng B, Ho C, Li S, Keirstead H, Steward O, Tessier-Lavigne M (2003). Lack of enhanced spinal regeneration in Nogo-deficient mice. Neuron 38:213–224. [DOI] [PubMed] [Google Scholar]