

Abstract
Myelin formation involves the outgrowth of an oligodendrocyte cell process that can be regarded as a giant lamellipodium because it is an actively growing structure with extruded cytoplasm. The actin cytoskeleton is critical to morphogenesis, but little is known about regulation of actin dynamics in oligodendrocytes. Wiskott-Aldrich syndrome protein family verprolin homologous (WAVE) proteins mediate lamellipodia formation; thus, we asked whether these proteins function in oligodendrocyte process formation and myelination. Here, we show that WAVE1 is expressed by oligodendrocytes and localizes to the lamella leading edge where actin polymerization is actively regulated. CNS WAVE1 expression increases at the onset of myelination. Expression of dominant-negative WAVE1 impaired process outgrowth and lamellipodia formation in cultured oligodendrocytes. Similarly, oligodendrocytes isolated from mice lacking WAVE1 had fewer processes compared with controls, whereas neurons and astrocytes exhibited normal morphology. In white matter of WAVE1−/− mice, we found regional hypomyelination in the corpus callosum and to a lesser extent in the optic nerve. In optic nerve from WAVE1−/− mice, there were fewer nodes of Ranvier but nodal morphology was normal, implicating a defect in myelin formation. Our in vitro findings support a developmentally dynamic and cell-autonomous role for WAVE1 in regulating process formation in oligodendrocytes. Additionally, WAVE1 function during CNS myelination appears to be linked to regional cues. Although its loss can be compensated for in many CNS regions, WAVE1 is clearly required for normal amounts of myelin to form in corpus callosum and optic nerve. Together, these data demonstrate a role for WAVE1 in oligodendrocyte morphogenesis and myelination.
Keywords: WASP-related protein, WAVE1, myelination, oligodendrocyte, actin cytoskeleton, CNS
Introduction
Cells in the developing CNS translate a broad range of signals to mature, migrate, and acquire a morphology specific to their role in the adult CNS. Actin dynamics are central to these biologic events. Many extracellular signals that direct actin organization converge on small Rho GTPases. Rac mediates lamellipodia formation and membrane ruffling, cdc42 filopodia formation, and Rho triggers stress fiber formation (Nobes and Hall, 1995; Symons et al., 1996; Miki et al., 1998; Suetsugu et al., 1999). Rho GTPases do not interact directly with Arp2/3, the principle effector of de novo actin nucleation, but rather exert effects through downstream components. Wiskott-Aldrich syndrome proteins (WASP) and WASP family verprolin homologous (WAVE) proteins have emerged as important molecular bridges linking Rho GTPases with activation of Arp2/3.
The following five mammalian WASP/WAVE proteins have been described: WASP, N-WASP, and three isoforms of WAVE (Miki et al., 1996; Suetsugu et al., 1999). The proteins share a basic region, a polyproline region, and a conserved verprolin homology, cofilin homology, and acidic domain (VCA) module that binds Arp2/3 and serves to scaffold monomeric actin. WASP and N-WASP inducibly bind Arp2/3 in response to cdc42 and mediate filopodia formation (Miki et al., 1998; Higgs and Pollard, 2000), whereas WAVE proteins constitutively interact with Arp2/3 and are effectors of rac activity in lamellipodia formation and membrane ruffling (Machesky and Insall, 1998; Miki et al., 1998; Suetsugu et al., 1999; Takenawa and Miki, 2001; Yamazaki et al., 2003). There is reason to suspect functional differences between WAVE isoforms. WAVE1 and WAVE2 in fibroblasts participate in different types of membrane ruffles (Suetsugu et al., 2003) and membrane dynamics (Yamazaki et al., 2005). Furthermore, in the neuroblastoma cell line NG108, WAVE1 is continuously distributed along the leading edge of lamellipodia in growth cones, whereas WAVE2 and WAVE3 localize to microspikes and the tips of filopodia (Nozumi et al., 2003). The basis of functional distinctions remains unclear. All WAVE isoforms appear to use a common complex of proteins to interact with rac (Abi-NckAPI-SRA1) (Stovold et al., 2005); thus, additional binding partners might account for functional specification. Support for this notion comes from the finding that WAVE1 interacts with WRP and the RII subunit of protein kinase A (PKA) in an isoform-specific manner (Westphal et al., 2000; Soderling et al., 2002).
The biologic significance of WAVE proteins remains mostly uncharacterized. WAVE1 and WAVE3 are enriched in CNS tissue, whereas WAVE2 is broadly expressed. WAVE1 deficiency results in behavioral deficits in mice (Soderling et al., 2003) without altering neuronal morphology (Dahl et al., 2003). To date, the role of WAVE proteins in non-neuronal cells of the CNS has not been investigated. We asked whether WAVE proteins are important for oligodendrocyte morphogenesis and thus myelination. Here, we show that WAVE1 expression in the CNS is developmentally regulated and temporally linked to the onset of myelination. Although also present in neurons, inhibition or deletion of WAVE1 blocks process formation only in oligodendrocytes. WAVE1 is found at the site of cortical actin remodeling along the leading edge of oligodendrocytes at all developmental stages. Mice lacking WAVE1 display prominent defects in myelination in specific regions. Regional cell counts and cell density measurements suggest that precursor cells are able to migrate normally in most regions of the CNS but that oligodendrocytes lacking WAVE1 are impaired in their ability to form myelin in the corpus callosum and optic nerve. These results establish a role for WAVE1 in oligodendrocyte morphogenesis and normal CNS myelination.
Materials and Methods
Animals.
The targeting vector and generation of WAVE1−/− mice were reported previously (Dahl et al., 2003). Swiss Webster mice were purchased from Taconic (Germantown, NY).
Reagents.
Monoclonal antibodies for A2B5, O4, and O1 were obtained from the American Type Culture Collection (Manassas, VA); antibody against MBP SMI99 was obtained from Sternberger Monoclonals (Berkeley, CA); secondary antibodies were obtained from Jackson ImmunoResearch Laboratories (West Grove, PA). Polyclonal and monoclonal antibodies against WAVE1 were purchased from Upstate Biotechnology (Lake Placid, NY); mouse anti-β-actin monoclonal antibody was purchased from Chemicon (Temecula, CA). Anti-APC (CC1) monoclonal antibody was purchased from EME Biosciences (San Diego, CA). Anti-rabbit polyclonal Olig2 antibody was generously provided by Dr. David H. Rowitch (Dana-Farber Cancer Institute, Harvard Medical School, Boston, MA). Avertine, poly-l-ornithine (PLO) and poly-d-lysine (PDL) were obtained from Sigma (St. Louis, MO); DMEM, NeuroBasal medium, B-27 supplement, trypsin, N-2 supplement, and fetal bovine serum (FBS) were obtained from Invitrogen (Carlsbad, CA). PDGF and FGF were obtained from PeproTech (Rocky Hill, NJ).
Primary cell culture.
Primary cultures of oligodendrocyte precursor cells (OPCs), astrocytes, and microglia were prepared from the cerebral hemispheres of 2-d-old Sprague Dawley rats as described previously (Vartanian et al., 1997; Lehnardt et al., 2002). Purified OPCs were plated on PLO-coated 60 mm dishes and incubated in the presence of 10 ng/ml PDGF and basic FGF for 3 d. To produce differentiated oligodendrocytes, cells were incubated in serum-free media with N2 supplement for another 3 d. Cortical neurons were prepared from E17 mouse forebrain. Cells were dissociated with trypsin for 20 min at 37°C, followed by inactivation with DMEM/F12 medium containing 10% FBS, and trituration with a 1 ml glass pipette. Cells were allowed to settle for 10 min before resuspension in DMEM/F12 with 10% FBS and triturated until no cell clumps were visible. The cells were then filtered through a 40 μm filter and plated on PDL-coated eight-well chambers (Becton Dickinson, Mountain View, CA). After 3 h, the medium was changed to NeuroBasal medium containing B27 supplement.
RT-PCR analysis.
Total RNA was isolated by Trizol extraction (Invitrogen) from brain, liver, and spleen of adult Swiss Webster mice and reverse transcribed using SuperScript II RT (Invitrogen) with oligo-dT primer at 42°C for 50 min in a 50 μl reaction volume following the manufacturer's directions. Pre-denaturing cDNA template was performed at 94°C for 5 min. Thirty cycles were performed (94°C for 30 s, 60°C for 30 s, and 72°C for 30 s) followed by a final extension cycle for 10 min at 72°C. The PCR products were stored at 4°C until separated by 1% agarose gel. In all experiments, amplification of β-actin was run in parallel as a positive control for RNA quality and quantity. Primers were as follows: WASP, sense, TGTCAGGGTTCTGAATGTCG, antisense, AATGCTGGACACTGGCTACC; N-WASP, sense, TAGGACCATTTGGGGGATCT, antisense, GGAGAACGAGTCCCTCTTCA; WAVE1, sense, GGGGAGGAGTTGAGGTCATT, antisense, AGACCGTCCTCATGAACCAG; β-actin, 10 pmol of RT-PCR primers were used (catalog no. 302110-14; Stratagene, La Jolla, CA).
Western analysis.
Tissue was isolated from adult Swiss Webster mice and homogenized in extraction buffer (20 mm Tris-HCl, pH 7.5, 150 mm NaCl, 1 mm Na2EDTA, 1 mm EGTA, 1% Triton X-100, 2.5 mm sodium pyrophosphate, 1 mm β-glycerophosphate, 1 mm Na3VO4, 1 μg/ml leupeptin, and added 1 mm PMSF immediately before use) using electronic tissuemizer. The homogenates were lysed in SDS sample buffer, boiled, electrophoresed through 6% SDS-polyacrylamide and transferred to 0.45 μm nitrocellulose membrane (Osmonics, Gloucester, MA). Blots were shaken and incubated at room temperature for 1 h in the blocking solution (5% dry milk in Tris-buffered saline with 1% Triton X-100) followed by primary antibody hybridization at 4°C overnight. HRP-conjugated secondary antibodies were used (1:10,000) for the detection, followed by enhanced chemiluminescence development (Amersham Biosciences, Piscataway, NJ). Blots were normalized with anti-β-actin.
Terminal deoxynucleotidyl transferase-mediated biotinylated UTP nick end labeling staining.
Terminal deoxynucleotidyl transferase-mediated biotinylated UTP nick end labeling (TUNEL) was used to assay fragmented DNA in oligodendrocytes. TUNEL staining was performed using the manufacturer's protocol for in situ cell death detection (Roche Applied Science, Indianapolis, IN). As a positive control, cells were treated with 1 U/ml DNase I for 30 min before fixation.
Immunofluorescence microscopy.
Oligodendrocytes cultured on PDL-coated coverslips were fixed in 4% formaldehyde in PBS for 7 min and permeabilized with 0.1% Triton X-100 in PBS. Cells were incubated with the following primary antibodies: A2B5, O4, O1, or WAVE1, and then with the appropriate secondary antibodies. To visualize actin filaments, Alexa Fluor 488 phalloidin (Invitrogen) was used. 4′,6-Diamidino-2-phenylindole (DAPI) stain (Invitrogen) served to visualize nuclei. For neonate histology, postnatal day 20 (P20) mouse pups were perfused intracardially with 4% paraformaldehyde (PFA) after anesthetization with Avertin. Brains and spinal cords from these animals were then cryoprotected in OCT and sectioned at 20 μm. Anti-Olig2 was used as primary antibody at 1:40,000 dilution to detect oligodendrocyte lineage cells. The secondary antibody was biotin-labeled goat anti-rabbit IgG at 1:300. The ABC vector kit was used to enhance the signals and the vector DAB kit was used for immune detection (Vector Laboratories, Burlingame, CA). Immunofluorescent images were obtained using a Nikon (Tokyo, Japan) Eclipse 660 microscope with a Spot cooled CCD camera using Spot image software (version 3.2.4 for Macintosh).
Cloning and construction of WAVE1 truncates.
A cDNA encoding the whole WAVE1 coding region was generated by RT-PCR from rat brain using SuperScript II (Invitrogen). Primers were designed from the full-length murine WAVE1 cDNA (GenBank accession number AF290877): sense, TGTGGCTTTCTTACTCCAGCCAGTCTACTT; antisense, GATATCATGCCGTTGGTGAAAAGAAACATC. After pre-denaturing cDNA template at 95°C for 5 min, 35 PCR cycles were performed (94°C for 1 min, 55°C for 1 min, 72°C for 2 min) followed by a final extension cycle at 72°C for 10 min. Products were separated by 1% agarose gel. Transcripts of 1695 bp were generated and subsequently cloned to pCR4-TOPO cloning vector (Invitrogen) and sequenced. To generate truncated constructs of WAVE1 (dA, dWA, WA), primer pairs were designed for subcloning to pEGFPC3. Primer pairs: dA, sense, TTAAATCCGCTCGTGTTTTG, antisense, ATGCCGTTGGTGAAAAGAAAC; dWA, sense, TTAAGGAGATGATGGCCGGATG, antisense, ATGCCGTTGGTGAAAAGAAAC; WA, sense, TTACTCCAGCCAGTCTACTT, antisense, ATGGTCGCAGTTCTCT. Subcloning PCR conditions were same as above. To transfect primary cells, recombinant green fluorescent protein (GFP) -adenovirus containing WAVE truncations were generated by the Harvard Gene Therapy Initiative (Boston, MA). WAVE1 constructs were introduced into the Ad-BGFP-Cla vector to drive expression in transduced cells off the cytomegalovirus promoter.
Adenovirus transfection.
Purified OPCs were plated on PDL-coated 60 mm dishes and incubated in the presence of 10 ng/ml PDGF and basic FGF for 3 d. Cells were trypsinized and plated on PDL-coated eight-well chambers. Immediately after plating, the cells were incubated with 10 multiplicity of infection (MOI) stocks of GFP-adenovirus or GFP-adenovirus WAVE1 truncates 48 h with DMEM supplemented with N2. The progress of infection was monitored by fluorescence microscopy. Purified cortical neurons from E17 mice forebrain were plated on PDL-coated eight-well chambers. After 3 h, medium was changed to Neural Basal medium, and primary cells were incubated with 10 MOI adenoviral stocks as described above for oligodendrocytes. Cells were fixed and examined 2–3 d after transfection. The efficiency of viral infection was >90%. The number of processes were counted on oligodendrocytes exhibiting three or more processes and normalized to controls. A process was defined as an outgrowth extending from the cell body by at least one cell diameter. Plating density and cell survival was assayed by DAPI staining and TUNEL assay, respectively. Four fields were randomly chosen for each well and the average number of DAPI+ nuclei or TUNEL+ cells was determined.
Area measurements.
After immunostaining, lamellipodial area was measured using IPLab software. For actin staining, we selected only lamellipodia at the tips of processes and excluded other actin+ areas from our measurements. For all measurements, brightness and contrast were unmodified for each picture so that all cells were assessed using identical criteria.
Immunohistochemistry of optic nerve.
We used antibodies for channel staining following methods as described previously (Schafer et al., 2004). Quantification of the number of nodes of Ranvier was performed as described by Rasband et al. (2005).
Electron microscopy.
P20 mice were perfused with double aldehyde fixative transcardially. Small blocks were taken from brain, optic nerve, and spinal cord and postfixed with 1% OsO4, dehydrated in alcohol series and propylene oxide before embedding in Epon. One-micrometer-thick sections were cut and stained with toluidine blue. Thin sections were contrasted with uranyl acetate and lead citrate and observed with JEOL (Peabody, MA) 1200EX electron microscope.
Results
Analysis of WAVE expression
We initially confirmed by Western blot that WAVE1 protein expression is restricted to the CNS (Fig. 1B). mRNA transcripts for WAVE1 were found by RT-PCR in brain, spleen, and liver of adult mice, similar to the patterns seen for N-WASP and WASP transcripts (Fig. 1A). Using Western blot, we then examined the developmental expression profile of WAVE1 in CNS extracts from embryonic day 13 (E13), E15, E17, P0, P7, and adult mice. WAVE1 was detected as early as E13, and expression levels markedly increased at P7 in mouse CNS (Fig. 1C). Expression of WAVE3 also gradually increased with age. In contrast, WAVE2 expression did not change with age. Expression of WAVE proteins was then studied in enriched populations of neurons, oligodendrocytes, astrocytes, and microglia. We found relatively high levels of WAVE1 expression in purified cultures of neurons and oligodendrocytes, whereas relatively low levels were detected in cultured astrocytes and microglia (Fig. 1D). In contrast, WAVE3 was expressed only in cultured neurons (Fig. 1D). WAVE2 was identified by Western blot in neurons, oligodendrocytes, astrocytes, and microglia, but this could not be confirmed immunocytochemically.
Figure 1.

WASP family protein expression pattern in mouse tissues. A, WASP (500 bp), N-WASP (390 bp), and WAVE1 (500 bp) transcripts were detected by RT-PCR in mouse tissues. B, Relative expression levels of WAVE1 protein (85 kDa) was detected by Western blot among the tissues indicated. C, Developmental expression profile of WAVE1 was determined by Western blot in protein extracts from E13 through adult mouse brain, showing that WAVE1 is expressed at E13 with triple bands, increased in developing brain, and peaked at P7, and reduced to a single band in adult brain. In contrast, WAVE2 (85 kDa) is expressed in all examined ages and WAVE3 (60 kDa) is steadily increased in developing brain until adult. D, Cell type distributions of WAVE1 by Western blot using extracts of purified cell types revealed strong expression in neurons and oligodendrocytes, and low levels of expression in astrocytes and microglia. In contrast, WAVE2 is expressed in all cell types examined and WAVE3 in neurons only. β-Actin primer (350 bp) was used for transcription level of actin as a positive control in A, and anti-actin monoclonal antibody (42 kDa) was used for a loading control (B–D). M, Molecular weight marker. E, Wave1 expression was assessed by in situ and by LacZ staining. The left side of E shows in situ signaling from coronal brain slices of normal 129/svLex mice at ∼29 d of age. On the right side, the lacZ staining of Wave KO mice at ∼21 d of age illustrates the general persistence of cortical and subcortical LacZ+ cells, whose wave1 locus is transcriptionally active. The bottom two panels are parasagittal sections of adult WT mice with WAVE1 antisense (left) and sense (right) controls.
WAVE1 expression patterns by in situ using wild-type (WT) brain or by a surrogate (LacZ) using WAVE−/− brain (Fig. 1E) reveal a WAVE1 distribution consistent with the above observations. Diffuse signal is observed in white matter. Hippocampus and neocortex are the sites of highest expression, followed by striatum, cerebellar granular layer, amygdala, and hypothalamus. WAVE1 expression is lowest in the spinal cord of mice and humans (Dahl et al., 2003). Importantly, there is substantial neuronal LacZ expression in WAVE−/− cortex and striatum, and the rank ordered LacZ distribution is similar in −/− compared with +/+ mice, showing that there is not a selective loss of neurons. In particular, all cortical layers are preserved, and projecting neurons do not appear to be selectively eliminated. These results show that WAVE1 is developmentally regulated in the CNS, that expression increases at the onset of myelination (P7), and that this isoform is present in the myelin-producing cell as well as projecting cortical neurons. These findings affirmed our interest in investigating the role of WAVE1 in oligodendrocyte morphology and CNS myelination.
Functional significance of WAVE1 in oligodendrocyte morphogenesis
The primary morphogenic role of WAVE proteins in actin assembly relates to lamellipodia formation. We investigated the impact on neuronal and oligodendrocyte process formation by interfering with WAVE1 function in these cells. To this end, we cloned the WAVE1 gene from a rat brain cDNA library and generated three WAVE1 gene deletion mutants tagged with N-terminal GFP: dA, dWA, and WA (Fig. 2A). GFP fusion proteins were expressed in human embryonic kidney 293 (HEK293) cells and the predicted molecular weight products were identified by Western blot analysis using monoclonal antibodies against GFP (Fig. 2B, left panel) and WAVE1 (Fig. 2B, right panel). Because WAVE1 monoclonal antibodies do not recognize the N-terminal region of WAVE1, the WA-GFP fusion protein, lacking the N-terminal scar homology domain (SHD), cannot be detected by anti-WAVE1. The 84 kDa bands observed in all lanes represent endogenous WAVE1 in HEK293 cells (Fig. 2B, right panel). The fusion protein dWA-GFP is also expected to be 84 kDa (Fig. 2B, lane 4) and is identified by immunoreactivity to GFP. WAVE1 mutant genes were inserted into an adenoviral vector for OPCs and cortical neuron infection. GFP-vector alone and the GFP-WAVE1 truncates were introduced in OPCs with MOI 10 for 48 h. dA, which lacks the Arp2/3 binding site, and dWA, which lacks the entire VCA module, blocked process formation in OPCs, whereas WA, which lacks SHD and regulatory regions of the protein, had no effect (Fig. 2C,D). Compared with GFP-vector alone, dA and dWA decreased process formation in OPCs by 58 and 83%, respectively (Fig. 2E). Staining with rhodamine phalloidin revealed significantly smaller lamellipodial area measurements in oligodendrocytes transfected with GFP-dWA compared with GFP-controls (8.90 ± 3.7 vs 100.0 ± 33.7%, respectively; p < 0.016 by ANOVA) (Fig. 2G). There was no significant difference in O1+ sheet area, although there was a trend for smaller area in dWA-expressing oligodendrocytes compared with GFP-expressing oligodendrocytes (data not shown). Cell death after viral infection was <20% by TUNEL assay for all vectors (Fig. 2F). OPCs expressing dWA had fewer processes than those expressing dA, suggesting that deletion of both the Arp2/3 binding site and PKA/actin binding site had a predicted effect of greater magnitude.
Figure 2.

Cloning and generation of vectors for DN-WAVE1. A, Diagrammatic representations of the domain structure of rat WAVE1 gene with the structures and names of the chimeric constructs are shown. WAVE1 contains an N-terminal SHD, a proline-rich internal segment (PRO), and a C-terminal VCA domain. B, The WAVE1 constructs were cloned to pEGFPC3 (Clontech), and proteins were expressed in HEK293 cells. Their size was determined by Western blot using a monoclonal antibody against GFP or WAVE1. Arrows in B represent the expected size of the GFP-fusion proteins. C, WAVE1 adenoviral constructs were generated to transfect primary cells and transduced into purified oligodendrocytes isolated from P2 rat and cortical neurons isolated from E17 mice. Infected cells were then grown for 48 h, fixed, and analyzed. Overexpression of dWA and dA blocked process formation in oligodendrocytes, but no effect was seen in neurons. D, Higher magnification of insets in C is seen in D. E, Oligodendrocyte processes were counted in two nonoverlapping fields, and experiments were performed in four independent experiments. F, TUNEL assay shows that oligodendrocyte death in response to viral transduction was not significant compared with GFP alone. Error bars indicate SEM. ∗∗p < 0.001 and ∗p < 0.005 by ANOVA (n = 4). Scale bars, 10 μm. G, Oligodendrocytes transfected with GFP-dWA and GFP-vector alone were also stained with rhodamine phalloidin (red) and used for measurements in lamellipodial size. Note that elaborate lamellipodia at the end of oligodendrocytes process in GFP-control (arrows) compared with GFP-dWA-transfected cells (arrowheads).
To test whether interfering with WAVE1 function would have a similar effect on cortical neurons, we assessed neurite outgrowth 72 h after introduction of GFP-vector or WAVE1 mutants. We found that WAVE1 mutants had no impact on neuronal morphology (Fig. 2C,D). This observation is consistent with the results of Dahl et al. (2003) demonstrating normal neuronal morphology and process outgrowth in WAVE1−/− neurons.
We subsequently generated mixed CNS cultures from P0 WT and WAVE1−/− mice to confirm that WAVE1 is required for normal oligodendrocyte morphogenesis. After 15 d in culture, we observed the morphology of cortical neurons, astrocytes, and oligodendrocytes (Fig. 3A). Oligodendrocytes were double labeled with O4/Olig2 (Fig. 3B) or O1/Olig2 (Fig. 3C). WAVE1-deficient O4+ cells revealed dramatically fewer processes compared with WT controls (Fig. 3A,B). Furthermore, the number of sheet-like processes was reduced in cultures of mature O1+ cells taken from WAVE1−/− animals compared with control (Fig. 3C,F). In contrast, no differences were observed in cell number or morphology in either cortical neurons stained for neurofilament or astrocytes stained for GFAP taken from WT versus WAVE−/− mice (Fig. 3A). Data were analyzed with respect to the total number of DAPI+ or Olig2+ cells in culture (Fig. 3D). Overall, cell counts did not differ significantly between WT and WAVE−/− cultures, although interestingly, O4/Olig2 and O1/Olig2 double-stained cell numbers were significantly reduced in cultures from WAVE1-deficient animals compared with control (Fig. 3E).Together, these findings demonstrate that WAVE1 is functional in oligodendrocytes and is necessary under in vitro conditions for the elaboration of normal processes by these cells. These findings also suggest a role for WAV1 in oligodendrocyte maturation.
Figure 3.

WAVE1 defect causes delayed oligodendrocyte differentiation. Mixed CNS cells from P0 WT and WAVE−/− mice brain were dissociated in DMEM and cultured for 15 d with changing medium every 3 d. A, Neurofilament (NF), glial fibrillary acidic protein (GFAP), and O4 were stained for different populations of CNS cells. Oligodendrocytes were double labeled with O4/Olig2 (B) or O1/Olig2 (C). Significant defects in process formation were seen in WAVE−/− O4+ cells compared with WT controls. D, Total cell number by DAPI+ and total oligodendrocyte number by Olig2+ were counted in square millimeters. Cell numbers counted WT versus WAVE−/− was not statistically significant. E, However, the number of O4+/Olig2+ and O1+/Olig2+ double-stained cells was significantly reduced. In addition, mature O1+ oligodendrocytes with membrane sheets were dramatically reduced (72%) compared with wild-type control (F). The data shown here are representative of four independent experiments. Error bars indicate SEM. ∗p < 0.05 and ∗∗p < 0.005 by ANOVA (n = 4). Scale bars: A, 20 μm; B, 5 μm; C, 10 μm.
WAVE1 localization in oligodendrocytes in vitro
If WAVE1 participates in cortical actin remodeling within oligodendrocytes, then it should be found in regions relevant to this process. To determine whether the subcellular localization of WAVE1 protein would support a role in oligodendrocyte process outgrowth, we generated purified OPC cultures from 2-d-old rat forebrains and allowed the cells to mature to various developmental stages. We subsequently fixed the cells with 4% PFA and double stained for WAVE1 and actin. As shown Figure 4, immunocytochemical analysis revealed that WAVE1 exhibited punctate staining at the leading edge of lamellipodia (Fig. 4A, arrows), localizing to the distal tips of filopodia found on the lamellipodia in early stage OPCs (which were NG2+) and A2B5+ oligodendrocytes. To confirm distribution of WAVE1 in developing oligodendrocytes, we double stained for WAVE1 and stage-specific markers of oligodendrocyte development (A2B5, O4, O1, and MBP) (Fig. 4B). WAVE1 was concentrated at the leading edge of bipolar A2B5+ cells (Fig. 4B, A2B5, arrows). At later stages, we observed WAVE1 to be concentrated along the edge of processes (Fig. 4B, O4, O1, and MBP, arrows). Interestingly, WAVE1 was consistently biased to one side of polarized cells at all stages of oligodendrocyte development. In particular, WAVE1 was localized at the leading edge of membrane sheet formed O1+ cell (Fig. 4B, O1, arrowheads). These findings demonstrate that WAVE1 localization is relevant to cortical actin dynamics in oligodendrocytes and, furthermore, suggest that the protein could play a role in cell motility as well as morphogenesis.
Figure 4.

Subcellular localization of WAVE1 in vitro. Fluorescence images of WAVE1 localization in oligodendrocytes purified from the forebrains of 2-d-old rats. A, WAVE1 (red) staining shows a dot-like continuous localization (arrows) along the leading edge of lamellipodia in early stage of OPCs. Higher magnification inset is seen in the right panel of A. F-actin (green) was labeled with Alexa Fluor 488 phalloidin. B, WAVE1 (red) is concentrated in the protruding tips of A2B5+ (green) oligodendrocytes, distributed along the processes of O4+, O1+, and MBP+ (green) mature oligodendrocytes (long arrows), and cytoplasm of cell bodies. Note that WAVE1 staining is localized at the leading edge of membrane sheet in O1+ cells (short arrows). Scale bars: A, 30 μm; B, 30 μm.
WAVE1 expression increases at the onset of myelination and is required for normal myelin-dependent node formation in developing optic nerve
We then investigated WAVE1 expression in rat optic nerve to determine whether expression was keyed to myelination (P8–P17). At P8, before myelinogenesis as evidenced by the lack of staining for the paranodal adhesion protein Caspr, WAVE1 staining is very weak (Fig. 5A). At P9, however, myelin begins to form in the optic nerve and WAVE1 expression increases markedly in oligodendrocytes and remains strong throughout later stages (Fig. 5B, short arrows). Optic nerve sections were double labeled with WAVE1 and neurofascin (Fig. 5B, long arrows), a cell adhesion molecule involved in voltage-gated sodium channel recruitment (Davis et al., 1996).
Figure 5.
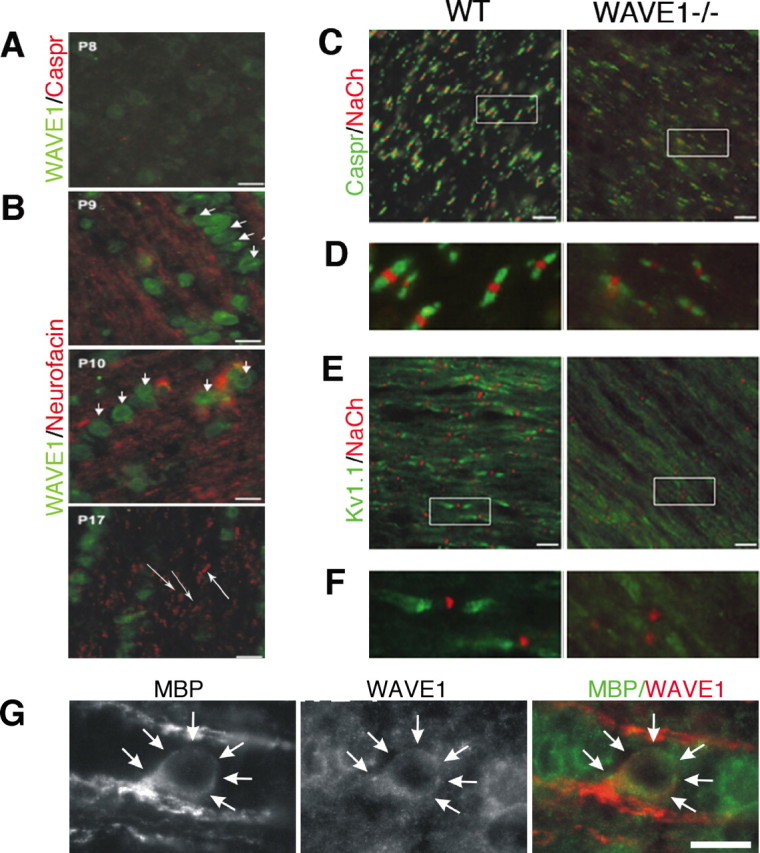
Clustering of Na+ and K+ channels at and near nodes is decreased in developing WAVE1−/− mouse optic nerve. A, Immunohistochemistry of P8 rat optic nerve revealed weak expression of WAVE1 and no expression of Caspr (red), a specific marker of paranodes. B, Increased expression of WAVE1 (green) is seen in P9 through P17 rat optic nerve. Expression of WAVE1 is mainly restricted to oligodendrocyte cytoplasm (short arrows). Neurofascin (red), a specific marker for nodes and paranodes, is evident in developing optic nerve (long arrows). C, P21 mouse optic nerve was double labeled with NaCh to mark the node and Caspr to mark the paranode and staining with NaCh and Kv1.1 to mark the juxtaparanode (E). Higher magnification of insets in C and E is seen in D and F. Nodal structure is normal in WAVE1−/−, but fewer nodes are seen. G, High-power image of an oligodendrocyte within the optic nerve double labeled for MBP and WAVE1. Scale bars, 10 μm.
Normal node of Ranvier architecture and the clustering of Na+ channels within the node and K+ channels within the juxta-paranode depend on the presence of myelin (Kazarinova-Noyes and Shrager, 2002; Poliak and Peles, 2003). We examined Na+ and K+ channel density at the node and paranode in developing optic nerve of WAVE1−/− mice, finding reduced numbers of nodes compared with controls (Fig. 5C,E). Measuring nodes from 10 fields of view using two different animals for each genotype, we found that Nav1.6+ nodes/field was increased in WT compared with WAVE1−/− in the optic nerve (121.5 ± 22.6 and 84.2 ± 18.03, respectively; p < 0.001). Higher magnification shows that there is no defect in the morphology of channel clusters in optic nerves from WAVE1−/− animals, although the fluorescence intensity is clearly less than that observed from wild types (Fig. 5D,F). These findings demonstrate that WAVE1 expression is temporally linked to the onset of myelinogenesis and loss of the protein impacts channel clustering at the node, a feature of axonal architecture that depends on the correct interaction between axon and myelin. Hence these studies support the impression that WAVE1 functions in oligodendrocytes during the formation of myelin.
Immunohistological analysis of WAVE1 knock-out mice brain reveals reduced absolute oligodendrocyte number with preservation of cell density
We then looked at CNS anatomy in P21 WAVE1−/− mice compared with littermate controls. As Dahl et al. (2003) reported previously, we noted an overall reduction of brain size with markedly reduced forebrain, a thin corpus callosum, and enlarged lateral ventricles. Staining with CC1 to detect mature oligodendrocytes revealed decreased numbers of these cells in WAVE1−/− brain compared with controls (Fig. 6A). We then stained sections with anti-Olig2, a pan-developmental marker of oligodendrocytes, and counted Olig2+ cells within discrete regions of the corpus callosum, frontal cortex, striatum, and septum in WAVE1−/− and WT brain. We noted a striking fourfold reduction in the total number of Olig2+ cells in the corpus callosum of WAVE1−/− animals (Fig. 6B). Surprisingly, however, the density of Olig2+ cells per unit area was the same in WAVE1−/− corpus callosum as in littermate controls (Fig. 6C). In other regions, Olig2+ cell density was increased in WAVE1−/− brain compared with WT, most markedly in frontal cortex (Fig. 6C). BecauseWAVE1-deficient oligodendrocytes achieve normal numbers in proportion to other CNS elements, we cautiously conclude that loss of the protein does not impact the ability of the cell to migrate and proliferate throughout telencephalic and diencephalic structures.
Figure 6.

The corpus callosum is thinner and the total number of oligodendrocytes is reduced in WAVE1−/−. A, CC1, a marker for mature oligodendrocytes, was immunostained with coronal sections of P21 mouse brain. B, Twenty-micrometer-thick coronal sections of P20 mouse brain were stained with a specific marker of pan-oligodendrocytes, Olig2, and detected by the ABC Elite kit with DAB substrate. Higher magnification is seen in the bottom panel. Fewer CC1+ cells and Olig2+ cells are obvious in corpus callosum (CC) of WAVE1−/− compared with WT controls. C, The number of Olig2+ cells was quantified within the designated callosal region in black line with two consecutive sections. Although the number of Olg2+ in CC is reduced (B), the density per square millimeter of Olig2+ cells is slightly increased in most areas except the corpus callosum, in which the cell density is virtually identical to WT. Interestingly, Olig2+ cells per square millimeter of cortex in WAVE1−/− were higher than WT by ∼53%. Error bars indicate SEM. ∗p < 0.05 (n = 6) and ∗∗p < 0.001 [n = 6 for CC and n = 4 for cortex (CTX), striatum (ST), septum (SEP)] by ANOVA. Scale bar, 10 μm. Arrows in A and B indicate inter-hemispheric fissure of the coronal section.
Ultrastructural examination of WAVE1−/− mouse CNS reveals regional hypomyelination
To confirm that loss of WAVE1 function correlated with a defect in myelination, we undertook ultrastructural examination of the corpus callosum, optic nerve, and spinal cord of WAVE1−/− mice compared with littermate controls. Sections were prepared from P20 animals for electron microscopy. Compared with controls, we noted hypomyelination in the corpus callosum and to a lesser extent in optic nerve of WAVE1−/− animals, whereas spinal cord sections displayed normal amounts of myelin (Fig. 7A–C). Myelination is not complete at P20; thus, many unmyelinated axons are present in structures from both WT and knock-out (KO) animals (Fig. 7A, arrowheads). Sections from WT animals, however, display an abundance of large-diameter axons, whereas sections from WAVE1−/− animals revealed a reduced number of large-diameter axons (Fig. 7A). Given the striking reduction in size in the corpus callosum in knock-out animals (Fig. 6B), we sought to determine whether this defect was attributable to a myelin defect, an axonal defect, or both by analyzing a complete section through the callosum. We found a 60% reduction in the total number of axons in a stereotactically matched sagittal section of the callosum of WAVE1−/− mice compared with controls. Furthermore, in WAVE1−/− animals, there was a >80% reduction in the number of myelinated axons in this structure compared with controls (Fig. 7D). Myelinated fibers from corpus callosum of WT and KO mice were not significantly different in g ratio (0.715 ± 0.021 vs 0.686 ± 0.023, respectively; p < 0.355).Together, these in vivo findings suggest that lack of WAVE1 results in deficient optic nerve myelination and produces a dramatic defect in callosal myelination superimposed on a defect in numbers of commissural axons.
Figure 7.

WAVE1−/− mice reveal defective myelination in the CNS, with severe hypomyelination seen in the corpus callosum. A, Electron micrographs of the midsagittal corpus callosum (CC) sections were analyzed from WAVE1−/− mice at P20 as well as WT littermates. Axons in WAVE1−/− mice are hypomyelinated, and fewer total myelinated axons are clearly seen. The majority of myelin sheaths appears properly compacted, but shown is a rare sheath that is poorly compacted (arrows). The primary disturbance appears to be that many axons are unmyelinated (arrowheads) in WAVE1−/− compared with WT. B, C, Cross sections of the middle portion of the eyeball and optic chiasm of optic nerve (ON) and the cervical region of the spinal cord (SP) were photographed by electron microscope. No prominent differences were observed in those areas except that the number of axons was reduced slightly in ON. D, The total number of myelinated axons in midsagittal corpus callosum was counted with three different P20 WAVE1−/− animal and two different P20 WT littermate controls. We counted myelinated axons of ON and SP in square millimeters of eight fields of view for WAVE−/− and six fields for WT from three different P20 animals for each genotype. Error bars indicate SEM. ∗p < 0.05 and ∗∗p < 0.005 by ANOVA, respectively. Scale bars: A, 200 nm; B, 500 nm; C, 1 μm.
Discussion
Oligodendrocytes are the myelin-forming cell of the CNS and require dramatic alterations in their cytoskeleton to generate multiple myelin sheaths per cell. An important role for the oligodendrocyte cytoskeleton in myelinogenesis was suggested in early work by Wilson and Brophy (1989), but our knowledge of cytoskeletal regulation in myelin formation remains quite fragmentary. Formation of lamellipodia and lamellipodial ruffles are critical events during initial contact between oligodendrocytes and axons in the process of myelin formation and axonal ensheathment (Asou et al., 1995). Indeed, the myelin lamellum of oligodendrocytes may be conceived of mechanistically as an expansive lamellipodium, which bears specialized surface and transmembrane proteins. Rac regulates lamellipodial dynamics in other cell lines via a limited set of Arp2/3-binding proteins including the WAVE isoforms. WAVE proteins, hence, are candidates for regulating oligodendrocyte morphogenesis with immediate importance for myelin formation. Our results establish that WAVE1 mediates process outgrowth in oligodendrocytes in vitro and is necessary for normal myelination in specific neuroanatomic regions of the CNS.
In this study, we confirmed CNS restriction of WAVE1 (Dahl et al., 2003) and found that its expression is temporally regulated, increasing at the onset of myelinogenesis (P7). Interestingly, the anti-WAVE1 antibody used in this assay recognizes four bands of ∼85 kDa at earlier stages of development that resolve into two lower molecular weight bands in the adult brain (Fig. 1C). Although the significance of this is not entirely clear, it does suggest that posttranslational modification may serve to regulate the activity of the protein developmentally. One possibility is phosphorylation, which contributes to the regulation of WASP and N-WASP proteins (Caron, 2003), and can be induced on uncharacterized serine/threonine residues in WAVE1 in a MAP (mitogen-activated protein) kinase-dependent manner (Bompard and Caron, 2004), although the effect of this modification is not known.
WAVE1 is the primary isoform expressed by oligodendrocytes that is developmentally regulated, suggesting that it links upstream signaling to actin nucleation in these cells. WAVE2 is constitutively expressed by most cells and was detected in whole-cell lysates of oligodendrocytes but not immunocytochemically, and this discrepancy may represent a technical failure of the commercial anti-WAVE2 antibody. In cell lines that coexpress WAVE isoforms, there is evidence for functional specificity of WAVE1 and coordination between WAVE isoforms. Studies in mouse embryonic fibroblasts (MEFs) reveal that WAVE1, but not WAVE2, participates in dorsal ruffle formation within lamellipodia and colocalizes with metallo-matrix proteinase 2 (MMP-2) to mediate MMP-dependent migration (Suetsugu et al., 2003). Additional studies in MEFs cultured on fibronectin show WAVE1 is essential for lamellipodial stabilization but not for protrusion (Yamazaki et al., 2005). Expression of a restricted subset of WAVE isoforms by oligodendrocytes that serve distinct functions would limit potential compensation by other WAVE proteins and may account for the lack of functional compensation seen in vivo.
Cultured oligodendrocytes are a well described cell system in which cells differentiate along determinate stages, extend processes in the absence of axons, and develop characteristic stage-specific morphology and cell surface markers. We used this system to investigate the biologic role of WAVE1 in actin-based structures in oligodendrocytes. Our results indicate that dominant-negative inhibition of WAVE1 in cultured oligodendrocytes results in markedly impaired process extension. WAVE proteins constitutively interact with the Arp2/3 complex via their VCA module, and are thought to be released from resting inhibition either by translocation to the proper subcellular locale or by uncovering the actin-binding site within the VCA module (Bompard and Caron, 2004). We found that mutant proteins lacking either the Arp2/3 or actin binding sites blocked process formation, whereas mutants composed of only the VCA module had no effect. Because regulatory regions within WAVE1 are thought to mediate translocation of the protein to the cell cortex, this finding suggests that WAVE1 requires proper localization to be released from resting inhibition in oligodendrocytes. We further investigated WAVE1 activity using mixed CNS cultures from WAVE1−/− mice to look for changes in cell morphology. Lack of functional WAVE1 significantly impairs process extension in oligodendrocytes cultured from WAVE-deficient animals. Although the total number of oligodendrocytes in culture did not differ by Olig2+ staining, we were surprised to find that oligodendrocytes expressing O4 and O1 differentiation markers were significantly reduced in cultures derived from knock-outs. This observation raises the intriguing possibility that WAVE1 also plays an important role in oligodendrocyte maturation, a subject for additional investigation.
We observed a dramatic decrease in the number of axons as well as a marked decrease in the percentage of myelinated axons in the corpus callosum of WAVE1-deficient animals. Although the myelination defect is understandable in light of our in vitro findings, the axonal findings in the corpus callosum are an enigma. One possibility is that neuronal WAVE1 in vivo may serve an important function in axonal guidance for callosal fibers, and this defect cannot be realized in simple in vitro paradigms. WAVE1 is expressed by neurons and homozygous knock-out animals display neuroanatomic malformations most marked in structures that develop between E12 and E15 (Dahl et al., 2003). If callosal axons indeed failed to accurately develop, then reduced axonal numbers would lead to reduced oligodendrocyte numbers as a consequence of the well described matching of oligodendrocyte to axons (Barres and Raff, 1994). No defect, however, has been reported in neurite outgrowth with WAVE1 deficiency. We confirmed that neurite extension occurs normally in neurons lacking functional WAVE1, using both dominant-negative constructs in WT neurons and neuronal cultures from WAVE1−/− animals. All three WAVE isoforms are found differentially located along lamellipodial structures at the tip of axonal growth cones in neuroblastoma cell line NG108, suggesting that the proteins are functional in neurons (Nozumi et al., 2003). Our assessment of neurites in culture suggests that WAVE proteins may have functional redundancy with each other or with other actin-binding proteins in neurons, because the absence of WAVE1 did not significantly impact neurite outgrowth. We did not, however, investigate the detailed anatomy of growth cones in WAVE1-deficient neurons. It is possible that subtle changes in lamellipodial structures along the growth cone are present and could potentially relate to the neuroanatomic defects found in WAVE1 knock-out animals. A second possibility relates to oligodendrocyte-derived trophic support of neurons. It has become increasingly apparent that myelinating cells of the central and peripheral nervous systems promote axonal stability and neuronal survival by delivering soluble growth factors (Riethmacher et al., 1997; Bjartmar et al., 2001; Wilkins et al., 2001). Thus, reduced total numbers of oligodendrocytes in the corpus callosum may explain in part the dramatic reduction in commissural axons seen in knock-out animals.
Actin is assembled in the leading edge of a cell and transported backward in retrograde flow (Heath and Holifield, 1993; Watanabe and Mitchison, 2002). Thus, in principle, actin scaffolding proteins should be found at sites of actin assembly and modification. By immunocytochemistry, we show that WAVE1 is consistently localized to the leading edge of oligodendrocytes, from early stage precursor cells through the mature myelin-producing phenotype. WAVE1 staining is punctate in NG2+ cells, showing close association with filopodial protrusions within lamellipodia. At later stages of oligodendrocyte development, WAVE1 is found in a continuous distribution along the leading edge of a lamellipodium (Fig. 4C, O1, arrowheads), indicating that the protein occupies a relevant cell compartment at distinct stages of oligodendrocyte maturation.
Structural and ultrastructural features of the WAVE1−/− CNS strengthen the impression that WAVE1 is relevant to myelin formation. Axoglial interactions produce specialized clustering of ion channels at the node and paranode, and alteration of the axonal proteins within these structures has been shown to promote abnormal myelination (Rasband et al., 1999; Poliak and Peles, 2003). In WAVE1-deficient animals, reduced numbers of nodes of Ranvier and paranodes are found in developing optic nerve, lending support to the hypothesis that the protein plays a role in formation of myelin. It is also possible that the reduction in the total number of nodes simply reflects the loss of large caliber axons. Nevertheless, this latter possibility is also consistent with altered myelination given the important role myelin plays in axon integrity (Bjartmar et al., 2001). There was also evidence of hypomyelination in WAVE−/− optic nerve and corpus callosum by electron microscopy, whereas white matter tracts of WAVE1−/− CNS showed normal amounts of myelin in spinal cord segments. No obvious defects in compaction or g ratio were observed within hypomyelinated regions, suggesting that WAVE1 is not required for interactions between actin and major myelin membrane proteins. Olig2+ cell density in hypomyelinated regions is not reduced, suggesting that WAVE1 is not essential for oligodendrocyte migration.
The regional differences in myelin formation in WAVE1 KO brains are puzzling. Based on in situ hybridizations of WT brain and LacZ staining of heterozygous WAVE1 KO brain (Dahl et al., 2003), WAVE1 is expressed diffusely throughout the brain, suggesting that regional differences in WAVE1 expression cannot account for differences in myelin formation. Phosphorylation of WAVE1 may control its activity, but this is completely unexplored in vitro as well as in vivo. It is possible that oligodendrocytes myelinate other areas of the CNS better because of regional differences in the expression and/or function of other actin nucleation promoting proteins that compensate for WAVE1 loss of function. In addition to WAVE2, one candidate is cortactin, an actin-scaffolding protein involved in lamellipodial formation induced by rac activation in fibroblasts (Daly, 2004), which is present in oligodendrocytes (our unpublished observation). The regional specificity of hypomyelination in WAVE1 mutant animals may well reflect regional variations in extracellular matrix (ECM) components that trigger morphologic differentiation in oligodendrocytes. Recent work on integrin signaling through the Src family kinase Fyn (Liang et al., 2004) and ILK (integrin-linked kinase) (Chun et al., 2003) underscores the importance of ECM components (Colognato et al., 2004; Baron et al., 2005) and their engagement of signaling pathways that regulate morphogenesis in oligodendrocytes. Additional studies will hopefully identify upstream signaling pathways that act through WAVE1 in oligodendrocytes, potentially providing links to known extracellular signals that induce morphologic change in these cells. This work represents the first study of an important class of actin-nucleation promoting proteins that functions in oligodendrocytes, and whose absence results in defective morphology in vitro and defective myelin formation in vivo.
Footnotes
*H.-J.K. and A.B.D. contributed equally to this work.
This work was supported by the Multiple Sclerosis Foundation (A.B.D.), National Multiple Sclerosis Society Grants FG1623A1 (J.A.S.) and RG3426A2 (T.K.V.), and National Institutes of Health Grant R01NS042317 (T.K.V). We thank Drs. Charles Stiles, John Albert, and David Rowitch for the Olig2 antibody and assistance with this manuscript.
References
- Asou H, Hamada K, Sakota T (1995). Visualization of a single myelination process of an oligodendrocyte in culture by video microscopy. Cell Struct Funct 20:59–70. [DOI] [PubMed] [Google Scholar]
- Baron W, Colognato H, ffrench-Constant C (2005). Integrin-growth factor interactions as regulators of oligodendroglial development and function. Glia 49:467–479. [DOI] [PubMed] [Google Scholar]
- Barres BA, Raff MC (1994). Control of oligodendrocyte number in the developing rat optic nerve. Neuron 12:935–942. [DOI] [PubMed] [Google Scholar]
- Bjartmar C, Kinkel RP, Kidd G, Rudick RA, Trapp BD (2001). Axonal loss in normal-appearing white matter in a patient with acute MS. Neurology 57:1248–1252. [DOI] [PubMed] [Google Scholar]
- Bompard G, Caron E (2004). Regulation of WASP/WAVE proteins: making a long story short. J Cell Biol 166:957–962. [DOI] [PMC free article] [PubMed] [Google Scholar]
- Caron E (2003). Regulation by phosphorylation. Yet another twist in the WASP story. Dev Cell 4:772–773. [DOI] [PubMed] [Google Scholar]
- Chun SJ, Rasband MN, Sidman RL, Habib AA, Vartanian T (2003). Integrin-linked kinase is required for laminin-2-induced oligodendrocyte cell spreading and CNS myelination. J Cell Biol 163:397–408. [DOI] [PMC free article] [PubMed] [Google Scholar]
- Colognato H, Ramachandrappa S, Olsen IM, ffrench-Constant C (2004). Integrins direct Src family kinases to regulate distinct phases of oligodendrocyte development. J Cell Biol 167:365–375. [DOI] [PMC free article] [PubMed] [Google Scholar]
- Dahl JP, Wang-Dunlop J, Gonzales C, Goad ME, Mark RJ, Kwak SP (2003). Characterization of the WAVE1 knock-out mouse: implications for CNS development. J Neurosci 23:3343–3352. [DOI] [PMC free article] [PubMed] [Google Scholar]
- Daly RJ (2004). Cortactin signalling and dynamic actin networks. Biochem J 382:13–25. [DOI] [PMC free article] [PubMed] [Google Scholar]
- Davis JQ, Lambert S, Bennett V (1996). Molecular composition of the node of Ranvier: identification of ankyrin-binding cell adhesion molecules neurofascin (mucin+/third FNIII domain−) and NrCAM at nodal axon segments. J Cell Biol 135:1355–1367. [DOI] [PMC free article] [PubMed] [Google Scholar]
- Heath JP, Holifield BF (1993). On the mechanisms of cortical actin flow and its role in cytoskeletal organisation of fibroblasts. Symp Soc Exp Biol 47:35–56. [PubMed] [Google Scholar]
- Higgs HN, Pollard TD (2000). Activation by Cdc42 and PIP(2) of Wiskott-Aldrich syndrome protein (WASp) stimulates actin nucleation by Arp2/3 complex. J Cell Biol 150:1311–1320. [DOI] [PMC free article] [PubMed] [Google Scholar]
- Kazarinova-Noyes K, Shrager P (2002). Molecular constituents of the node of Ranvier. Mol Neurobiol 26:167–182. [DOI] [PubMed] [Google Scholar]
- Lehnardt S, Lachance C, Patrizi S, Lefebvre S, Follett P, Jensen F, Rosenberg P, Volpe J, Vartanian T (2002). The Toll-like receptor TLR4 is necessary for lipopolysaccharide-induced oligodendrocyte injury in the CNS. J Neurosci 22:2478–2486. [DOI] [PMC free article] [PubMed] [Google Scholar]
- Liang X, Draghi NA, Resh MD (2004). Signaling from integrins to Fyn to Rho family GTPases regulates morphologic differentiation of oligodendrocytes. J Neurosci 24:7140–7149. [DOI] [PMC free article] [PubMed] [Google Scholar]
- Machesky LM, Insall RH (1998). Scar1 and the related Wiskott-Aldrich syndrome protein, WASP, regulate the actin cytoskeleton through the Arp2/3 complex. Curr Biol 8:1347–1356. [DOI] [PubMed] [Google Scholar]
- Miki H, Miura K, Takenawa T (1996). N-WASP, a novel actin-depolymerizing protein, regulates the cortical cytoskeletal rearrangement in a PIP2-dependent manner downstream of tyrosine kinases. EMBO J 15:5326–5335. [PMC free article] [PubMed] [Google Scholar]
- Miki H, Suetsugu S, Takenawa T (1998). WAVE, a novel WASP-family protein involved in actin reorganization induced by Rac. EMBO J 17:6932–6941. [DOI] [PMC free article] [PubMed] [Google Scholar]
- Nobes CD, Hall CD (1995). A Rho, rac, and cdc42 GTPases regulate the assembly of multimolecular focal complexes associated with actin stress fibers, lamellipodia, and filopodia. Cell 81:53–62. [DOI] [PubMed] [Google Scholar]
- Nozumi M, Nakagawa H, Miki H, Takenawa T, Miyamoto S (2003). Differential localization of WAVE isoforms in filopodia and lamellipodia of the neuronal growth cone. J Cell Sci 116:239–246. [DOI] [PubMed] [Google Scholar]
- Poliak S, Peles E (2003). The local differentiation of myelinated axons at nodes of Ranvier. Nat Rev Neurosci 4:968–980. [DOI] [PubMed] [Google Scholar]
- Rasband MN, Trimmer JS, Peles E, Levinson SR, Shrager P (1999). K+ channel distribution and clustering in developing and hypomyelinated axons of the optic nerve. J Neurocytol 28:319–331. [DOI] [PubMed] [Google Scholar]
- Rasband MN, Tayler J, Kaga Y, Yang Y, Lappe-Siefke C, Nave KA, Bansal R (2005). CNP is required for maintenance of axon-glia interactions at nodes of Ranvier in the CNS. Glia 50:86–90. [DOI] [PubMed] [Google Scholar]
- Riethmacher D, Sonnenberg-Riethmacher E, Brinkmann V, Yamaai T, Lewin GR, Birchmeier C (1997). Severe neuropathies in mice with targeted mutations in the ErbB3 receptor. Nature 389:725–730. [DOI] [PubMed] [Google Scholar]
- Schafer DP, Bansal R, Hedstrom KL, Pfeiffer SE, Rasband MN (2004). Does paranode formation and maintenance require partitioning of neurofascin 155 into lipid rafts? J Neurosci 24:3176–3185. [DOI] [PMC free article] [PubMed] [Google Scholar]
- Soderling SH, Binns KL, Wayman GA, Davee SM, Ong SH, Pawson T, Scott JD (2002). The WRP component of the WAVE-1 complex attenuates Rac-mediated signalling. Nat Cell Biol 4:970–975. [DOI] [PubMed] [Google Scholar]
- Soderling SH, Langeberg LK, Soderling JA, Davee SM, Simerly R, Raber J, Scott JD (2003). Loss of WAVE-1 causes sensorimotor retardation and reduced learning and memory in mice. Proc Natl Acad Sci USA 100:1723–1728. [DOI] [PMC free article] [PubMed] [Google Scholar]
- Stovold CF, Millard TH, Machesky LM (2005). Inclusion of Scar/WAVE3 in a similar complex to Scar/WAVE1 and 2. BMC Cell Biol 6:11. [DOI] [PMC free article] [PubMed] [Google Scholar]
- Suetsugu S, Miki H, Takenawa T (1999). Identification of two human WAVE/SCAR homologues as general actin regulatory molecules which associate with the Arp2/3 complex. Biochem Biophys Res Commun 260:296–302. [DOI] [PubMed] [Google Scholar]
- Suetsugu S, Yamazaki D, Kurisu S, Takenawa T (2003). Differential roles of WAVE1 and WAVE2 in dorsal and peripheral ruffle formation for fibroblast cell migration. Dev Cell 5:595–609. [DOI] [PubMed] [Google Scholar]
- Symons M, Derry JM, Karlak B, Jiang S, Lemahieu V, McCormick F, Francke U, Abo A (1996). Wiskott-Aldrich syndrome protein, a novel effector for the GTPase CDC42Hs, is implicated in actin polymerization. Cell 84:723–734. [DOI] [PubMed] [Google Scholar]
- Takenawa T, Miki H (2001). WASP and WAVE family proteins: key molecules for rapid rearrangement of cortical actin filaments and cell movement. J Cell Sci 114:1801–1809. [DOI] [PubMed] [Google Scholar]
- Vartanian T, Goodearl A, Viehover A, Fischbach G (1997). Axonal neuregulin signals cells of the oligodendrocyte lineage through activation of HER4 and Schwann cells through HER2 and HER3. J Cell Biol 137:211–220. [DOI] [PMC free article] [PubMed] [Google Scholar]
- Watanabe N, Mitchison TJ (2002). Single-molecule speckle analysis of actin filament turnover in lamellipodia. Science 295:1083–1086. [DOI] [PubMed] [Google Scholar]
- Westphal RS, Soderling SH, Alto NM, Langeberg LK, Scott JD (2000). Scar/WAVE-1, a Wiskott-Aldrich syndrome protein, assembles an actin-associated multi-kinase scaffold. EMBO J 19:4589–4600. [DOI] [PMC free article] [PubMed] [Google Scholar]
- Wilkins A, Chandran S, Compston A (2001). A role for oligodendrocyte-derived IGF-1 in trophic support of cortical neurons. Glia 36:48–57. [DOI] [PubMed] [Google Scholar]
- Wilson R, Brophy PJ (1989). Role for the oligodendrocyte cytoskeleton in myelination. J Neurosci Res 22:439–448. [DOI] [PubMed] [Google Scholar]
- Yamazaki D, Suetsugu S, Miki H, Kataoka Y, Nishikawa S, Fujiwara T, Yoshida N, Takenawa T (2003). WAVE2 is required for directed cell migration and cardiovascular development. Nature 424:452–456. [DOI] [PubMed] [Google Scholar]
- Yamazaki D, Fujiwara T, Suetsugu S, Takenawa T (2005). A novel function of WAVE in lamellipodia: WAVE1 is required for stabilization of lamellipodial protrusions during cell spreading. Genes Cells 10:381–392. [DOI] [PubMed] [Google Scholar]