

Abstract
We have characterized a mechanism by which the amplitudes of miniature EPSCs (mEPSCs) in CA1 pyramidal neurons in rat hippocampal organotypic slice cultures are potentiated by approximately twofold after a series of depolarizing voltage pulses from –80 to +20 mV. The increase in mEPSC amplitudes is triggered by the activation of L-type calcium channels and is independent of NMDA receptor (NMDAR) activation but also requires calcium release from intracellular stores. The potentiation induced by depolarizing pulses does not alter the kinetic parameters of mEPSCs. The induction phase of this potentiation involves phosphatidylinositol 3 kinase (PI3 kinase) activation because it is blocked completely in the presence of the PI3 kinase inhibitors wortmannin and 2-(4-morpholinyl)-8-phenyl-4H-1-benzopyran-4-one (LY294002). Furthermore, we show that the maintenance phase of depolarizing pulse potentiation requires continued PI3 kinase activity because the application of either wortmannin or LY294002 results in a reversal to control levels of the amplitudes of mEPSCs. Finally, we demonstrate that the increase in mEPSC amplitudes is mediated by the increased expression of functional AMPA receptors (AMPARs) because the potentiation is blocked by N-ethylmaleimide, botulinum toxin A, and a variety of short-sequence peptides that disrupt the interaction of AMPAR subunits with proteins involved with the trafficking of these to the cell membrane. Our data are consistent with the notion that PI3 kinase and membrane fusion/trafficking events play a pivotal role in coordinating changes in synaptic strength, mediated by AMPA receptors, which are triggered by alterations in postsynaptic calcium concentrations whether these changes are initiated via NMDAR-dependent or NMDAR-independent routes.
Keywords: synaptic plasticity, mEPSC, hippocampus, AMPA receptor, PI3 kinase, membrane fusion
Introduction
The best studied cellular model of synaptic plasticity, NMDA receptor-dependent (NMDAR-dependent) long-term potentiation (LTP), contains many of the elements required of activity-dependent changes in synaptic strength that are thought to underlie learning and memory in the mammalian CNS. A fundamental observation concerning the induction of this form of LTP is its absolute requirement for a rise in the intracellular calcium level, triggered by calcium entry via the NMDAR. Typically, this form of plasticity is monitored by recording the amplitude of evoked AMPA receptor-mediated (AMPAR-mediated) synaptic currents (or potentials). It is, however, also possible to record the spontaneous activity in a neuron. Such miniature synaptic events result from the activation of AMPARs after the spontaneous, tetrodotoxin-insensitive, release of single vesicles of glutamate from the presynaptic nerve terminal and can provide insights into the mechanisms by which changes in synaptic strength occur. CA1 pyramidal neurons, however, contain many thousands of synaptic sites, and typical LTP-inducing protocols result in only a small proportion of synaptic sites experiencing activity-related changes in synaptic strength, making it difficult to resolve changes in miniature synaptic events. Previously, we have described a method for studying changes in miniature EPSC (mEPSC) amplitudes in CA1 pyramidal neurons that are triggered by rises in postsynaptic calcium after the activation of L-type calcium channels (Wyllie and Nicoll, 1994; Wyllie et al., 1994). This depolarizing pulse-induced potentiation (DPP), which is distinct from conventional NMDAR-mediated LTP, gives rise to a twofold potentiation of mEPSC amplitudes and causes large changes in intracellular calcium levels that most likely allows for potentiation at many more synapses than can occur with either pairing-induced or tetanus-induced LTP (Perkel et al., 1993).
In this study we have used DPP of mEPSC amplitudes to assess the contribution of two signaling pathways implicated in NMDAR-dependent LTP to determine whether these also are activated when changes in intracellular calcium levels are mediated via NMDAR-independent processes. The first of these is phosphatidylinositol 3 kinase (PI3 kinase), a kinase that is crucial for NMDAR-dependent activation of mitogen-activated protein kinase/extracellular signal-related kinase (MAPK/ERK) (Chandler et al., 2001; Perkinton et al., 2002), and that if inhibited blocks the induction of LTP (Kelly and Lynch, 2000; Opazo et al., 2003) and in certain cases regulates the expression of LTP (Sanna et al., 2002). The second of these is the role of membrane fusion events as a mechanism to account for the increased amplitude of mEPSCs that accompanies DPP. The role of soluble N-ethylmaleimide-sensitive fusion protein attachment protein receptors (SNAREs) in NMDAR-dependent LTP was demonstrated by Lledo et al. (1998); subsequently, the idea that AMPARs are trafficked into and out of synaptic sites as a mechanism of regulating synaptic plasticity has gained considerable support (for review, see Malinow and Malenka, 2002; Bredt and Nicoll, 2003; Collingridge et al., 2004). The data we present in this study show that both PI3 kinase and receptor trafficking/membrane fusion events play pivotal roles in the NMDAR-independent potentiation of miniature synaptic currents and suggest that common mechanisms are responsible for translating changes in intracellular calcium levels to alterations in synaptic efficacy.
Materials and Methods
Preparation of organotypic slice cultures.
Organotypic hippocampal slice cultures were prepared from postnatal day 7–10 (P7–P10) male Wistar rat pups, using the method described by Stoppini et al. (1991). Briefly, the animals were decapitated (according to procedures authorized by current United Kingdom Home Office regulations); their brains were removed quickly and placed in an ice-cold solution composed of the following (in mm): 125 NaCl, 26 NaHCO3, 2.5 KCl, 1.25 NaH2PO4, 4 MgCl2, 1 CaCl2, and 25 glucose, bubbled with 95% O2/5% CO2. Brains were hemisected, and each hippocampus removed, glued on to an agar block, and mounted in a custom-made tissue chamber on a Vibratome 1000 Plus tissue slicer (Campden Instruments, Loughborough, UK). Individual slices (250 μm thick) were transferred to 0.4 μm Millipore (Bedford, MA) cell culture membrane inserts placed in 35 mm Petri dishes containing 1 ml of a cell culture solution that comprised 50% Eagle’s minimum essential media with Earle’s salts, 25% heat-inactivated horse serum, 25% Hank’s balanced salts, 50 U of penicillin/streptomycin, and 2 mml-glutamine (all from Invitrogen, Paisley, UK). Slices were placed in a humidified 95% air/5% CO2 incubator at 37°C. The cell culture medium was replaced three times per week, and electrophysiological recordings were made from 7 to 14 d after the preparation of the slices. The ability to obtain DPP (or its magnitude) was not dependent on the duration of the culture period.
Electrophysiological recording and analysis of mEPSCs.
For the recording of mEPSCs the individual organotypic slices were transferred to a recording chamber, and CA1 pyramidal neurons were visualized with Nomarski optics (Zeiss Axioskop FS2, Oberkochen, Germany). The recording chamber (volume, 1.5 ml) was perfused at a rate of 4 ml/min, with an external recording solution that contained the following (in mm): 119 NaCl, 26 NaHCO3, 2.5 KCl, 1 NaH2PO4, 1.3 MgCl2, 4 CaCl2, and 25 glucose, bubbled with 95% O2/5% CO2 (300–310 mOsm). The following drugs were used: tetrodotoxin (TTX), picrotoxin, CNQX, d-2-amino-5-phosphonpentanoic acid (d-AP5) (Tocris Bioscience, Bristol, UK), botulinum toxin A, nifedipine, N-ethylmaleimide (NEM), BAPTA, thapsigargin, ryanodine, wortmannin, 2-(4-morpholinyl)-8-phenyl-4H-1-benzopyran-4-one (LY294002), and 2-(4-piperazinyl)-8-phenyl-4H-1-benzopyran-4-one (LY303511) (Sigma–Aldrich, Poole, UK). In addition to these drugs we used the following small peptides that disrupt the interaction of AMPAR subunits with SNARE complexes and other proteins involved in the trafficking of these receptors and that are located in CA1 pyramidal neurons: pep2m, pep4c, pep2-Ala/Val/Lys/Ile (pep2-AVKI), and pep1-Thr/Gly/Leu (pep1-TGL) (Tocris Bioscience). To restrict the action of these peptides to the postsynaptic cell, we included these in the internal recording solution used to fill the patch pipette. All recordings of mEPSCs were performed at room temperature (21 ± 2°C) and were made with the external recording solution supplemented with TTX (300 nm) to block the action potential-dependent release of synaptic vesicles and with picrotoxin (50 μm) to block GABAA receptor-mediated IPSCs.
Patch pipettes were made from thick-walled borosilicate glass (Harvard Apparatus, Kent, UK) and filled with an internal Cs-based ATP-regenerating solution that contained the following (in mm): 105 Cs-gluconate, 17.5 CsCl, 8 NaCl, 10 HEPES, 0.2 EGTA, 2 Mg-ATP, 2 Na2-ATP, 0.3 Na3-GTP, and 20 phosphocreatine plus 50 U/ml creatine phosphokinase, pH 7.3, with CsOH (280–290 mOsm). These electrodes were coated with Sylgard 184 resin (Dow Corning, Midland, MI) to reduce their capacitance, and their tips were fire-polished. The final resistances of the recording electrodes were between 5 and 10 MΩ.
Whole-cell currents were recorded with an Axopatch-1D amplifier (Molecular Devices, Union City, CA) and displayed on an oscilloscope; currents also were stored on digital audio tape for subsequent off-line analysis. Cells were voltage-clamped at a potential of –80 mV, and, to be included for analysis, the holding currents had to be less than –150 pA; series resistances, which typically were ∼20–30 MΩ, could not drift by >15% during the course of the experiment.
Before the application of depolarizing pulses the amplitudes of mEPSCs were measured during a 5 min baseline (control) period. DPP was induced by applying a series of 10 voltage steps from –80 to +20 mV, lasting 3 s, given at an interpulse interval of 6 s. In experiments in which the effects of drugs that inhibited DPP were investigated, we performed “interleaved” control experiments to ensure that we still were able to obtain potentiation in cells from sister cultures not treated with the drugs. In such experiments the recordings were made from treated and nontreated preparations in an alternate manner. Additionally, for these interleaved control experiments the external recording solution, and where appropriate the internal recording solution, contained dimethylsulfoxide or ethanol if these solvents had been used in a particular experiment.
For the analysis of mEPSCs the currents were replayed from tape, filtered at 2 kHz, and digitized at 10 kHz by using WinEDR v6.1 software (John Dempster, University of Strathclyde, UK; http://spider.science.strath.ac.uk/PhysPharm/showPage.php?pageName = software). The amplitudes, frequencies, and kinetic parameters of mEPSCs were measured with the computer program MiniAnalysis (Synaptosoft, Fort Lee, NJ). The threshold for the detection of mEPSCs was typically ∼4–6 pA. To be included for analysis, mEPSCs had to have a monotonic rising phase with a 10–90 rise time of <6 ms and decays that followed an exponential time course with a decay time constant of <25 ms. The vast majority of mEPSCs, however, had rise times and decay time constants considerably less than these upper limits (see below). Amplitude mEPSCs were measured by subtracting the mean current amplitude recorded in the 5 ms before the event from the average of five data points at the peak of the event. Throughout the text we report the absolute amplitudes of mEPSCs, but because these events were recorded as inward currents, their true amplitude is the negative of the values stated, as is indicated in the histograms of mEPSC amplitudes. The decay phases of mEPSCs were fit with single exponential components to obtain an estimate of the decay time constant (τdecay). Mean mEPSC waveforms were obtained by averaging between 50 and 100 individual events. Because of the variation in the mean amplitudes and frequencies of mEPSCs, when reporting the mean values for data pooled from a series of experiments, we have normalized these values to those recorded in baseline recording period before the application of depolarizing pulses. To assess differences in the distributions of mEPSC amplitudes, we constructed cumulative probability plots. In such plots we report the median amplitude value (AV50) of the distribution to allow for comparison between control mEPSCs distributions and distributions obtained after the application of depolarizing pulses.
Statistical analysis.
All results are given as the mean ± SEM. Statistical analysis of amplitudes (and frequencies) of mEPSCs recorded in the baseline (control) period with those recorded after the application of depolarizing pulses was performed with SigmaStat v3, using either Mann–Whitney U or Kolmogorov–Smirnov tests, as appropriate, with statistical significance taken to be at the p < 0.05 level.
Results
In a series of preliminary experiments we observed that the frequency of mEPSCs in acute hippocampal slices prepared from P7–P14 rat pups was too low (< 0.1 Hz) to permit the recording of a sufficient number of events, over a typical recording duration of 30–40 min, to allow for their detailed analysis. Recordings from CA1 pyramidal neurons in organotypic slice culture have indicated that mEPSCs display higher frequencies but retain similar kinetic properties when compared with recordings made from acute slices (de Simoni et al., 2003). Because of these considerations we used the organotypic hippocampal slice preparation for all of the experiments described in this work.
Characteristics of mEPSCs recorded from CA1 pyramidal neurons
In the presence of TTX (300 nm) and picrotoxin (50 μm) spontaneous inward currents with fast monotonic rise times and exponential decays were readily apparent in whole-cell current recordings made from CA1 pyramidal neurons voltage-clamped at –80 mV (Fig. 1A). These events were blocked by the application of CNQX (30 μm; n = 4 slices) (data not shown), and we therefore conclude that these events represent glutamatergic, AMPAR-mediated, TTX-insensitive mEPSCs. No NMDAR-mediated component to mEPSCs is apparent in these recordings because they were made in the presence of MgCl2 (1.3 mm) and at a holding potential at which the voltage-dependent block of the NMDAR channel by magnesium ions is expected to be strong. Furthermore, the absence of an NMDAR-mediated component was confirmed by the lack of sensitivity of both the amplitude and the decay time constants of mEPSCs to d-AP5 (50 μm; n = 3 slices) (data not shown). Over a recording period of 30–40 min the distribution of mEPSCs was stable (Fig. 1B), although amplitude histograms of these events showed a skewed distribution (Fig. 1C) typical of that reported for mEPSCs recorded from CA1 pyramidal neurons in both acute and organotypic slices (Manabe et al., 1992; Wyllie et al., 1994; de Simoni et al., 2003). The AV50 value obtained from the cumulative probability plot in this example is 16.7 pA, whereas the mean mEPSC amplitude recorded in a series of experiments designed to assess the stability of amplitudes over prolonged recording periods was 20.6 ± 1.7 pA (n = 8) (Fig. 1D, top plot); the range of mean amplitudes recorded in these experiments was between 15.4 ± 2.0 and 27.2 ± 2.4 pA. The frequency of mEPSCs during the first 10 min of recording in these experiments was 1.5 ± 0.2 Hz, with a range of 0.5–2.3 Hz. During the course of recording, however, we observed that the frequency of mEPSCs was reduced such that after 25–30 min of whole-cell recording the mean mEPSC frequency was 1.2 ± 0.3 Hz (n = 8) (Fig. 1D, bottom plot). We also examined whether there were correlations among the rise times, decay time constants, and amplitudes of mEPSCs. Figure 1E illustrates a series of such correlation plots for ∼500 randomly selected events recorded during the course of an experiment. As can be seen, we observed no significant correlations among any of these parameters. The mEPSCs we recorded will have originated throughout the dendritic tree of a CA1 neuron and will have been subjected to dendritic filtering such that the rise times, decay times, and amplitudes will not be equivalent to the values of these parameters at their site of origin; however, we did not find evidence that large-amplitude events were associated with fast rise times and decay time constants or vice versa. In these experiments the mean 10–90% rise time of mEPSCs was 1.2 ± 0.1 ms, whereas the average decay time constant was 8.8 ± 0.3 ms. These values are in good agreement with previous reports characterizing mEPSC properties recorded from organotypic hippocampal slices cultured for a similar period of time (McKinney et al., 1999; de Simoni et al., 2003). Our criteria for the inclusion of events for analysis were not so strict as to include only events that originate in close proximity to the soma (i.e., events with the fastest rise times) (Smith et al., 2003), because we wanted to ensure that we included as many events as possible in our studies and because the depolarizing pulse stimulation protocol is expected to result in a cell-wide potentiation of mEPSCs.
Figure 1.

Properties of mEPSCs recorded from CA1 pyramidal neurons in hippocampal slice cultures. A, Five superimposed 1500 ms sweeps of recordings of mEPSCs recorded from a CA1 pyramidal neuron at a holding potential of –80 mV. Two mEPSCs are shown at a 10 times faster time base (indicated by dashed lines). B, Plot of the amplitudes of individual mEPSCs recorded over a 30 min period. C, Amplitude histogram of the data obtained in the first 5 min of the recording shown in B. The histogram shows a clear skew in the distribution. The inset shows the same data as those plotted in the histogram but represented as a cumulative probability plot. D, Plots showing the mean amplitude of mEPSCs (top graph) and mean mEPSC frequency (bottom graph) recorded in a series of control experiments (n = 8); error bars indicate the mean ± SEM. There is no apparent rundown in the amplitude of mEPSCs recorded over a 30 min period. E, Plots showing relationships among the rise times, decay time constants, and amplitudes of mEPSCs. In no case is there a significant correlation among these parameters.
Potentiation of mEPSC amplitudes by postsynaptic depolarization
LTP of glutamatergic synaptic responses in the CA1 region of the hippocampus is critically dependent on a rise in the postsynaptic calcium concentration, this rise usually resulting from calcium entry via the NMDAR (for review, see Nicoll and Malenka, 1999). It is this initial rise in calcium levels that triggers the biochemical cascade that ultimately leads to increased synaptic efficacy. Conventional LTP-inducing protocols, however, result only in the potentiation of comparatively few synapses in a typical CA1 pyramidal neuron. This makes it difficult to observe changes in miniature synaptic currents with these stimulating paradigms, because after LTP induction the vast majority of events will still occur at sites that have not experienced any change in synaptic strength. Previous studies have shown that applying a series of depolarizing voltage pulses from a holding potential of –80 to +20 mV to hippocampal CA1 pyramidal neurons results in a robust, although transient, potentiation of both evoked EPSC and mEPSC amplitudes (Kullmann et al., 1992; Wyllie and Nicoll, 1994; Wyllie et al., 1994). The transient nature of this potentiation could be converted to a sustained potentiation in the presence of protein phosphatase inhibitors (Wyllie and Nicoll, 1994).
In agreement with these earlier studies, we observed that applying a series of 10 depolarizing pulses from –80 to +20 mV to CA1 neurons in organotypic slices cultures resulted in an increase in the amplitude of mEPSCs (Fig. 2A). However, as can be seen in Figure 2, B and C, this protocol resulted in a sustained potentiation of mEPSC amplitudes in contrast to the transient potentiation seen in acute slices. We did not investigate the reasons for this difference. As shown in Figure 2B and also apparent in the comparison of amplitude histograms of events recorded before and after the application of depolarizing pulses (Fig. 2D), there is a reduction in the number of small-amplitude events and an increase in the number of large-amplitude events after the potentiation. Figure 2E shows the corresponding cumulative probability plot for the data shown in the amplitude histograms. In this example the AV50 amplitude for mEPSCs recorded in the control period is 18.2 pA, whereas the corresponding value for mEPSCs recorded after the application of depolarizing pulses is increased significantly to 50.7 pA (p < 0.001; Kolmogorov–Smirnov). The potentiation induced by depolarizing pulses did not alter the rise times and decay times of mEPSCs (Wyllie et al., 1994). Figure 2F shows an average of 50 control mEPSCs (gray trace) and 50 potentiated mEPSCs (black trace); when scaled, the control and potentiated mean mEPSCs are superimposable.
Figure 2.

mEPSC amplitudes are potentiated after a series of depolarizing voltage pulses. A, Five superimposed sweeps of mEPSCs recorded before (top traces) and after (bottom traces) the application of depolarizing pulses to a CA1 pyramidal neuron. B, Plot of the individual amplitudes of mEPSCs recorded in an example experiment. Depolarizing pulses were applied after 5 min. It is apparent that after the depolarizing pulses there is an increase in the number of large-amplitude events (in a given time period) and that there is a shift to larger amplitudes in the size of the smallest events recorded. C, The same data as shown in B but plotted as the mean amplitude of mEPSCs recorded in 1 min bins; error bars indicate the mean ± SEM. D, Amplitude histogram of data illustrated in B recorded in the control period (gray dashed line/gray symbols) and in a similar time period at approximately the peak of the potentiation (solid line/black symbols). There is a clear rightward shift in the plots after the potentiation of mEPSCs. E, Cumulative probability plot of the data shown in D. F, Examples of mean mEPSC waveforms obtained by averaging 50 events recorded before the application of depolarizing pulses (gray trace) and 50 events recorded at approximately the peak of the potentiation (black trace). Scaling the control mEPSC time course to the same amplitude of the potentiated mEPSC results in a superimposition of the two traces and indicates that there is no change in the kinetic parameters of mEPSCs associated with their increased amplitude.
The data from all of the experiments in which depolarizing pulses were applied in the absence of any pharmacological manipulations are shown in Figure 3 (n = 60). Overall we observed that mEPSC amplitudes increased by approximately twofold (from 22.1 ± 0.9 to 46.1 ± 0.1 pA) after the application of depolarizing pulses (Fig. 3A). No changes were observed in the overall mean rise times and decay times of mEPSCs recorded before and after the application of depolarizing pulses, these values being 1.4 ± 0.1 and 11.9 ± 0.1 ms and 1.4 ± 0.1 and 12.6 ± 0.1 ms, respectively. Additionally, and as was the case with the recordings illustrated in Figure 1, potentiated mEPSCs showed no correlations in their rise times, decay times, and amplitudes (data not shown). After the potentiation of mEPSC amplitudes we observed a small transient but nonsignificant increase in the frequency of events from 1.6 ± 0.2 to 1.9 ± 0.2 Hz (p > 0.05; Mann–Whitney U test) (Wyllie et al., 1994). As was the case with our experiments that monitored mEPSC parameters in the absence of any depolarizing pulses (Fig. 1), the frequency of events decreased with time to ∼70% of baseline (pre-DPP induction) levels. The overall mean mEPSC frequency 25–30 min after the induction of DPP was 1.1 ± 0.1 Hz, which is not significantly different (p > 0.05; Mann–Whitney U) from the value of 1.2 ± 0.3 Hz that we obtained at 25–30 min in the experiments illustrated in Figure 1D. Because of this generalized decrease in mEPSC frequency, we have restricted our analysis of the effects of various pharmacological manipulations, described below, mainly to the potentiation of mEPSC amplitudes. The distribution of the extent of potentiation seen across all experiments was distributed normally (Fig. 3C). Figure 3D shows that the initial mean mEPSC amplitude was not dependent on the frequency of events recorded in a cell, nor did the degree of potentiation in mEPSC amplitudes show dependence on initial mEPSC amplitude or frequency (Fig. 3E,F). These data could be taken as evidence to indicate either that DPP does not result in the saturation of spines with AMPARs (Choquet and Triller, 2003) or that, in addition to increased AMPAR expression, DPP results in the modification of AMPAR function/kinetic behavior such that it has a higher probability of opening (Erreger et al., 2004). In relation to this latter point it has been shown recently that Stargazin, a protein involved in the trafficking of AMPARs, also modulates the kinetic behavior of these receptors (Tomita et al., 2005).
Figure 3.

Mean data from all control experiments performed during the course of this study (n = 60). A, Mean time course of DPP showing that there is an approximately twofold increase in the amplitude of mEPSCs triggered by the application of depolarizing pulses, which does not show a significant decline over the time course of the experiment. B, Plot showing the mean (normalized) mEPSC frequency; error bars indicate the mean ± SEM. After the application of depolarizing pulses there is a small transient potentiation of frequencies. C, Histogram showing the range in the fold increase of mEPSC amplitudes after the application of depolarizing pulses. These values appear to be distributed normally around a mean of a twofold increase. D, No significant correlation between the mean mEPSC amplitude and the mean frequency is observed. E, F, Plots showing the lack of correlation between either the control mean mEPSC amplitude or control mean mEPSC frequency and the extent of the potentiation seen after the application of depolarizing pulses.
Sources of calcium required for DPP of mEPSCs
As mentioned above, the main route of calcium entry into the postsynaptic cell during LTP-stimulating protocols is via the NMDAR. However, as shown in the examples of mEPSCs and the plot of the time course of potentiation illustrated in Figure 4A, sustained potentiation of mEPSC amplitudes is still observed in the presence of the NMDAR antagonist d-AP5 (50 μm). No differences in the magnitude of DPP are observed in experiments performed in the absence of d-AP5 (Fig. 3A) and those performed under conditions of NMDAR blockade. In another series of experiments we confirmed that this concentration of d-AP5 was sufficient to block the slow component of a glutamatergic EPSC recorded at +40 mV (data not shown). Thus, although depolarizing the neurons to +20 mV relieves voltage-dependent magnesium block, calcium entry via this route is not sufficient to potentiate mEPSCs.
Figure 4.

DPP is NMDAR independent but requires the activation of L-type calcium channels and calcium release from internal stores. A, Superimposed sweeps of mEPSC activity recorded before (top traces) and after (bottom traces) the application of depolarizing pulses in the presence of d-AP5 (50 μm). There is a clear increase in the amplitude of mEPSCs in the sweeps shown in the bottom traces. The time course of the potentiation seen in the presence of d-AP5 (n = 5) is not different from that seen in the absence of this antagonist (the plot below the mEPSC traces). B, Superimposed sweeps of mEPSC activity recorded before (top traces) and after (bottom traces) the application of depolarizing pulses in the presence of nifedipine (10 μm). As illustrated in the plot below the mEPSC traces, blocking L-type calcium channels prevents the increase in mEPSC amplitudes, whereas interleaved control experiments give typical potentiation. C, Preventing the rise in intracellular calcium by including BAPTA (10 mm) in the recording solution used to fill the patch pipette also prevents potentiation. D, Interfering with intracellular calcium stores by treating slices with a combination of thapsigargin and ryanodine (each 10 μm) also blocks potentiation. In this and subsequent figures we indicate whether the pharmacological manipulations used to interfere with DPP were applied in the external recording solution (as depicted in A, B, D above the plots) or were included in the internal recording solution (as depicted in C). For experiments illustrated in A, B, and D, drugs were present throughout the duration of these recordings. Interleaved control experiments were performed to ensure that reliable DPP could be achieved when experiments examining the pharmacological characterization of depolarizing pulse potentiation were being undertaken. These are depicted (by filled circles) in B (n = 2), C (n = 3), and D (n = 4). Error bars indicate the mean ± SEM.
Although the activation of NMDARs is not required for DPP, there is an absolute requirement for a rise in postsynaptic calcium levels for this type of potentiation to occur (Kullmann et al., 1992; Wyllie et al., 1994). As shown in Figure 4B, the activation of high-threshold voltage-gated calcium channels is required for this form of potentiation because nifedipine (10 μm; n = 3) prevents the depolarizing pulse-induced increase in mEPSC amplitudes. Preventing the rise in calcium levels in the CA1 pyramidal neuron by including the calcium chelator BAPTA (10 mm; n = 3) in the internal recording solution that was used to fill the patch electrode also resulted in the complete block of potentiation (Fig. 4C). These three observations are in agreement with previously published data concerning the role of calcium in DPP in acute hippocampal slices (Wyllie et al., 1994). To assess whether there was a dependence of DPP on intracellular calcium stores, we performed a series of experiments in the presence of thapsigargin and ryanodine (each, 10 μm; n = 6). When used in combination, these inhibitors deplete intracellular calcium stores and prevent calcium-induced calcium release, which, as illustrated in Figure 4D, results in a block of DPP. In all cases in which pharmacological manipulations that interfered with calcium levels in the cell resulted in a block of DPP, interleaved control experiments resulted in significant potentiation of mEPSC amplitudes (Fig. 4B–D, filled circles) (p < 0.05; Mann–Whitney U). Although the most parsimonious explanation for the results described above is that calcium entry via L-type calcium channels is the initial trigger for DPP of mEPSCs, our present study and earlier work (Wyllie et al., 1994) show only that the activation of these channels is required. Thus the possibility exists that a direct protein–protein interaction between L-type calcium channels and ryanodine receptors is responsible for DPP of mEPSCs. Indeed, direct interactions between these proteins have been reported (for review, see Blackstone and Sheng, 1999).
Inhibitors of PI3 kinase block the induction and maintenance of voltage pulse potentiation
PI3 kinase has been implicated as playing a role in the induction (Kelly and Lynch, 2000; Opazo et al., 2003) and maintenance (Sanna et al., 2002) of NMDAR-dependent LTP in the rat hippocampus. Additionally, Man and colleagues (2003) have demonstrated a role for this kinase in glycine-induced potentiation of mEPSCs in cultures of hippocampal neurons. We investigated whether PI3 kinase played a role in the potentiation of mEPSC amplitudes induced by depolarizing pulses. We have used two structurally unrelated inhibitors to examine the role of PI3 kinase: wortmannin, an antifungal antibiotic (Powis et al., 1994), and LY294002, a synthetic and specific inhibitor of PI3 kinase (Vlahos et al., 1994).
Notwithstanding the role that PI3 kinase may play in LTP, controversy exists as to whether PI3 kinase inhibitors, at concentrations that affect LTP, also result in an attenuation of baseline synaptic transmission (Sanna et al., 2002; Opazo et al., 2003). Figure 5 shows the effects of wortmannin (n = 4) (Fig. 5A) and LY294002 (n = 3) (Fig. 5B) on mEPSC amplitudes recorded in a series of experiments to which no depolarizing pulses were applied. In neither case do these inhibitors, at the concentrations used in this study, affect the mean amplitude, the shape of the amplitude histogram, nor the overall distribution of mEPSCs (as indicated by cumulative probability plots) when compared with recordings made in the absence of these inhibitors (Fig. 1).
Figure 5.
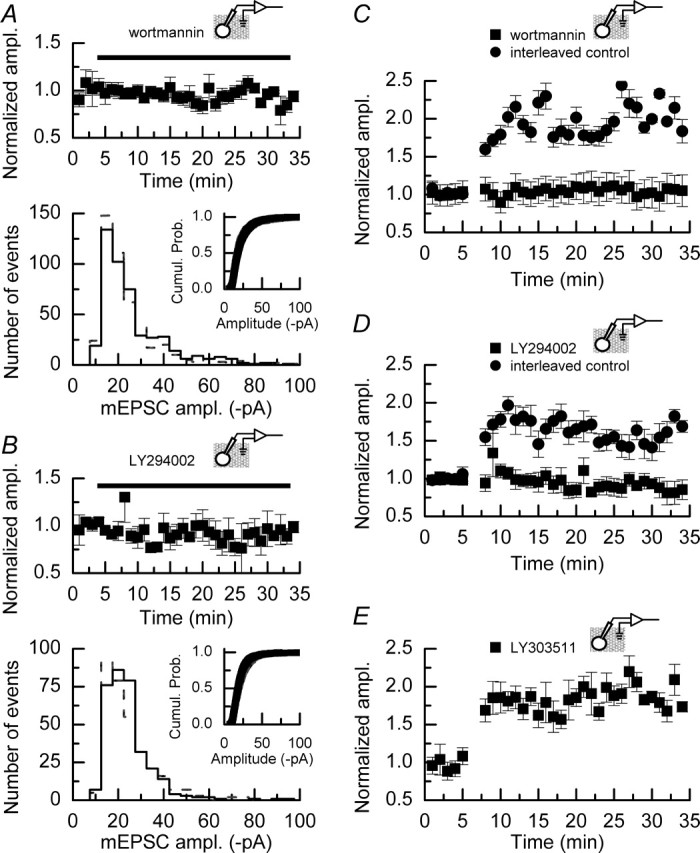
Inhibitors of PI3 kinase do not affect the amplitudes of mEPSCs recorded under control conditions but do block the induction of DPP. A, Top, Mean data from experiments (n = 4) in which wortmannin (100 nm) was applied to slices, but no depolarizing pulses were delivered to CA1 neurons. At this concentration, this PI3 kinase inhibitor does not alter the mean mEPSC amplitude recorded over the time course of the experiment. A, Bottom, Amplitude histogram and cumulative probability plot (inset) from one of the experiments contributing to the data illustrated at the top recorded either before the application of wortmannin (gray dashed line/gray symbols) or after the application of this inhibitor (solid line/black symbols). The distribution of mEPSC amplitudes is not affected by treatment with wortmannin. B, Top, Mean data from experiments (n = 3) in which LY294002 (5 μm) was applied to slices, but no depolarizing pulses were delivered to CA1 neurons. As is the case with wortmannin, this concentration of LY294002 does not alter the mean mEPSC amplitude recorded over the time course of the experiment. B, Bottom, Amplitude histogram and cumulative probability plot (inset) from one of the experiments contributing to the data illustrated at the top recorded either before (gray dashed line/gray symbols) or after (solid line/black symbols) the application of LY294002, showing that there is no change in the distribution of events in the absence or presence of this inhibitor. C, Bath application of wortmannin (100 nm; n = 6) blocks the induction of DPP, whereas interleaved control experiments (n = 6) show typical potentiation of mEPSC amplitudes. D, Bath application of LY294002 (5 μm; n = 6) blocks the induction of DPP, whereas interleaved control experiments (n = 5) show typical potentiation of mEPSC amplitudes. E, The inactive analog LY303511 (5 μm; n = 5) does not prevent the induction of DPP. For experiments illustrated in C–E, drugs were present throughout the duration of these recordings. Error bars indicate the mean ± SEM.
We next examined whether the induction of DPP was blocked in the presence of PI3 kinase inhibitors. Figure 5C shows that in the presence of wortmannin (100 nm) the induction of DPP was blocked, whereas interleaved control experiments showed typical potentiation. PI3 kinase has been reported to modulate voltage-dependent calcium channels (VDCCs) and promote their trafficking to the cell membrane (Steinberg, 2001; Viard et al., 2004); however, we found no evidence that the calcium currents evoked by the depolarizing pulses were altered in the presence of wortmannin (data not shown), ruling out the trivial explanation that the inhibition of PI3 kinase blocks DPP by reducing calcium entry during the induction of the potentiation. We additionally confirmed the role of PI3 kinase in DPP by performing a series of experiments in the presence of LY294002 (5 μm; n = 6). Figure 5D shows that, as was the case with wortmannin, LY294002 also completely blocked the induction of DPP, whereas interleaved control experiments (n = 5) showed potentiation. Finally, to ensure that the block of DPP by LY294002 was not attributable to a nonspecific action of this drug because of its chemical nature, we performed a series of experiments in the presence of LY303511 (5 μm), an inactive analog of LY294002. These two compounds differ at only one position: their morpholine rings, in which a nitrogen atom in LY303511 replaces the oxygen found in LY294002. As shown in Figure 5E, DPP was obtained in the presence of this inactive analog (n = 5).
Reversing the potentiation of mEPSC amplitudes with PI3 kinase inhibitors
Inhibitors of PI3 kinase applied after the induction of LTP can reverse the increase in synaptic efficacy that is observed (Sanna et al., 2002). However, it also has been reported that the concentrations of inhibitors required to reverse LTP maintenance also affect nonpotentiated (control) pathways (Opazo et al., 2003). We examined whether it was possible to reverse the DPP of mEPSCs by using the same concentrations of PI3 kinase inhibitors that we had demonstrated had no effect on the baseline amplitudes of mEPSCs (Fig. 5). Figure 6A illustrates the design of experiments (n = 8) to assess the role of PI3 kinase in the maintenance of the increased mEPSC amplitudes. After inducing DPP and observing an increase in mEPSC amplitudes, we exchanged the external recording solution to one that contained wortmannin (100 nm; as indicated by the bar). This resulted in a reversal of the potentiation, and within the time course of the experiment the mean amplitudes of mEPSCs returned to levels that were not significantly different from those recorded before the application of depolarizing pulses (p > 0.8; Mann–Whitney U). Example traces of mEPSCs recorded at the various time points indicated are shown in Figure 6B; the average mEPSC time course recorded at each of these time points is indicated in Figure 6C. These average traces also indicate that there was no alteration in the kinetic parameters of mEPSCs associated with the reversal of DPP. To confirm this inhibition of the maintenance of DPP, we also examined the effects of LY294002. As is to be expected if this reversal is attributable to an inhibition of ongoing PI3 kinase activity, we observed a similar reversal of DPP with LY294002 (n = 7) (Fig. 6D), whereas reversal of the potentiation was not seen when the inactive analog LY303511 (n = 4) was applied (Fig. 6E).
Figure 6.

Inhibitors of PI3 kinase can reverse the increase in mEPSC amplitudes induced by DPP. A, Bath application of wortmannin (100 nm; n = 8) after the induction of DPP reverses the increase in mEPSC amplitude. Within 10 min of the application of this PI3 kinase inhibitor, the mean amplitudes of mEPSCs return to baseline levels. B, Superimposed sweeps on mEPSC activity recorded during the control period (1), at approximately the peak of the potentiation (2), and after wortmannin has reversed the increase caused by the application of depolarizing pulses (3). C, Examples of mean time courses of mEPSCs recorded during the periods indicated in A and B. The 10–90% rise times for the mean mEPSC from all three time periods are similar (control, 1.5 ± 0.1 ms; potentiated, 1.6 ± 0.1 ms; wortmannin-treated, 1.2 ± 0.2 ms). Similarly, the decay time constants show little difference among the three groups (control, 10.0 ± 0.7 ms; potentiated, 11.2 ± 0.3 ms; wortmannin-treated, 10.0 ± 1.1 ms). D, The PI3 kinase inhibitor LY294002 (5 μm; n = 7) also reverses the increase in mEPSC amplitudes induced by depolarizing pulses, with a time course similar to that seen with wortmannin. E, The inactive analog LY303511 (5 μm; n = 4) does not result in a reversal of DPP. Error bars indicate the mean ± SEM.
N-ethylmaleimide and botulinum toxin A inhibit DPP
Increases in the amplitude of mEPSCs are attributed most easily to an increase in the number of receptors activated by a single packet of transmitter. Although such a change could be accounted for by an increase in the probability that AMPARs open (Popen) after the binding of glutamate, this can occur only if Popen is sufficiently low to allow it to be modulated by a factor large enough to account for the change in mEPSC amplitude. Additionally, an alteration in the single-channel conductance of synaptically located AMPARs also could account for the increase in mEPSC amplitudes we have observed. Indeed, both of these types of modulation have been proposed as mechanisms of AMPAR-mediated changes in synaptic strength (Benke et al., 1998; Banke et al., 2000) (for review, see Erreger et al., 2004). An alternative mechanism also has been described in which there is postsynaptic SNARE-dependent change in synaptic strength that results in the insertion of AMPARs into spines after activity-dependent or pharmacologically induced changes in synaptic strength (Lledo et al., 1998; Nishimune et al., 1998; Song et al., 1998; Shi et al., 1999, 2001; Lu et al., 2001) (for review, see Malinow and Malenka, 2002; Bredt and Nicoll, 2003; Collingridge et al., 2004). It is this latter mechanism that we investigated to determine whether the insertion of AMPARs into synaptic sites could account for the potentiation of mEPSC amplitudes.
We first examined the effect of NEM, a broad spectrum inhibitor of N-ethylmaleimide-sensitive fusion protein (NSF), on the amplitude of mEPSCs. We included NEM (5 mm) in the solution used to fill the patch pipettes to attempt to restrict its actions to the postsynaptic cell, because bath application of NEM also would be expected to interfere with SNAREs located in the presynaptic nerve terminal and, hence, transmitter release. In the absence of depolarizing pulses NEM did not affect the individual amplitudes of mEPSCs nor their distribution (Fig. 7A,B). The mean amplitude of events recorded in the presence of NEM was 24.1 ± 0.4 pA and remained stable during the time course of these experiments (n = 3 experiments) (Fig. 7C). In addition, NEM did not alter the rise times or decay time constants of mEPSCs when compared with control events, these values being 1.0 ± 0.3 and 10.2 ± 1.9 ms, respectively (data not shown). Each of these sets of parameters is not significantly different from the equivalent values we obtained in the control recordings of mEPSCs, the data for which are illustrated in Figure 1 (p > 0.1 for all tests; Mann–Whitney U). However, we did observe that NEM reduced, significantly, the frequency of mEPSCs after 25–30 min of whole-cell recording (from 1.9 ± 0.1 to 1.0 ± 0.1 Hz; p < 0.05; Mann–Whitney U) (Fig. 7D). This reduction in frequency is greater than and has a different profile from the “rundown” in mEPSC frequencies that we observed in earlier experiments (Fig. 1D) and may be taken as evidence that the interaction of AMPARs with NSF is required for constitutive cycling of these receptors (Lledo et al., 1998; Noel et al., 1999).
Figure 7.

NEM does not affect the amplitude of mEPSCs but reduces their frequency. A, Data from a single experiment showing the amplitude of individual mEPSCs recorded with a patch pipette filled with an internal solution containing NEM (5 mm). B, Amplitude histogram and cumulative probability plot (inset) of the data shown in A. C, Pooled data (n = 3) showing that the amplitudes of mEPSCs are stable in the presence of NEM over a 30 min recording period. D, NEM causes the frequencies of mEPSCs to decrease during the course of a 30 min recording. The dashed line indicates the normalized mEPSC frequency observed during the initial 5 min of recording. Error bars indicate the mean ± SEM.
We next examined whether NEM could prevent the increase in mEPSC amplitudes seen after the application of depolarizing pulses. Figure 8A shows examples of superimposed traces of mEPSC activity recorded before and after the application of depolarizing pulses in a single experiment and indicates that no increase in the amplitude of events occurs when NEM is included in the internal solution filling the patch pipette. A plot of the individual amplitudes of events recorded in a single experiment and histograms of mEPSC amplitudes and the corresponding cumulative probability plots (Fig. 8B,C) also confirm that the presence of NEM prevents the induction of DPP. The mean data from all experiments (n = 6) in which NEM was included in the patch pipette and corresponding interleaved control experiments (n = 6) are illustrated in Figure 8D.
Figure 8.
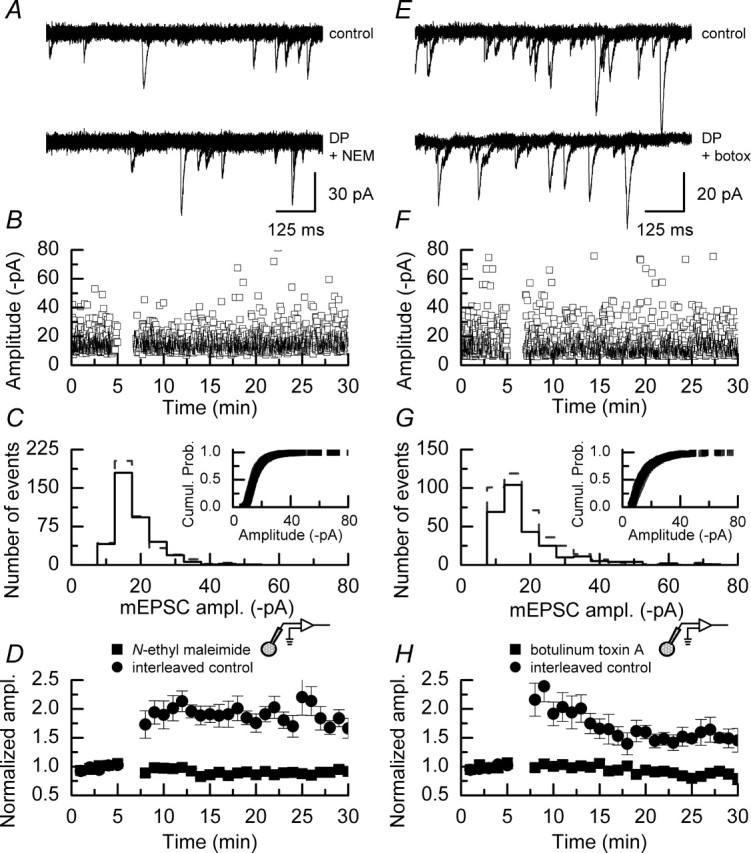
NEM or botulinum toxin A applied to the postsynaptic cell blocks the induction of DPP. A, Superimposed sweeps of mEPSC activity recorded before (top traces) and after (bottom traces) the application of depolarizing pulses in the presence of NEM (5 mm). B, Plot of the individual amplitudes of mEPSCs recorded in an example experiment. Depolarizing pulses were applied after 5 min; it is apparent that after the depolarizing pulses there was no clear increase in the amplitudes of the largest events recorded nor a shift in the amplitude of the smallest events seen in experiments in which NEM was absent (Fig. 2B, for example). C, Amplitude histogram and cumulative probability plot (inset) of the data illustrated in B recorded in the control period (gray dashed line/gray symbols) and in a similar time period after the application of depolarizing pulses (solid line/black symbols). Both the histogram and cumulative probability plot of mEPSC amplitudes are similar and indicate that the presence of NEM in the internal recording solution blocked the potentiation. D, Mean data from all experiments in which NEM was included in the internal recording solution (n = 6) and data from interleaved control experiments (n = 6). DPP was blocked in all of the cells that were examined when NEM was present, whereas typical potentiation was seen in the interleaved control experiments; error bars indicate the mean ± SEM. E, Superimposed sweeps of mEPSC activity recorded before (top traces) and after (bottom traces) the application of depolarizing pulses in the presence of botulinum toxin A (10 ng/ml). F, Plot of the individual amplitudes of mEPSCs recorded in an example experiment. Depolarizing pulses were applied after 5 min, and, similar to the data obtained with NEM, botulinum toxin A prevented the increase in the amplitudes of the largest events recorded and a shift in the amplitude of the smallest events. G, Amplitude histogram and cumulative probability plot (inset) of the data illustrated in F recorded in the control period (gray dashed line/gray symbols) and in a similar time period after the application of depolarizing pulses (solid line/black symbols). No significant differences were seen in these distributions. H, Mean data from all experiments in which botulinum toxin A was included in the internal recording solution (n = 7) and data from interleaved control experiments (n = 5); error bars indicate the mean ± SEM. DPP was blocked in all of the cells that were examined when botulinum toxin A was present, whereas potentiation was seen in the interleaved control experiments.
We next examined the effects of another inhibitor of membrane fusion events on DPP. Botulinum toxin A, when acting at presynaptic nerve terminals, inhibits the action of synaptosome-associated protein of 25 kDa (SNAP-25) and also has been shown to block the potentiation of synaptic currents after NMDAR-dependent LTP (Lledo et al., 1998). Again, for this series of experiments we included this toxin in the solution filling the patch pipette. As a positive control for this series of experiments, we confirmed that the stock solution and concentration used (10 ng/ml) were sufficient to block synaptic transmission at the mouse neuromuscular junction (data not shown) (courtesy of R. R. Ribchester and D. Thomson, University of Edinburgh, UK). The effects of toxin were similar to those reported for NEM. Thus, as shown in Figure 8E–H, no evidence for an increase in mEPSC amplitude was seen when botulinum toxin A was included in the patch pipette. The mean data from all experiments (n = 7) in which botulinum toxin A was included in the patch pipette and corresponding interleaved control experiments (n = 5) are illustrated in Figure 8H.
Preventing the interaction of glutamate receptor 2 AMPAR subunits with NSF and protein interacting with C kinase 1 inhibits DPP
The experiments showing that NEM and botulinum toxin A inhibit DPP imply a role of SNARE complexes and SNAP-25 in the induction of this form of plasticity. However, in the experiments described above, there is the possibility that some of the effects of NEM and botulinum toxin A may be mediated by these inhibitors diffusing from the postsynaptic neuron to affect the function of presynaptic release sites, and this may contribute to the inhibition of DPP of mEPSCs. Thus to gain insight into the mechanism by which an increase in mEPSC might be achieved, we performed additional experiments with a series of short-sequence peptides that inhibit the interaction of AMPAR subunits with proteins involved in the trafficking of these subunits to the cell surface.
Pep2m is a 10-amino-acid sequence that targets the NSF binding motif on the glutamate receptor 2 (GluR2) AMPAR subunit. This peptide has been reported to reduce the amplitude of evoked EPSCs and decrease the surface expression of AMPAR subunits when it is included in internal recording solutions (Nishimune et al., 1998; Lüscher et al., 1999; Luthi et al., 1999; Noel et al., 1999; Kim and Lisman, 2001; Shi et al., 2001; Gardner et al., 2005; Liu and Cull-Candy, 2005). This reduction in evoked EPSC amplitudes may arise from the fact that, during recording, the same populations of synapses are sampled over a prolonged period. Thus, if GluR2 receptor subunits are trafficked (constitutively cycled) on a relatively short time scale (but see Adesnik et al., 2005), then a reduction in their amplitude will be observed because their insertion will be blocked. However, when mEPSCs are monitored, it is unlikely that mEPSCs arising from the same synaptic site will be recorded on multiple occasions. Therefore, in the case of mEPSCs a reduction in their amplitude may not be detected, although a reduction in frequency may occur if clusters of AMPARs are trafficked into and out of spines. Nonetheless, we tested whether pep2m (50 μm) affected the amplitude of mEPSCs recording in the absence of depolarizing pulses (Fig. 9A). The mean amplitude of mEPSCs recorded in these experiments (n = 4) was 29.5 ± 3.3 pA, which although higher than some of the amplitudes recorded in our control experiments, does not indicate that pep2m causes a generalized decrease in mEPSC amplitudes similar to that reported for evoked EPSCs (Noel et al., 1999). We did observe that the frequency of mEPSCs was reduced significantly (p < 0.05; Mann–Whitney U) during the time course of these experiments (Fig. 9B) from an initial value of 1.3 ± 0.2 to 0.9 ± 0.1 Hz after 25 min of whole-cell recording. However, this reduction in frequency is not significantly different from our control recordings (p > 0.05; Mann–Whitney U) (Fig. 1D); thus it is difficult to ascribe, unequivocally, this reduction to a specific action of pep2m as has been suggested previously (Noel et al., 1999) (but see Liu and Cull-Candy, 2005). Nonetheless, consistent with the idea that the infusion of pep2m affects the properties of, or results in an ablation of, mEPSCs originating from synapses proximal to the soma, we observed an increase in both the rise time and decay time constants of mEPSCs recorded toward the end of the 30 min recording period, compared with events recorded under control conditions. These values were 1.7 ± 0.1 and 21.1 ± 0.9 ms, respectively, which is to be expected if such events originated from more distal sites (Noel et al., 1999).
Figure 9.

Effects of peptide inhibitors on control mEPSC amplitudes and frequencies. A, B, Effect of pep2m (50 μm; n = 4) on mEPSCs recorded in the absence of depolarizing pulses. Although pep2m does not affect the amplitude of events, their frequencies are reduced significantly in the final 10 min of the recording period as compared with the initial 10 min of recording (p < 0.05; Mann–Whitney U). C, D, Pep2-AVKI (50 μm; n = 3) does not affect the amplitude of mEPSCs. The frequencies of mEPSCs are not significantly different during the initial and final 10 min of recording (p > 0.05, Mann–Whitney U). E, F, Pep1-TGL (50 μm; n = 3) on its own does not affect the amplitudes or frequencies of mEPSCs. The dashed lines indicate the normalized mEPSC amplitudes or frequencies observed during the initial 5 min of recording. Error bars indicate the mean ± SEM.
Figure 10A illustrates the effects of pep2m (50 μm) on DPP. Superimposed sweeps on mEPSC activity recorded before and after the application of depolarizing pulses indicate that there is little change in the amplitude of these events in the presence of this inhibitor. Comparison of amplitude histograms and corresponding cumulative probability plots confirmed that the induction of DPP is blocked by pep2m. To ensure that the action of pep2m was not attributable to a nonspecific effect of including this peptide in the internal recording solution, we also performed experiments with pep4c, a 10-amino-acid peptide that differs from pep2m in position 8, where the asparagine residue of pep2m is replaced by a serine residue. This single amino acid substitution prevents pep4c from interacting with the NSF binding domain of the GluR2 AMPAR subunit (Nishimune et al., 1998). In a series of experiments (n = 3; data not shown) we confirmed that pep4c did not affect the amplitude of mEPSCs in the absence of depolarizing pulses (23.1 ± 2.0 pA). In these experiments we also noted that pep4c did not affect the frequency of mEPSCs nor their rise time or decay time constants (1.2 ± 0.3 Hz; 1.2 ± 0.2 and 14.0 ± 1.0 ms, respectively). In the presence of pep4c (50 μm) we observed typical potentiation of mEPSCs after the application of depolarizing pulses (Fig. 10B). Increases in the amplitude of the largest mEPSCs recorded, together with an increase in the amplitude of the smallest events, are clearly visible. As is to be expected, amplitude histograms and cumulative probability plots of mEPSCs recorded after the application of depolarizing pulses in the presence of pep4c were significantly different (p < 0.01; Kolmogorov–Smirnov) (Fig. 10B, bottom panel). The mean potentiation seen in all experiments performed in the presence of either pep2m (n = 8) or pep4c (n = 4) is shown in Figure 10C. Although typical potentiation is seen in the presence of pep4c, cells treated with pep2m show no potentiation other than a modest, transient increase in mEPSC amplitudes in the first few minutes after the induction protocol.
Figure 10.
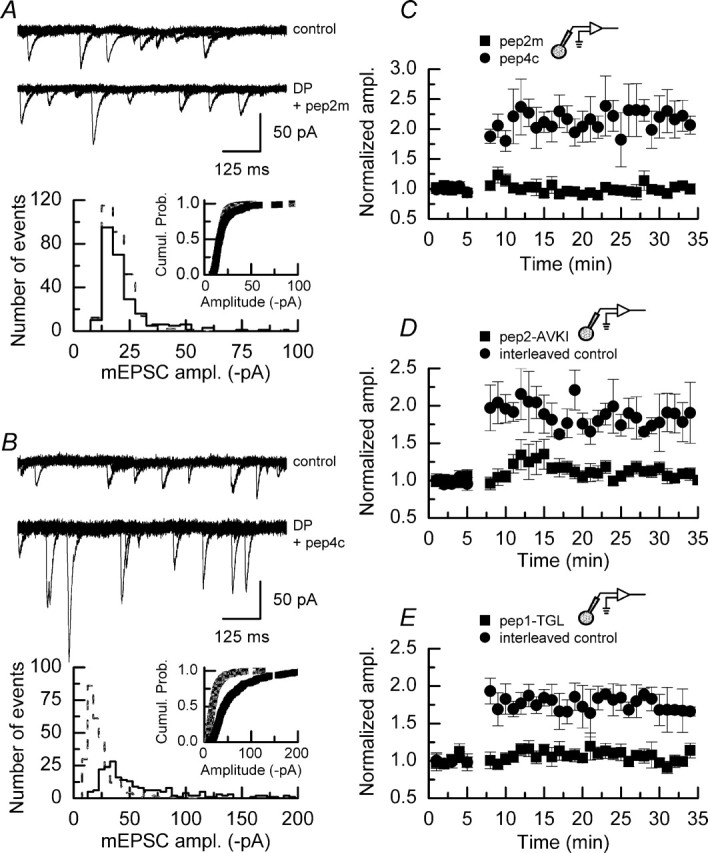
Pep2m, pep2-AVKI, and pep1-TGL each block the induction of DPP. A, Top, Superimposed sweeps of mEPSC activity recorded before (top traces) and after (bottom traces) the application of depolarizing pulses in the presence of pep2m (50 μm). A, Bottom, Amplitude histogram and cumulative probability plot (inset) of mEPSC amplitudes recorded in a control period (gray dashed line/gray symbols) and in a similar time period after the application of depolarizing pulses (solid line/black symbols). No significant differences are seen in these distributions. B, Top, Shown are superimposed sweeps of mEPSC activity recorded before (top traces) and after (bottom traces) the application of depolarizing pulses in the presence of pep4c (50 μm), a peptide that differs from pep2m by a single amino acid; the asparagine residue at position 8 of pep2m is replaced by a serine residue in pep4c. In the presence of pep4c, clear potentiation of mEPSC amplitudes can be seen. B, Bottom, Amplitude histogram and cumulative probability plot (inset) of mEPSC amplitudes recorded in a control period (gray dashed line/gray symbols) and in a similar time period after the application of depolarizing pulses (solid line/black symbols). Shifts in mEPSC amplitudes are clearly apparent in both distributions, indicating that pep4c does not prevent the induction of the potentiation. C, Mean data from all experiments in which either pep2m (▪; n = 8) or pep4c (•;; n = 4) was included in the internal recording solution; error bars indicate the mean ± SEM. Only in the presence of pep2m is DPP blocked. D, Mean data from all experiments in which pep2-AVKI (▪; n = 8) was included in the internal recording solution and corresponding control experiments performed during the same period (•;; n = 3); error bars indicate the mean ± SEM. A small but transient potentiation of mEPSC amplitudes was seen in the presence of pep2-AVKI. E, Mean data from all experiments in which pep1-TGL (▪; n = 7) was included in the internal recording solution; error bars indicate the mean ± SEM. Complete block of potentiation was observed when this peptide was present. Data from interleaved control experiments (•;; n = 5) showed typical potentiation.
In addition to the interaction of GluR2 subunits with the NSF protein, synaptic expression and composition of AMPARs have been shown to be dependent on the action of protein interacting with C kinase 1 (PICK1) (Li et al., 1999; Chung et al., 2000; Daw et al., 2000; Perez et al., 2001; Hirbec et al., 2002; Terashima et al., 2004). The 11-amino-acid peptide pep2-AVKI is directed against the PICK1/GluR2 receptor-binding motif (Osten et al., 2000) without affecting interactions with other proteins, such as GRIP/ABP (glutamate receptor-interacting protein/AMPAR-binding protein), which also are involved in the trafficking of AMPARs containing this subunit. We investigated whether this peptide could prevent DPP. In a series of control experiments (n = 3) we confirmed, in agreement with a recent report (Liu and Cull-Candy, 2005), that this peptide did not affect mEPSC amplitudes (20.0 ± 3.6 pA) or frequencies (1.6 ± 0.2 Hz) in the absence of depolarizing pulses (Fig. 9C,D). The values are not significantly different from those illustrated in Figure 1D (p > 0.05; Mann–Whitney U). However, as shown in the pooled data (n = 8) illustrated in Figure 10D, pep2-AVKI prevented the increase in mEPSC amplitudes after the application of depolarizing pulses. As with pep2m, we observed a small transient potentiation of amplitudes immediately after the induction protocol.
GluR1 subunit interactions with synapse-associated protein-97 are required for DPP
AMPARs in CA1 pyramidal neurons contain GluR2 subunits existing predominately as heteromeric complexes of GluR1/GluR2 receptor subunits or GluR2/GluR3 receptor subunits (Wenthold et al., 1996) (for review, see Bredt and Nicoll, 2003). The experiments described above have examined only the interaction of the GluR2 receptor subunit with membrane fusion/trafficking processes. Although GluR2 subunit interactions with NSF and PICK1 have been suggested to play an important role in constitutive cycling of AMPARs, the mechanisms of expression of LTP may involve, in addition, interaction of the GluR1 subunit with calcium/calmodulin-dependent protein kinase II (CaMKII) and synapse-associated protein-97 (SAP-97) (Leonard et al., 1998; Hayashi et al., 2000; Shi et al., 2001; Rumbaugh et al., 2003). The 11-amino-acid peptide pep1-TGL is a peptide sequence targeted to the TGL motif found in the C terminus of the GluR1 subunit that binds to SAP-97 (Hayashi et al., 2000; Shi et al., 2001). We investigated, by interfering with this interaction between GluR1 and SAP-97, whether DPP was compromised.
As with all of the peptides investigated in this study, we examined, initially, the effect of pep1-TGL (50 μm) on mEPSCs recorded from CA1 pyramidal neurons in the absence of any depolarizing pulse-stimulating protocol. The mean amplitude of mEPSCs recorded in the presence of pep1-TGL (23.1 ± 3.1 pA; n = 3) (Fig. 9E) was not significantly different from mean values recorded in control cells (p < 0.05; Mann–Whitney U). Additionally, pep1-TGL did not alter the mEPSC frequencies (Fig. 9F) nor their kinetic properties. However, inclusion of pep1-TGL (50 μm) in the internal recording solution resulted in a block of the potentiation of mEPSC amplitudes induced by depolarizing pulses. The mean data obtained from all experiments performed in the presence of pep1-TGL (n = 7) and the corresponding interleaved control experiments (n = 5) are shown in Figure 10E.
Discussion
DPP: comparison with NMDAR-dependent LTP
Changes in synaptic strength in the CA1 region of the mammalian hippocampus, whether these result in increased or decreased activity, are triggered initially by spatiotemporal changes in intracellular calcium levels. Conventional NMDAR-dependent LTP-inducing protocols result in only a small percentage of synapses experiencing this change in calcium level, making changes in miniature synaptic events difficult to observe (but see Manabe et al., 1992). Although the potentiation described in this paper is not dependent on NMDAR activation and is unlikely to be equivalent to CA1 NMDAR-dependent LTP, our results show that increases in synaptic activity brought about by activation of VDCCs share common signaling pathways and expression mechanisms, with changes in synaptic efficacy resulting from NMDAR-dependent LTP.
The role of VDCCs in NMDAR-dependent LTP induced by theta burst stimulation has been investigated (Grover and Teyler, 1990; Morgan and Teyler, 2001), and these studies have provided evidence that, in addition to an NMDAR-dependent component to theta burst-induced LTP, VDCCs can be activated and induce potentiation of synaptic potentials that are blocked by nifedipine. Thus, although DPP is not equivalent to such theta burst-induced potentiation (because it shows no NMDAR-dependent component), there is reason to believe that our induction protocol activates signaling cascades that also can be triggered with physiologically relevant stimuli.
Our finding that the potentiation was stable over the time course of our experiments, rather than transient, is in contrast to earlier reports (Kullmann et al., 1992; Wyllie and Nicoll, 1994; Wyllie et al., 1994). Earlier studies were performed by using acute slices and were performed on a different species (guinea pig compared to rat). Nevertheless, using rat acute slices, Hendricson and colleagues (2003) have reported transient potentiation with the use of a protocol similar to that describe here. One intriguing possibility to explain the temporal differences in the potentiation is that levels of phosphatase activity are different in acute and organotypic slices. In experiments that used acute slices, Wyllie and Nicoll (1994) showed that inhibition of phosphatase activity converted transient potentiation to a stable form. Alternatively, organotypic slice preparations simply might give rise to a potentiation that decays more slowly and that was not detected during the time course of our experiments. Our fundamental observations, namely that DPP of mEPSC amplitudes is NMDAR-independent, requires activation of L-type VDCCs, and is blocked by postsynaptic chelation of calcium, are similar to those reported in the original study (Wyllie et al., 1994). In addition, the experiments with ryanodine and thapsigargin reveal a requirement for functional intracellular calcium stores in the induction of DPP. It remains to be determined whether calcium itself triggers intracellular release or whether it results from second messenger action, e.g., inositol triphosphate-stimulated release.
It should be noted that, although our data demonstrate that DPP and NMDAR-dependent LTP show some similarities in terms of expression mechanisms, calcium entry via VDCCs does not substitute for calcium entry via NMDARs in other processes triggered by NMDAR activation. For example, excitotoxicity initiated by calcium entry via NMDARs is not mimicked by calcium entry via VDCCs even when levels of calcium entry through VDCCs are equal to, or greater than, those sufficient to trigger cell death via NMDARs (Tymianski et al., 1993; Sattler et al., 1998; Hardingham and Bading, 2003).
PI3 kinase and DPP
PI3 kinase plays a pivotal role in intracellular signaling cascades and is a common target (or link) with other biochemical transduction mechanisms thought to be involved in LTP (for example, NMDAR-dependent ERK activation). Our findings that DPP also has a dependency on PI3 kinase suggest that the processes activated by calcium entry either through NMDARs or VDCCs may have a common convergence; whether this is at the level of the kinase itself or upstream or downstream of PI3 kinase remains to be determined. We did not examine the mechanism by which calcium entry via VDCCs results in PI3 kinase activation. Because DPP also has a requirement for CaMKII activity (Wyllie and Nicoll, 1994), activation of PI3 kinase may depend on upstream signaling cascades rather than on direct activation of PI3 kinase by calcium entry from VDCCs. In this respect it is interesting to note that Sanna and colleagues (2002) also report that a VDCC-dependent form of LTP is blocked by LY294002. Furthermore, our data lend support to the argument that inhibiting the activity of PI3 kinase can reverse the increase in synaptic strength after LTP (Sanna et al., 2002) (but see Opazo et al., 2003). The fact that neither of the PI3 kinase inhibitors used in this study affected the mean mEPSC amplitudes in control recordings suggests that this kinase does not play a prominent role in maintaining surface expression of AMPARs (at least on the time scale monitored in this study). Rather, PI3 kinase activity is essential in the induction and maintenance of the potentiation. We did not, in the experiments addressing reversibility of potentiation, examine the maintenance phase sensitivity to PI3 kinase inhibitors by applying these to slices at later time intervals. In this respect it is interesting to note that, following NMDAR-dependent LTP, AMPARs composed of GluR1/GluR2 subunits are inserted rapidly into membranes, only to be replaced at a later time with complexes containing GluR2/GluR3 (Shi et al., 2001; Lee et al., 2004), indicating that mechanisms exists for the replacement of recently inserted AMPA receptors. Thus the sensitivity of reversibility of DPP to PI3 kinase inhibitors may be related to this mechanism. In addition to our present results showing a role for PI3 kinase in DPP, it is interesting to note that protein kinase A (PKA) also has been implicated in AMPAR subunit trafficking in synaptic plasticity-induced organotypic slice cultures (Esteban et al., 2003). It remains to be determined whether there is any PKA dependency of DPP.
Membrane fusion events, receptor trafficking, and DPP
Inhibitors of membrane fusion events, together with small peptides that disrupt the interaction of AMPAR subunits with proteins involved in receptor trafficking, each blocked the induction of DPP. Although both NSF and botulinum toxin A have been shown to block the induction of NMDAR-dependent LTP (Lledo et al., 1998), experiments that used the inhibitory peptide pep2m to block the interaction of the GluR2 AMPAR subunit with NSF generally have concluded that the GluR2–NSF interaction is involved in the constitutive cycling of AMPARs (Nishimune et al., 1998; Lüscher et al., 1999; Luthi et al., 1999; Noel et al., 1999; Kim and Lisman, 2001; Shi et al., 2001; Gardner et al., 2005; Liu and Cull-Candy, 2005) and in the expression of long-term depression (LTD) (Lüscher et al., 1999; Luthi et al., 1999). In this respect the effects of pep2m on DPP contrast with those seen with conventional LTP.
Conflicting reports exist concerning the role of PICK1 in regulating AMPARs at synapses. In the hippocampus PICK1 decreases GluR2 subunit expression by promoting internalization of AMPARs (Kim et al., 2001; Perez et al., 2001) and thus may be involved in the expression of LTD but also can increase the insertion of AMPARs by releasing them from intracellular membranes (Daw et al., 2000) or by promoting the expression of GluR2 lacking AMPARs (Terashima et al., 2004). In the cerebellum PICK1 promotes the insertion of GluR2-containing AMPARs after high-frequency stimulation of synaptic inputs to stellate cells (Gardner et al., 2005; Liu and Cull-Candy, 2005). We observed that the inhibitory peptide pep2-AVKI, which blocks the interaction of the GluR2 subunit with PICK1, blocks the DPP of mEPSC amplitudes. However, we have not investigated the rectification properties of potentiated mEPSCs and therefore cannot determine whether this stimulation protocol results in a similar change that has been seen with high-frequency stimulation of inputs to stellate cells. We did, however, observe a small transient potentiation in the presence of pep2-AVKI, which might indicate that other trafficking proteins can mediate, albeit to a lesser extent, aspects of this potentiation.
In our final set of experiments we observed that blocking the interaction of GluR1 subunits with SAP-97 with the peptide pep1-TGL also inhibited DPP. This suggests that, in addition to interactions of GluR2 with trafficking proteins, there is a requirement for an intact GluR1 trafficking mechanism to allow DPP to be established. Whether the nature of the stimulus used to induce DPP reveals a different mechanism for receptor trafficking than has been suggested for NMDAR-dependent LTP or whether such interaction also can occur in other forms of activity-dependent changes in synaptic strength remains to be determined.
Conclusion
Our data support the emerging consensus that rises in intracellular calcium lead to increases in synaptic efficacy by increasing the number of functional AMPARs expressed in spines. The increase in mEPSC amplitudes triggered by depolarizing pulses is mediated by a signaling cascade that involves PI3 kinase and the interaction of AMPAR subunits with proteins such as NSF, PICK1, and SAP-97 and, in this respect, shares a commonality with NMDAR-dependent plasticity. The ability to induce changes at a large number of sites throughout the dendritic tree of a CA1 pyramidal cell provides a mechanism to investigate alterations in synaptic strength by using biochemical and imaging techniques that have, to date, been reliant mainly on pharmacologically induced potentiation to achieve cell-wide potentiation.
Footnotes
A. W. Baxter’s present address: Faculty of Life Sciences, Michael Smith Building, University of Manchester, Oxford Road, Manchester M13 9PT, UK.
This work was supported by grants to D.J.A.W. from the Biotechnology and Biological Sciences Research Council (15/C16800) and The Royal Society (RSRG22116). A.W.B. acknowledges grateful receipt of a Biotechnology and Biological Sciences Research Council Committee Studentship that supported this work. We thank our colleagues in the Cognition, Learning, and Synaptic Plasticity Group at the University of Edinburgh and members of the D.J.A.W. lab for helpful discussions during the course of this project.
References
- Adesnik H, Nicoll RA, England PM (2005). Photoinactivation of native AMPA receptors reveals their real-time trafficking. Neuron 48:977–985. [DOI] [PubMed] [Google Scholar]
- Banke TG, Bowie D, Lee H, Huganir RL, Schousboe A, Traynelis SF (2000). Control of GluR1 AMPA receptor function by cAMP-dependent protein kinase. J Neurosci 20:89–102. [DOI] [PMC free article] [PubMed] [Google Scholar]
- Benke TA, Luthi A, Isaac JT, Collingridge GL (1998). Modulation of AMPA receptor unitary conductance by synaptic activity. Nature 393:793–797. [DOI] [PubMed] [Google Scholar]
- Blackstone C, Sheng M (1999). Protein targeting and calcium signaling microdomains in neuronal cells. Cell Calcium 26:181–192. [DOI] [PubMed] [Google Scholar]
- Bredt DS, Nicoll RA (2003). AMPA receptor trafficking at excitatory synapses. Neuron 40:361–379. [DOI] [PubMed] [Google Scholar]
- Chandler LJ, Sutton G, Dorairaj NR, Norwood D (2001). N-methyl-d-aspartate receptor-mediated bidirectional control of extracellular signal-regulated kinase activity in cortical neuronal cultures. J Biol Chem 276:2627–2636. [DOI] [PubMed] [Google Scholar]
- Choquet D, Triller A (2003). The role of receptor diffusion in the organization of the postsynaptic membrane. Nat Rev Neurosci 4:251–265. [DOI] [PubMed] [Google Scholar]
- Chung HJ, Xia J, Scannevin RH, Zhang X, Huganir RL (2000). Phosphorylation of the AMPA receptor subunit GluR2 differentially regulates its interaction with PDZ domain-containing proteins. J Neurosci 20:7258–7267. [DOI] [PMC free article] [PubMed] [Google Scholar]
- Collingridge GL, Isaac JT, Wang YT (2004). Receptor trafficking and synaptic plasticity. Nat Rev Neurosci 5:952–962. [DOI] [PubMed] [Google Scholar]
- Daw MI, Chittajallu R, Bortolotto ZA, Dev KK, Duprat F, Henley JM, Collingridge GL, Isaac JT (2000). PDZ proteins interacting with C-terminal GluR2/3 are involved in a PKC-dependent regulation of AMPA receptors at hippocampal synapses. Neuron 28:873–886. [DOI] [PubMed] [Google Scholar]
- de Simoni A, Griesinger CB, Edwards FA (2003). Development of rat CA1 neurones in acute versus organotypic slices: role of experience in synaptic morphology and activity. J Physiol (Lond) 550:135–147. [DOI] [PMC free article] [PubMed] [Google Scholar]
- Erreger K, Chen PE, Wyllie DJ, Traynelis SF (2004). Glutamate receptor gating. Crit Rev Neurobiol 16:187–224. [DOI] [PubMed] [Google Scholar]
- Esteban JA, Shi SH, Wilson C, Nuriya M, Huganir RL, Malinow R (2003). PKA phosphorylation of AMPA receptor subunits controls synaptic trafficking underlying plasticity. Nat Neurosci 6:136–143. [DOI] [PubMed] [Google Scholar]
- Gardner SM, Takamiya K, Xia J, Suh JG, Johnson R, Yu S, Huganir RL (2005). Calcium-permeable AMPA receptor plasticity is mediated by subunit-specific interactions with PICK1 and NSF. Neuron 45:903–915. [DOI] [PubMed] [Google Scholar]
- Grover L, Teyler TJ (1990). Two components of long-term potentiation induced by different patterns of afferent activation. Nature 347:477–479. [DOI] [PubMed] [Google Scholar]
- Hardingham GE, Bading H (2003). The yin and yang of NMDA receptor signaling. Trends Neurosci 26:81–89. [DOI] [PubMed] [Google Scholar]
- Hayashi Y, Shi SH, Esteban JA, Piccini A, Poncer JC, Malinow R (2000). Driving AMPA receptors into synapses by LTP and CaMKII: requirement for GluR1 and PDZ domain interaction. Science 287:2262–2267. [DOI] [PubMed] [Google Scholar]
- Hendricson AW, Thomas MP, Lippmann MJ, Morrisett RA (2003). Suppression of L-type voltage-gated calcium channel-dependent synaptic plasticity by ethanol: analysis of miniature synaptic currents and dendritic calcium transients. J Pharmacol Exp Ther 307:550–558. [DOI] [PubMed] [Google Scholar]
- Hirbec H, Perestenko O, Nishimune A, Meyer G, Nakanishi S, Henley JM, Dev KK (2002). The PDZ proteins PICK1, GRIP, and syntenin bind multiple glutamate receptor subtypes. Analysis of PDZ binding motifs. J Biol Chem 277:15221–15224. [DOI] [PubMed] [Google Scholar]
- Kelly A, Lynch MA (2000). Long-term potentiation in dentate gyrus of the rat is inhibited by the phosphoinositide 3 kinase inhibitor, wortmannin. Neuropharmacology 39:643–651. [DOI] [PubMed] [Google Scholar]
- Kim CH, Lisman JE (2001). A labile component of AMPA receptor-mediated synaptic transmission is dependent on microtubule motors, actin, and N-ethylmaleimide-sensitive factor. J Neurosci 21:4188–4194. [DOI] [PMC free article] [PubMed] [Google Scholar]
- Kim CH, Chung HJ, Lee HK, Huganir RL (2001). Interaction of the AMPA receptor subunit GluR2/3 with PDZ domains regulates hippocampal long-term depression. Proc Natl Acad Sci USA 98:11725–11730. [DOI] [PMC free article] [PubMed] [Google Scholar]
- Kullmann DM, Perkel DJ, Manabe T, Nicoll RA (1992). Ca2+ entry via postsynaptic voltage-sensitive Ca2+ channels can transiently potentiate excitatory synaptic transmission in the hippocampus. Neuron 9:1175–1183. [DOI] [PubMed] [Google Scholar]
- Lee SH, Simonetta A, Sheng M (2004). Subunit rules governing the sorting of internalized AMPA receptors in hippocampal neurons. Neuron 43:221–236. [DOI] [PubMed] [Google Scholar]
- Leonard AS, Davare MA, Horne MC, Garner CC, Hell JW (1998). SAP97 is associated with the α-amino-3-hydroxy-5-methylisoxazole-4-propionic acid receptor GluR1 subunit. J Biol Chem 273:19518–19524. [DOI] [PubMed] [Google Scholar]
- Li P, Kerchner GA, Sala C, Wei F, Huettner JE, Sheng M, Zhuo M (1999). AMPA receptor–PDZ interactions in facilitation of spinal sensory synapses. Nat Neurosci 2:972–977. [DOI] [PubMed] [Google Scholar]
- Liu SJ, Cull-Candy SG (2005). Subunit interaction with PICK and GRIP controls Ca2+ permeability of AMPARs at cerebellar synapses. Nat Neurosci 6:768–775. [DOI] [PubMed] [Google Scholar]
- Lledo PM, Zhang X, Sudhof TC, Malenka RC, Nicoll RA (1998). Postsynaptic membrane fusion and long-term potentiation. Science 279:399–403. [DOI] [PubMed] [Google Scholar]
- Lu W, Man H, Ju W, Trimble WS, MacDonald JF, Wang YT (2001). Activation of synaptic NMDA receptors induces membrane insertion of new AMPA receptors and LTP in cultured hippocampal neurons. Neuron 29:243–254. [DOI] [PubMed] [Google Scholar]
- Lüscher C, Xia H, Beattie EC, Carroll RC, von Zastrow M, Malenka RC, Nicoll RA (1999). Role of AMPA receptor cycling in synaptic transmission and plasticity. Neuron 24:649–658. [DOI] [PubMed] [Google Scholar]
- Luthi A, Chittajallu R, Duprat F, Palmer MJ, Benke TA, Kidd FL, Henley JM, Isaac JT, Collingridge GL (1999). Hippocampal LTD expression involves a pool of AMPARs regulated by the NSF–GluR2 interaction. Neuron 24:389–399. [DOI] [PubMed] [Google Scholar]
- Malinow R, Malenka RC (2002). AMPA receptor trafficking and synaptic plasticity. Annu Rev Neurosci 25:103–126. [DOI] [PubMed] [Google Scholar]
- Man HY, Wang Q, Lu WY, Ju W, Ahmadian G, Liu L, D’Souza S, Wong TP, Taghibiglou C, Lu J, Becker LE, Pei L, Liu F, Wymann MP, MacDonald JF, Wang YT (2003). Activation of PI3 kinase is required for AMPA receptor insertion during LTP of mEPSCs in cultured hippocampal neurons. Neuron 38:611–624. [DOI] [PubMed] [Google Scholar]
- Manabe T, Renner P, Nicoll RA (1992). Postsynaptic contribution to long-term potentiation revealed by the analysis of miniature synaptic currents. Nature 355:50–55. [DOI] [PubMed] [Google Scholar]
- McKinney RA, Capogna M, Durr R, Gahwiler BH, Thompson SM (1999). Miniature synaptic events maintain dendritic spines via AMPA receptor activation. Nat Neurosci 2:44–49. [DOI] [PubMed] [Google Scholar]
- Morgan SL, Teyler TJ (2001). Electrical stimuli patterned after the theta-rhythm induce multiple forms of LTP. J Neurophysiol 86:1289–1296. [DOI] [PubMed] [Google Scholar]
- Nicoll RA, Malenka RC (1999). Expression mechanisms underlying NMDA receptor-dependent long-term potentiation. Ann NY Acad Sci 868:515–525. [DOI] [PubMed] [Google Scholar]
- Nishimune A, Isaac JT, Molnar E, Noel J, Nash SR, Tagaya M, Collingridge GL, Nakanishi S, Henley JM (1998). NSF binding to GluR2 regulates synaptic transmission. Neuron 21:87–97. [DOI] [PubMed] [Google Scholar]
- Noel J, Ralph GS, Pickard L, Williams J, Molnar E, Uney JB, Collingridge GL, Henley JM (1999). Surface expression of AMPA receptors in hippocampal neurons is regulated by an NSF-dependent mechanism. Neuron 23:365–376. [DOI] [PubMed] [Google Scholar]
- Opazo P, Watabe AM, Grant SG, O’Dell TJ (2003). Phosphatidylinositol 3 kinase regulates the induction of long-term potentiation through extracellular signal-related kinase-independent mechanisms. J Neurosci 23:3679–3688. [DOI] [PMC free article] [PubMed] [Google Scholar]
- Osten P, Khatri L, Perez JL, Kohr G, Giese G, Daly C, Schulz TW, Wensky A, Lee LM, Ziff EB (2000). Mutagenesis reveals a role for ABP/GRIP binding to GluR2 in synaptic surface accumulation of the AMPA receptor. Neuron 27:313–325. [DOI] [PubMed] [Google Scholar]
- Perez JL, Khatri L, Chang C, Srivastava S, Osten P, Ziff EB (2001). PICK1 targets activated protein kinase Cα to AMPA receptor clusters in spines of hippocampal neurons and reduces surface levels of the AMPA-type glutamate receptor subunit 2. J Neurosci 21:5417–5428. [DOI] [PMC free article] [PubMed] [Google Scholar]
- Perkel DJ, Petrozzino JJ, Nicoll RA, Connor JA (1993). The role of Ca2+ entry via synaptically activated NMDA receptors in the induction of long-term potentiation. Neuron 11:817–823. [DOI] [PubMed] [Google Scholar]
- Perkinton MS, Ip JK, Wood GL, Crossthwaite AJ, Williams RJ (2002). Phosphatidylinositol 3 kinase is a central mediator of NMDA receptor signaling to MAP kinase (Erk1/2), Akt/PKB, and CREB in striatal neurones. J Neurochem 80:239–254. [DOI] [PubMed] [Google Scholar]
- Powis G, Bonjouklian R, Berggren MM, Gallegos A, Abraham R, Ashendel C, Zalkow L, Matter WF, Dodge J, Grindey G (1994). Wortmannin, a potent and selective inhibitor of phosphatidylinositol-3 kinase. Cancer Res 54:2419–2423. [PubMed] [Google Scholar]
- Rumbaugh G, Sia GM, Garner CC, Huganir RL (2003). Synapse-associated protein-97 isoform-specific regulation of surface AMPA receptors and synaptic function in cultured neurons. J Neurosci 23:4567–4576. [DOI] [PMC free article] [PubMed] [Google Scholar]
- Sanna PP, Cammalleri M, Berton F, Simpson C, Lutjens R, Bloom FE, Francesconi W (2002). Phosphatidylinositol 3 kinase is required for the expression but not for the induction or the maintenance of long-term potentiation in the hippocampal CA1 region. J Neurosci 22:3359–3365. [DOI] [PMC free article] [PubMed] [Google Scholar]
- Sattler R, Charlton MP, Hafner M, Tymianski M (1998). Distinct influx pathways, not calcium load, determine neuronal vulnerability to calcium neurotoxicity. J Neurochem 71:2349–2364. [DOI] [PubMed] [Google Scholar]
- Shi SH, Hayashi Y, Petralia RS, Zaman SH, Wenthold RJ, Svoboda K, Malinow R (1999). Rapid spine delivery and redistribution of AMPA receptors after synaptic NMDA receptor activation. Science 284:1811–1816. [DOI] [PubMed] [Google Scholar]
- Shi SH, Hayashi Y, Esteban JA, Malinow R (2001). Subunit-specific rules governing AMPA receptor trafficking to synapses in hippocampal pyramidal neurons. Cell 105:331–343. [DOI] [PubMed] [Google Scholar]
- Smith MA, Ellis-Davies GC, Magee JC (2003). Mechanism of the distance-dependent scaling of Schaffer collateral synapses in rat CA1 pyramidal neurons. J Physiol (Lond) 548:245–258. [DOI] [PMC free article] [PubMed] [Google Scholar]
- Song I, Kamboj S, Xia J, Dong H, Liao D, Huganir RL (1998). Interaction of the N-ethylmaleimide-sensitive factor with AMPA receptors. Neuron 21:393–400. [DOI] [PubMed] [Google Scholar]
- Steinberg SF (2001). PI3King the L-type calcium channel activation mechanism. Circ Res 89:641–644. [PubMed] [Google Scholar]
- Stoppini L, Buchs PA, Muller D (1991). A simple method for organotypic cultures of nervous tissue. J Neurosci Methods 37:173–182. [DOI] [PubMed] [Google Scholar]
- Terashima A, Cotton L, Dev KK, Meyer G, Zaman S, Duprat F, Henley JM, Collingridge GL, Isaac JT (2004). Regulation of synaptic strength and AMPA receptor subunit composition by PICK1. J Neurosci 24:5381–5390. [DOI] [PMC free article] [PubMed] [Google Scholar]
- Tomita S, Adesnik H, Sekiguchi M, Zhang W, Wada K, Howe JR, Nicoll RA, Bredt DS (2005). Stargazin modulates AMPA receptor gating and trafficking by distinct domains. Nature 435:1052–1058. [DOI] [PubMed] [Google Scholar]
- Tymianski M, Charlton MP, Carlen PL, Tator CH (1993). Source specificity of early calcium neurotoxicity in cultured embryonic spinal neurons. J Neurosci 13:2085–2104. [DOI] [PMC free article] [PubMed] [Google Scholar]
- Viard P, Butcher AJ, Halet G, Davies A, Nurnberg B, Heblich F, Dolphin AC (2004). PI3K promotes voltage-dependent calcium channel trafficking to the plasma membrane. Nat Neurosci 7:939–946. [DOI] [PubMed] [Google Scholar]
- Vlahos CJ, Matter WF, Hui KY, Brown RF (1994). A specific inhibitor of phosphatidylinositol 3 kinase, 2-(4-morpholinyl)-8-phenyl-4H-1-benzopyran-4-one (LY294002). J Biol Chem 269:5241–5248. [PubMed] [Google Scholar]
- Wenthold RJ, Petralia RS, Blahos J II, Niedzielski AS (1996). Evidence for multiple AMPA receptor complexes in hippocampal CA1/CA2 neurons. J Neurosci 16:1982–1989. [DOI] [PMC free article] [PubMed] [Google Scholar]
- Wyllie DJ, Nicoll RA (1994). A role for protein kinases and phosphatases in the Ca2+-induced enhancement of hippocampal AMPA receptor-mediated synaptic responses. Neuron 13:635–643. [DOI] [PubMed] [Google Scholar]
- Wyllie DJ, Manabe T, Nicoll RA (1994). A rise in postsynaptic Ca2+ potentiates miniature excitatory postsynaptic currents and AMPA responses in hippocampal neurons. Neuron 12:127–138. [DOI] [PubMed] [Google Scholar]