

Abstract
We used the combination of functional magnetic resonance imaging and event-related potentials to decompose the processing stages (mental chronometry) of working memory retrieval. Our results reveal an early transient activation of inferotemporal cortex, which was accompanied by the onset of a sustained activation of posterior parietal cortex. We furthermore observed late transient responses in ventrolateral prefrontal cortex and late sustained activity in medial frontal and premotor areas. We propose that these neural signatures reflect the cognitive stages of task processing, perceptual evaluation (inferotemporal cortex), storage buffer operations (posterior parietal cortex), active retrieval (ventrolateral prefrontal cortex), and action selection (medial frontal and premotor cortex). This is also supported by their differential temporal contribution to specific subcomponents of the P300 cognitive potential.
Keywords: working memory, retrieval, EEG, fMRI, source analysis, P300
Introduction
Retrieval from working memory (WM), the identification and correct recognition of stored objects, is a core cognitive activity at the interface of perception and action. WM retrieval comprises several functional subprocesses including stimulus evaluation, memory search, and decision and response organization. Functional magnetic resonance imaging (fMRI) has made important contributions to the localization of their neural correlates. Activity in posterior brain areas has been associated with stimulus encoding (Munk et al., 2002) and evaluation (Druzgal and D'Esposito, 2001), whereas the ventrolateral prefrontal cortex (VLPFC) seems to control active memory search (Petrides, 2002) of visual representations stored in the posterior parietal cortex (PPC) (Curtis and D'Esposito, 2003; Todd and Marois, 2004). Finally, selection of action sets and guiding decisions has been suggested to rely on medial frontal structures (Rushworth et al., 2004).
Yet, the temporal resolution of fMRI limits the differentiation of the finer temporal structure of these processing stages. The time course of the retrieval process has been the topic of a number of event-related potential (ERP) studies that identified a central role for the P3b subcomponent of the P300 wave (Brookhuis et al., 1981; Wijers et al., 1989; Gevins et al., 1997; McEvoy et al., 1998). However, these studies lacked the spatial information necessary to identify the cortical generators of cognitive potentials. The integration of ERP and fMRI data in the framework of fMRI-constrained source analysis (Scherg and Berg, 1996; Dale and Halgren, 2001) can overcome the inherent limitations of both methods, allowing us to decompose the processing stages of a classical cognitive task (“mental chronometry”) (Posner, 1978).
In the present study, we assessed the mental chronometry of WM retrieval by elucidating the activation sequence of brain areas and integrating these findings with established cognitive models. We followed the trace of neural activation across occipitotemporal, parietal, and frontal cortical areas in “real time.” In addition, our study provided a fine temporal decomposition of sources contributing to the generation of the P3b, which is a prominent ERP signature of WM processes.
Materials and Methods
Subjects
Eighteen healthy participants (nine females and nine males; mean age, 27.3 years; SD, 4.3 years; age range, 22–40 years) were recruited from an academic environment. No subject had any history of neurological or psychiatric disorders, and all gave informed consent to participate in the study. Subjects had normal or corrected to normal vision. The study was approved by the local ethics committee.
Study design (stimuli and procedure)
The task was a visual delayed discrimination task (Fig. 1) with nonnatural objects [blurred outlined random tetris shapes (BORTS)] serving as visual stimuli (Linden et al., 2003). A total sample of 200 BORTS was used, and thus no sample stimulus was presented twice during the experiment to reduce opportunities for verbal coding. Participants were required to memorize either one (load 1) or three (load 3) consecutively presented sample objects (encoding phase). After a delay period of 7.4 s (delay phase), a test object was presented that matched one of the previously encoded objects in 50% of the cases, and participants had to indicate match/nonmatch with a left- or right-hand button press (retrieval phase). The stimulus presentation time was 600 ms, and the interstimulus interval was 400 ms. The intertrial interval (fixation phase) lasted 7.4 s during the EEG and 9.4 s during the fMRI session. The two load conditions were presented in randomized order. An experimental block consisted of 40 trials (20 trials in each condition) and lasted ∼14 min (fMRI) and 12 min (EEG). Subjects were asked to fixate the cross in the center of the screen throughout the experiment. Each measurement session was preceded by a short training session.
Figure 1.

The working memory paradigm. Either one (load 1) or three (load 3) stimuli were presented for 600 ms each, with 400 ms fixation intervals. This was followed by a delay period of 7400 ms, after which the test stimulus was presented for 600 ms. Participants indicated by button press whether the test matched one of the sample stimuli, which was the case on 50% of trials. The test stimulus was followed by an intertrial interval (ITI) of 7400 ms (EEG session) or 9400 ms (fMRI session).
The order of the ERP and fMRI measurements was counterbalanced across subjects. The EEG measurement consisted of four experimental blocks, with overall 80 trials for each load condition. Stimuli were presented on a computer screen (video graphics array, 640 × 480). During the fMRI, two experimental blocks were presented, resulting in 40 trials per condition, overall. The visual stimuli were delivered to a high luminance liquid crystal display projector and were back-projected onto a frosted screen and viewed by the subjects through a mirror.
EEG recording and analysis
Electroencephalographic activity was recorded from 63 scalp sites using the BrainAmp amplifier (Brain Products, Munich, Germany) and Brain-cap electrode cap (Falk Minow Services, Munich, Germany) (Bledowski et al., 2004b). All channels were referenced during recording to an additional reference electrode (FCz), with a forehead ground and impedances of < 5 kΩ. An additional electrode was placed on the infraorbital ridge of the right eye to record the vertical electrooculogram (EOG). No filter was used during recording. The EEG and EOG were digitized with a sampling rate of 500 Hz. A spatial digitizer (Zebris Medical GmbH, Tuebingen, Germany) was used to record the individual spherical coordinates of each electrode and of three fiducial landmarks (the left and right preauricular points and the nasion).
EEG data were analyzed using BESA software (MEGIS Software GmbH, Gräfelfing, Germany). Eyeblink artifacts were identified with a template-based method (Ille et al., 2002). Using the BESA artifact scan tool, all remaining epochs exceeding ±90 μV in any channel were excluded from further analysis. On average, 94.2% of all epochs were retained after this artifact rejection. The ERPs to the test object in correct trials were calculated separately for the load 1 and load 3 retrieval in a 1200 ms time epoch (200 ms before and 1000 ms after stimulus). To create a grand averaged data set over subject, the individual ERP waves (63 electrodes) were interpolated to a standardized 81 electrode configuration using spherical spline interpolation. Before the ERP analysis, the data were transformed to an average reference montage and filtered (0.03–15 Hz, zero phase).
For the ERP analysis, individual eyeblink artifacts were corrected using the adaptive artifact correction method (Ille et al., 2002). For statistical analysis, four ERP components of interest were defined. The components were defined as the largest positive or negative deflection within a predefined time window and labeled according to their temporal occurrence within the ERP response averaged across subjects and conditions (see Fig. 2). For each load condition, the individual peak amplitude and latency of the N174 (100–300 ms) at PO7/PO8, P308 (100–350 ms) at FCz, P366 (250–450 ms) and P585 (450–850 ms) at Pz, and N604 (450–900 ms) at F9/F10 electrodes were determined and assessed with repeated-measure t tests (load 1 vs load 3). Additional spline interpolated topographical maps of scalp voltage were calculated at the respective peak latencies of the ERP components.
Figure 2.

ERP responses in the load 1 and load 3 condition. A, Grand average ERP waveforms combined for both conditions (middle) and the corresponding spline-interpolated topographical maps of scalp voltage calculated at the latencies indicated by the yellow lines. B, Separate waveforms for load 1 (blue) and load 3 (red) of electrodes showing prominent ERP components.
fMRI data recording and analysis
MRI data were acquired with a 1.5 T Magnetom Vision MR tomograph (Siemens Medical Systems, Erlangen, Germany) equipped with a standard head coil. For the functional imaging, we used a gradient echo planar imaging sequence [volume, 16 axial slices of the whole brain parallel to a plane through the anterior and posterior commissure; repetition time/echo time (TR/TE), 2000 ms/60 ms; flip angle, 90°; field of view, 230 × 230 mm2; voxel size, 3.59 × 3.59 × 5.00 mm3]. The event-related functional time series consisted of 396 volumes. Every subject underwent two functional imaging experiments. Subjects' responses were registered by a fiber-optic answer box (Current Designs, Philadelphia, PA). A high-resolution structural scan (voxel size, 1.00 × 1.00 × 1.00 mm3) was collected for each subject in the same session using a T1-weighted anatomical T1-FLASH (fast low angle shot) sequence.
fMRI data were analyzed and visualized using the BrainVoyager 2000, version 4.9 software package (Brain Innovation, Maastricht, the Netherlands). Data preprocessing comprised temporal slice scan time correction, Talairach transformation, three-dimensional (3-D) motion correction, and spatial (8 mm) and temporal (∼0.006 Hz) smoothing (Bledowski et al., 2004a). A multisubject statistical analysis was performed by multiple linear regression of the blood oxygen level-dependent (BOLD)–response time course in each voxel. The general linear model of the experiment was computed of 36 (18 subjects × 2 runs) z-normalized volume time courses (396 volumes). For the design matrix, four time points were defined per load condition, representing the different periods of the experiment (encoding, delay, retrieval, and fixation). The corresponding regressors were obtained by convolution of an ideal box-car response with a canonical hemodynamic response function (Friston et al., 1998). All error trials were collapsed on a separate regressor.
Random-effect analyses were performed on the group data (n = 18) to allow for a generalization of the statistical inferences to the population level. Multisubject statistical maps for the load 1 and load 3 retrieval against fixation phase were thresholded at p < 0.05 (Bonferroni's corrected). An additional analysis concerning the load 3 versus load 1 retrieval contrast was thresholded at p < 0.0001 (uncorrected). Statistical results were visualized as 3-D statistical maps on a surface reconstruction of the MNI template brain, courtesy of the Montreal Neurological Institute.
Source analysis
fMRI-guided discrete multiple source analysis was performed using the BrainVoyager/BESA software interface (Bledowski et al., 2004b; Vanni et al., 2004). In this approach, a discrete multiple source model is generated with source locations determined by the task-related fMRI clusters. This fMRI-derived source model was then applied to the EEG to obtain the source waveforms (i.e., the time course of the activities of the modeled brain regions) (Scherg and Von Cramon, 1985). Source waveforms were computed using a four-shell spherical head model and a regularization constant of 1% for the inverse operator. To match the EEG and fMRI coordinate systems, the coordinates of the standard 81 electrode montage and three fiducial landmarks (left and right preauricular points and nasion) were fitted to corresponding landmarks identified on the standard MNI template head surface.
Regional sources (RSs) were placed in foci of the maps of fMRI activation for the conditions load 1 and load 3 compared with fixation. A regional source is a construct of three equivalent current dipoles with the same location but mutually orthogonal orientations (Scherg and Von Cramon, 1986; Scherg and Berg, 1996). Thus, regional sources can reconstruct the local neuronal current flow in arbitrary directions in the vicinity of the modeled brain region. The reconstructed source activities are rather insensitive to small differences between the individual anatomical location and the modeled location of the active brain region (Scherg and Picton, 1991; Scherg and Berg, 1996). Therefore, stable source waveforms could be obtained by the described seeding technique despite individual differences in anatomy.
Selection of source locations. The fMRI activity pattern indicates 44 possible source localizations (Table 1). “Cross talk” between sources poses a limit on the maximum number of sources in a discrete multiple source model. As a result of regularization effects, each source waveform reflects not only activity generated at the site of the source. Rather, a certain fraction of the variance in a source waveform is caused by activity generated at the location of all other sources (Vanni et al., 2004). This undesired effect of interaction between sources or cross talk becomes larger as the total number of sources increases and as their distance decreases. Therefore, in the current study, a minimum distance between sources of 2.5 cm was maintained by pooling adjacent fMRI activation clusters into one RS. Table 1 summarizes the clusters of fMRI activation as represented by the RSs. The RS coordinates were determined by averaging Talairach coordinates obtained from pooled fMRI activities. The distance between an fMRI activation cluster and its corresponding RS was kept under 2 cm. The averaging of the coordinates obtained from adjacent fMRI activation clusters is justified by the integrative nature of RSs in a multiple discrete source model, because source waveforms are not much affected by errors in the equivalent center location of up to 2 cm, as long as the distances between the different sources are larger (Scherg and Berg, 1991).
Table 1.
Brain regions showing significant fMRI activity during the retrieval phase in the working memory task and the resulting regional sources of the ERP provided by the seeding strategy
|
Brain region |
(x, y, z) |
Regional source |
(x, y, z) |
|---|---|---|---|
| Activity during working memory retrieval | |||
| L inferior occipital gyrus | (-37, -78, -10) | L inferior temporal cortex | (-40, -65, -10) |
| L inferior temporal gyrus | (-46, -63, -7) | ||
| L fusiform gyrus | (-38, -55, -12) | ||
| R inferior occipital gyrus | (39, -76, -5) | R inferior temporal cortex | (40, -61, -6) |
| R inferior temporal gyrus | (52, -60, -6) | ||
| R fusiform gyrus | (39, -57, -11) | ||
| R parahippocampal gyrus | (29, -50, -3) | ||
| L inferior parietal lobe | (-49, -35, 48) | L temporoparietal junction | (-53, -32, 35) |
| L inferior parietal lobe | (-56, -28, 39) | ||
| L superior temporal gyrus | (-54, -32, 19) | ||
| R inferior parietal lobe | (45, -37, 32) | R temporoparietal junction | (51, -36, 25) |
| R inferior parietal lobe | (54, -31, 24) | ||
| R superior temporal gyrus | (55, -40, 20) | ||
| L inferior parietal sulcus | (-25, -64, 40) | L posterior parietal cortex | (-27, -61, 41) |
| L inferior parietal sulcus | (-30, -50, 38) | ||
| L superior parietal lobe | (-31, -61, 47) | ||
| L parieto-occipital sulcus | (-20, -70, 38) | ||
| R inferior parietal sulcus | (29, -53, 37) | R posterior parietal cortex | (26, -61, 39) |
| R superior parietal lobe | (33, -61, 49) | ||
| R parieto-occipital sulcus | (15, -70, 31) | ||
| L insula | (-30, 14, 11) | L ventrolateral prefrontal cortex | (-32, 11, 10) |
| L insula | (-34, -1, 10) | ||
| L inferior frontal gyrus | (-32, 20, 10) | ||
| R insula | (37, 6, 13) | R ventrolateral prefrontal cortex | (34, 10, 12) |
| R insula | (30, 7, 10) | ||
| R inferior frontal gyrus | (35, 16, 12) | ||
| L middle frontal gyrus | (-36, 38, 31) | L dorsolateral prefrontal cortex | (-35, 32, 29) |
| L inferior frontal sulcus | (-33, 25, 27) | ||
| R superior frontal sulcus | (27, 33, 32) | R dorsolateral prefrontal cortex | (39, 24, 32) |
| R middle frontal gyrus | (37, 35, 33) | ||
| R middle frontal gyrus | (48, 15, 36) | ||
| R inferior frontal sulcus | (43, 14, 27) | ||
| L precentral sulcus | (-44, -4, 39) | L precentral sulcus | (-48, -2, 36) |
| L precentral gyrus | (-52, 0, 33) | ||
| L cingulate gyrus | (-6, -4, 40) | Medial frontal cortex | (0, -2, 40) |
| R cingulate gyrus | (7, 9, 42) | ||
| R cingulate gyrus | (9, -12, 39) | ||
| L precentral gyrus | (-36, -18, 57) | L motor cortex | (-36, -24, 55) |
| L central sulcus | (-27, -26, 53) | ||
| L postcentral gyrus | (-45, -27, 54) | ||
| R precentral gyrus | (33, -15, 56) | R motor cortex | (30, -30, 55) |
| R central sulcus | (31, -29, 52) | ||
| R postcentral gyrus | (32, -31, 61) | ||
| R postcentral sulcus | (23, -46, 50) | ||
| Contrast activity (load 3 vs load 1) during working memory retrieval | |||
| L inferior frontal gyrus | (-30, 21, 8) | ||
| R inferior frontal gyrus | (36, 20, 9) | ||
| R presupplementary motor area |
(4, 17, 46) |
|
|
The table shows the Talairach coordinates [x, y, z (in millimeters)] of significant fMRI activity clusters and of the resulting RS. L, Left; R, right.
Cross-talk analysis. For given source parameters and electrode configuration, the amount of expected cross talk between sources can be calculated. Here, we defined cross talk as the expected fraction of the variance in a source waveform that is caused by activity in all other sources. In our source model, the mean expected cross talk was 13.1% for the 16 dipoles under analysis (12 RSs with one predominant dipole and two RSs with two predominant dipoles; see Results). When only one additional pair of regional probe sources was added to the model and seeded into the fMRI activity regions at a distance of ∼2 cm from the present RS (violating the criterion for minimum distance between sources of 2.5 cm used in our model), the mean cross talk increased substantially (by an additional 5.1% on average). The cross-talk analysis thus supported the choice of source locations and restriction of number of sources described in the preceding paragraph.
Scalp projections and source difference waveforms. For source analysis, eyeblink artifacts were corrected by adding a spatial component to the source model, which represented the averaged blink topography across subjects. The orientation of the first dipole of each regional source was set to match the direction of the maximum dipole moment of the averaged load 1 and load 3 ERP waves during the 1200 ms epoch. The source activities were projected back to scalp voltage, and topographical maps were calculated at the respective latency of the peak source intensities for the averaged load 1 and load 3 retrieval conditions (see Fig. 4).
Figure 4.
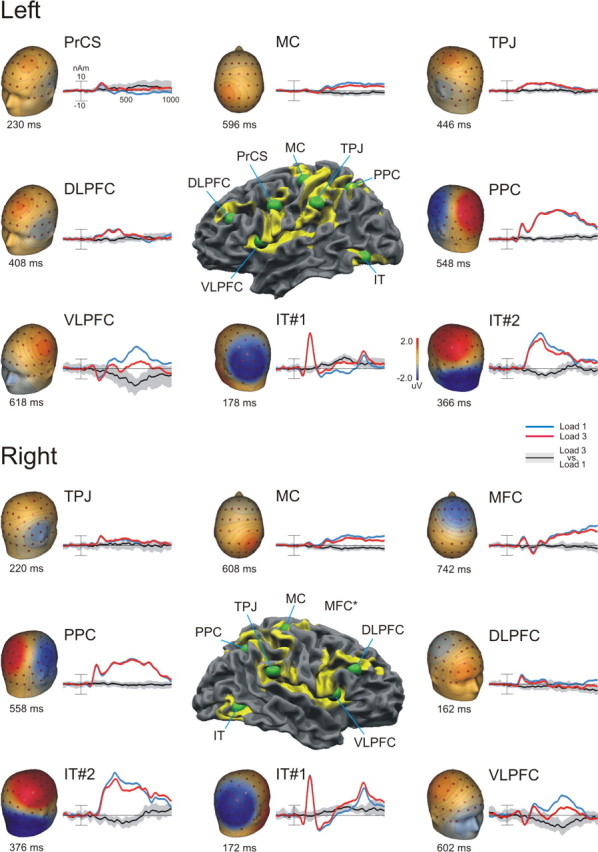
Time courses of the regional source activity. Positions of the regional sources on the fMRI activation maps (middle) surrounded by the source activities and their corresponding topographical voltage maps are shown. Source time courses are shown in blue for load 1 and in red for load 3. The black line represents the difference wave form, with the area shaded in gray denoting the 95% confidence interval as determined by the bootstrap BCa method (see Materials and Methods).
To compare the brain electric activity between the load 1 and load 3 retrieval conditions, the source model obtained from the grand average load 1 and load 3 ERP waves was applied to the individual difference ERP data (see Fig. 4). Individual difference ERP waves were calculated by subtracting the ERP of the load 3 from that of the load 1 condition. One spatial component representing the individual blink topography was included in the source model to correct the individual source waves. To test for significant differences between the load conditions, 95% confidence intervals for each difference source waveforms were determined using the bootstrap bias-corrected and adjusted (BCa) method (Efron and Tibshirani, 1993). The difference between load 3 and load 1 conditions was considered significant if the confidence interval of the difference source wave did not include zero.
Results
Behavioral measurements
The behavioral results confirm that the WM load manipulation changed the task difficulty (repeated measurement ANOVA with load and session as factors). In particular, for the factor load, we observed a significant (F(1,17) = 94.9; p < 0.001; ηp2 = 0.85) decrease in correct responses from load 1 (EEG session, 93.9%; fMRI session, 93.4%) to load 3 (EEG, 77.4%; fMRI, 80.5%), and response times were significantly (F(1,17) = 64.6; p < 0.001; ηp2 = 0.79) slower by on average 204.8 ms (load 3: EEG, 1031.3 ms; fMRI, 1071 ms; load 1: EEG, 816.1 ms; fMRI, 876.6 ms). No significant main effect for session and no interaction with the load manipulation were revealed for either accuracy or reaction time (p > 0.10). These results indicate that there was no difference in the performance between the EEG and fMRI sessions.
Event-related potentials
Several components were differentiated on the basis of their peak latencies and scalp topography (Fig. 2). For both load conditions, the test objects elicited a negative deflection (N174) bilaterally over the parieto-occipital electrodes (maximum at P07 and P08). The N174 was followed by a frontal P308 with maximum peak amplitude at the FCz electrode. The strongest and most broadly distributed ERP response was observed over parietal electrode sites corresponding to the P3b complex (Squires et al., 1975). However, our P3b response differed from that elicited by a deviant target event in an oddball paradigm (Bledowski et al., 2004a) in that it was divided into two peaks at ∼366 and 585 ms (P366 and P585). Repeated measures t tests showed a significant decrease in peak amplitude (t = 3.5; p < 0.01; average peak amplitude at Pz of 9.2 vs 7.9 μV in load 1 and load 3) and an increase in peak latency (t =–2.8; p < 0.05; average latency of 568 vs 609 ms in load 1 and load 3) with higher memory load only for the second peak of the P3b (P585). This load-dependent difference was accompanied by significant amplitude differences in the bilateral negative deflections at lateral frontal sites (t = –7.0; p < 0.01; peak amplitude at F9/F10 of –5.3 vs –3.6 μV in load 1 and load 3, respectively) with a similar peak latency (N608 ms). Both findings, the two-peak structure of the P3b and its amplitude reduction with memory load increase, are in accordance with a large body of ERP studies using delayed discrimination tasks with long reaction times (Verleger, 1997; Kok, 2001).
Functional magnetic resonance imaging
Multisubject random-effects statistical maps for the contrast between the presentation of the test object in both load conditions and the fixation phase in the intertrial interval showed significant activation mainly in the superior and inferior parietal and temporal lobe, inferior occipital cortex, prefrontal and frontal cortex, and the insula (Fig. 3A, Table 1). This activity pattern corresponds well with the findings from other functional imaging studies of visual WM retrieval (Pessoa et al., 2002; Linden et al., 2003; Ranganath et al., 2004) or visual target detection (Linden et al., 1999; Downar et al., 2001; Ardekani et al., 2002; Bledowski et al., 2004a). We found significant load-dependent differences only in bilateral inferior frontal gyrus and right presupplementary motor area (pSMA), which also conforms to previous fMRI studies (Cairo et al., 2004; Landau et al., 2004).
Figure 3.

fMRI activation maps on a surface representation of a template brain. A, Combined map for the retrieval predictor for load 1 and load 3 conditions (yellow) with the areas showing a load effect (significantly higher activation for load 3 than load 1) superimposed in red (overlapping area; orange). B, Evoked hemodynamic responses for load 1 (blue) and load 3 (red) conditions over the entire trial period. The presentation of the test stimulus is indicated in green on the time bar. Because of the hemodynamic delay, the corresponding peak activation would be expected two to three scans (4–6 s) later. Significant differences between load conditions during retrieval phase are indicated by a green asterisk. IFG, Inferior frontal gyrus; pre-SMA, presupplementary motor area; CS, central sulcus.
Source analysis
The fMRI-based ERP source analysis yielded 14 regional sources bilaterally in the PPC, temporoparietal junction (TPJ), dorsolateral prefrontal cortex (DLPFC), VLPFC, inferior temporal cortex (IT), motor cortex (MC), left precentral sulcus (PrCS), and medial frontal cortex (MFC), guided by the principal clusters of fMRI activity. Table 1 lists the cortical areas and their corresponding RSs.
The fMRI-constrained source model explained on average 99.8% of the scalp ERP potential variance in the load 1 and load 3 retrieval during the 1000 ms poststimulus epoch. Figure 4 depicts the grand average source activity waveforms of each RS (first dipole) for both load conditions and the resulting topographical scalp voltage maps at the latency of RS peak activity. Because the second dipole in the IT regional source also elicited a substantial scalp activity similar to the first, both dipoles of the IT sources are shown. The presentation of the test stimulus resulted in two early and transient waves in bilateral IT. The first dipole revealed a negative deflection at ∼174 ms. Analysis of the scalp projection indicated that these sources contributed to a negative scalp ERP component at bilateral parieto-occipital electrodes sites. Additionally, the same source waves showed a second peak at 774 ms (i.e., exactly 174 ms after offset of the test stimulus). The second dipole of the IT sources showed a pronounced positive scalp deflection peaking at ∼370 ms at the centroposterior electrode sites and contributing to the first peak of the P3b. The bilateral sources in the TPJ generated positive scalp topographies similar to the second IT source activity; however, they differed in their time course. Whereas the left TPJ source peaked also at ∼450 ms, the right TPJ showed a narrow activity with an early peak at 220 ms.
Compared with the rather transient activities in IT and TPJ, the bilateral PPC showed a more sustained response that lasted from 200 to 800 ms. This pronounced source activity contributed mainly to the parietal scalp response at the midline posterior electrode sites (P3b complex). The later part of the PPC response overlapped in time with the VLPFC, MFC, and MC source activities. The VLPFC sources showed bilateral late transient activities contributing to both a centroparietal positive and frontolateral negative scalp deflection peaking at ∼610 ms. In contrast, the MFC and bilateral MC sources showed more sustained and generally less pronounced activities. We observed additional source activities in the lateral parts of the frontal cortex (bilateral DLPFC and left PrCS). However, these sources produced narrow positive deflections peaking between 160–430 ms that contributed little to the stimulus-locked scalp ERP signal.
The bootstrap statistic revealed that the amplitude difference in the second peak of the P3b complex (P585) was mainly generated by stronger VLPFC source activities in the load 1 condition. We also observed (less pronounced) load-dependent differences in both dipoles of the IT sources. Interestingly, the first dipole of the IT sources (negative scalp projection) exhibited higher activity in the load 3 condition, whereas the second dipole behaved similarly to the VLPFC sources yielding stronger activity in the load 1 condition.
To test for specificity of the spatiotemporal model of brain activation obtained for WM retrieval, we applied the same source model to the ERP data calculated to the first stimulus in the encoding phase. In the fMRI data, the encoding of the stimulus also revealed an activity pattern that included frontal, parietal, and temporal areas (Fig. 3B), which justified a comparison of the source activities in these two different phases of the working memory task. Whereas the early ERP components (N174, P308, and P366) during encoding were similar to those observed for retrieval, ERP components differed strongly in the second peak of the P3b complex (P585) (t =–7.2; p < 0.05; average peak amplitude at Pz of 9.3 vs 5.8 μV in retrieval and encoding) and in the N608 component (t = 4.7; p < 0.05; average peak amplitude at F9 of –5.3 vs –3.2 μV in retrieval and encoding), in which the encoding stimulus produced weaker responses. The bootstrap statistic computed for the difference source waves (retrieval minus encoding) showed that the differences in the late components of the ERP response were generated by significantly higher activity in the retrieval compared with the encoding source activity in the later part (at ∼450–800 ms) of the source time courses bilaterally in the IT (second dipole), PPC, and VLPFC. In contrast, the first IT dipole showed increased activity for the encoding compared with the retrieval phase at ∼250–350 ms and also briefly before and after the offset of the stimulus presentation (Fig. 5).
Figure 5.

Comparison of ERP responses and source activities between encoding and retrieval phase. ERP waveforms (A) of four selected electrodes and source activities (B) for encoding (green) and retrieval (black) averaged across subjects and load conditions are shown. The selected sources showed significant activity differences in the retrieval compared with the encoding source activity in the later part (at ∼450–800 ms) of the source time courses. The dark gray line [diff (95%)] represents the difference waves (retrieval minus encoding), with the area shaded in bright gray denoting the 95% confidence interval as determined by the bootstrap BCa method. nAm, Nanoamperes.
Discussion
We present a mental chronometry of working memory retrieval combining data from ERP and fMRI measurements of the same participants. Our results reveal a sequence of stimulus-locked transient and sustained brain activities during the retrieval phase of a visual working memory experiment. The retrieval-related activity started with two early and transient waves in bilateral IT, corresponding to the N1 scalp ERP component (at ∼170 ms) (Ritter et al., 1982) and an early component (at ∼370 ms) of the scalp P3b complex. Whereas the N1 has been described as a first index of a visual pattern discrimination process (Vogel and Luck, 2000), the P3b is supposed to denote a subsequent stimulus evaluation [i.e., the decision whether an incoming object matches (target) or does not match (nontarget) an internal representation of a specific object] (Kok, 2001). This interpretation is supported by the functional imaging literature that consistently reported activity in occipitotemporal areas to play a key role in both the perception and the evaluation of visual objects (Bar et al., 2001; Druzgal and D'Esposito, 2001; Grill-Spector, 2003). The separation of the two IT activation peaks afforded by the source analysis of our data supports a hierarchical process of object recognition, which might involve the creation of a perceptual object description and a subsequent identification of the object category. The transient IT responses were accompanied by less-pronounced activities in the PrCS, TPJ, and DLPFC. This finding confirms our previous source modeling work, which indicated a weak contribution of the DLPFC and PrCS to the stimulus-locked ERP response during target detection (Bledowski et al., 2004b).
The pronounced sustained deflection observed in the PPC suggests a crucial role for this region throughout the entire retrieval process. Whereas the earlier part of the sustained PPC activity overlaps with early IT activity, its later part is simultaneous to the VLPFC responses. We interpret this finding as indicating that the sustained PPC activity reflects continuous operations on the storage buffer necessary for the stimulus evaluation and memory search process. This storage role of the PPC is also supported by a load-dependent modulation of the BOLD signal in the delay phase [random effect analysis; p < 0.001 (uncorrected)] (Fig. 3B). The late response of the VLPFC source integrates activity from the VLPFC and anterior insular cortex. Interestingly, it has been shown in fMRI experiments that the VLPFC is active when an automatic recollection of information is not sufficient (Kostopoulos and Petrides, 2003). Considering the long reaction times and corresponding late onset of VLPFC source activity, we suggest that this area plays a role in the controlled memory search that takes place when a stimulus evaluation in the posterior areas is not sufficient.
Late sustained activity was observed in the MFC and MC sources. The MFC source models activity from the medial frontal cortex including anterior cingulate cortex and cingulate and presupplementary motor areas. These areas have been related to the organization and preparation of motor responses, particularly the selection of superordinate sets of action-selection rules (Rushworth et al., 2004). The MC source most likely reflected activity of primary motor cortex during response preparation and execution.
Mental chronometry models of the WM retrieval differ in their assumptions as to whether the assumed subprocesses occur serially or in parallel and whether they involve discrete or continuous transformation of information (Meyer et al., 1988). The presented source time courses, particularly the temporal overlap of prefrontal and parietal activation, suggest parallel rather than strictly serial occurrence of different retrieval subprocesses. However, the nature of the transformations involved cannot be addressed with the present approach, which relies on the averaging of neural activity across multiple trials.
Generators and dynamics of the P300
The fMRI-constrained source analysis also provided information about the generators of the P3b and the dynamic changes in their contribution to scalp activity. Because of its prominent role in studies of cognition in healthy individuals and patients (Polich and Herbst, 2000; Kok, 2001), clarity about the number of subcomponents underlying the P3b and their neural generators is of considerable interest. The present source analysis results confirm our previous findings from oddball studies that the P3b is generated by sources in IT, PPC, and TPJ (Bledowski et al., 2004b). Moreover, using the delayed discrimination task with a more complex structure (resulting in longer reaction times), we were able to separate the time courses of the P3b sources, which in simple oddball tasks tend to overlap in time. Whereas the IT, left TPJ, and PPC generate an early subcomponent (P366), activity of the PPC and VLPFC source contributed mainly to the second subcomponent (P585) of the P3b complex. Our results support the idea that the P3b is not a unitary phenomenon but the result of the activity of generators that are widely distributed in space and time (Verleger, 1997; Kok, 2001). In the context of visual WM retrieval, the early P3b subcomponent likely reflects stimulus evaluation, whereas the later subcomponent might be more related to memory search operations of the VLPFC accessing the posterior parietal storage buffer. The latter operation is required particularly for complex WM tasks, which cannot be solved by simple familiarity-based stimulus processing. This interpretation is supported by the comparison of the source activities in the encoding against the retrieval phase of the working memory task. The more sustained time course in the PPC, the slower decline in IT and the additional later peak in the VLPFC source activity during retrieval indicated controlled recurrent memory activity.
Memory load effects and ERP/fMRI correspondence
The present ERP and fMRI results replicate previous findings of amplitude reduction of the P3b complex (Kok, 2001) and increase of the BOLD responses in bilateral VLPFC and right pSMA (Cairo et al., 2004) with increasing memory load. Furthermore, the source analysis indicated that generators in the VLPFC and IT were mainly responsible for the load effect as measured on the scalp. Although the correspondence of the sites of the main load effect in fMRI and ERP (in VLPFC) seems encouraging, the opposite directions of the load effects reveal that the relationship between the two modalities is not always straightforward. Although evidence from intracortical recordings suggests that both the EEG and the BOLD signal (Logothetis et al., 2001) reflect synaptic activity from large cell populations, the analysis of ERPs, which is biased for time-locked activity, captures only part of the EEG signal. The event-related fMRI analysis, however, is sensitive to both time-locked and dispersed activity, because of its inherent temporal integration. Thus, the seeding strategy used in this study assesses the potential contribution of fMRI activation clusters to the ERP without implying that each cluster must necessarily be a major generator of an ERP component. An area could therefore be showing a load effect in fMRI but not in the ERP (e.g., MFC in the present study). Diverging effects on BOLD and ERP amplitudes are a common finding in combined fMRI and EEG studies (Foucher et al., 2003; Huettel et al., 2004). Conversely, it is rather unlikely that highly synchronized electrical activity of many cells as required for an ERP will occur without accompanying BOLD fMRI activation, making it a reasonable assumption that the set of clusters identified by fMRI contains the sources of the ERP.
The case of opposite load effects, as in VLPFC, might be explained by the spatial layout of the ERP source (“open” vs “closed”). If the geometry of the cortical folds generates a closed source, with opposing dipole directions interfering with each other, this activity will not be visible on the scalp (but still be reflected in the BOLD signal). With smaller numbers of neurons activated in the lower load condition, the source might still be open, whereas it might close when additional neurons are recruited for the more demanding higher load task. The spatial configuration of our VLPFC cluster, which comprised activity around the anterior part of the Sylvian fissure reaching into the insular cortex, would be particularly prone to such an effect. Alternatively, a reduced ERP in the load 3 conditions could reflect multiple concurrent processes of memory search within the VLPFC. If multiple neural assemblies become active at different offsets, the phase resetting contribution to the ERP (Fell et al., 2004) might be reduced or even cancelled out. A third (complementary) explanation is based on the different effects of activity of inhibitory interneurons on EEG and fMRI activity. Metabolically costly interneuron activity would still be likely to result in an increased fMRI signal but could produce smaller ERP amplitude by a net cancellation of IPSPs and EPSPs on the dendrites of pyramidal neurons.
The validity of the source analysis
Whereas the localization and temporal description of primary visual or somatosensory responses by EEG source analysis using dipole fitting or fMRI-guided dipole seeding corresponds very well with other noninvasive and/or invasive functional recordings (Towle et al., 2003; Vanni et al., 2004), the application of this approach to the strongly overlapping ERP components from higher cognitive processes has some inherent caveats. Our fMRI-constrained source analysis assumed that the source locations are known from fMRI and used this knowledge to compute the source activity. It provides an objective and reproducible method to derive one unambiguous solution for the “inverse problem.” However, it does not prove that the fMRI-based source model is the best reflection of the neural processes occurring during the task phases in question. To validate this approach, a direct comparison of invasive intracranial recordings, fMRI, and high-density EEG scalp recordings on the same subjects performing a working memory task would be necessary. However, because of the multifocal activity pattern in such a task, this approach is difficult to realize, if not impossible, because intracranial recording sites need to be clinically justified. The possible cross talk between source activities might be even more crucial for the test of the validity of our approach. We reduced the cross-talk activity by minimizing the number of overall possible sources and by keeping the spatial distances between them at minimum of 2.5 cm. These procedures resulted in a successful temporospatial decomposition of the scalp ERP data, as indicated by the clearly different source time courses with different peak and trough latencies.
Conclusion
We propose a mental chronometry of the WM retrieval on the basis of an fMRI-constrained source analysis. The analysis of ERP source time courses yielded the precise timing of the neural components in inferior temporal, parietal, and frontal cortex, which was mainly characterized by early and late transient activations in the IT and VLPFC, respectively, and a sustained activation of the PPC and MFC (Fig. 6). The sequence of transient activations is compatible with serial models of WM retrieval, whereas the temporal overlap of prefrontal and parietal activation, which might reflect extensive processing for memory search, supports parallel elements in models of WM retrieval.
Figure 6.
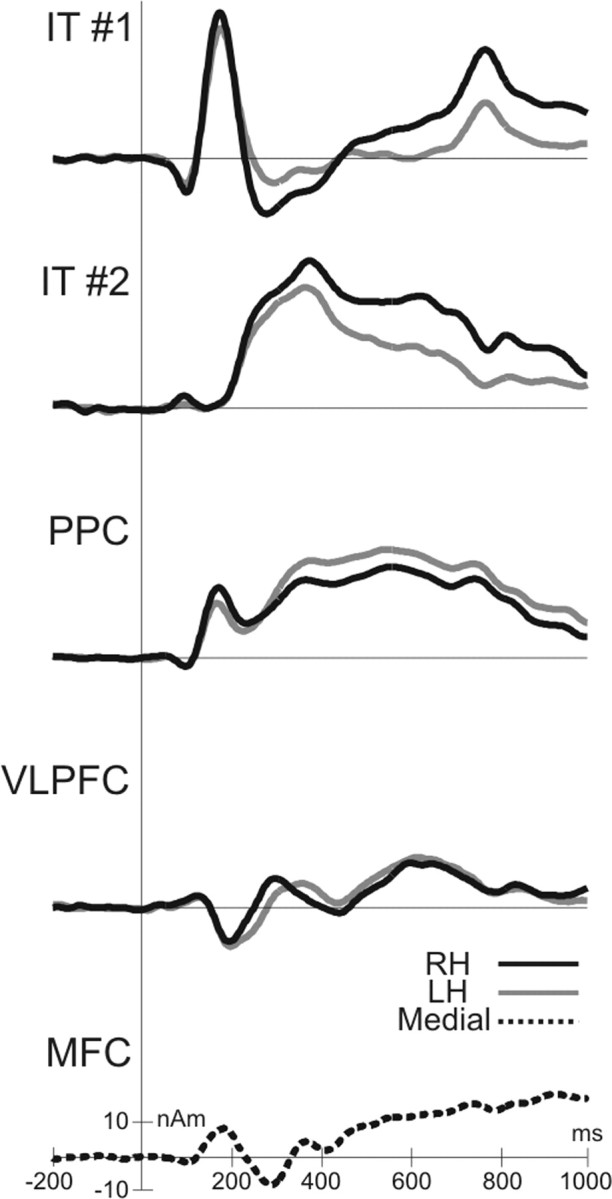
Timing of the retrieval processes. Time courses for prominent source activities [>10 nA (nAm)] averaged across subjects and conditions arranged from top (early response) to bottom (late response). Source time courses are shown in black for the right hemisphere (RH), in gray for the left hemisphere (LH), and dashed for the medial frontal cortex.
Footnotes
This work was supported by Alzheimer Forschungs Initiative and the German Ministry for Education and Research (Bundesministerium für Bildung und Forschung; Brain Imaging Center Frankfurt am Main, DLR 01GO0203). We thank Niko Kriegeskorte for designing the BORTS stimuli, Axel Kohler for advice on statistics, and Ruxandra Sireteanu for constant support.
Correspondence should be addressed to Dr. David Linden, School of Psychology, University of Wales Bangor, Penrallt Road, Bangor LL57 2AS, UK. E-mail: d.linden@bangor.ac.uk.
DOI:10.1523/JNEUROSCI.3542-05.2006
Copyright © 2006 Society for Neuroscience 0270-6474/06/260821-09$15.00/0
References
- Ardekani BA, Choi SJ, Hossein-Zadeh GA, Porjesz B, Tanabe JL, Lim KO, Bilder R, Helpern JA, Begleiter H (2002) Functional magnetic resonance imaging of brain activity in the visual oddball task. Brain Res Cogn Brain Res 14: 347–356. [DOI] [PubMed] [Google Scholar]
- Bar M, Tootell RB, Schacter DL, Greve DN, Fischl B, Mendola JD, Rosen BR, Dale AM (2001) Cortical mechanisms specific to explicit visual object recognition. Neuron 29: 529–535. [DOI] [PubMed] [Google Scholar]
- Bledowski C, Prvulovic D, Goebel R, Zanella FE, Linden DE (2004a) Attentional systems in target and distractor processing: a combined ERP and fMRI study. NeuroImage 22: 530–540. [DOI] [PubMed] [Google Scholar]
- Bledowski C, Prvulovic D, Hoechstetter K, Scherg M, Wibral M, Goebel R, Linden DE (2004b) Localizing P300 generators in visual target and distractor processing: a combined event-related potential and functional magnetic resonance imaging study. J Neurosci 24: 9353–9360. [DOI] [PMC free article] [PubMed] [Google Scholar]
- Brookhuis KA, Mulder G, Mulder LJ, Gloerich AB, van Dellen HJ, van der Meere JJ, Ellermann H (1981) Late positive components and stimulus evaluation time. Biol Psychol 13: 107–123. [DOI] [PubMed] [Google Scholar]
- Cairo TA, Liddle PF, Woodward TS, Ngan ET (2004) The influence of working memory load on phase specific patterns of cortical activity. Brain Res Cogn Brain Res 21: 377–387. [DOI] [PubMed] [Google Scholar]
- Curtis CE, D'Esposito M (2003) Persistent activity in the prefrontal cortex during working memory. Trends Cogn Sci 7: 415–423. [DOI] [PubMed] [Google Scholar]
- Dale AM, Halgren E (2001) Spatiotemporal mapping of brain activity by integration of multiple imaging modalities. Curr Opin Neurobiol 11: 202–208. [DOI] [PubMed] [Google Scholar]
- Downar J, Crawley AP, Mikulis DJ, Davis KD (2001) The effect of task relevance on the cortical response to changes in visual and auditory stimuli: an event-related fMRI study. NeuroImage 14: 1256–1267. [DOI] [PubMed] [Google Scholar]
- Druzgal TJ, D'Esposito M (2001) A neural network reflecting decisions about human faces. Neuron 32: 947–955. [DOI] [PubMed] [Google Scholar]
- Efron B, Tibshirani RJ (1993) An introduction to the bootstrap. New York: Chapman and Hall.
- Fell J, Dietl T, Grunwald T, Kurthen M, Klaver P, Trautner P, Schaller C, Elger CE, Fernandez G (2004) Neural bases of cognitive ERPs: more than phase reset. J Cogn Neurosci 16: 1595–1604. [DOI] [PubMed] [Google Scholar]
- Foucher JR, Otzenberger H, Gounot D (2003) The BOLD response and the gamma oscillations respond differently than evoked potentials: an interleaved EEG-fMRI study. BMC Neurosci 4: 22. [DOI] [PMC free article] [PubMed] [Google Scholar]
- Friston KJ, Fletcher P, Josephs O, Holmes A, Rugg MD, Turner R (1998) Event-related fMRI: characterizing differential responses. NeuroImage 7: 30–40. [DOI] [PubMed] [Google Scholar]
- Gevins A, Smith ME, McEvoy L, Yu D (1997) High-resolution EEG mapping of cortical activation related to working memory: effects of task difficulty, type of processing, and practice. Cereb Cortex 7: 374–385. [DOI] [PubMed] [Google Scholar]
- Grill-Spector K (2003) The neural basis of object perception. Curr Opin Neurobiol 13: 159–166. [DOI] [PubMed] [Google Scholar]
- Huettel SA, McKeown MJ, Song AW, Hart S, Spencer DD, Allison T, McCarthy G (2004) Linking hemodynamic and electrophysiological measures of brain activity: evidence from functional MRI and intracranial field potentials. Cereb Cortex 14: 165–173. [DOI] [PubMed] [Google Scholar]
- Ille N, Berg P, Scherg M (2002) Artifact correction of the ongoing EEG using spatial filters based on artifact and brain signal topographies. J Clin Neurophysiol 19: 113–124. [DOI] [PubMed] [Google Scholar]
- Kok A (2001) On the utility of P3 amplitude as a measure of processing capacity. Psychophysiology 38: 557–577. [DOI] [PubMed] [Google Scholar]
- Kostopoulos P, Petrides M (2003) The mid-ventrolateral prefrontal cortex: insights into its role in memory retrieval. Eur J Neurosci 17: 1489–1497. [DOI] [PubMed] [Google Scholar]
- Landau SM, Schumacher EH, Garavan H, Druzgal TJ, D'Esposito M (2004) A functional MRI study of the influence of practice on component processes of working memory. NeuroImage 22: 211–221. [DOI] [PubMed] [Google Scholar]
- Linden DE, Prvulovic D, Formisano E, Vollinger M, Zanella FE, Goebel R, Dierks T (1999) The functional neuroanatomy of target detection: an fMRI study of visual and auditory oddball tasks. Cereb Cortex 9: 815–823. [DOI] [PubMed] [Google Scholar]
- Linden DE, Bittner RA, Muckli L, Waltz JA, Kriegeskorte N, Goebel R, Singer W, Munk MH (2003) Cortical capacity constraints for visual working memory: dissociation of fMRI load effects in a fronto-parietal network. NeuroImage 20: 1518–1530. [DOI] [PubMed] [Google Scholar]
- Logothetis NK, Pauls J, Augath M, Trinath T, Oeltermann A (2001) Neurophysiological investigation of the basis of the fMRI signal. Nature 412: 150–157. [DOI] [PubMed] [Google Scholar]
- McEvoy LK, Smith ME, Gevins A (1998) Dynamic cortical networks of verbal and spatial working memory: effects of memory load and task practice. Cereb Cortex 8: 563–574. [DOI] [PubMed] [Google Scholar]
- Meyer DE, Osman AM, Irwin DE, Yantis S (1988) Modern mental chronometry. Biol Psychol 26: 3–67. [DOI] [PubMed] [Google Scholar]
- Munk MH, Linden DE, Muckli L, Lanfermann H, Zanella FE, Singer W, Goebel R (2002) Distributed cortical systems in visual short-term memory revealed by event-related functional magnetic resonance imaging. Cereb Cortex 12: 866–876. [DOI] [PubMed] [Google Scholar]
- Pessoa L, Gutierrez E, Bandettini P, Ungerleider L (2002) Neural correlates of visual working memory: fMRI amplitude predicts task performance. Neuron 35: 975–987. [DOI] [PubMed] [Google Scholar]
- Petrides M (2002) The mid-ventrolateral prefrontal cortex and active mnemonic retrieval. Neurobiol Learn Mem 78: 528–538. [DOI] [PubMed] [Google Scholar]
- Polich J, Herbst KL (2000) P300 as a clinical assay: rationale, evaluation, and findings. Int J Psychophysiol 38: 3–19. [DOI] [PubMed] [Google Scholar]
- Posner MI (1978) Chronometric explorations of mind. New York: Oxford UP.
- Ranganath C, Cohen MX, Dam C, D'Esposito M (2004) Inferior temporal, prefrontal, and hippocampal contributions to visual working memory maintenance and associative memory retrieval. J Neurosci 24: 3917–3925. [DOI] [PMC free article] [PubMed] [Google Scholar]
- Ritter W, Simson R, Vaughan Jr HG, Macht M (1982) Manipulation of event-related potential manifestations of information processing stages. Science 218: 909–911. [DOI] [PubMed] [Google Scholar]
- Rushworth MF, Walton ME, Kennerley SW, Bannerman DM (2004) Action sets and decisions in the medial frontal cortex. Trends Cogn Sci 8: 410–417. [DOI] [PubMed] [Google Scholar]
- Scherg M, Berg P (1991) Use of prior knowledge in brain electromagnetic source analysis. Brain Topogr 4: 143–150. [DOI] [PubMed] [Google Scholar]
- Scherg M, Berg P (1996) New concepts of brain source imaging and localization. Electroencephalogr Clin Neurophysiol Suppl 46: 127–137. [PubMed] [Google Scholar]
- Scherg M, Picton TW (1991) Separation and identification of event-related potential components by brain electric source analysis. Electroencephalogr Clin Neurophysiol Suppl 42: 24–37. [PubMed] [Google Scholar]
- Scherg M, Von Cramon D (1985) Two bilateral sources of the late AEP as identified by a spatio-temporal dipole model. Electroencephalogr Clin Neurophysiol 62: 32–44. [DOI] [PubMed] [Google Scholar]
- Scherg M, Von Cramon D (1986) Evoked dipole source potentials of the human auditory cortex. Electroencephalogr Clin Neurophysiol 65: 344–360. [DOI] [PubMed] [Google Scholar]
- Squires NK, Squires KC, Hillyard SA (1975) Two varieties of long-latency positive waves evoked by unpredictable auditory stimuli in man. Electroencephalogr Clin Neurophysiol 38: 387–401. [DOI] [PubMed] [Google Scholar]
- Todd JJ, Marois R (2004) Capacity limit of visual short-term memory in human posterior parietal cortex. Nature 428: 751–754. [DOI] [PubMed] [Google Scholar]
- Towle VL, Khorasani L, Uftring S, Pelizzari C, Erickson RK, Spire JP, Hoffmann K, Chu D, Scherg M (2003) Noninvasive identification of human central sulcus: a comparison of gyral morphology, functional MRI, dipole localization, and direct cortical mapping. NeuroImage 19: 684–697. [DOI] [PubMed] [Google Scholar]
- Vanni S, Warnking J, Dojat M, Delon-Martin C, Bullier J, Segebarth C (2004) Sequence of pattern onset responses in the human visual areas: an fMRI constrained VEP source analysis. NeuroImage 21: 801–817. [DOI] [PubMed] [Google Scholar]
- Verleger R (1997) On the utility of P3 latency as an index of mental chronometry. Psychophysiology 34: 131–156. [DOI] [PubMed] [Google Scholar]
- Vogel EK, Luck SJ (2000) The visual N1 component as an index of a discrimination process. Psychophysiology 37: 190–203. [PubMed] [Google Scholar]
- Wijers AA, Mulder G, Okita T, Mulder LJ (1989) Event-related potentials during memory search and selective attention to letter size and conjunctions of letter size and color. Psychophysiology 26: 529–547. [DOI] [PubMed] [Google Scholar]